


1. Introduction
Lifting surfaces subject to rapid variations of the effective angle of attack beyond their static stall angles are prone to undergo dynamic stall. The phenomenon of dynamic stall is characterised by considerable excursions of the aerodynamic loads on the airfoil due to the formation of large vortical structures emanating from the roll-up of the separated boundary layer. The transient movement of the airfoil, compared with the static case, leads to a delay of boundary layer separation with an associated lift increase followed by the abrupt onset of stall with the formation of the ubiquitous dynamic stall vortex (DSV). The build-up and subsequent downstream movement of the DSV is responsible for a transient lift overshoot followed by the moment stall with a severe nose-down pitching moment typical of dynamic stall.
A better understanding of dynamic stall is relevant for several engineering applications such as helicopter rotor aerodynamics (Ham & Garelick Reference Ham and Garelick1968), turbomachinery, in particular compressors (Tan et al. Reference Tan, Day, Morris and Wadia2010), wind turbines (Tangler Reference Tangler2004) as well as fixed-wing aircraft of different sizes. The unsteady flow dynamics during stall are usually detrimental to efficiency and performance and can even lead to structural resonance and damage, thus reducing the operating range of aeronautical applications (Leishman Reference Leishman2000). Interestingly, in low-Reynolds-number flapping-wing and insect flight, the unsteady aerodynamics of dynamic stall, in particular the DSV, have instead been identified as enablers and have subsequently been used to develop agile small-scale air vehicles (Eldredge & Jones Reference Eldredge and Jones2019). The diverse applications have led to a considerable amount of research devoted to understanding dynamic stall and several reviews have summarised different aspects of the progress in understanding and predicting the phenomenon over the years (McCroskey Reference McCroskey1981; Carr Reference Carr1988; Ericsson & Reding Reference Ericsson and Reding1988a,Reference Ericsson and Redingb; Carr & Chandrasekhara Reference Carr and Chandrasekhara1996; Ekaterinaris & Platzer Reference Ekaterinaris and Platzer1997; Corke & Thomas Reference Corke and Thomas2015; Eldredge & Jones Reference Eldredge and Jones2019). Despite the progress, the sensitivity of the stall process to many aerodynamic factors such as airfoil shape, pitching rate, Mach number as well as the instantaneous state of the boundary layer, known for over 40 years (McCroskey Reference McCroskey1981), combined with the strong nonlinearity of the large-scale vortical structures make the prediction and control of dynamic stall a daunting endeavour to this day. A wealth of empirical and semiempirical stall models notwithstanding (see, e.g. Leishman & Beddoes (Reference Leishman and Beddoes1989) or Goman & Khrabrov (Reference Goman and Khrabrov1994) and their developments), a first principles explanation of the onset of dynamic stall is still elusive.
While thicker or more cambered airfoils tend to exhibit trailing-edge stall where the boundary layer separation beginning at the trailing edge gradually moves upstream, thin airfoils experience leading-edge stall characterised by an abrupt separation of the boundary layer close to the suction peak and the formation of a more energetic DSV (McCroskey Reference McCroskey1981). A ubiquitous feature of thin airfoils at high angles of attack is the presence of a laminar separation bubble (LSB) close to the leading edge, prior to stall, that has been observed for a large range of Reynolds numbers (Tani Reference Tani1964). Caused by intense adverse pressure gradients downstream of the suction peak, leading-edge LSBs are formed by the laminar separation of the boundary layer that quickly transitions and reattaches to form a pocket of reverse flow. A link between LSB bursting and dynamic stall proposed by Ham (Reference Ham1972) has been drawn in several subsequent experimental efforts (e.g. Carr, McAlister & McCroskey (Reference Carr, McAlister and McCroskey1981) and Chandrasekhara, Carr & Wilder (Reference Chandrasekhara, Carr and Wilder1994), to cite a few) but the small size of the LSB, especially at higher Reynolds numbers, make their experimental analysis difficult (Raffel et al. Reference Raffel, Favier, Berton, Rondot, Nsimba and Geissler2006). Recently, high-fidelity numerical simulations of dynamic stall have been able to confirm that the bursting of the LSB at the leading edge plays a crucial role in the onset of the dynamic stall at low-to-moderate Reynolds numbers ( $2.0 \times 10^5$) for a number of airfoils from the symmetric NACA (National Advisory Committee for Aeronautics) family (Sharma & Visbal Reference Sharma and Visbal2017). Subsequent simulations of the NACA0012 profile showed that LSB bursting is present at Reynolds numbers up to $1.0\times 10^6$, initiated after a rapid upstream movement of a turbulent separation region from the trailing edge (Benton & Visbal Reference Benton and Visbal2019).
The importance of the LSB bursting for the onset of dynamic stall is increasingly well established but the exact mechanism ultimately destabilising the bubble is still unknown. Since the pioneering work carried out at the University of London in the 1960s (McGregor Reference McGregor1954; Gaster Reference Gaster1963; Horton Reference Horton1968), numerous research investigations have demonstrated that LSBs act as natural convective noise amplifiers due to shear-layer instabilities of Kelvin–Helmholtz (KH) type. Additionally, these structures can also harbour self-excited instabilities that lead to unsteadiness independent of external forcing, the so-called absolute instabilities (Huerre & Monkewitz Reference Huerre and Monkewitz1990), even though global mode analysis of LSBs often leads to three-dimensional (3-D) stationary modes that are not related to absolute instabilities (Rodríguez, Gennaro & Juniper Reference Rodríguez, Gennaro and Juniper2013). Which of these characteristics, if any, is ultimately responsible for the onset of dynamic stall is still an open question, but given the well-documented sensitivity of LSBs to external noise, is likely that background disturbances in the free stream will also affect the LSB bursting process. Because external disturbances can never be fully suppressed, be it in experiments or simulations, it is important to consider the robustness of the results with regard to low amplitude free stream perturbations.
The flow around an airfoil during incipient dynamic stall involving LSBs is extremely complicated due to the coexistence of laminar and turbulent flow regions, the wide range of relevant spatial and temporal scales, and the fundamentally transient nature of the phenomenon. The recent developments in computer hardware, algorithms and storage capabilities together with improvements in experimental techniques have made highly accurate, temporally and spatially resolved flow data available from both experiments and simulations, thus opening new paths for the analysis of these challenging flows.
Instead of focusing on first-principles analyses which are notoriously difficult to apply to complicated flows, a promising approach is to leverage the fact that despite the local chaos of turbulence, there are structures of considerable coherence in space and time that are abundant in both experimental and numerical data, an idea that can be traced back at least to the work of Townsend (Reference Townsend1956). Most studies of turbulent flows have focused on statistically stationary flows, i.e. situations where the statistical properties of the system are invariant concerning shifts in time. A wide range of tools for feature extraction have been devised for these situations, most notably proper orthogonal decomposition (POD) and dynamic mode decomposition as well as the many variants that have emerged. The success and popularity of this type of data analysis is reflected in the increased number of review articles in recent years dealing with the underlying theory and applications (Rowley & Dawson Reference Rowley and Dawson2017; Taira et al. Reference Taira, Brunton, Dawson, Rowley, Colonius, McKeon, Schmidt, Gordeyev, Theofilis and Ukeiley2017; Schmid Reference Schmid2021). Unfortunately, the fundamentally transient character of dynamic stall linked to the non-autonomous nature of the flow case makes the direct application of these data-driven methods fundamentally inadequate for its analysis. Although some techniques such as the empirical mode decomposition (Huang et al. Reference Huang, Shen, Long, Wu, Shih, Zheng, Yen, Tung and Liu1998) exist for modal decomposition of non-autonomous data and have been tested for pitching wing flow data (Ansell & Mulleners Reference Ansell and Mulleners2020), there are still a number of issues in their practical application, in particular the need for user-defined parameters and considerable case-specific tuning. A complementary approach to devising new analysis techniques is to adapt existing and well-tested methods to the class of non-autonomous problems, an endeavour that has led to the recent extension of resolvent analysis to non-stationary flow configurations via wavelet transforms by Ballouz et al. (Reference Ballouz, Lopez-Doriga, Dawson and Bae2023).
In the same vein we focus on POD, the classic tool for modal decomposition that has been used extensively for feature extraction and reduced-order modelling of complex flows. The description of the biorthogonality of space-only POD modes modulated by temporal coefficients (Aubry et al. Reference Aubry, Holmes, Lumley and Stone1988) and their efficient computation via the so-called snapshot method (Sirovich Reference Sirovich1987) have led to widespread adoption of this space-only POD technique for the extraction of spatially correlated flow features from data. Recently, the increasing availability of time-resolved measurements and numerical simulation data have also revived interest in the spectral counterpart of space-only POD, labelled spectral POD (Picard & Delville Reference Picard and Delville2000; Towne, Schmidt & Colonius Reference Towne, Schmidt and Colonius2018), that relies on Fourier transforms of the correlation function prior to applying the POD method (Glauser, Leib & George Reference Glauser, Leib and George1987; Arndt, Long & Glauser Reference Arndt, Long and Glauser1997; Tinney & Jordan Reference Tinney and Jordan2008; Schmidt et al. Reference Schmidt, Towne, Colonius, Cavalieri, Jordan and Brès2017) and thus yields coherent structures in both space and time. To be able to apply the POD formalism to non-autonomous flow data, time needs to be included in the analysis explicitly, which naturally leads to the space–time POD concept. We stress that the explicit inclusion of time into the POD formalism does not alter the characteristics of the method but rather generalises the concept of realisation to a full spatiotemporal time series instead of restricting the analysis to spatial distributions (with or without preceding spectral estimation). Due to the overwhelming popularity of space-only and spectral POD concepts, the underlying generality of the POD framework, which stems directly from the original work of Lumley (Reference Lumley1967), is sometimes overlooked. We want to point out that the approach proposed here is similar to the conditional space–time POD approach described in Schmidt & Schmid (Reference Schmidt and Schmid2019), which applies a comparable extension of the standard POD to characterise intermittent rare events that are linked to large pressure fluctuations in a round jet. Note, however, that in the present work, we do not rely on an external criterion for the identification of events to constitute realisations of interest but instead apply the POD machinery to the full spatiotemporal data directly. Another less general instance of the POD method including a time variable is temporal POD, proposed by Gordeyev & Thomas (Reference Gordeyev and Thomas2013), which considers cross-correlations between trajectories of an autonomous dynamical system by applying specific time delays. In a recent study by Frame & Towne (Reference Frame and Towne2023) in the context of the approximation of the Hankel matrix, fundamental in system identification and control theory, the same extension of the POD methodology is considered. In contrast to the reference which focuses on autonomous problems, our focus is on the application of the framework to a large-scale time-dependent flow case.
The first aim of this study is the assessment of the influence of different levels of low-amplitude background disturbances on the onset of leading-edge dynamic stall via the direct numerical simulation (DNS) of the LSB on a NACA0009 airfoil undergoing a constant-rate pitch-up motion. The two disturbance levels considered in this work are chosen to correspond to low-amplitude turbulence environments typical of low-turbulence-level academic wind tunnels and aircraft cruise conditions or industrial wind tunnels, respectively. The simulation with the lowest disturbance level is validated against results from Sharma & Visbal (Reference Sharma and Visbal2017) that consider the same geometry but without free stream disturbances. The simulation at higher turbulence intensity exhibits considerably more complicated dynamics and, in particular, the appearance of strong transient vortex shedding from the LSB as it bursts and initiates stall.
A second focus of this study is the demonstration of the statistical relevance of the transient vortex shedding phenomenon during incipient dynamic stall under the influence of background disturbances using a dataset of 25 realisations of the same flow case generated at lower resolution. The spatiotemporal structure of the transient wave trains is extracted using the space–time POD method. After validating the capability of the approach to identify spatiotemporally correlated structures in a simple non-autonomous system based on the classical complex Ginzburg–Landau equation (CGLE) with time-dependent coefficients, we apply it to the dataset of incipient dynamic stall. The space–time POD method allows us to distil coherent but transient wave trains occurring during the bursting of the LSB that have a particularly strong signature in the wall stress data. Then, using extended POD (Borée Reference Borée2003), we reconstruct the flow field correlated with the wall data from the computed space–time POD modes.
The remainder of this paper is structured as follows. In § 2 we introduce the mathematical formulation of the governing equations as well as the kinematics of the imposed pitching motion of the airfoil. Section 3 is devoted to the numerical implementation of the DNSs including meshing and initial/boundary conditions as well as the definition of the considered cases. In § 4 we present the theory underlying space–time POD with emphasis on the link to the well-known space-only and spectral POD variants. With the theory and methodology in place, §§ 5 and 6 present the study results. The first part focuses on the effect of varying the background disturbance level in the DNS including a validation of the numerical set-up compared with the literature and an analysis of the statistical ensemble of the case at higher turbulence intensity. The second part considers the application of the space–time POD methodology to the ensemble to extract the spatiotemporal dynamics of the transient vortex shedding during the onset of dynamic stall. Finally, concluding remarks are gathered in § 7.
2. Problem specification and governing equations
The incipient leading-edge dynamic stall on a NACA0009 airfoil at a chord-based Reynolds number of  ${Re} = 200\,000$ is simulated for a prescribed constant-rate pitch-up motion around the quarter-chord axis ( $0.25c$) under the influence of low-amplitude disturbances in the free stream. To avoid discontinuities, the rotation speed is smoothly increased from the steady state at fixed $\alpha = 8^\circ$ to the final asymptotic pitching rate of $\varOmega _0 = 0.05$ rad/convective time unit $tU/c$, following the approach in Benton & Visbal (Reference Benton and Visbal2019) who defined an angular acceleration of
 \begin{equation} \ddot{\alpha}(t) = 4.6 \frac{\varOmega_0}{t_0} {\rm e}^{ - 4.6 t/t_0} , \end{equation}
where  $t>0$ is the (physical) simulation time and $t_0 = 0.5$ is a user-defined initial time window after which the rotation rate has reached $99.9\,\%$ of the target $\varOmega _0$. Integrating (2.1) yields the expressions for the angular velocity and angle of attack over time,
 \begin{equation} \dot{\alpha}(t) = \varOmega_0 \left( 1 - {\rm e}^{{-}4.6 t/t_0} \right) \end{equation}
and
 \begin{equation} \alpha(t) = \varOmega_0 \left[ t + \frac{t_0}{4.6} \left( {\rm e}^{{-}4.6 t/t_0} - 1 \right) \right]. \end{equation}
The smooth initial acceleration of the pitching rate towards the asymptotic ramp speed is visualised in figure 1 showing the angle of attack  $\alpha (t)$ as a function of convective time units $tU/c$ (full line) compared with the asymptote (dashed line).
Angle of attack over time (blue) compared with the asymptotic ramp speed (dashed).

The results will be compared with the simulations of Sharma & Visbal (Reference Sharma and Visbal2017), which have the same set-up as the present case with the exception of the initial ramp function. Since the computations in the reference are initialised at  $\alpha = 4^\circ$ and have the same asymptotic rotation rate, the two simulation set-ups become identical after the initial transient ( $t = t_0$). Similar conclusions were drawn by the same group when comparing simulations initialised at $\alpha = 4^\circ$ and $\alpha = 8^\circ$, albeit at higher Reynolds numbers (Visbal Reference Visbal2014).
The governing flow equations are the 3-D incompressible Navier–Stokes equations
 \begin{equation} \frac{\partial \boldsymbol{U}}{\partial t} + (\boldsymbol{U} \boldsymbol{\cdot} \boldsymbol{\nabla}) \boldsymbol{U} ={-} \boldsymbol{\nabla} p + \frac{1}{{Re}} \nabla^2 \boldsymbol{U}, \quad \boldsymbol{\nabla} \boldsymbol{\cdot} \boldsymbol{U} = 0 , \end{equation}
where  $\boldsymbol {U} = (U_x,U_y,U_z)$ is the velocity field and $p$ is the pressure. The equations are non-dimensionalised with the free stream velocity $U$ and the chord length $c$ yielding the chord-based Reynolds number of ${Re}= 200\,000$.
3. Direct numerical simulations of dynamic stall onset
The numerical simulations of the governing equations are performed using the extensively validated high-order spectral element code Nek5000 (Fischer, Lottes & Kerkemeier Reference Fischer, Lottes and Kerkemeier2008). The spectral element method (SEM) inherits the low numerical dissipation and dispersion from the spectral framework, which makes it particularly suitable for simulations involving transitional flows, while allowing for more geometric flexibility than traditional spectral methods. Following the  $\mathbb {P}_N$– $\mathbb {P}_{N-2}$ SEM (Maday & Patera Reference Maday and Patera1989), the flow domain is subdivided into hexahedral elements inside which the solution fields for velocity and pressure are expanded, in each spatial direction, in terms of high-order Lagrange polynomials on the Gauss–Lobatto–Legendre and Gauss–Legendre quadrature points, respectively, thus avoiding spurious pressure modes. The equations are advanced in time using a third-order accurate implicit/explicit scheme. A third-order implicit backwards-differencing scheme is used to discretise the time derivative while treating the diffusion term implicitly. The nonlinear terms are treated explicitly using a third-order extrapolation scheme with over-integration. In order to ensure the stability of the simulations past stall onset when the extent of turbulent flow increases dramatically and reaches zones with insufficient spatial resolution, an implicit relaxation-term filtering is applied to the highest velocity modes (Negi, Schlatter & Henningson Reference Negi, Schlatter and Henningson2017). The mesh movement is accomplished using the arbitrary Lagrangian–Eulerian framework whereby the mesh is smoothly deformed in a predetermined manner during the course of the simulation (Ho & Patera Reference Ho and Patera1990, Reference Ho and Patera1991). A polynomial order of $N = 7$ for the velocity components ( $N = 5$ for the pressure) was chosen for the two DNSs. A second set of simulations to generate a statistical ensemble of dynamic stall realisations is performed using the identical set-up but with a polynomial order of $N = 5$ ( $N = 3$) for velocity (pressure). See § 5.3 for details on the simulations at reduced resolution.
3.1. Meshing and boundary conditions
The computational mesh is designed for the accurate computation of the flow close to the leading edge and the LSB during the onset of dynamic stall. In order to minimise the impact of the boundary conditions in spite of the dramatic changes in the large-scale flow field over the course of the simulation, the far-field boundary was placed at a constant radial distance of 3.5 chords upstream of the leading edge whereas the outflow is located four chords downstream of the airfoil. The spanwise extent of the simulation is  $0.1c$, based on the results in Benton & Visbal (Reference Benton and Visbal2019). At the far-field boundary, uniform streamwise flow is imposed as a Dirichlet condition. The effect of this simplification was assessed using auxiliary two-dimensional (2-D) Reynolds-averaged Navier–Stokes (RANS) simulations performed in ANSYS Fluent v18.2 with the Menter $k$–
$k$– $\omega$ shear stress transport turbulence model (Langtry & Menter Reference Langtry and Menter2009) on an extensive domain. The RANS simulations were repeated at several angles of attack in the range of interest showing a variation of the velocity distribution on the boundaries of the present mesh of approximately $1\,\%$. Natural, stress-free boundary conditions were applied to the outflow.
The resolution of the boundary layer mesh of the turbulent region is based on estimates of the wall shear stress  $\tau _w$ from the RANS simulations. In the laminar and transitional regions including the LSB where turbulent scaling is inapplicable, we choose a similar resolution. The grid spacing for the different regions is based on the following criteria (the superscript $+$ indicates viscous scaling), following the practice in Negi et al. (Reference Negi, Vinuesa, Hanifi, Schlatter and Henningson2018):
(i) $0 < x/c < 0.2$, suction side (LSB), $x^+ < 15, y^+ < 0.5$ – the resolution of the leading edge is locally higher to accurately capture the curvature;
(ii)
$0.2 < x/c < 1$, suction side, $x^+ < 20, y^+ < 1$ – the streamwise resolution requirements are relaxed over the suction side but increased close to the sharp trailing edge;(iii)
$0 < x/c < 1$, pressure side – as the flow is expected to be laminar over the pressure side, the streamwise resolution downstream of the stagnation point is set to $x^+ < 25$ on average;(iv)
$1 < x/c < 4$, wake – in the wake, the streamwise resolution $\Delta x$ is based on estimations of the Kolmogorov length scale $\eta = (\nu ^3/\varepsilon )^{1/4}$ using the local dissipation rate $\varepsilon$ from the RANS simulation. The spacing is smoothly increased from $\Delta x \approx 8 \eta$ close to the airfoil to $\Delta x \approx 20 \eta$ at the outflow.


In order to meet the resolution requirements close to the airfoil surface as well as to keep the overall cell count manageable, the meshing process has three stages. An initial, structured, 2-D C-type mesh is constructed in ANSYS ICEM v18.2 for an angle of attack of  $18^\circ$, which corresponds to the mean angle during the simulation and thus minimises the element distortion during mesh deformation. This mesh is then conformally coarsened in the radial direction in the free stream region to generate the 2-D template for the mesh. The final, 3-D mesh is obtained by extruding the template in the spanwise direction yielding a nominal resolution of $z^+ < 9$. In order to further reduce the cell count, another layer of conformal coarsening is added in the spanwise direction. The location of the coarsened layer was chosen such that it lies outside of the attached boundary layer. An overview of the 2-D template mesh as well as details of the region close to the leading edge and the spanwise resolution of the final mesh are shown in figure 2.
Computational mesh. Only spectral elements are shown. (a) Overview of the full domain including the boundaries (2-D slice). (b i) Close-up of the mesh close to the LSB and (b ii) spanwise slice of the boundary layer mesh on the suction side.

3.2. Initial conditions
The dynamic simulations are initialised from statistically stationary precursor simulations at a fixed angle of attack of  $\alpha = 8^\circ$ presented in detail in Kern, Hanifi & Henningson (Reference Kern, Hanifi and Henningson2022). This angle is sufficiently high such that the LSB at the leading edge is already formed while being low enough to ensure that the full ramp speed is reached before its bursting initiates the dynamic stall process (Sharma & Visbal Reference Sharma and Visbal2017). These precursor simulations were also used to confirm the adequacy of the de facto resolution via the statistics of wall shear stress and to perform a mesh convergence study via $h$-refinement (Kern et al. Reference Kern, Hanifi and Henningson2022).
3.3. Mesh deformation
The mesh deformation is distributed in the computational domain such that the far-field boundaries are stationary whereas the mesh close to the airfoil surface is rotated as a solid body together with the airfoil in order to maintain the high-quality mesh characteristics in the entire boundary layer region. In order to find an appropriate smooth blending function to maximise element quality in the distorted regions, a variable coefficient Poisson equation is solved forcing the gradients of mesh deformation to lie far away from the airfoil surface (see figure 3). Since the ramp motion of the airfoil is prescribed, the mesh velocities are known a priori and the deformation field needs to be computed only once and is then used throughout the dynamic simulations.
Distribution of the mesh deformation parameter  $r$ in the computational domain. The far-field boundaries are stationary (blue, $r=0$), whereas the region close to the airfoil in the centre rotates in solid body rotation (red, $r= 1$). (a) Distribution in the radial direction. (b) Distribution of $r$ along the dashed line in (a). Here $d/c$ is the distance from the leading edge.

3.4. External disturbances
In order to study the effect of free stream disturbances on the incipient dynamic stall, low-amplitude background disturbances are added to the flow. Similar simulations of pitching wings have imposed the free stream disturbances directly on the inlet boundaries thus allowing a high level of control over the spectral properties of the perturbations (Negi et al. Reference Negi, Vinuesa, Hanifi, Schlatter and Henningson2018). This method requires both adequate resolution of the turbulent fluctuations up to the airfoil and long precursor simulations to reach a statistically steady state. Due to the large distance of the airfoil to the far-field boundaries in this work, this approach is unfeasible. An alternative method to impose free stream disturbances at a specified location in the flow field is to use a localised body force to drive the flow to the desired state (see e.g. Durovic et al. Reference Durovic, Schlatter, Hanifi and Henningson2022). This method has similar characteristics to the direct method but requires explicit knowledge of the laminar (unperturbed) baseflow state in order to define the target velocity distribution. In dynamic simulations, the baseflow is time-dependent and thus not available to design the appropriate forcing function. In view of these technical difficulties and considering that the disturbance levels in this work are very low, a lower fidelity approach was chosen derived from the body force approach. Instead of forcing the flow to a specific perturbed state with a realistic energy spectrum, the flow is forced directly with a bandwidth-limited white noise body force. The forcing is introduced around  $0.1c$ upstream of the leading edge to give the flow time to adapt to the incoming disturbances. Contrary to the approach in Durovic (Reference Durovic2022) where the forcing vanishes when the target velocity distribution is achieved, the amplitude of the forcing in the present work needs to be tuned in order to obtain the right disturbance amplitude. While this method of introducing disturbances is very efficient, it cannot guarantee a specific spectral distribution (e.g. the von Kármán energy spectrum) and is therefore not recommended for simulations with higher free stream turbulence intensities since the details of the turbulence can affect the receptivity mechanisms (Fransson & Shahinfar Reference Fransson and Shahinfar2020).
In order to avoid numerical artefacts introduced by sharp gradients in spectral methods, the onset of the forcing is smoothed out in space using a Gaussian fringe function. The 3-D body force is thus given by
 \begin{equation} f(x,y,z,t) = f_{amp} \cdot f_{noise}(x,y,z,t) \cdot \lambda(x,y,z), \end{equation}
where  $f_{amp}$ is the scalar forcing amplitude tuned to yield the chosen fluctuation amplitude at the leading edge, $f_{noise}(x,y,z,t)$ is the spatiotemporal forcing field constructed using the superposition of Fourier modes with random phase shifts (see Brandt, Schlatter & Henningson (Reference Brandt, Schlatter and Henningson2004), substituting the spectral distribution with a bandwidth-limited white noise signal) and $\lambda (x,y,z)$ is the 3-D spatial fringe function. The spatial bandwidth of the isotropic white noise signal in terms of the wavenumber $\kappa$ is determined by the geometry of the simulation domain and the mesh to avoid aliasing. The largest spatial scales $(\kappa _{min})$ are limited by the smallest spatial extent of the simulation domain (i.e. the span) whereas the smallest scales $(\kappa _{max})$ are chosen such that the wavelength roughly corresponds to the largest dimension of the spectral elements in the boundary layer in order to be well resolved (i.e. on average eight points per wavelength at polynomial order $N=7$). In practice, the signal bandwidth is chosen as
 \begin{equation} \kappa_{min} = 8.4 \times 10^1 \leq \kappa c \leq 1.4 \times 10^4 = \kappa_{max} , \end{equation}
normalised by the airfoil chord  $c$.
$c$.
The spatial fringe function  $\lambda (x,y,z)$ is constructed pointwise from orthogonal one-dimensional (1-D) fringes $\lambda _i(x_i)$ in each coordinate direction $i$ as
 \begin{equation} \lambda(x,y,z) = \min_i \lambda_i (x_i) . \end{equation}
The 1-D fringes  $\lambda _i (x_i)$ are chosen such that
 \begin{equation} \lambda_i(x_i) = \begin{cases} \exp \left[ -\left( \dfrac{x_i - s_i}{\sigma} \right)^2 \right], & x_i < s_i, \\ 1, & s_i \leq x_i \leq e_i, \\ \exp \left[ -\left( \dfrac{x_i - e_i}{\sigma} \right)^2\right], & x_i > e_i, \end{cases} , \end{equation}
where  $x_i = x$, $x_2 = y$ and, for each coordinate direction, $s_i$ and $e_i$ define start and end ( $s_i \leq e_i$) of the full forcing region, respectively, and $\sigma$ is the standard deviation of the Gaussian distributions defining the rate of attenuation adjacent to the full forcing region. In this work, $\sigma = 0.02$ was chosen for numerical stability and the forcing was set to fully active ( $\lambda _i(x_i)= 1$) in the ranges $-0.125 \leq x \leq -0.09$, $-0.2 \leq y \leq 0.45$ and for all
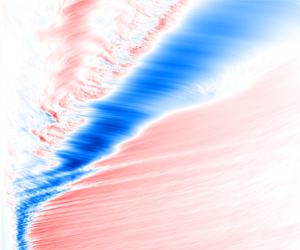
  $z$ (constant along the span). The resulting spatial distribution of a snapshot of the forcing function is shown in figure 4.
Distribution and structure of the disturbance body force  $f(x,y,z,t)$ in an $x$–
$x$– $y$ plane in comparison with the airfoil. The forcing is active over the entire span of the simulation. Blue and red correspond to positive and negative disturbances, respectively.

In the present work, two background disturbance levels are chosen. The forcing amplitude is tuned using the steady state precursor simulations via time and span-averaged statistics of the velocity fluctuations at the point  $(x_0,y_0) = (0,0.05)$ upstream of the leading edge and computing the turbulence intensity as
 \begin{equation} {Tu} = \frac{\sqrt{\dfrac{1}{3} \left( \langle u^2 \rangle + \langle v^2 \rangle + \langle w^2 \rangle \right) }}{U}, \end{equation}
where the uppercase and lowercase letters refer to mean and fluctuating quantities, respectively, and  $\langle \cdot \rangle$ denotes averaging in time and along the span. The disturbance levels, measured by the turbulence intensity at the point $(x_0,y_0)$, differ only in the forcing amplitude.
Case I This case (
${Tu} = 0.02\,\%$) corresponds to a low disturbance environment typically encountered in aircraft in cruise conditions or in low free stream turbulence academic wind tunnels.Case II This case (
${Tu} = 0.05\,\%$) with a slightly higher disturbance level corresponds to the environments in conventional wind tunnels.


Note that neither of the scenarios considered in this work are comparable to turbulent inflow conditions found in, for example, steam and gas turbines that are studied in detail elsewhere (Merrill & Peet Reference Merrill and Peet2017; De Vincentiis et al. Reference De Vincentiis, Durović, Lengani, Simoni, Pralits, Henningson and Hanifi2023). The considered range of disturbance amplitudes is relatively small compared with the turbulence intensities up to 1 %–3 % routinely encountered in many aeronautical applications. Therefore, we stress that the aim is not to consider these relatively high turbulence intensities, but on the contrary to consider very low disturbance environments in the range of the unavoidable background disturbance levels of wind tunnels. Experiments without a specified inlet turbulence intensity are in practise often considered ‘clean’ and thus compared with undisturbed simulations, which are cheaper and more available. Although this direct comparison is typically appropriate for stable flows e.g. attached boundary layer flows, more unstable flow configurations such as laminar separation bubbles involved in dynamic stall require a more careful consideration, since the boundary layer dynamics can be noticeably affected even by relatively low amplitude disturbances that are commonly considered inconsequential.
The two cases considered in this work are comparable to each other but cannot give conclusive results regarding the influence of realistic free stream turbulence and its coherence characteristics such as the integral length scale (Fransson & Shahinfar Reference Fransson and Shahinfar2020). Nevertheless, the high degree of similarity between Case I in the present study and the work of Sharma & Visbal (Reference Sharma and Visbal2017) indicates that a simulation without forcing would only be marginally different from either of them and the cost of an unforced DNS is therefore unreasonable. The assessment of the difference in the dynamics of Case II between the present disturbance generation and more realistic free stream turbulence is out of the scope of this paper but is an interesting topic for future investigations.
In order to reduce the data footprint of the simulations while obtaining time-resolved data, especially on the airfoil surface, the flow data is span-averaged using the statistics toolbox for Nek5000 (Vinuesa et al. Reference Vinuesa, Peplinski, Atzori, Fick, Marin, Merzari, Negi, Tanarro and Schlatter2018), adapted to deal with the spanwise conformally coarsened mesh in the homogeneous direction as described in Kern et al. (Reference Kern, Hanifi and Henningson2022). In addition to the spanwise averaging, the data is aggregated and time-averaged over  $\Delta t_{2D}U/c = 2.4\times 10^{-3}$ and $\Delta t_{1D}U/c = 4\times 10^{-5}$ for the full field and the surface data, respectively. The time-averaging process implicitly assumes the airfoil to be stationary, which is an approximation. The error is considered negligible given that the largest difference in angle of attack over the averaging interval is less than $1\,\%$ of a degree.
4. Proper orthogonal decomposition
For the data-driven analysis of the statistical ensemble of realisations of Case II (described in detail in § 5.3), we apply the procedure labelled space–time POD, a formulation of the well-known POD applicable to non-autonomous flow data. In this section, we first present the statistical method of POD in terms of stochastic processes of an arbitrary parameter  $x$, before restricting the analysis to flow data defined as a function of space coordinates, $\boldsymbol {x}$, and time, $t$, where the different versions of the method are conditioned by the particular choice of random process under consideration. This presentation will use the continuous formulation of the inner product in order to highlight the conceptual differences between these versions. We emphasise that we always consider a finite set of realisations forming the statistical ensemble.
Proper orthogonal decomposition, often called principal component analysis or even Kármán–Loève expansion in other scientific fields, is a classical tool rooted in statistical theory, employed to study coherent structures within complex flows. Introduced initially by Lumley (Reference Lumley1967) in the context of atmospheric turbulent flows, the method considers a square-integrable ( $L^2$, finite variance/energy) stochastic signal $u(x)$, defined on a set $\varOmega$ of values of $x$, which is equipped with an expected value operator $\boldsymbol {E}\{\boldsymbol {\cdot }\}$ and an inner product
 \begin{equation} \langle u,v \rangle_\varOmega = \int_\varOmega u^*(x) v(x) \, {{\rm d} x}, \end{equation}
where  $\{\cdot \}^*$ denotes complex conjugation. In order to lighten the notation in the definitions of the inner products for the rest of the paper, the second signal is assumed to be defined on the same set as the first. The signal $u(x)$ is decomposed into $k$ deterministic functions, $\phi _k(x)$, called POD modes, and random coefficients, $a_k$, such that
 \begin{equation} u(x) = \sum_{k=1}^n a_k \phi_k(x), \quad a_k = \langle u(x), \phi_k(x) \rangle_\varOmega, \end{equation}
where the POD modes are the functions that maximise the Rayleigh quotient,
 \begin{equation} R(u,\phi) = {\frac{\boldsymbol{E}\left\{|\langle u(x),\phi(x) \rangle_\varOmega|^2\right\}}{\langle \phi(x),\phi(x) \rangle_\varOmega}}. \end{equation}
These modes are shown to be eigenfunctions of the integral (Fredholm) equation,
 \begin{equation} \int_\varOmega \boldsymbol{C}(x,x^\prime) \phi(x^\prime)\, {{\rm d} x}^\prime= \lambda \phi(x), \end{equation}
containing a kernel defined as the two-point correlation function,
 \begin{equation} \boldsymbol{C}(x,x^\prime) = \boldsymbol{E} \{u(x) u^*(x^\prime)\}. \end{equation}
By definition, the POD modes diagonalise the correlation function,
 \begin{equation} \boldsymbol{C}(x,x^\prime) = \sum_{k=1}^n \lambda_k \phi_k(x) \phi^*_k(x^\prime), \end{equation}
and are orthonormal with respect to the chosen inner product,
 \begin{equation} \langle \phi_j,\phi_k \rangle_\varOmega = \delta_{jk}, \end{equation}
where  $\delta _{jk}$ is the Kronecker delta. Furthermore, POD modes show coherence in the domain in which the correlation function is defined and are optimal in capturing the variance in a dataset. In other words, among all linear decompositions, a given subset of the POD modes, $\phi _k$, associated with the highest eigenvalues, $\lambda _k$, contains the most variance possible in the average sense (Berkooz, Holmes & Lumley Reference Berkooz, Holmes and Lumley1993).
4.1. Standard POD formulations in fluid dynamics
Considering a vector field,  $\boldsymbol {u} (\boldsymbol {x},t)$, a function of space and time, one needs to define two main parameters in order to perform a POD analysis: the inner-product integration domain $\varOmega$ and the statistical ensemble, with its corresponding expected value operator $\boldsymbol {E}\{\boldsymbol {\cdot}\}$.
The predominant form of POD in the field of fluid dynamics, popularised in the late 1980s by the works of Sirovich (Reference Sirovich1987) and Aubry et al. (Reference Aubry, Holmes, Lumley and Stone1988), constructs the statistical ensemble as a set of snapshots of  $\boldsymbol {u} (\boldsymbol {x},t)$ at different time instances $t_k$ and the integration domain as the spatial coordinates, such that $\varOmega \equiv X$. Therefore, (4.1) can be expressed as
 \begin{equation} \langle \boldsymbol{u},\boldsymbol{v} \rangle_X = \int_X \boldsymbol{v}^*(\boldsymbol{x},t) \boldsymbol{u}(\boldsymbol{x},t) \,{\rm d}\boldsymbol{x}, \end{equation}
while the expected value operator is defined as the ensemble average over snapshots (time average), such that (4.5) is written as
 \begin{equation} \boldsymbol{C}(\boldsymbol{x},\boldsymbol{x}^\prime) = \frac{1}{N_s} \sum_{n=1}^{N_s} \boldsymbol{u}(\boldsymbol{x},t_n) \boldsymbol{u}^*(\boldsymbol{x}^\prime,t_n), \end{equation}
where  $N_s$ is the total number of snapshots. In this case, the POD expansion in (4.2) is
 \begin{equation} \boldsymbol{u}(\boldsymbol{x},t) = \sum_{k=1}^n a_k(t) \boldsymbol{\phi}_k(\boldsymbol{x}), \quad a_k(t) = \langle \boldsymbol{u}(\boldsymbol{x},t),\boldsymbol{\phi}_k(\boldsymbol{x}) \rangle_X, \end{equation}
meaning that POD modes only represent spatial correlations within the data, hence the label space-only POD. All temporal information is encapsulated in the expansion coefficients  $a_k(t)$ (Aubry Reference Aubry1991).
An alternative form of POD employs a statistical ensemble set constructed using a collection of realisations of the same statistically stationary (homogeneous in time) flow, each treated as an independent time series and defined over an infinite temporal span. Now, the integration domain contains both space and time,  $\varOmega \equiv X \times T$, such that (4.1) may be written as
 \begin{equation} \langle \boldsymbol{u},\boldsymbol{v} \rangle_{X \times T} = \int_{-\infty}^\infty \int_X \boldsymbol{v}^*(\boldsymbol{x},t) \boldsymbol{u}(\boldsymbol{x},t) \, {\rm d}\boldsymbol{x} \,{\rm d}t \end{equation}
and the expected value is an ensemble average over realisations, with (4.5) becoming
 \begin{equation} \boldsymbol{C}(\boldsymbol{x},\boldsymbol{x}^\prime,t,t^\prime) = \boldsymbol{E}\{\boldsymbol{u} (\boldsymbol{x},t) \boldsymbol{u}^*(\boldsymbol{x}^\prime,t^\prime)\} = \frac{1}{N_r} \sum_{n=1}^{N_r} \boldsymbol{u}_n(\boldsymbol{x},t) \boldsymbol{u}_n^*(\boldsymbol{x}^\prime,t^\prime), \end{equation}
where  $N_r$ is the total number of realisations.
Since the integration of a time-homogeneous signal over an infinite time span is unbounded, (4.4) must be solved in Fourier space (Lumley Reference Lumley1967, Reference Lumley1970). From the temporal homogeneity assumption we can write
 \begin{equation} \boldsymbol{C}(\boldsymbol{x},\boldsymbol{x}^\prime,t,t^\prime) \equiv \boldsymbol{C}(\boldsymbol{x},\boldsymbol{x}^\prime,\tau), \quad \tau = t - t^\prime, \end{equation}
and the correlation function can be Fourier transformed,
 \begin{equation} \boldsymbol{\hat{C}}(\boldsymbol{x},\boldsymbol{x}^\prime,f) = \int_{-\infty}^{\infty} \boldsymbol{C}(\boldsymbol{x},\boldsymbol{x}^\prime,\tau) {\rm e}^{{-}2{\rm \pi} {\rm i} f \tau} \,{\rm d}\tau, \end{equation}
leading to a distinct eigenvalue problem for each frequency. This leads to the expansion
 \begin{equation} \boldsymbol{\hat{u}}(\boldsymbol{x},f) = \sum_{k=1}^n a_k(f) \boldsymbol{\psi}_k(\boldsymbol{x},f), \quad a_k(f) = \langle \boldsymbol{\hat{u}}(\boldsymbol{x},f),\boldsymbol{\psi}_k(\boldsymbol{x},f) \rangle_X, \end{equation}
equivalent to (4.2), where  $\boldsymbol {\psi }_k(\boldsymbol {x},f)$ is the $k{\text {th}}$ eigenvector of the spectral correlation function in (4.14), for each distinct frequency.
This approach was labelled spectral POD by Picard & Delville (Reference Picard and Delville2000) and Towne et al. (Reference Towne, Schmidt and Colonius2018) and has been applied to different settings (Glauser et al. Reference Glauser, Leib and George1987; Arndt et al. Reference Arndt, Long and Glauser1997; Tinney & Jordan Reference Tinney and Jordan2008; Schmidt et al. Reference Schmidt, Towne, Colonius, Cavalieri, Jordan and Brès2017) throughout the years. In this case, the modes depend on both space and time and are able to capture correlations in space while evolving at a single frequency  $f$.
$f$.
4.2. Space–time POD
It is important to notice that both space-only and spectral POD formulations described in the previous section assume a statistically stationary (time-homogeneous) signal. The former through the time-averaging expected value operator, defined in (4.9), and the latter through the time dependence of the correlation function and Fourier transform, described in (4.13) and (4.14). While these formulations are predominant in the literature, we stress that homogeneity in time is not a requirement of the POD method itself but rather stems from the specifics of each application (Aubry Reference Aubry1991).
As described in § 1, the leading-edge dynamic stall over an airfoil is a nonlinear, non-autonomous flow configuration with changing statistics over time. Hence, the application of POD in this work calls for the relaxation of the time homogeneity assumption. We choose a statistical ensemble composed of a collection of realisations of the same flow, each defined over a restricted (finite) time interval,  $t \in [t_0,t_1]$, and borrow the definition of the expected value operator and cross-correlation function from (4.12). The integration domain contains both space and time, $\varOmega \equiv X \times T$.
The following derivation is analogous to the one described in Towne et al. (Reference Towne, Schmidt and Colonius2018) for spectral POD. However, since the integration in time covers a bounded domain, this formulation obeys the  $L^2$ integrability requirements without the need of a Fourier transform. The associated inner product is
 \begin{equation} \langle \boldsymbol{u},\boldsymbol{v} \rangle_{X \times T} = \int_{t_0}^{t_1} \int_X \boldsymbol{v}^*(\boldsymbol{x},t) \boldsymbol{u}(\boldsymbol{x},t) \,{\rm d}\boldsymbol{x} \,{\rm d}t, \end{equation}
leading to the Fredholm equation
 \begin{equation} \int_{t_0}^{t_1} \int_X \boldsymbol{C}(\boldsymbol{x},\boldsymbol{x}^\prime,t,t^\prime) \boldsymbol{\phi}(\boldsymbol{x}^\prime,t^\prime) \, {\rm d}\boldsymbol{x}^\prime \,{\rm d}t^\prime = \lambda \boldsymbol{\phi}(\boldsymbol{x},t), \end{equation}
with subsequent diagonalisation
 \begin{equation} \boldsymbol{C}(\boldsymbol{x},\boldsymbol{x}^\prime,t,t^\prime) = \sum_{k=1}^n \lambda_k \boldsymbol{\phi}_k(\boldsymbol{x},t) \boldsymbol{\phi}^*_k(\boldsymbol{x}^\prime,t^\prime), \end{equation}
and POD expansion
 \begin{equation} \boldsymbol{u}(\boldsymbol{x},t) = \sum_{k=1}^n a_k \boldsymbol{\phi}_k(\boldsymbol{x},t), \quad a_k = \langle \boldsymbol{u}(\boldsymbol{x},t),\boldsymbol{\phi}_k(\boldsymbol{x},t) \rangle_{X \times T}. \end{equation}
It is clear that the eigenmodes in this formulation have full dependence on both space and time, without any homogeneity assumptions, and will show coherence in the full space–time domain since this is the span of the correlation function. We note that the foundations of the POD framework in this more general form are already given in the pioneering work of Lumley (Reference Lumley1967, Reference Lumley1970) but were largely of theoretical relevance at the time due to the massive data requirements for its deployment.
Concerning the choice of integration domain, the space–time POD formulation can be thought of as a generalisation of both mainstream forms of POD presented above. For the case of space-only POD, the time integration bounds in (4.16) tend to the same value ( $t_1-t_0 \to 0$), such that correlations can be thought to be defined over an infinitesimal time span, $dt$. Assuming homogeneous statistical evolution of $\boldsymbol {u}(\boldsymbol {x},t)$ in time, the time dependence of (4.18) can be dropped and snapshots can be considered independent realisations. In spectral POD, on the other hand, the time integration bounds tend to infinity ( $t_1-t_0 \to \infty$) and, assuming time homogeneity, the energy can be computed in Fourier space. Since correlations are still defined over a time span, spectral modes show coherence in space and time. This intimate relationship between the different versions of POD analysis is considered in detail in Frame & Towne (Reference Frame and Towne2023).
4.3. Extended POD
Considering that the phenomenon of dynamic stall is often described in terms of the aerodynamic loads on a wing (Ekaterinaris & Platzer Reference Ekaterinaris and Platzer1997), it is useful to consider correlations in two different domains; on the one hand the wall stresses defined over the 2-D surface of the airfoil, and on the other hand the full velocity field. The concept of extended POD, introduced by Borée (Reference Borée2003), gives us the tools for this analysis.
An important property of POD theory is that we can write
 \begin{equation} \boldsymbol{\phi}_k(\boldsymbol{x}) = \frac{\boldsymbol{E} \left\{\boldsymbol{u}(\boldsymbol{x}) a^*_k \right\}}{\lambda_k}, \end{equation}
which states that the POD modes can be computed from coefficients in the same way that coefficients are computed from the modes in (4.2). The core idea behind extended POD is to use (4.20) to correlate a given signal with any other physical quantity of interest, in any domain, solely from the coefficients of the POD expansion. Given two stochastic signals  $\boldsymbol {u}(\boldsymbol {x})$ and $\boldsymbol {u}^\prime (\boldsymbol {x}^\prime )$ with $\boldsymbol {x} \in \varOmega$ and $\boldsymbol {x}^\prime \in \varOmega ^\prime$ (where the two domains can intersect or not), we associate each realisation of $\boldsymbol {u}(\boldsymbol {x})$ with a realisation of $\boldsymbol {u}^\prime (\boldsymbol {x}^\prime )$ via its POD expansion on $\varOmega$. If the POD expansion for $\boldsymbol {u}(\boldsymbol {x})$ is written in the form of (4.2), the $k{\text {th}}$ extended POD mode for $\boldsymbol {u}^\prime (\boldsymbol {x}^\prime )$ is defined by
 \begin{equation} \boldsymbol{\xi}_k(\boldsymbol{x}^\prime) = \frac{\boldsymbol{E} \left\{\boldsymbol{u}^\prime(\boldsymbol{x}^\prime) a^*_k \right\}}{\lambda_k}. \end{equation}
In his work, Borée (Reference Borée2003) demonstrates useful properties of these extended modes, in particular, that the expansion
 \begin{equation} \boldsymbol{u}^\prime_c(\boldsymbol{x}^\prime) = \sum_{k=1}^n a_k \boldsymbol{\xi}_k(\boldsymbol{x}^\prime) \end{equation}
contains only the component of the signal  $\boldsymbol {u}^\prime (\boldsymbol {x}^\prime )$ correlated with $\boldsymbol {u}(\boldsymbol {x})$ and that only the $k{\text {th}}$ element of the expansion, $a_k \boldsymbol {\xi }_k(\boldsymbol {x}^\prime )$, is correlated to the projection of the original signal onto the original $k{\text {th}}$ POD mode, $a_k \boldsymbol {\phi }_k(\boldsymbol {x})$.
5. Dynamics of incipient dynamic stall
In the following section, we validate the DNS results against data from the literature before analysing the onset of the dynamic stall in the present simulations using the aerodynamic coefficients, the space–time data of the friction and pressure coefficients as 2-D and 3-D flow visualisations, with a focus on the effect of the free stream disturbances on the dynamics. In the final part, we consider the generation of the statistical ensemble of simulations for the application of space–time POD.
5.1. Validation of the numerical method
In this section, we compare the results of the DNS of Case I (low background noise level) with data from Sharma & Visbal (Reference Sharma and Visbal2017) who consider the same configuration in the absence of free stream disturbances and using a compressible code. Due to the low nominal Mach number ( ${Ma} = 0.1$) in the reference, compressibility is not expected to play a considerable role.
The first comparison concerns the span-averaged aerodynamic coefficients extracted from the simulation in this work (Case I, red line) that are plotted in figure 5 against convective time units (lower axis) and the angle of attack (upper axis) together with data from the reference (black dotted line). The data from the second DNS (Case II, blue line) is also included but will be considered later. Case I and the reference show very similar force histories with a gradual increase in lift and drag up until the lift stall at around  $\alpha = 22^\circ$ followed by a sharp decrease of the aerodynamic loads. The maximum lift in the reference is reached at approximately $\alpha = 22^\circ$ whereas Case I peaks at $\alpha = 21.0^\circ$. The present simulation also shows a steeper lift increase during the pitch up leading to a maximum lift of $c_{L,max} \approx 2.5$ or approximately $4\,\%$ more than in the reference. The variation of the quarter-chord moment is also similar, the present simulation predicts moment stall to occur at $\alpha \approx 14.5^\circ$ or $0.5^\circ$ earlier than in the reference. The lift stall is due to the movement of the DSV past the trailing edge and is therefore highly dependent on the flow details in this region. In the present study, a sharp trailing edge was chosen, which was seen to lead to locally very high velocities, in particular at higher angles of attack, that reduce the fidelity of the results for the final part of the simulation during the fully developed stall. For the same reason, the strong fluctuations visible in particular in the lift and drag coefficient curves just prior to lift stall cannot be easily interpreted as they may be amplified by the interaction of the forming DSV with the trailing edge and their phase is likely probabilistic, i.e. may vary between realisations of the flow.
Comparison of the span-averaged aerodynamic coefficients during the pitching motion for the two calculations compared with results in Sharma & Visbal (Reference Sharma and Visbal2017). The area marked by the grey box corresponds to the range of the statistical ensemble. (a) Span-averaged drag coefficient  $c_D$. (b) Span-averaged lift coefficient $c_L$. (c) Span-averaged moment coefficient around the quarter-chord $c_M$.

The spanwise periodic simulations of the present dimensions in the literature were shown to be capable of accurately capturing the onset of dynamic stall on a NACA0012 airfoil when compared with wind tunnel experiments while the details of the subsequent stall development and reattachment (in periodically oscillating cases) were subject to the more long-wavelength spanwise variation that cannot be captured in the present truncated domain (Visbal & Garmann Reference Visbal and Garmann2017). The spanwise waves with wavelengths comparable to the airfoil chord generated by the interaction between the DSV and the trailing edge and exacerbated by end effects lead to a fully 3-D flow during deep stall at all scales. Therefore, while two simulations of similar spanwise extent can be expected to compare more favourably, the details of the dynamics in the later stages of dynamic stall are nevertheless more uncertain. One should also recall here that we are considering single realisations of the flow which exhibit strong unsteadiness just before stall, evidenced by the considerable oscillations in the drag and lift curves. Only the analysis of a representative ensemble of realisations would allow for a rigorous comparison of the flow features in this regime, which is computationally unfeasible. Beyond the integral quantities, we also compare the spatiotemporal evolution of the onset of dynamic stall between Case I and the reference. The variation of the span-averaged friction coefficient  $c_f$ shown in figure 6(a) compares favourably with the corresponding case in Sharma & Visbal (Reference Sharma and Visbal2017) (figure 8a in the reference), not only with respect to the macroscopic development of the dynamic stall process but also in more minute details of the flow dynamics around the DSV (when comparing, note that the simulations in the reference start at $\alpha = 4^\circ$). In particular, the bursting of the LSB starts at around $\alpha =10^\circ$ (slightly earlier than stated in the reference) with a comparatively smooth elongation that then transitions to the DSV at around $\alpha = 14^\circ$. At the very beginning of the elongation of the separation bubble ( $\alpha \approx 11^\circ$), the skin friction plots show evidence of vortex shedding from the LSB which are not as clearly seen in the reference. This shedding quickly subsides as the bubble bursts ( $\alpha \approx 12^\circ$ and onward). Once the DSV is formed it moves downstream at a constant rate and feeds a secondary separation behind it that exhibits strikingly similar traces in the skin friction compared with the reference.
Space–time diagram of the span-averaged friction coefficient  $\langle c_f \rangle _z$ on the suction side of the airfoil during the pitch-up motion. Red (blue) colours represent positive (negative) shear stresses. The black lines indicate the average first separation and last reattachment point of the boundary layer ( $\langle c_f \rangle _{z,\Delta _t} = 0$ with $\Delta t U/c \approx 0.02$). Here (a) Case I; (b) Case II. The dashed line is a copy of the average reattachment line in (a). The flow is from left to right in both cases.

This good agreement between the case at  ${Tu} = 0.02\,\%$ and the reference based on a completely different numerical framework is a validation of the numerical method and set-up used in the present work. At the same time, the comparison shows that for applications in very low free stream disturbance environments their detailed inclusion in high-fidelity simulations has only a small influence.
5.2. Effect of low-amplitude background disturbances
Returning to the drag, lift and moment curves in figure 5 and comparing the results for the different disturbance levels (red and blue curves), we observe that while the aerodynamic coefficients evolve nearly identically up to  $\alpha = 20^\circ$, the lift stall in the case with more perturbed inflow (Case II, blue) exhibits essentially identical timing for the onset (a delay of only $0.3^\circ$) and subsequently slightly higher peak drag and lift.
Figures 6 and 7 show the evolution of the span averaged friction and pressure coefficient, respectively, for Cases I and II. The plots show that the dynamic stall process is similar for both cases indicating that the macroscopic dynamics are independent of the details of the low amplitude free stream disturbances, which is in line with the trends found in the aerodynamic force histories. Nevertheless, the details of the stall onset and in particular the breakdown of the LSB and the boundary layer dynamics are visibly affected by the increased disturbance level.
Space–time diagram of the span-averaged pressure coefficient  $\langle c_p \rangle _z$ on the suction side of the airfoil during the pitch-up motion. Here (a) Case I; (b) Case II. The black lines are the same as in figure 6.

The overall smoothness of the friction and pressure data in Case I contrasts with the results for Case II (figure 6b). At the higher disturbance level, the energetic vortex shedding that was foreshadowed in Case I at the onset of the LSB bursting is now much more prominent, to the point of being the dominant feature in the skin friction data during the initial phase of dynamic stall ( $1 \leq tU/c \leq 2$). This vortex shedding is seen to hasten the formation of the DSV that coalesces already at $tU/c = 2$ $(\alpha =13.4^\circ )$. Furthermore, the downstream motion of the DSV is more jagged and the vortex itself is overall less coherent, evidenced by the wider negative shear-stress region. It is interesting to note that the minimum value of the pressure coefficient is lower for Case I despite the intermittent peaks in skin friction being higher for Case II, which are likely due to a generally increased level of turbulence in the separated region. In Case II, the DSV also interacts more strongly with the separated region in its wake and we see intermittent high wall shear-stress events (e.g. at $tU/c = 3.0$) that are linked to the impingement of turbulent eddies on the wall.
Comparing the macroscopic development of DSV in both cases we observe that the two cases seem to converge as the vortex reaches the trailing edge. The increased background disturbance level apparently mainly influences the details of the boundary layer dynamics and the LSB bursting whereas the DSV itself and the overall dynamic stall process seem rather unaffected. This conclusion is in line with the findings in McCroskey (Reference McCroskey1981) concluding that, once initiated, the events during dynamic stall tend to be independent of the details of the airfoil motion, which also affects the local boundary layer development.
Figures 8 and 9 show the contours of the span-averaged  $U_y$-velocity component in the vicinity of the airfoil and the instantaneous $\lambda _2$-structures, respectively, at three instants during the stall process. In each figure, panels (a,b) correspond to $tU/c = 0.5$, before the onset of dynamic stall, where the two cases are very similar, in line with the preliminary study of the stationary precursor simulations (Kern et al. Reference Kern, Hanifi and Henningson2022). The plots also show the typical transition mechanism in LSBs in low disturbance environments starting with quasi-2-D spanwise rolls, generated by the inviscid KH instability on the separated shear layer, that subsequently distort and harbour secondary instabilities at higher spanwise wavenumbers that lead to the rapid disintegration of the coherent rolls into small-scale turbulence. The structures evidenced by the $\lambda _2$-isosurfaces, shown in close-up in figure 10 for the two cases, exhibit a striking similarity to results in Jones, Sandberg & Sandham (Reference Jones, Sandberg and Sandham2008) (see figure 11 in their paper) and Yang & Abdalla (Reference Yang and Abdalla2019, figure 10), the latter identifying the streamwise elongated structures as secondary instabilities of the KH rolls. A close comparison of the two cases shows a more rapid transition process in figure 10(b), corresponding to Case II with the higher disturbance amplitude, where the quasi-two-dimensionality and spanwise coherence of the KH rolls appears to be lost faster, fuelled by the free stream disturbances. Returning to figure 9, the snapshots in panels (c,d) are taken during the bubble bursting at $tU/c = 1.5$. Figure 9(e, f) corresponds to snapshots taken after the DSV has formed ( $tU/c = 2.5$) and the separated region covers a considerable part of the airfoil. The plots show the highly turbulent flow in the separated region in the wake of the DSV including, in figure 9(b,d, f), the eddy responsible for the spike in the wall skin friction.
Contours of the  $U_y$-velocity component in the cropped domain $(x/c,y/c) \in [-0.1,0.5]\times [-0.1,0.15]$, averaged over the span and the time interval $\Delta t_{2D}U/c$ for Cases (a,c,e) I and (b,d, f) II before (a,b), during (c,d) and after (e, f) the bursting of the LSB. The colour scale is cropped at $U_y \in [-0.5, 2.5]$ (blue to red) for clarity. The flow is from left to right. Here (a) Case I, $tU/c = 0.5, \alpha = 9.12^\circ$; (b) Case II: $tU/c = 0.5, \alpha = 9.12^\circ$; (c) Case I, $tU/c = 1.5, \alpha = 11.99^\circ$; (d) Case II, $tU/c = 1.5, \alpha = 11.99^\circ$; (e) Case I, $tU/c = 2.5, \alpha = 14.85^\circ$; ( f) Case II, $tU/c = 2.5, \alpha = 14.85^\circ$.

Isosurfaces of the instantaneous  $\lambda _2$-structures coloured by streamwise velocity $U_x$ on the suction side of the airfoil for $x/c \leq 0.4$ at the same instants as figure 8. Here (a,c,e) Case I; (b,d, f) Case II. The streamwise velocity (from blue to red) is cropped at $U_x \in [-1,3]$ with $U_x/U = 1$ corresponding to green. Here (a) Case I, $tU/c = 0.5, \alpha = 9.12^\circ$; (b) Case II, $tU/c = 0.5, \alpha = 9.12^\circ$; (c) Case I, $tU/c = 1.5, \alpha = 11.99^\circ$; (d) Case II, $tU/c = 1.5, \alpha = 11.99^\circ$; (e) Case I, $tU/c = 2.5, \alpha = 14.85^\circ$; ( f) Case II, $tU/c = 2.5, \alpha = 14.85^\circ$.

Close-up of the transition process in figure 9(a,b). Here (a) Case I,  $tU/c = 0.5, \alpha = 9.12^\circ$; (b) Case II, $tU/c = 0.5, \alpha = 9.12^\circ$.

5.3. Generation of the statistical ensemble and data collection
For the statistical analysis of the flow during the incipient dynamic stall, a population of 25 separate simulations of the pitch-up motion in Case II are performed, with a focus on the vortex shedding during the bursting of the LSB at higher disturbance levels. Due to the prohibitive cost of such a large number of fully resolved DNS computations, the statistical ensemble is generated by running multiple realisations of the flow at a lower polynomial order of  $N = 5$, but with an otherwise identical set-up. As the equations are solved using the SEM, this corresponds to $p$-coarsening, where the finite-element mesh is unchanged but the order of the polynomial basis expansion within each element is reduced. This guarantees uniform coarsening and does not affect the integration order. The main difference lies in the implicit relaxation term filtering, which is designed to act on the highest wavenumbers in modal space, i.e. on the coefficients of the highest-order expansion polynomials. While the filtering is identical in both simulation set-ups, the reduction of the polynomial order implies that a larger part of the energy is filtered throughout the computational domain. As the mesh was designed for DNS resolution in the LSB at polynomial order $N=7$ with negligible filtering in the region of interest, the ensemble simulations are well-resolved large-eddy simulations where only the highest resolved frequencies are implicitly filtered for numerical stability, which is supported by the very good overall agreement between the simulations. Reducing the polynomial order decreases the computational cost to such a degree that a single DNS of the flow case at polynomial order $N = 7$ has approximately $70\,\%$ of the computational cost of the 25 simulations of the statistical ensemble in terms of core hours.
The initial condition for each realisation of the ensemble is a snapshot of the full flow field sampled from the precursor simulation used for the DNS (taken from Kern et al. (Reference Kern, Hanifi and Henningson2022), Case II; see also § 3.2 for details). In order to obtain a dataset of statistically independent realisations, the initial conditions are sampled from the precursor simulation at constant intervals of  $\Delta t_i U/c = 0.04$ covering most of the precursor simulation. While this separation does not avoid large-scale correlations of the far field that are of the order of the convective time scale, the dynamics of the separation bubble, that have much shorter time scales, are uncorrelated. In each realisation of the dataset, the flow is simulated for $2.52$ convective times (corresponding to a final angle of attack of $\alpha \approx 14.6 ^\circ$ where the airfoil is in full stall) and the full flow fields are saved every $\Delta t U/c = 0.0011$ yielding 2400 snapshots.
As the vortex shedding is confined to a comparatively small region of the flow close to the leading edge, the flow data is interpolated onto a smaller mesh covering only the volume of interest using spectral interpolation, thus considerably reducing the computational cost of the statistical analysis. The interpolating mesh has a resolution of  $648 \times 100 \times 64$ points in the streamwise, wall-normal and spanwise directions, respectively. Taking advantage of the spatial homogeneity in the spanwise direction, the data is sampled at equidistant points along the span and Fourier transformed prior to further analysis, which is then carried out on individual 2-D Fourier modes. A slice of the interpolating mesh used for the preprocessing and data collection is shown in figure 11 (red) compared with part of the mesh close to the airfoil leading edge used for the simulation (grey).
A 2-D slice of the simulation mesh close to the airfoil in grey (only spectral elements are shown, grey) overlaid with a slice of the interpolating mesh in red (only every  $12{\text {th}}$ (third) point is shown in streamwise (wall-normal) direction).

5.4. Statistical ensemble of realisations of Case II
In this section, we analyse the dataset from § 5.3 in relation to the DNS results, before switching to a fully statistical approach in § 6. To put the data into perspective, figure 12 compares the aerodynamic coefficients for each of the realisations in the ensemble (grey) as well as the ensemble average (black) with the data from the two DNS computations (colour) discussed in the previous sections. Note that the aerodynamic coefficients are computed on the original domain before interpolation. As expected for integral quantities, we observe very good agreement in spite of the slightly lower resolution, with slightly lower variations over time than in the DNS computations. In the following, we focus mainly on the coefficient  $c_f$ on the airfoil surface, given by the skin friction normalised by the far field dynamic pressure $\tfrac {1}{2}\rho U^2$, which can be compared with the corresponding DNS data in figure 6. In direct comparison, note that the DNS simulations have considerably smaller spatiotemporal domain than the statistical ensemble which focuses exclusively on the onset of dynamic stall close to the leading edge. The wall stresses (including contributions from both friction and pressure) encapsulate much of the flow dynamics relevant to aerodynamics and are thus a reference metric that is widely used (Benton & Visbal Reference Benton and Visbal2019). Since the friction and pressure maps are very similar, we show only the data for the skin friction coefficient $c_f$.
Comparison of the span-averaged aerodynamic coefficients during the pitching motion of the DNS runs for Cases I and II (red and blue, respectively) with the ensemble realisations (grey) and the ensemble average (black). (a) Span-averaged drag coefficient  $c_D$. (b) Span-averaged lift coefficient $c_L$. (c) Span-averaged moment coefficient around the quarter-chord $c_M$. Note that the plots only show the time interval covered by the ensemble simulations, which are much shorter than the DNS runs as indicated by the grey boxes in the corresponding plots in figure 5.

The average of the  $c_f$ over the span and all realisations is shown in figure 13(a). The space–time ensemble average of the population retains many of the features of the realisations indicating that the overall flow features are captured by the ensemble average. The three main features of leading-edge dynamic stall can be identified, namely (i) the initial phase with the small LSB with turbulent reattachment ( $tU/c<1$) similar to the statistically stationary case; (ii) the bursting of the LSB ( $1< tU/c<2$); (iii) the formation, growth and subsequent downstream movement of the DSV ( $tU/c>2$).
Space–time diagrams of the span-averaged wall skin friction coefficient ( $c_f$) on the suction side of the airfoil near the leading edge for $k_z = 0$. The flow is from left to right and the domain extent as well as the colour scale are the same in all figures. (a) Ensemble average. The black line is the average zero contour. (b,c) Full realisations no. 9 and no. 16, respectively. The black line is the same as in (a) for reference. (d) Fluctuations around the ensemble average for all realisations in the dataset.

A close inspection of the ensemble average shows a strong vortex that is shed from the leading edge at startup, evidenced by a strongly localised disturbance of the friction coefficient in the LSB near  $(x,t) = (0.1,0)$, and travels through the entire domain. This structure is numerical in nature and is due to a combination of a single-file restart (i.e. low temporal accuracy for the first two time steps while ramping up to the third-order backward differencing scheme employed for the time stepping) and the fact that the initial conditions are interpolated from the precursor simulation run at higher polynomial order (on the same spectral element mesh). The appearance of this artefact of the employed restart method shows the dynamical sensitivity of the separation bubble to the simulation details. In fact, the mere change of polynomial order leads to earlier transition and an overall shortening of the LSB (by approximately $15\,\%$) which can be seen by comparing the average reattachment point of the boundary layer at $tU/c=0$ with $tU/c=0.25$. As this vortex appears identically in the entire population it contributes nearly exclusively to the ensemble average and is to first order inconsequential for the fluctuations.
The ensemble average can then be compared with the full realisations nos. 9 and 16 shown in figure 13(b,c). We see that the laminar flow region is essentially unchanged whereas turbulent regions show larger deviations (the comparison with other realisations is similar). In particular, the DSV develops earlier or later compared with the mean, evidenced by the shift in the mean reattachment line, particularly evident for realisation no. 16. While the size of the LSB is comparable during the initial phase, the largest discrepancies appear during the bubble-bursting process. The ensemble average shows a smooth elongation of the LSB merging into the DSV, which contrasts with the individual realisations where energetic vortex shedding from the bursting bubble has clear traces in the wall stress data.
To put the details of the particular realisations into context and to provide an overview of the full dataset, the fluctuations in span-averaged  $c_f$ around the ensemble average are shown in figure 13(d) for each realisation, which showcases the variability within the ensemble. The plots of the fluctuations hint at the complexity of the dynamics at all scales from the formation and downstream movement of the DSV itself to the small, backward propagating waves in the separated region during the bubble bursting. Note that the same colour scale is used in all figures, i.e. the fluctuations are of the same order as the mean in most realisations. In particular, during the bursting of the separation bubble, the fluctuations have a large magnitude and considerable spatiotemporal coherence which we will exploit to extract and analyse these structures using the space–time POD framework.
Figure 14 shows instantaneous flow visualisations of realisation no. 16 at four different points during the development of dynamic stall focusing on the bursting of the LSB that can be compared directly with the span averaged  $c_f$ data in figure 13(c). The first snapshot is taken before the LSB bursts, clearly showing the rapid transition of the free shear layer after separation, typical for low free stream turbulence environments. The shear layer rolls up into approximately spanwise rolls due to the inviscid KH instability that subsequently undergo spanwise modulation via a secondary instability and quickly degenerate into small-scale turbulence leading to the reattachment of the turbulent boundary layer. It is interesting to note that the KH vortices, which are dominant structures when considering the entire flow field (in terms of variance of the kinetic energy captured via spectral POD (Kern et al. Reference Kern, Hanifi and Henningson2022)), do not have a significant signature in the wall skin friction coefficient. This is due to the fact that they develop on the upper side of the LSB from which the wall is shielded by the turbulent recirculation region. The subsequent snapshots are taken during the bursting of the LSB that culminates in the formation of the DSV which can clearly be seen in figure 14(d). In the instants leading up to the DSV formation, we observe clear signs of the energetic vortex shedding in the spatial variation of the turbulent region in the boundary layer due to turbulent entrainment at the scale of the entire bursting separation bubble. At the same time, the vortex shedding, while it has large-scale coherence, is superimposed with considerable turbulent fluctuations of different scales. A statistical analysis of the flow data can therefore be used to strip the coherent structures of the random fluctuations and distil the essential features of the wave trains.
Snapshots of the instantaneous  $\lambda _2$-isosurfaces computed from realisation no. 16 coloured by the streamwise velocity component $U_x$ during incipient dynamic stall. The colour scale goes from $U_x = -2$ (blue) to $U_x = 4$ (red), centred on the free stream velocity $U_x = 1$ (green). The flow is from left to right and the coordinate system for the visualisation rotates with the airfoil. Here (a) $tU/c = 0.5$, $\alpha = 9.12^\circ$; (b) $tU/c = 1.5$, $\alpha = 11.99^\circ$; (c) $tU/c = 1.75$, $\alpha = 12.70^\circ$; (d) $tU/c = 2.0$, $\alpha = 13.42^\circ$.

6. Spatiotemporally correlated structures using space–time POD
6.1. Application of the space–time POD formulation on dynamic stall data
We now introduce the computational algorithm employed in the application of the space–time POD method for the present case, in a procedure analogous to space-only POD.
The analysis starts with the definition of two domains of integration as described in § 4.3:  $\varOmega ^\prime \equiv X \times T$, containing the whole spatiotemporal domain of the simulations (all data points in space and time); and $\varOmega \equiv X_{wall} \times T$ defined in the same time interval but only containing points over the airfoil wall. Next, we compute zero-mean velocity fluctuations,
 \begin{equation} \boldsymbol{u}^\prime(\boldsymbol{x},t) = \boldsymbol{u}(\boldsymbol{x},t) - \boldsymbol{E}\{\boldsymbol{u}(\boldsymbol{x},t)\}, \end{equation}
and zero-mean wall stress data containing the fluctuation signals of pressure and friction coefficients on the airfoil surface, given, respectively, by
 \begin{equation} c_p^\prime(\boldsymbol{x}_w,t) = c_p(\boldsymbol{x}_w,t) - \boldsymbol{E}\{c_p(\boldsymbol{x}_w,t)\} \end{equation}
and
 \begin{equation} c_f^\prime(\boldsymbol{x}_w,t) = c_f(\boldsymbol{x}_w,t) - \boldsymbol{E}\{c_f(\boldsymbol{x}_w,t)\}. \end{equation}
Given the ubiquity of applications of the more common space-only POD, where the mean of the realisations is in practice obtained using uncorrelated snapshots in time of the stationary process thus implicitly invoking a time average, we stress that in the context of space–time POD, the mean denotes the average over separate realisations of the full spatiotemporal evolution of the flow and the fluctuations are therefore the deviations (in space and time) of each realisation with respect to this average.
With these values, we construct the velocity data matrix
 \begin{equation} \mathsf{U}=\left[\begin{array}{cccc} \mid & \mid & & \mid \\ \boldsymbol{u}^\prime_1 (\boldsymbol{x},t) & \boldsymbol{u}^\prime_2 (\boldsymbol{x},t) & \cdots & \boldsymbol{u}^\prime_{N_r} (\boldsymbol{x},t) \\ \mid & \mid & & \mid \end{array}\right], \end{equation}
of size  $3N_{\varOmega ^\prime }$-by- $N_r$, where $N_{\varOmega ^\prime }$ is the total number of points in $\varOmega ^\prime$, and the wall stress data matrix
 \begin{equation} \mathsf{Q}=\left[\begin{array}{cccc} \mid & \mid & & \mid \\ c_{f_1}^\prime (\boldsymbol{x}_w,t) & c_{f_2}^\prime (\boldsymbol{x}_w,t) & \cdots & c_{f_{N_r}}^\prime(\boldsymbol{x}_w,t) \\ \mid & \mid & & \mid \\ \mid & \mid & & \mid \\ c_{p_1}^\prime (\boldsymbol{x}_w,t) & c_{p_2}^\prime (\boldsymbol{x}_w,t) & \cdots & c_{p_{N_r}}^\prime (\boldsymbol{x}_w,t) \\ \mid & \mid & & \mid \end{array}\right], \end{equation}
of size  $2N_{\varOmega }$-by- $N_r$, where $N_{\varOmega }$ is the number of points in $\varOmega$. Since $2N_{\varOmega } \gg N_r$, the snapshot method (Sirovich Reference Sirovich1987) is employed. We compute the correlation matrix in the space spanned by the rows of the wall stress data matrix
 \begin{equation} \mathsf{M} = \frac{1}{N_r} \mathsf{Q}^* \mathsf{W} \mathsf{Q} \end{equation}
with  $\{\cdot \}^*$ denoting the conjugate transpose and $\mathsf {W}$ denoting the diagonal positive-definite matrix containing spatiotemporal quadrature weights. The eigenvectors, $\mathsf{\varTheta }$, and the eigenvalues, $\mathsf {\varLambda }$, of $\mathsf {M}$ are, respectively, the space–time POD expansion coefficients and the energies associated with each mode. The space–time POD modes, $\mathsf {\varPhi }$, of the wall stress data are consequently obtained via the relation
 \begin{equation} \mathsf{\varPhi} = \frac{1}{\sqrt{N_r}} \mathsf{Q} \mathsf{\varTheta} \mathsf{\varLambda}^{{-}1/2}. \end{equation}
 Finally, considering the properties exposed in § 4.3, the extended space–time POD modes,  $\mathsf {\varXi }$, of the full velocity field are simply given by
 \begin{equation} \mathsf{\varXi} = \frac{1}{\sqrt{N_r}} \mathsf{U} \mathsf{\varTheta} \mathsf{\varLambda}^{{-}1/2}. \end{equation}
6.2. Convergence study
Before analysing the results of the space–time POD, the question of convergence of the individual modes needs to be addressed, especially considering the small sample size of the present dataset. The convergence study in this work follows the method proposed by Hekmati, Ricot & Druault (Reference Hekmati, Ricot and Druault2011) and only considers convergence with respect to the number of independent realisations, which is the only restrictive parameter in this study. The convergence study consists of performing space–time POD analyses of all columns of  $\mathsf {Q}$ (as defined in § 6.1) serving as a reference labelled $r$ and reduced datasets where some realisations have been removed. This is done in order to compute the correlation coefficient between the resulting $n{\text {th}}$ POD modes from the full dataset and reduced datasets, ordered in the standard fashion according to the magnitude of the associated eigenvalue. The reduced datasets are labelled according to the number $k$ of removed realisations. Using the notation of this paper, the cross-correlation coefficient is defined as (Hekmati et al. Reference Hekmati, Ricot and Druault2011)
 \begin{equation} C_k^{(n)} = \frac{\langle \boldsymbol{\phi}_n^r, \boldsymbol{\phi}_n^k \rangle_{X \times T}}{\sqrt{\vphantom{\boldsymbol{\phi}_n^k} \langle \boldsymbol{\phi}_n^r, \boldsymbol{\phi}_n^r \rangle_{X \times T}} \sqrt{\langle \boldsymbol{\phi}_n^k, \boldsymbol{\phi}_n^k \rangle_{X \times T}}} . \end{equation}
Due to the small number of realisations in the dataset that therefore is more sensitive to outliers, we perform the same convergence study on a number of random permutations of the dataset in order to be able to assess the impact of specific realisations on the dominant POD modes. The cross-correlation coefficients for the first three POD modes as the dataset is reduced are shown in figure 15. The three examples show different random permutations of the realisations that are representative of the variability of the data. We see that, in spite of the small size of the dataset, the first mode seems well converged. The strong variations of the cross-correlation coefficient for modes 2 and 3 on the other hand indicate that they are not well converged and that their spatiotemporal structure crucially depends on the inclusion/omission of particular realisations.
Convergence study of the POD of the full wall stress data. The colours refer to the considered permutations, i.e. in which order the realisations are removed from the ensemble before computing the POD. The first six realisations of each permutation are  $21,2,23,11,15,10$ (red), $24,17,16,21,2,3$ (blue) and $19,16,3,11,10,24$ (yellow).

6.3. Wall stress space–time POD results
A naïve application of the space–time POD framework to the full velocity field is not useful in the quest to identify the vortex-shedding events during the bursting of the LSB. Indeed, the dominant structures in terms of the fluctuation of turbulence kinetic energy (the natural measure arising from the inner product) are the KH vortices that are visible in the flow visualisations in figure 9 and the DSV at later stages of the simulations (not shown), which were also identified in the spectral POD analyses performed on the precursor simulations at constant angle of attack (Kern et al. Reference Kern, Hanifi and Henningson2022). Since we are aiming to extract the coherent vortex shedding during the LSB bursting, we instead choose to perform the analysis on the full wall stress data (including both skin friction and pressure contributions) where the vortex shedding is a dominant feature making its extraction feasible even with a small dataset. This restriction all but removes the KH rolls from the analysis since, as we noted earlier, their signature at the wall is negligible.
As a first step, we perform space–time POD for  $k_z = 0$ without the mean (i.e. only the fluctuations, as shown in figure 13(d) for $c_f$). The same analysis is also performed for $k_z > 0$ but the data revealed little spatiotemporal coherence. For completeness, an example of the results of the POD are shown in Appendix B.
The space–time POD spectrum for  $k_z = 0$ considering the full wall shear data is shown in figure 16(b). The dominant mode, depicted in figure 16(a), which we have shown to be robust to variations of the dataset size, is associated with the fluctuations of the DSV, in particular, an earlier or later formation of the vortex core which, once formed, has a similar spatiotemporal development in all realisations. The projection of the realisations on the dominant mode, shown in the lower plot in figure 16(b), quantifies the proportion of the variance that can be explained with the considered mode. Realisations with large projections on the dominant mode, like for realisations nos. 2, 9, 16 and 17, are representative of the most common spatiotemporal variation in the DSV formation and movement. In order to understand the dynamic significance of mode 1 it is useful to consider a low-order reconstruction of the flow using only the mean and the dominant mode, as shown in figure 17 for realisations no. 9 and 16, which have a strong positive and negative projection onto the dominant mode, respectively. We see that, the positive projection onto the first mode leads to an earlier generation of the DSV and the negative projection delays its formation. This is specially apparent in figure 17(a) showing a snapshot of the instantaneous friction coefficient at $tU/c = 2.0$, showing that the backflow region (negative $c_f$), that corresponds to the strengthening DSV and has a similar shape in all cases, is shifted progressively downstream going from realisation no. 6 via the ensemble average to realisation no. 9.
Space–time POD modes of the full wall stress data (only the friction coefficient is shown). (a) Space–time plot of the leading mode. The black line indicates the zero contour of the mean. (b i) Normalised POD spectrum. The horizontal dashed line indicates the mean, which corresponds to the spectrum of uncorrelated data. (b ii) Normalised projection of the mode on each realisation. (c,d) Space–time plot and projection for the third mode.

Low-order reconstruction of flow realisations using the average (figure 13a) and the first space–time POD mode (figure 16a). Panel (a) compares the skin friction coefficient of the ensemble average and the reconstructions at  $tU/c=2.0$. Panels (b,c) show the low-order reconstruction, respectively, of realisations no. 9 and no. 16, which can be directly compared with figure 13(b,c).

Conversely, a small projection on the dominant eigendirection is not necessarily an indication that the corresponding realisation has a similar spatiotemporal evolution as the mean. For example, realisation no. 20 has essentially no correlation with the dominant mode because in that realisation the DSV forms at the same time as in the average but strongly fluctuates in strength as it moves downstream. While the dominant and subdominant modes are mainly localised on the DSV, which is the most energetic structure in the dataset, the vortex shedding during the bubble bursting process is captured by the third mode shown in figure 16(c). Given the low confidence in the convergence of its spatial structure indicated by the convergence study, a detailed analysis of this directly computed mode is not attempted. The convergence analysis for this mode clearly shows that the mode is highly influenced by specific realisations, e.g. the fifth realisation to be removed in the permutation no. 3 (yellow) (see figure 15). The corresponding realisation is no. 19, which indeed exhibits a particularly strong vortex shedding. The effect of the omission of e.g. realisation no. 2 is similar. While the present dataset is too small to make accurate statements on the statistical predominance of the vortex shedding in an arbitrary realisation of the flow case, we can extract the corresponding structures as they appear in the present dataset.
In order to isolate the vortex shedding from the fluctuations of the DSV, we choose to perform space–time POD on a subset of the data focusing on different regions of interest separately. In the first step, we attempt to extract the structures of the vortex shedding during the LSB bursting by considering a slanted window in the space–time plot. Since the wave trains have a convection speed that is considerably higher than that of the downstream movement of the DSV, we can use their mean convection speed  $U_c = 0.55 U$ to define the slanting angle of the window, starting at the leading edge at $tU/c$ $\in [1,1.5]$, that covers the region most affected by the vortices. In this fashion, we can essentially remove the influence of the DSV from the correlations. The resulting POD analysis is shown in figure 18(a,b). We observe that the spectrum of the localised space–time POD identifies the vortex shedding in the dominant mode which is associated with a larger relative eigenvalue. In the considered region, the wave trains are the dominant coherent structure.
Dominant mode of the space–time POD on the subset of the stress data defined by the dashed boxes, corresponding to the vortex shedding (a,b) and the DSV (c,d). (a,c) Space–time plot of the wall shear-stress. The black line indicates the zero contour of the mean. (b,d) Normalised POD spectrum (b i,d i) and normalised projection of the mode on each realisation (b ii,d ii). The horizontal dashed line indicates the mean, which corresponds to the spectrum of uncorrelated data.

As a second step and a cross-check, we also isolate the main fluctuations of the DSV itself. We localise the POD domain on the vortex by considering a window slanted instead with  $U_c = 0.3 U$, starting at the leading edge at $tU/c = 1$, which cuts off the wave trains. The results of the POD are shown in figure 18(c,d). We see that the spatial structure of the first mode of this reduced dataset is essentially identical to that of the first mode computed using the full dataset, which confirms that the fluctuations pertaining to the DSV are the dominant structures overall. At the same time, restricting the domain allows us also in this case to obtain a better separation of the leading eigenvalues in the spectrum indicating that the mode is more dominant in the subset compared with the full dataset.
6.4. Extended space–time POD and reconstruction of the velocity field
Now that we have extracted the correlations pertaining to the effect of the vortex shedding on the wall stress data, we use the extended POD method, as described in § 6.1, to reconstruct the part of the velocity field that is directly correlated with the corresponding wall stress events. This approach also has two other practical benefits. Considering the effects on the wall and extending the local correlations to the full flow field, on the one hand, is a typical situation in flow experiments where sensors are often placed over the airfoil surface, and, on the other hand, leads to a considerable reduction of the problem dimensionality and hence a computationally cheaper POD analysis.
The extended POD modes representing the full field flow structures correlated with the high wall-stress events are, by construction, 2-D in space ( $k_z = 0)$ and evolve in time. Snapshots of the spatial structure of the mode in the flow field are shown in figure 19(b) for four different time instants indicated by dashed lines in the space–time diagram in figure 19(a). We can see that the wave trains that are shed from the LSB have a clear correlation across the entire separated flow region that was already hinted at by the large-scale deformations of the turbulent boundary layer in figure 9. We note that the vortices exhibit strong correlation only in the fully turbulent part of the boundary layer and are thus weakly correlated with the dynamics in the laminar and transitional parts of the bubble. Furthermore, the vortical structures seem to grow with the boundary layer that becomes noticeably thicker even before the DSV starts forming. Especially during the earlier stages of the bursting ( $tU/c = t_2$) we can also notice a variation of the shapes of the vortices as they are convecting downstream. Indeed, close to their formation ( $x \approx 0.1$), the vortices appear to lean backwards, against the mean shear of the reattaching turbulent boundary layer. Reminiscent of the well-known Orr mechanism in parallel shear flows, the vortices grow in strength as they straighten and convect downstream, feeding off of the mean shear. After $x\approx 0.25$ the vortices are more round, spread-out and are decaying. At $tU/c=t_3$, similar dynamics are at play but the spatial amplification of the sheared vortices is stronger and the location of the maximum has moved downstream to $x \approx 0.3$. The process continues up until the gradual formation of the DSV interrupts the vortex shedding. The evolution of the kinetic energy of the reconstructed extended POD mode over time is shown in figure 20. We can clearly see the lack of coherence prior to the correlation region (grey area), the rapid energy growth of the vortices that reach their maximum amplification close to $tU/c = t_3$ before the sharp decay that heralds the formation of the DSV.
Extended space–time POD. (a) Space–time diagram of the dominant space–time POD mode of the wall shear-stress of figure 18(a), extended to the full airfoil surface. The black dashed lines indicate instants in time  $t_i$ for which the $U_y$-velocity component of the same space–time POD mode, extended to the full 3-D domain, is shown in (b). An animation of the dominant space–time POD mode is available in the supplementary material (movie 1) available at https://doi.org/10.1017/jfm.2024.314.

Evolution of the kinetic energy of the extended POD mode over time. The shaded area indicates the temporal correlation domain for the POD mode of the wall stress data and the dashed lines indicate the time instants for which the mode structure is shown in figure 19.

7. Conclusion
The influence of low levels of background disturbances on the onset of dynamic stall on a NACA0009 airfoil in constant-rate pitch-up motion from a statistically steady state at an angle of attack of  $\alpha = 8^\circ$ is investigated by means of DNS of the LSB close to the leading edge that bursts and thus initiates stall. Two background disturbance levels are chosen based on the turbulence intensity upstream of the leading edge – ${Tu} = 0.02\,\%$ and ${Tu} = 0.05\,\%$ – both corresponding to low disturbance environments typical of low turbulence intensity academic wind tunnels and aircraft cruise conditions, respectively.
In spite of the small absolute difference in the disturbance amplitudes, the dynamics of the flow evolution differs between the two considered cases. The results for the case with the lower amplitude disturbances and a comparable computation in the literature (Sharma & Visbal Reference Sharma and Visbal2017) using a different numerical method with no external disturbances are in very good agreement, in particular during the initial phase of the pitch-up and the bursting of the LSB. The overall development of dynamic stall as well as details of the span-averaged skin friction and pressure coefficient histories compare well, validating the numerical methods in the present work. At the same time, the similarity of the computations shows that disturbances with such a low amplitude do not influence the onset of dynamic stall considerably. The comparison between the two DNSs at different levels of free stream disturbances shows a similar overall stall development but with considerable differences in the details of the boundary layer dynamics during incipient dynamic stall and a less smooth formation and downstream movement of the DSV. The dominant feature of this case is the emergence of strong coherent vortex shedding during the bursting of the LSB which has not been documented during incipient dynamic stall before. The present high-fidelity simulations provide strong evidence that the flow at incipient dynamic stall involving LSBs leads is highly sensitive even to levels of free stream disturbances that are traditionally considered essentially laminar, which needs to be considered in detailed comparisons with experimental data as well as in numerical simulations in this flow regime.
In order to ascertain the statistical relevance of the transient vortex shedding, an ensemble of 25 well-resolved implicit large-eddy simulations of the flow case is generated. The ensemble average clearly identifies the three key components of the leading-edge dynamic stall, namely the existence of a short LSB close to the airfoil leading edge, its eventual bursting and the subsequent formation of the DSV. The vortex shedding found in the DNS appears in a large number of realisations showing that it is a statistically relevant dynamical feature of the bursting of the LSB in the presence of low-amplitude free stream disturbances.
Using space–time POD, a formulation of POD that removes the requirement of statistical stationarity, we extract the spatiotemporal structure of the vortex shedding from the dataset of the non-autonomous flow data. Since these wave trains leave a clear trace in the wall stresses on the airfoil surface, the space–time POD analysis of the corresponding data is combined with extended POD in order to reconstruct the components of the full flow field around the airfoil leading edge that are correlated with the wall stress data. This approach allows the transient dynamics of the vortex shedding to be distilled from the data in spite of the small number of available flow realisations. The reconstruction of the wave trains involved in the vortex shedding, although locally turbulent, exhibit a large-scale coherent evolution that is reminiscent of transient energy growth in wall bounded shear layers via the linear Orr mechanism. This example shows the potential of the space–time POD methodology to act as an objective tool for the extraction of coherent flow features from non-autonomous flow data which is applicable to both experimental and numerical datasets. The ability to extract the transient flow features during incipient dynamic stall is fundamental for their subsequent analysis and characterisation and is the first step to determine their role in the onset of dynamic stall under the influence of background disturbances.
Supplementary movie
Supplementary movie is available at https://doi.org/10.1017/jfm.2024.314.
Funding
Financial support for this work was provided by the European Research Council under grant agreement 694452-TRANSEP-ERC-2015-AdG. D.C.P.B was sponsored by FAPESP (São Paulo Research Foundation), under grants 2019/27655-3, 2020/14200-5 and 2022/01424-8. The computations were performed on resources by the Swedish National Infrastructure for Computing (SNIC) at the PDC Center for High-Performance Computing at the Royal Institute of Technology (KTH) as well as the National Supercomputer Centre (NSC) at Linköping University (LiU).
Declaration of interests
The authors report no conflict of interest.
Appendix A. A model problem: Ginzburg–Landau equation
Before applying the space–time POD framework to the wall stress data for which the dataset is very small, we first demonstrate it using a simpler system. We choose the 1-D CGLE which is often used as a simplified model of transport-dominated systems typical of fluid dynamics problems (Bagheri et al. Reference Bagheri, Henningson, Hœpffner and Schmid2009). We test the methods presented in this text in a manner that can be readily extended to time-dependent flow problems. The simplicity of the CGLE equations has two main advantages for our purpose. On the one hand, the CGLE are amenable to analytical treatment yielding more insight in the results and on the other hand, the equations can be easily and cheaply integrated in time to yield a sufficiently large dataset for accurate statistical evaluation via the presented method.
A.1. Ginzburg–Landau formulation
In the following section, we briefly describe the classical autonomous CGLE. The nonlinear CGLE in state-space form is defined as a nonlinear system given by
 \begin{equation} \frac{{\rm d}q}{{\rm d}t} = \mathcal{A}q - |q|^2 q + \mathcal{B} f, \end{equation}
where the nonlinearity  $|q|^2 q$ saturates the output in order to avoid unbounded responses ( $q(x,t) < \infty$ as $t \to \infty$ (see Bagheri et al. Reference Bagheri, Henningson, Hœpffner and Schmid2009), the operator $\mathcal {B}$ is used to restrict the forcing to a specific region in space and $\mathcal {A}$ represents a linear operator given by
 \begin{equation} \mathcal{A} = \mu - \nu \frac{\partial}{\partial x} +\gamma \frac{\partial^2}{\partial x^2}. \end{equation}
 Within the linear operator, the complex-valued terms  $\gamma ({\partial ^2}/{\partial x^2})$ and $\nu ({\partial }/{\partial x})$ model diffusion and advection, respectively, while the real-valued parameter $\mu$ introduces exponentially evolving perturbations. Following Bagheri et al. (Reference Bagheri, Henningson, Hœpffner and Schmid2009), we define the complex parameters $\nu$, $\gamma$ and $\mu$ as
 \begin{gather} \nu= U + 2{\rm i} c_u, \end{gather}
 \begin{gather} \gamma=1+{\rm i} c_d, \end{gather}
 \begin{gather} \mu = \mu_0 + c_u^2. \end{gather}
 In order to elucidate the purpose of  $c_u$ and $c_d$, we consider the parallel linear homogeneous CGLE system
 \begin{equation} \frac{{\rm d}q}{{\rm d}t} = \mathcal{A} q \end{equation}
to which we apply the normal mode ansatz  $q = \hat {q} {\rm e}^{{\rm i} (kx -\omega t )}$ in order to write
 \begin{equation} (-{\rm i} \omega - \mu + {\rm i} k \nu +k^2 \gamma ) \hat{q} = 0 \end{equation}
implying the quadratic dispersion relation
 \begin{equation} \mathcal{D}(k,\omega) ={-}{\rm i} \omega - \mu + {\rm i} k \nu +k^2 \gamma = 0 \end{equation}
from which we isolate the frequency as
 \begin{equation} \omega = U k + c_d k^2 + {\rm i} [ \mu_0 - (k-c_u)^2]. \end{equation}
 The temporal growth of instabilities implies that  $\omega$ has a positive imaginary part
 \begin{equation} \mbox{Im} \{\omega\} > 0 \implies \mu_0 > \left(k-c_u\right)^2. \end{equation}
By isolating  $k$, we obtain the interval of amplified wavenumbers
 \begin{equation} k \in \left( c_u -\sqrt{\mu_0}, c_u +\sqrt{\mu_0} \right), \end{equation}
centred at the value of  $c_u$, for which amplification of instabilities is maximised at $\mbox {Im}\{\omega \} = \mu _0$. This property can be used to define the threshold for local stability: if $\mu _0>0$ the system is unstable, while stability is guaranteed for $\mu _0<0$. Additionally, from the dispersion relation in (A8), we deduce the relation
 \begin{equation} \frac{\partial \omega}{\partial k} = U + 2 c_d k - 2{\rm i} \left(k-c_u\right). \end{equation}
 Following the theory presented in Huerre et al. (Reference Huerre, Batchelor, Moffatt and Worster2000), we seek to describe the nature of the perturbations in the unstable region in terms of convective or absolute instabilities. Therefore, we seek the wavenumber leading to a saddle point in the  $k$ plane, such as
 \begin{equation} \frac{\partial \omega}{\partial k}(k_0) = 0 \implies k_0 = \frac{U+2ic_u}{2({\rm i}-c_d)} \end{equation}
which yields, using the dispersion relation in (A9), a unique absolute frequency given by
 \begin{equation} \omega_0 ={-} \frac{U^{2} c_{d} - 4 U c_{u} - 4 c_{d} c_{u}^{2}}{4 |\gamma|^2} + {\rm i} \left[\mu_0 - \frac{U^{2} + 4 U c_{d} c_{u} - 4 c_{d}^{2} c_{u}^{2} - 8 c_{u}^{2}}{4 |\gamma|^2} \right]. \end{equation}
 By setting  $\mbox {Im}\{\omega _0\} = 0$ in (A14), we find the threshold
 \begin{equation} \mu_t = \frac{\left( U + 2 c_d c_u \right)^2}{4 |\gamma|^2} - \frac{8 c_u^2 \left(1+c_d^2\right)}{4 |\gamma|^2} = \frac{U_{max}^{2}}{4 |\gamma|^2} - 2 c_{u}^{2}, \end{equation}
where  $U_{max} = ({\partial \omega }/{\partial k})(c_u) = U + 2 c_d c_u$. Thereby, a choice of $0 < \mu _0 < \mu _t$ produces convective instabilities, with disturbances growing downstream that are ultimately swept out of the domain, and $\mu _0 > \mu _t$ produces absolute instabilities, with disturbances propagating both downstream and upstream, thus gradually contaminating the whole spatial domain.
The considerations above clarify the function of the parameters  $c_u$ and $c_d$. While $c_u$ defines the locally most amplified wavenumber, both modulate the threshold for absolute instability.
A.2. Non-autonomous system configuration
We seek to construct a simple non-autonomous system with features analogous to the wall stress data from the dynamic stall simulations, which include changes in the amplitude of wave-like perturbations in time. For this, we consider the function
 \begin{equation} \mu(x,t) = \mu_0(x,t) + c_u^2, \end{equation}
where we define
 \begin{equation} \mu_0(x,t) = \mu_1(t) + \mu_2 \frac{(x-c(t))^2}{2} \quad \mbox{with} \ c(t) = \sqrt{\frac{\mu_1(0)-\mu_1(t)}{\mu_2/2}}. \end{equation}
 The quadratic dependence in  $x$ for $\mu$ has been employed several times in the literature (Hunt & Crighton Reference Hunt and Crighton1991; Bagheri et al. Reference Bagheri, Henningson, Hœpffner and Schmid2009; Chen & Rowley Reference Chen and Rowley2011; Towne et al. Reference Towne, Schmidt and Colonius2018). The presence of a small factor $\mu _2$ implies that the variation in $x$ is slow and the solution can be considered locally parallel, such that the instability analysis performed in the previous section still holds. For all subsequent computations, a value of $\mu _2 = -0.01$ is chosen, the negative sign ensuring that the extremum of $\mu (x,t)$ is a maximum.
The modulation of  $\mu _1$ in time is defined as
 \begin{equation} \mu_1(t) = \frac{\mu_{max}-\mu_{min}}{1+\left(\dfrac{1-\tau}{\tau}\right)^\beta}+\mu_{min}, \end{equation}
where  $\tau ={t}/{t_{max}}$ , $\beta = 8$, $\mu _{min} = 0.01$ and
 \begin{equation} \mu_{max} = \mu_t + \frac{|\sqrt{-2\mu_2 \gamma}|}{2} \cos \frac{\arg \gamma}{2}, \end{equation}
with  $\mu _{max}$ being the threshold for global instability deduced in Bagheri et al. (Reference Bagheri, Henningson, Hœpffner and Schmid2009).
This set-up casts  $\mu (x,t)$ as a parabola in space and a smooth step function in time, as seen in figure 21, with the value at the inlet $\mu (0,t) = \mu _{min} + c_u^2$ staying constant. Therefore, instabilities have a fixed growth rate at all times near the position $x=0$. At $t=0$, only the region of low $x$ is unstable. After the rapid change in $\mu$, the unstable region grows in size and a pocket of absolute instability appears around the position of maximum $\mu (x,t)$.
Example of function  $\mu (x,t)$. The region above the black line is unstable. The red line defines the region of absolute instability.

The system is integrated numerically using a Crank–Nicolson scheme with an explicit treatment of the nonlinear term,  $|q|^2 q$. Space is discretised with $x \in [0,40 ]$ in steps of $\delta x=0.05$, while time is discretised with $t \in [0,60 ]$ in steps of $\delta t=0.01$. Homogeneous Dirichlet boundary conditions are applied at both ends of the domain. A second-order upwind and a second-order centred scheme are used for the first and second spatial derivatives, respectively. The system is forced with white noise and the logical mask $\mathcal {B}$ restricts the forcing to positions $x \in [0,2]$.
Due to the quadratic dispersion relation of the CGLE, the range of possible dynamics is limited. In particular, only a single continuous range of unstable wavenumbers can be chosen. The coexistence of unstable waves in two different wavenumber ranges as in the wall stress data from the dynamic stall simulations is therefore not possible. However, this simplified model proves to be a helpful tool to understand the capabilities and limitations of the data-driven approach proposed in this work.
A.3. Application of the space–time POD framework
To apply the space–time POD formulation to the Ginzburg–Landau model we consider the parameters  $U = 4.5$, $c_u=0.6$ and $c_d = -1$, for which a realisation is shown in figure 22. The analysis is performed using a zero-mean fluctuation signal
 \begin{equation} q^\prime(x,t) = q(x,t) - \boldsymbol{E}\{q(x,t)\} \end{equation}
with the expected value operator defined in (4.12). As described in the previous section, we know from the model the range of most amplified wavenumbers, since they are shown to be centred at the value of  $c_u$. With the present methodology, we aim to extract the space–time evolution of the dominant coherent structures and identify the region in space and time where they are most likely to occur.
Space–time plot of the real part of a realisation of the CGLE system, where  $L=30$ and $U=4.5$. (a) System's response; (- -, black) unstable region; (- -, red) absolutely unstable region. (b) White noise forcing localised at $x \leq 2$.

We perform 100 runs of the system, each considered a single realisation. Since the Ginzburg–Landau equation is 1-D and complex-valued, the addition of time into the integration domain implies POD modes are bi-dimensional and complex-valued. Results for the leading, most energetic, space–time POD mode are shown in figure 23, where two metrics are shown: the normalised POD spectrum and the normalised squared magnitude of the projection of the mode onto each realisation. The first measures the relative importance of a given mode in the percentage of the total energy, with a large separation of a given mode over the rest implying the presence of a dominant coherent structure. This spectrum is compared with the mean energy (dashed line), which corresponds to the spectrum of a completely uncorrelated random process. A flat eigenvalue distribution, close to the mean, implies the lack of energetically dominant structures. The normalised squared magnitude of the projection can be interpreted as how much of the energy variance of a single realisation, in percentage points, a given POD mode is able to explain and is useful to identify individual realisations for which the POD structures are more or less representative of the dynamics.
Leading space–time POD mode of the CGLE system. (a) Space–time plot of the mode's real component; (- -, black) unstable region; (- -, red) absolutely unstable region. (b i) Normalised POD spectrum. The dashed line indicates the mean, which corresponds to the spectrum of uncorrelated data. (b ii) Projection of the leading POD mode onto the realisations.

Appendix B. Space–time POD analysis of wall stress data for higher Fourier modes
The same analysis as for  $k_z = 0$ is performed for higher spanwise Fourier modes up to $k_z = 7$. This particular upper threshold was chosen based on the Fourier modes for which the spectral POD analyses of the statistically stationary precursor simulations showed significant spatial coherence, in particular of the KH rolls. A representative example of the results for $k_z \neq 0$ is shown in figure 24 for $k_z = 1$. From the figure, it is clear that the wall stress data at higher spanwise wavenumbers is indeed highly random and exhibits little spatiotemporal coherence leading to a very flat eigenvalue distribution, a situation that is even more pronounced for higher $k_z$. This is in line with the earlier observation that the KH rolls do not have a signature on the wall that can be picked up by the POD. This shows that the dominant coherent effects on the wall are essentially spanwise invariant, although the random fluctuations in the higher wavenumbers are considerable. It should be noted that the restriction of the computational domain to 0.1 chords in the span with periodic boundary conditions is ultimately equivalent to a truncation of the dynamics. While this restriction has been shown to have little impact on the onset of dynamic stall, the poststall dynamics (relevant for the region $tU/c \geq 2$) are known to exhibit long-wavelength dynamics along the span that cannot be captured here (Visbal & Garmann Reference Visbal and Garmann2017). Given the lack of coherence in the higher spanwise wavenumbers, we do not consider these data further in the present study.
Real part of the first mode of the space–time POD of the full wall stress data for the second Fourier mode ( $k_z=1$, only the friction coefficient part is shown). (a) Space–time plot. The black line indicates the zero contour of the mean. (b i) Normalised POD spectrum. The dashed line indicates the mean. (b ii) Normalised projection of the mode on each realisation.


 Open access