

The n-3 highly unsaturated fatty acids (HUFA; ≥ 20 carbons, ≥ 3 double bonds) EPA and DHA exert cardio-protective effects through several physiological and molecular mechanisms( Reference Mozaffarian and Rimm 1 , Reference Mozaffarian and Wu 2 ). Current EPA+DHA intake recommendations range from 0·25 to 4 g/d with guidelines < 1 g/d aimed at healthy individuals and those ≥ 1 g/d advised for secondary CVD prevention and TAG lowering( 3 – 7 ). In contrast, median North American intakes of EPA and DHA of 0·11 g/d by women and 0·16 g/d by men fall below existing guidelines( 8 ).
Recent trials( Reference Galan, Kesse-Guyot and Czernichow 9 – Reference Rauch, Schiele and Schneider 11 ) and meta-analyses( Reference Kwak, Myung and Lee 12 , Reference Rizos, Ntzani and Bika 13 ) have found no reduction in CHD risk with EPA and DHA intakes. However, the intention-to-treat approach used in these trials may fail to account for a lack of long-term adherence with study dietary protocols. Adherence up to but not beyond 3 months has been observed by diet history interviews following the advice to increase EPA and DHA intakes from oily fish( Reference Neale, Cossey and Probst 14 ). Blood fatty acid composition offers an objective strategy to measure intake, as this tissue is responsive to dietary EPA and DHA( Reference Bjerve, Brubakk and Fougner 15 – Reference Metherel, Armstrong and Patterson 17 ). In blood, there are numerous blood fractions (plasma, erythrocytes, platelets and leucocytes) and lipid classes (phospholipids, TAG and cholesteryl esters) that can be analysed. Plasma and erythrocytes tend to be routinely collected in clinical studies, with fingertip blood sampling methods resulting in increasing reports of whole-blood fatty acids. While it is possible to isolate specific lipid classes before fatty acid analyses, the examination of total lipid fatty acids greatly enables cost-efficient, high-throughput analyses required for clinical screening and monitoring( Reference Stark 18 ). Erythrocyte fatty acid composition is often cited as a preferred blood marker of long-term intakes as the cell lifespan is 120 d( Reference Ebaugh, Emerson and Ross 19 ), although some exchange with plasma fatty acids( Reference Skeaff, Hodson and McKenzie 20 ) and membrane bilayer remodelling is possible( Reference Connor, Pak and Zwaal 21 , Reference Seigneuret and Devaux 22 ). When compared with erythrocytes, plasma responds more rapidly to increases and decreases in EPA+DHA intakes( Reference Metherel, Armstrong and Patterson 17 , Reference Skeaff, Hodson and McKenzie 20 ). Whole blood will respond to changes in EPA+DHA intakes in a manner intermediate between plasma and erythrocytes( Reference Metherel, Armstrong and Patterson 17 ). Furthermore, when compared with DHA, levels of EPA in whole blood will increase and decrease more rapidly in response to the start and termination of fish oil supplementation( Reference Metherel, Armstrong and Patterson 17 ). Characterising the ability of different blood fatty acid biomarkers to capture long-term adherence to EPA and DHA intakes could assist in the design and interpretation of long-term trials.
Dietary advice to increase EPA and DHA intakes can vary. The majority of clinical intervention studies use a nutraceutical approach by supplementing with fish oil. Conventional dietetic practice advises a whole-food approach based on fish intake to reach the level recommended for EPA and DHA intake guidelines( Reference Kris-Etherton, Innis and American Dietetic Association 6 , 7 ). Novel functional foods may provide additional options to cost-effectively increase EPA and DHA intakes( Reference Patterson and Stark 23 ). Fish( Reference Burr, Fehily and Gilbert 24 ), nutraceutical( Reference Galan, Kesse-Guyot and Czernichow 9 , Reference Rauch, Schiele and Schneider 11 , 25 ) and functional food( Reference Kromhout, Giltay and Geleijnse 10 ) sources have been used to examine the relationship between EPA and DHA intakes and CHD risk. Long-term adherence by men and women to dietary advice based on seafood, functional foods and nutraceuticals in a self-selected manner has not been evaluated through comprehensive blood fatty acid analyses.
The purpose of the present study was to examine, through dietary assessment and blood biomarkers, adherence over 1 year to dietary advice to increase EPA and DHA intakes. Adherence to dietary advice strategies based on seafood, nutraceuticals and/or functional foods was examined.
Subjects and methods
Study population
Participants aged 35–50 years were sought from the Kitchener–Waterloo, Ontario area using local newspaper advertisements and flyers posted at local community centres, grocery stores and on the University of Waterloo campus. At a screening visit, individuals provided a fasting fingertip prick blood sample, completed a semi-quantitative FFQ specific for EPA and DHA intakes( Reference Patterson, Hogg and Kishi 26 ) and were given instructions for completing a 3 d diet record. Individuals with >4 % EPA+DHA levels in total fatty acids from fingertip prick blood samples, existing CVD or diabetes mellitus and those consuming nutraceuticals containing EPA and DHA were excluded from the study. The present study was conducted according to the guidelines laid down in the Declaration of Helsinki, and all procedures involving human participants were approved by the University of Waterloo Human Ethics Committee. Written informed consent was obtained from all participants.
Study design
Participants attended a baseline visit approximately 2 weeks after screening where dietary advice was provided as a structured interview and handout. Participants were asked to follow the advice for the subsequent 52 weeks. A fasting venous blood sample, a 3 d diet record and anthropometric measurements were collected at baseline and at follow-up visits in weeks 4, 8, 12, 24 and 52. Participants were instructed to collect duplicates of all foods, beverages and nutraceuticals consumed on the 3 d corresponding with the 3 d diet record returned at the week 4 visit.
Dietary advice
Participants were stratified by sex and allocated in the order in which they were admitted to the trial to one of the four dietary advice groups consisting of seafood, functional food, nutraceutical or combined advice. Participants were not provided food products or nutraceuticals as the study was designed to examine the response to dietary advice. The study was not blinded due to the nature of the intervention. At the baseline visit, participants received the same information regarding the health benefits associated with EPA and DHA intakes and were advised to target the dietary intake of 1 g EPA+DHA/d. The Seafood advice group was asked to substitute seafood in place of other meat and meat alternatives in their regular diets. Information on local seafood retailers, safe seafood preparation and cooking techniques, recipes, sample daily menus and recommendations for avoiding frequent intake of fish with high mercury content was provided. Differences in the EPA+DHA content of oily and lean fish were discussed and the amount of EPA+DHA of all seafood itemised in the Canadian Nutrient File 2007b( 27 ) was provided to help participants estimate the EPA+DHA intake. The Functional Food advice group was asked to substitute EPA- and/or DHA-containing functional foods in place of similar foods in their regular diets (e.g. n-3 eggs in place of regular eggs). Information on how to identify functional foods containing EPA and/or DHA from product labels, recipes, sample daily menus and the amount of EPA+DHA per serving of available functional foods along with cost comparisons at local retail outlets was provided to the Functional Food advice group. The Nutraceutical advice group was advised to supplement their regular diet with a nutraceutical product. Information on the different types of nutraceutical products available (e.g. capsules, liquid, soft chews, etc.), the interpretation of product labels and the cost associated with consuming 1 g EPA+DHA/d from various nutraceutical products from local retail outlets was provided. The Combined advice group was given the seafood, functional food and nutraceutical advice and advised on how to simultaneously substitute/supplement their diet with all the three sources by providing sample daily menus.
Outside of recommendations to increase EPA+DHA intakes through substitution/supplementation, all groups were otherwise requested to maintain their usual diets. Participants were responsible for purchasing their own food and/or nutraceutical products, but remuneration for participation in the study was designed to compensate for these expenses. At follow-up visits in weeks 4–52, the 3 d diet records detailing the intake of recommended foods/nutraceuticals were reviewed in-person, challenges associated with following the dietary advice were discussed and continued adherence was encouraged. The baseline (dietary advice) visit took up to 1 h and visits in weeks 4–52 took up to 30 min, including blood sample and anthropometric measurement collection. Researchers were available to answer questions from the participants between the study visits by phone or email. The assumption was made that seafood, functional foods and nutraceuticals supply EPA and DHA in an equally bioavailable manner( Reference Arterburn, Oken and Hoffman 28 – Reference Wallace, McCabe and Robson 31 ).
Blood sampling
All blood sampling was performed following an 8–12 h overnight fast. Screening fingertip prick blood samples were collected by puncturing the skin with a disposable lancing device (Capiject; Terumo or Unistik 2; Lifescan) and absorbing blood onto a 1 cm2 area of chromatography paper (Whatman) pre-washed in 4:1 chloroform–methanol( Reference Armstrong, Metherel and Stark 32 , Reference Fratesi, Hogg and Young-Newton 33 ). Venous blood samples were collected by venepuncture into evacuated tubes (Vacutainer; Becton Dickinson). The anti-coagulant EDTA (Sigma-Aldrich) was added to venous blood samples in preparation for fatty acid determination of whole blood, plasma and erythrocyte aliquots. Erythrocytes were washed twice with saline before collection. All venous blood samples were stored at − 80°C until analysis.
Dietary assessment and food duplicate collections
The 3 d diet records included two weekdays and one weekend day. Completed dietary surveys, including the screening FFQ and 3 d diet records, were checked by a single researcher for clarification and completeness. Dietary surveys were analysed using the Food Processor SQL Edition dietary analysis software (version 10.6.0; ESHA Research). The software food composition database was also updated with the Canadian Nutrient File 2007b database( 27 ) and fatty acid compositions of select functional food and nutraceutical products directly assayed by GC in the laboratory. Food duplicate collections were weighed, blended to homogeneity in a 4-litre blender (Waring Laboratory & Science) and stored at − 80°C until fatty acid analysis.
Fatty acid composition analyses
The fatty acid compositions of venous blood fractions, fingertip prick blood samples, food duplicate collections, and nutraceuticals and functional foods identified on dietary surveys were assessed. All lipids were extracted in the presence of butylated hydroxytoluene (Sigma-Aldrich) to prevent lipid oxidation. An internal standard (22 : 3n-3 ethyl ester; Nu-Check Prep) was added during venous blood and food duplicate analyses to allow for quantitative determinations. Qualitative fatty acid determinations for screening purposes were rapidly determined from fingertip prick blood samples( Reference Armstrong, Metherel and Stark 32 , Reference Fratesi, Hogg and Young-Newton 33 ). Briefly, fingertip prick samples were directly transesterified without prior lipid extraction by placing chromatography paper saturated with blood in 14 % boron trifluoride in methanol (Thermo Scientific) with hexane on a 90°C heat block for 1 h. Venous whole blood and plasma lipids were extracted using a Folch-based method( Reference Folch, Lees and Sloane Stanley 34 ), while erythrocyte lipids were extracted by a Bligh and Dyer-based method( Reference Bligh and Dyer 35 ) with steps to ensure erythrocyte cell membrane lysis( Reference Reed, Swisher and Marinetti 36 ). Fatty acid methyl esters were then prepared from the isolated lipid extracts by transesterification with 14 % boron trifluoride in methanol (Thermo Scientific) with hexane on a 90°C heat block for 1 h( Reference Morrison and Smith 37 ). Oils isolated from nutraceuticals were prepared by lipid extraction and subsequent transesterification as described above for whole blood and plasma. The fatty acid composition of nutraceutical and functional food products, and food duplicate collections were determined in triplicate. Briefly, AOAC International method 996.06, with solvent volume adjustment for samples containing 6·25–12·5 mg of total fat( 38 ), was modified with initial acid hydrolysis treatment for complete lipid extraction from microencapsulated fish oil( Reference Stark, Nollet and Toldra 39 ) and fatty acid methyl esters prepared as described above. The fatty acid methyl esters in hexane were collected and analysed on a Varian 3900 gas chromatograph (Varian) with settings as described previously( Reference Kitson, Patterson and Izadi 40 ). Both identified( Reference Armstrong, Metherel and Stark 32 ) and unidentified peaks were included in the total fatty acid summation when individual fatty acids were expressed as a percentage of the total fatty acid pool.
Statistical and data analyses
Blood EPA and DHA measurements expressed as individual fatty acids and composite fatty acid biomarkers, in addition to dietary intake of EPA+DHA from 3 d diet records, were evaluated as the primary study outcomes. Blood measurements of n-3 docosapentaenoic acid (DPAn-3, 22 : 5n-3) were also examined, as this fatty acid may exert cardio-protective effects( Reference Mozaffarian and Wu 2 ). Individual fatty acids were expressed as a percentage of total fatty acids (blood) or as mass per d (dietary intake). The sum of the percentage of EPA+DHA and EPA+DPAn-3+DHA and the percentage of n-3 HUFA in total HUFA were also examined, as they are the proposed biomarkers of n-3 status( Reference Albert, Campos and Stampfer 41 – Reference Stark 44 ). The percentage of n-3 HUFA in total HUFA was calculated using the following formula: (20 : 5n-3+22 : 5n-3+22 : 6n-3)/(20 : 5n-3+22 : 5n-3+22 : 6n-3+20 : 3n-6+20 : 4n-6+22 : 4n-6+22 : 5n-6) × 100( Reference Stark 18 ). Measurements of HUFA intakes from 3 d diet records were loge transformed to permit parametric statistical analyses.
All statistical analyses were performed using SPSS (release 18.0.0; IBM). Significance was set at P< 0·05 and significance levels quoted are two-sided. The linear mixed model procedure was used for ANOVA. Following the determination of a significant F-value, individual means were examined with Bonferroni's post hoc analyses. All blood and diet record measurements of EPA and DHA were evaluated using a three-factor (advice group, sex and time) repeated-measures linear mixed model procedure. Measurements of EPA and DHA intakes by 3 d diet records and 3 d food duplicate collections in week 4 were compared by paired t tests.
Results
Participant flow and characteristics
Study recruitment was initiated in January 2008 and continued for 8 months. A total of fifty-nine individuals responded to advertisements and were screened for study participation (see CONSORT flow diagram in the supplementary material). Of these individuals, nine did not meet eligibility requirements and were not admitted. Following the baseline dietary advice intervention, five individuals initially recruited left the study: one was diagnosed with gallstones; one became pregnant; one was attempting to become pregnant; one was unable to attend the study visits; one could not be contacted. As blood fatty acid composition would change with gallstonec treatment and pregnancy, these two participants were excluded from all analyses. The remaining three individuals not completing the study had been allocated to the Seafood advice group (one female and one male) and the Functional Food advice group (one female). Intention-to-treat analysis using the baseline values from the three dropouts for all time points did not alter the findings presented herein. As a result, measurements from the forty-five individuals who participated in the year-long study are reported. Of these forty-five individuals, eleven (six females and five males) were assigned to each of the Seafood, Functional Food and Combined advice groups and twelve (six females and six males) were assigned to the Nutraceutical advice group. Participants were mainly Caucasian, educated beyond high school and not regular smokers. The dietary advice groups were similar in BMI (baseline 27·3 (sd 5·3) kg/m2) and age (baseline 43·7 (sd 4·4) years). No adverse events were reported following the dietary advice.
Dietary intake of EPA+DHA
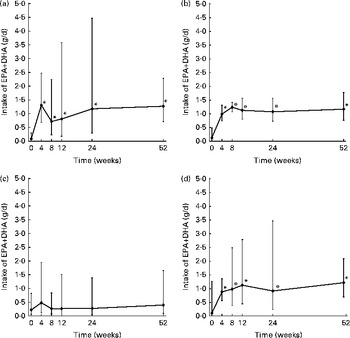
By the 3 d diet records, intake of EPA+DHA was found to be 0·12 (95 % CI 0·07, 0·21) g/d at baseline. In the Seafood, Nutraceutical and Combined advice groups, EPA+DHA intake increased at each post-intervention time point from each advice group's own baseline measurement (effect of the advice group × time interaction, P= 0·03; Fig. 1). In the Functional Food group, EPA+DHA intake did not increase significantly post-intervention. At each time point, no significant differences in EPA+DHA intake were detected between the advice groups. In the Seafood advice group, the measurement of EPA intake in week 4 was lower when assessed by food duplicates when compared with diet records (P= 0·04; Table 1). Otherwise, EPA and/or DHA estimates were similar when assessed by the 3 d diet record and food duplicate collection.
Intake of the sum of EPA and DHA from 3 d diet records in (a) the Seafood, (b) Nutraceutical, (c) Functional Food and (d) Combined advice groups by completers. Values are back-transformed loge means (geometric means, n 45), with standard deviations represented by vertical bars. * Mean value was significantly different from that of the week 0 measurement (P< 0·05; Bonferroni's post hoc test following a significant F-value by the repeated-measures linear mixed model procedure).
EPA and DHA estimates by 3 d diet records and 3 d food duplicate collections in week 4 (Geometric means (loge transformed) and 95 % confidence intervals)
* Mean value was significantly different from that of the dietary record measurements (P< 0·05; paired t test).
Blood fatty acids and fatty acid biomarkers
A three-way interaction was observed for the percentage of EPA+DHA in total fatty acids in whole blood (P= 0·01; Fig. 2, meaningful comparisons shown). This biomarker was 2·87 (sd 0·95) % at baseline. In the Seafood advice group, the percentage of EPA+DHA in the whole blood biomarker increased from baseline in weeks 4, 12, 24 and 52 for men and in weeks 4 and 12 for women. For men and women in the Functional Food advice group, the biomarker did not increase significantly from baseline. In the Nutraceutical advice group, the biomarker increased from baseline in weeks 12 and 52 for men and in weeks 4–52 for women. The biomarker increased from baseline in weeks 24 and 52 for men in the Combined advice group. For women in the Combined advice group, the biomarker increased at all time points after baseline. A three-way interaction was similarly observed for the percentage of EPA+DPAn-3+DHA in whole blood (P= 0·01) and the percentage of n-3 HUFA in the total HUFA biomarker in whole blood (P< 0·01).
Percentage of EPA+DHA in total fatty acids in the whole blood of (a) men and (b) women in each dietary advice group (![]() , Seafood;
, Seafood; ![]() , Functional Food;
, Functional Food; ![]() , Nutraceutical;
, Nutraceutical; ![]() , Combined). Values are means (n 45), with standard deviations represented by vertical bars. * Mean value was significantly different from that of the corresponding baseline measurement (P< 0·05; Bonferroni's post hoc test following a significant F-value by the linear mixed model procedure).
, Combined). Values are means (n 45), with standard deviations represented by vertical bars. * Mean value was significantly different from that of the corresponding baseline measurement (P< 0·05; Bonferroni's post hoc test following a significant F-value by the linear mixed model procedure).

Overall, the percentage of DHA in erythrocytes increased from baseline (4·0 (sd 1·0) %) in weeks 4 and 8, reached a maximum in week 12 (4·9 (sd 0·8) %) and subsequently returned to baseline levels in weeks 24 and 52 (effect of time, P< 0·01) (Fig. 3). The percentage of DHA in erythrocytes was higher overall in the Seafood advice group (4·7 (sd 1·0) %) when compared with the Functional Food (4·0 (sd 0·8) %) and Nutraceutical (4·0 (sd 0·9) %) advice groups (effect of advice group, P< 0·01). In contrast to the percentage of DHA in erythrocytes, the percentage of DHA in plasma and whole blood, the percentage of EPA in all the three blood fractions and the percentage of DPAn-3 in plasma and whole blood were higher in weeks 4–52 when compared with the corresponding baseline measurement (Fig. 3). In erythrocytes, the percentage of DPAn-3 was higher in weeks 12–52 when compared with the week 0 measurement. The percentage of the EPA+DHA biomarker in erythrocytes increased relative to the baseline measurement in weeks 4–24, and returned to baseline levels in week 52. The percentage of EPA+DPAn-3+DHA and the percentage of n-3 HUFA in the total HUFA biomarker in erythrocytes increased in weeks 4–52 relative to the baseline measurement.
Percentage of (a) DHA, (b) n-3 docosapentaenoic acid (DPAn-3) and (c) EPA in erythrocyte (![]() ), plasma (
), plasma (![]() ) and whole-blood (
) and whole-blood (![]() ) total fatty acids and (d) measured (3 d diet record (
) total fatty acids and (d) measured (3 d diet record (![]() ) and hypothesised EPA+DHA intake (
) and hypothesised EPA+DHA intake (![]() )). Values are means (n 45), with standard deviations represented by vertical bars (3 d diet records are back-transformed loge means and standard deviations). * Mean value was significantly different from that of the corresponding baseline measurement (P< 0·05; Bonferroni's post hoc test following a significant F-value by the linear mixed model procedure).
)). Values are means (n 45), with standard deviations represented by vertical bars (3 d diet records are back-transformed loge means and standard deviations). * Mean value was significantly different from that of the corresponding baseline measurement (P< 0·05; Bonferroni's post hoc test following a significant F-value by the linear mixed model procedure).

Discussion
The present investigation uses a combination of multiple assessment tools to characterise EPA+DHA intake and blood status over a 52-week period. By considering the changes in the percentage of DHA in erythrocytes in contrast to all the other measurements of the percentage of DHA and/or the percentage of EPA in blood fractions assayed, as well as diet assessments, it appears that adherence in the present study was inconsistent through weeks 24 and 52. A pattern of poor adherence after the week 12 visit, followed by ‘compensatory’ EPA+DHA intake shortly before the visits in weeks 24 and 52, would potentially result in a low percentage of DHA in erythrocytes and values above baseline for all the other EPA and DHA blood measurements. A hypothesised pattern of actual dietary EPA+DHA intake over the 52-week period is depicted in Fig. 3.
DHA in erythrocytes appears to be a more accurate reflection of adherence to the n-3 HUFA intervention, as it takes much longer to incorporate when compared with EPA in general and DHA in plasma phospholipids( Reference Browning, Walker and Mander 45 ). In erythrocytes, DHA preferentially incorporates into phosphatidylethanolamine of the inner leaflet of lipid membrane bilayers, while EPA incorporates into phosphatidylcholine of the outer leaflet( Reference Lemaitre-Delaunay, Pachiaudi and Laville 46 ). Fatty acid remodelling of inner cell membranes is relatively slow( Reference Seigneuret and Devaux 22 ), therefore EPA can increase and decrease rapidly in erythrocytes, while DHA turnover is slower( Reference Metherel, Armstrong and Patterson 17 ). DHA and DPAn-3 appear to compete for incorporation into phospholipids( Reference Holub, Swidinsky and Park 47 , Reference Stark and Holub 48 ) and DPAn-3 may have replaced DHA in erythrocyte membranes in weeks 24 and 52, supporting our hypothesis that EPA+DHA intake was low for most of this period. In contrast, plasma EPA, DPAn-3 and DHA respond relatively quickly to dietary intake changes( Reference Metherel, Armstrong and Patterson 17 ) as plasma phospholipids are predominantly phosphatidylcholine of the outer monolayer of lipoproteins. Plasma also contains cholesteryl esters and TAG that can incorporate fatty acids( Reference Christie 49 ), but n-3 HUFA accumulation in these lipids is typically low( Reference Stark 18 , Reference Browning, Walker and Mander 45 ). Biomarkers of n-3 HUFA, such as the percentage of EPA+DHA, the percentage of EPA+DPAn-3+DHA and the percentage of n-3 HUFA in total HUFA, appear to be most appropriate for characterising short-term changes in EPA and DHA intakes and probably reflect usual EPA and DHA intakes for individuals in observational studies. However, the present findings suggest that DHA in erythrocytes reflects adherence to n-3 HUFA intake over longer periods. Determining the fatty acid composition of specific lipid classes or erythrocytes such as phosphatidylethanolamine or phosphatidylserine could prove to be even more sensitive blood biomarkers for adherence to the n-3 HUFA intervention, but would greatly increase the analytical burden. Plasma and whole blood levels may still be informative in observational studies intended to examine ‘usual’ behaviour, but may be problematic when used to assess dietary change.
The findings of non-adherence to the advice to increase EPA and DHA intakes have an impact on the interpretation of intervention studies. While recent meta-analyses( Reference Kwak, Myung and Lee 12 , Reference Rizos, Ntzani and Bika 13 ) have documented dose levels for intervention studies, the issue of adherence to intake is not addressed. This is in part because most n-3 HUFA intervention studies have reported high adherence, but often this is determined by self-report and dietary intake assessments( Reference Rauch, Schiele and Schneider 11 , Reference Bosch, Gerstein and Dagenais 50 ), although some studies have started to report plasma blood levels( Reference Galan, Kesse-Guyot and Czernichow 9 , Reference Kromhout, Giltay and Geleijnse 10 , Reference Einvik, Klemsdal and Sandvik 51 ). The present results suggest that reliance on dietary intake assessments and plasma blood levels of n-3 HUFA in intervention studies could result in an overestimation of adherence.
Adherence to dietary advice up to, but not beyond, the initial 12 weeks of the study may be related to follow-up frequency and/or participant fatigue. Study visits occurred monthly from baseline to week 12, and subsequently following 3- and 6-month intervals at weeks 24 and 52, respectively. Adherence up to 12 weeks, but not 52 weeks, has been observed previously following dietary advice to consume fatty fish( Reference Neale, Cossey and Probst 14 ). In this previous fish advice study, dietary counselling was provided at the same time points as the present study, plus an additional visit at week 36. The findings from the present study suggest that dietary advice for free-living individuals to increase the intake of EPA and DHA from traditional sources, such as seafood, and novel sources, including nutraceuticals, can be effective, but regular follow-up and motivation may be needed to maintain long-term adherence. The possibility of non-adherence in intervention trials examining fish oil supplementation needs to be considered.
Sex and advice group differences were not observed in the percentage of DHA in erythrocytes but were detected in the percentage of EPA+DHA, EPA+DPAn-3+DHA and n-3 HUFA in total HUFA in whole blood. In the long term, functional food advice was not successful in raising the percentage of EPA+DHA in whole blood, in both men and women. This is probably due to the low amount of EPA+DHA per serving of functional food products that are due to regulations( 52 ) and/or potential changes in sensory properties of the functional foods( Reference Kishi, Peel and Patterson 53 ). As a result, several functional foods must be consumed to achieve EPA+DHA intakes of 1 g/d. In contrast, the percentage of EPA+DHA in whole blood increased the most for men following the seafood advice and for women following the nutraceutical and combined advice.
Dietary assessments performed by both sexes can be subject to response bias as women are influenced by social desirability, a tendency to avoid criticism, and men are influenced by social approval, a tendency to seek praise( Reference Hebert, Ma and Clemow 54 ). Knowing that blood samples would be measured for n-3 HUFA status at each study visit could have lead to compensatory adherence immediately before study visits. EPA+DHA compensatory intakes before study visits could be accomplished with intake of oily fish or a few fish oil capsules. Men may have been capable of achieving higher intakes of EPA+DHA after seafood advice or engaging in compensatory EPA+DHA consumption with seafood when compared with women. As men typically consume larger portions of meat when compared with women, it is plausible that their intake of EPA+DHA from seafood substitution could be greater( Reference Garriguet 55 ), and compensatory EPA+DHA intake would be higher. Fish oil nutraceutical users tend to be female( Reference Greger 56 ), and it is possible that women had higher compensatory EPA+DHA intakes from nutraceuticals when compared with men.
The n-3 HUFA intakes and adherence to dietary advice over time attained herein may be different from what is achievable by different populations. For ethical reasons, the study was advertised as an n-3 fatty acid intervention and may have attracted individuals with an interest in consuming n-3 fatty acids. Clinical populations with existing health conditions may be more motivated to adhere to dietary advice and comply with fish oil supplementation. Study conclusions herein were the same following the intention-to-treat and completer analysis; however, loss to follow-up in the Seafood and Functional Food advice groups may indicate difficulty adhering to dietary strategies involving food substitution instead of nutraceutical addition. Estimated intakes of EPA by the Seafood advice group in weeks 4–52 may be an overestimation if the discrepancy between the diet record and duplicate food measurements is due to the food composition database rather than to participant recording/food collection error.
In conclusion, dietary advice to consume EPA+DHA from seafood or nutraceutical sources alone, or in combination with functional foods, can increase EPA+DHA intakes and levels in blood in the short term. There may, however, be sex differences in the effectiveness of types of dietary advice. Dietary intake assessments and other blood measurements of EPA or DHA suggest long-term adherence to dietary advice, but levels of DHA in erythrocytes indicate non-adherence. Rapid incorporation of EPA into plasma and erythrocyte lipids, and DHA into plasma lipids makes measures of EPA+DHA susceptible to acute compensatory EPA+DHA intake just before clinical blood sampling visits during long-term intervention studies. The percentage of DHA in erythrocytes appears to capture long-term adherence to n-3 HUFA intakes and could be an appropriate and much-needed marker of adherence in long-term n-3 intervention trials. Disease endpoints could also be evaluated based on the percentage of DHA in erythrocytes in studies where adherence to supplementation protocols cannot be assumed. Sex differences in blood n-3 HUFA biomarker responses to different types of advice indicate that tailoring dietary advice about EPA and DHA to traits of individuals could increase adherence. Strategies to improve adherence to dietary advice beyond 12 weeks are needed and the effect of increased follow-up frequency over the long-term warrants investigation in the future.
Supplementary material
To view supplementary material for this article, please visit http://dx.doi.org/10.1017/S0007114513002225
Acknowledgements
The authors thank Jing Ouyang, Margaret Burnett and Peyman Charkhzarin (Department of Kinesiology, University of Waterloo) for technical assistance and the study participants for their dedicated time and effort.
The present study was supported by a research grant from the Canadian Foundation for Dietetic Research. The Canadian Foundation for Dietetic Research had no role in the design, analysis or writing of this article. A. C. P. was supported by a doctoral research award from the Canadian Institutes for Health Research. A. H. M. was supported by a doctoral research award from the Natural Sciences and Engineering Research Council of Canada.
The authors' contributions are as follows: K. D. S. and R. M. H. secured the funding; K. D. S., A. C. P. and R. M. H. designed the research; A. C. P. and A. H. M. collected the data; A. C. P. analysed the data; A. C. P. and K. D. S. wrote the manuscript; K. D. S. had primary responsibility for the final content. All authors read and approved the final manuscript. The authors have no conflict of interest to report.


