


1. Introduction
Lighting accounts for 17% of total energy use in commercial buildings (CBECS 2017), making improvements in energy efficiency both environmentally and economically important. This article investigates interior lighting design techniques and standards, specifically focusing on the horizontal illumination of the task area (Australia/New Zealand Standard 2006) and the task surrounds (European Standard 2021). These approaches were developed using legacy lighting technologies such as incandescent and fluorescent light sources. However, solid-state lighting (SSL), a semiconductor technology that emits light when electricity is passed through it, has a market penetration of more than 50% (Lane, Delmastro & Voswinkel Reference Lane, Delmastro and Voswinkel2022). The benefits of this technology are energy saving, long lifespan, greater flexibility where light can be projected and the ability to work seamlessly with electronic controls such as occupancy sensors and dimmers (Zissis, Bertoldi & Serrenho Reference Zissis, Bertoldi and Serrenho2021).
Despite these technological developments, there has been little change in lighting design standards and practices. There has also been limited investigation into illuminance (the quantity of light falling on a surface, weighted according to the human eye’s spectral sensitivity) differences and the perceived quality of interior architectural environments. This study investigates a design-based strategy for SSL technologies in large interior open spaces, such as offices, gyms, libraries, large retail stores, lecture theatres and hotel lobbies that are partially occupied or unoccupied for significant periods. By further understanding illuminance, the internationally accepted and quantifiable metric for assessing lighting (AS/NZS 2006; European Standard 2021), and its relationship to the perception of our interiors, there is an opportunity to reduce illuminance (energy consumption) in large unoccupied interior areas without affecting the perceived quality of the illumination.
2. Previous research
2.1. Lighting design standards and practices
Lighting standards aim to ensure visual comfort, visual performance and safety (European Standard 2021). However, “LED has taken over as the main light source from previous technologies” (European Standard 2021, p. 5). Despite this significant technological advancement, interior lighting standards remain based on principles from legacy lighting technologies (Cuttle & Boyce Reference Cuttle and Boyce2023). For example, lighting uniformity (U₀), which defines acceptable variations from the average illuminance, has remained relatively consistent for over 80 years (Slater & Boyce Reference Slater and Boyce1990). Additionally, the lighting community tends to focus on quantitative values, such as maintaining average task plane illuminance value (E), even though standards encompass extensive qualitative design notes (Cuttle & Boyce Reference Cuttle and Boyce2023).
The European Standard (2021) and the International Organization for Standardization & International Commission on Illumination (ISO/CIE) (2025) recommend 500 lx as the minimum average illuminance for typical office workspaces. In contrast, the Illuminating Engineering Society (2020) suggests a more flexible range of 300–500 lx. The Australia/New Zealand Standard AS/NZS (2006) suggests 320 lx on the horizontal working plane for the entire office environment. Additionally, European Standard (2021) and ISO/CIE ( 2025) specify 150 lx cylindrical illuminance for office tasks, while the Illuminating Engineering Society (2020) and AS/NZS (2006) do not specify cylindrical illuminance values.
In the European Standard (2021), ISO/CIE (2025), AS/NZS (2006), illuminance uniformity (U₀) is defined as the minimum to average ratio (U 0 = E min /E avg ), while the Illuminating Engineering Society (2020) recommends a 2:1 maximum to minimum ratio. In the European Standard (2021) and ISO/CIE (2025) [all illuminance values presented in this section are maintained illuminance, which is the average illuminance level on a reference surface, after considering factors like lamp depreciation, luminaire dirt and room surface dirt (AS/NZS 2006). The initial illuminance Eᵢ can be calculated from Ēₘ as follows: Eᵢ = Ēₘ/fₘ, where, Ēₘ is maintained illuminance; Eᵢ is initial illuminance; fₘ is maintenance factor (EN 12464-1:2021 2021; ISO/CIE 8995-1:2025 2025)], the working plane uniformity (U₀) requirements are U₀ > 0.60 for demanding visual tasks, U₀ > 0.70 for precision work and U₀ > 0.40 for general areas. Background areas, including walls and ceiling, should have uniformity of U₀ ≥ 0.10. As workstation locations are commonly unknown or can be easily moved, the AS/NZS (2006) take a more one-size-fits-all approach, requiring an overall work plane uniformity U₀ > 0.70 with the general assumption that the task plane covers the entire office environment. However, most office lighting standards, such as the European Standards (2021) and ISO/CIE (2025), have a more localized workstation approach and assume that illuminance values for areas surrounding the task will be at a lower illuminance. For example, European Standards (2021) and ISO/CIE (2025) permit 300 lx for immediate surroundings and recommend that background areas have illuminance of at least 1/3 of the immediate surrounding value. The Illuminating Engineering Society (2020) approach uses proportional ratios with a maximum of 3:1, recommending that task illuminance not exceed three times the ambient illuminance. Despite the AS/NZS (2006) taking a more blanket approach, it does suggest relative ratios, recommending illuminance ratios of 10 (visual task), 3 (immediate surround, defined as surfaces within 15° of the line of sight) and 1 (general surround). However, the current version of European Standards (2021) establishes more precise requirements for wall illuminance than the previous version, specifying wall illuminance values ranging from 30 lx in industrial environments to 150 lx in offices. Overall, recent changes to lighting standards show that they are currently undergoing critical assessment by the lighting industry. The European Standard (2021) and ISO/CIE (2025) acknowledge the over-reliance on numerical metrics, stating that reducing complex design decisions to simple compliance targets often produces poor lighting environments. The Illuminating Engineering Society (2020) advocates beginning the design process with comprehensive “user needs” assessments rather than predetermined numerical targets. Recognizing these limitations, standards have begun incorporating alternative approaches. Both the European Standard (2021) and ISO/CIE (2025) include annexes outlining “additional design practices and methods to those currently in use” (European Standard 2021, p. 94), specifically recommending approaches such as mean room surface exitance and mean ambient illuminance. These developments suggest that interior lighting design standards have the potential to shift significantly toward a more holistic design approach. However, implementing such changes presents substantial practical challenges. Cuttle & Boyce (Reference Cuttle and Boyce2023) point out that transitioning to new standards would require comprehensive revisions of lighting design software and commercially available measurement devices. Given the changes necessary to established lighting practices, Cuttle & Boyce (Reference Cuttle and Boyce2023) note the critical need for further research before any industrywide implementation can proceed.
2.2. Detection of luminance and illuminance differences in laboratory settings
Visual design, which manipulates the interactions of light, color, contrast, spatial relationships, etc., is grounded in an understanding of the human visual system. Psychophysicists such as Weber and Fechner have quantified a number of relationships between physical stimuli. Weber conducted a fundamental visual perception study using luminance, the light reflecting from a surface, as the stimuli. He defined the smallest difference between two stimuli as a just noticeable difference (JND) (American Psychological Association n.d.-a) and proposed that the JND between two stimuli is proportional to the magnitude of the original stimulus (Hu Reference Hu2018). Although Weber’s observations only led to empirical generalizations, his idea is referred to as a “law” (Dzhafarov & Colonius Reference Dzhafarov and Colonius2011) and is expressed mathematically in equation (1) (Hu Reference Hu2018),
 $$ k=\frac{\Delta L}{L} $$
where L represents the intensity of the stimulus (luminance), ∆L represents the change or difference in luminance and k represents the Weber fraction constant. The size of the Weber fraction varies as a function of stimulus conditions (American Psychological Association n.d.-b), such as size, duration, location in the visual field and the observers’ state of adaptation (Teghtsoonian Reference Teghtsoonian1971), increasing in complexity when applied in practical design (Moskowitz Reference Moskowitz2003). Some researchers have found Weber’s law useful as a guide for midrange intensities, but unsuitable for high and low intensities (Gescheider Reference Gescheider1997), and designers have found the law to be sufficiently accurate for applications in tunnel lighting (Simons & Bean Reference Simons and Bean2001).
Building on Weber’s work, Fechner devised his own law to relate discrimination to perceptual magnitude. He believed that one JND represented one unit of the perceived intensity. His law describes a logarithmic relationship between stimulus intensity and perception and is mathematically expressed in (2):
 $$ \psi =k\;\log \left(\varPhi \right) $$
where ψ is the perceived intensity, k is the constant and Φ is the stimulus intensity (Gescheider Reference Gescheider1997). Therefore, a larger change in the stimulus is needed at higher intensities than at lower intensities to yield the same perceived change. A subsequent examination of Fechner’s Law by Hecht (Reference Hecht1924) found that it is only useful to express “an extremely circumscribed portion of reality” (Hecht Reference Hecht1924, p. 236).
2.3. Acceptability and detectability of illuminance and luminance differences in illuminated environments
Several studies have investigated how temporal factors influence illuminance detection thresholds. The detectability of illuminance changes or differences may also vary depending on whether the differences are presented side by side or if the changes are shown sequentially over time. Akashi et al. (Reference Akashi, Neches, Newsham and Hunt2004) considered how memory influences the detectability of illuminance changes. Participants initially viewed 500 lx, and then their vision was obscured for durations of either 3 s or 100 s. A target illuminance was then presented. Participants were asked whether the illuminance was higher, lower or the same. To initiate the subsequent trial, the subjects’ vision was obscured for a second time, while the illuminance was returned to 500 lx, which they viewed for 30 s. A new target illuminance was subsequently presented. The researchers found that subjects could remember 500 lx, and their capacity to recall changes in illuminance varied according to the target illuminance and the period of time that their vision was obscured. When subjects detected an illuminance change, they were asked to rate its acceptability. The subjects whose vision was obscured for 3 s were able to detect illuminance reductions of 20%, while those with obscured vision for 100 s required a 30% reduction to detect a change.
Kryszczuk & Boyce (Reference Kryszczuk and Boyce2002) sought to determine how quickly illuminance can be changed before a difference is perceived. Using rates ranging from 4 lx/s to 337 lx/s and initial illuminances of either 1095 lx or 473 lx, they found that changes in illuminance were detected when they were approximately 20% of the initial illuminance, regardless of the rate of change. Chraibi et al. (Reference Chraibi, Creemers, Rosenkötter, van Loenen, Aries and Rosemann2019) found that a change duration longer than 4.86 s will not be noticed by at least 80% of people, regardless of whether illuminance increases or decreases. They also concluded that reductions in light due to dimming that spans more than 2 s were considered acceptable by more than 70% of participants.
Beyond detection, occupant acceptability of illuminance changes is equally important for practical applications. Akashi & Neches (Reference Akashi and Neches2005) investigated the acceptability of reduced illuminance when people are informed about energy-saving benefits. Their findings suggest that 80% of people who are educated about the benefits of illuminance reduction would accept a 40% decrease for paper-based visual tasks and 50% for computer tasks. If such energy information is not provided, a 30% reduction for paper tasks and a 40% reduction for computer tasks are acceptable.
While the earlier studies focused on illuminance detection and acceptability, other research has examined luminance preferences for vertical surfaces and spatial relationships. In an earlier study, Van Ooyen, Van De Weijgert & Begemann (Reference Van Ooyen, Van De Weijgert and Begemann1987) examined the ways in which luminance from vertical surfaces at medium and far distances influences typical office tasks. An experiment in a small mock-up office presented wall illumination with various luminance uniformity distributions. Overall, the researchers found that the preferred wall luminance for reading, writing and interviewing ranged from 30 cd/m2 to 60 cd/m2, while luminance from 45 cd/m2 to 105 cd/m2 was preferred on the working plane. Using the preferred luminance data, they determined the preferred ratios of task (L t), working plane (L wp) and wall (L w) luminance to be: L t:L wp:L w = 10:4:3.
Veitch & Newsham (Reference Veitch and Newsham2000) studied interior lighting preferences and satisfaction ratings in a typical office layout of partitioned workstations in a windowless room. Participants could select the lighting conditions by switching a task light on or off and individually dimming three circuits of ambient light. Researchers found that participants preferred a maximum to minimum luminance ratio in the visual field of approximately 20:1.
While existing research has established detection thresholds for changes in illuminance over time (Kryszczuk & Boyce Reference Kryszczuk and Boyce2002; Akashi et al. Reference Akashi, Neches, Newsham and Hunt2004; Chraibi et al. Reference Chraibi, Creemers, Rosenkötter, van Loenen, Aries and Rosemann2019) and identified preferred luminance ratios for vertical surfaces in typical office environments (Van Ooyen et al. Reference Van Ooyen, Van De Weijgert and Begemann1987; Veitch & Newsham Reference Veitch and Newsham2000). However, a significant gap exists in understanding how distance influences the detection of illuminance differences on vertical surfaces. Current lighting standards maintain uniformity requirements developed for older technologies and do not systematically consider perceptual limitations when detecting illuminance variations at different distances or locations within a space. Since SSL technology allows for precise, localized control and commercial spaces are often only partially occupied, understanding these spatial detection thresholds could lead to considerable energy savings without reducing perceived lighting quality. This issue is particularly relevant as standards organizations acknowledge the limitations of current numerical metrics and aim to develop evidence-based approaches for SSL applications (European Standard 2021; ISO/CIE 2025).
Therefore, this research investigates two fundamental questions: How does spatial separation from the observer affect the detection of vertical illuminance differences across architectural surfaces? And can these detection thresholds inform evidence-based lighting design strategies that reduce energy consumption without compromising perceived lighting quality?
3. Methods
This study investigates two key issues: the relationship between observer distance and the ability to detect differences in vertical illuminance within interior architectural spaces. It also explores how understanding these detection thresholds can inform lighting design techniques to minimize energy consumption without compromising the perceived lighting quality of the illuminated interior environment. To investigate these concepts, the researchers tested the specific hypothesis that changes in vertical illuminance are less noticeable when they are further from the observer. This hypothesis is grounded in established visual perception principles. The center of our vision, known as the fovea, detects fine details and subtle changes more effectively than peripheral areas. Weber’s law demonstrates that the percentage change needed to detect a brightness difference increases proportionally with the initial brightness level (Dzhafarov & Colonius Reference Dzhafarov and Colonius2011). Additionally, distance reduces the eye’s ability to detect subtle lighting changes because objects appear smaller and less detailed at greater viewing distances. These principles collectively suggest that people should be less likely to notice changes in lighting in distant or peripheral areas.
A five-alternative forced choice (5AFC) method was used to test this hypothesis. This method was chosen because it offers a more objective approach than subjective threshold methods, requiring participants to respond positively on each trial, irrespective of whether they perceived differences (Ehrenstein et al. Reference Ehrenstein, Ehrenstein, Johansson and Windhorst1999). This forced choice approach reduces response bias and criterion effects that can influence subjective reports (Ehrenstein et al. Reference Ehrenstein, Ehrenstein, Johansson and Windhorst1999). In the experimental setup, participants evaluated wall brightness and identified which section appeared dimmer than the others. This approach enabled the researchers to quantify detection thresholds across various spatial separations and viewing conditions. Eight experimental conditions systematically manipulated participant position and gaze to isolate the effects of spatial separation on illuminance difference detection.
Eighty participants (Kingdom & Prins Reference Kingdom and Prins2016), aged 18–50, took part in the study, representing typical working age populations. They were recruited through poster advertisements placed around the University of Sydney campus. All participants reported normal vision or wore their prescribed vision correction during the experiment. The majority of participants were recruited from the School of Architecture. No professional lighting experts or research students were included.
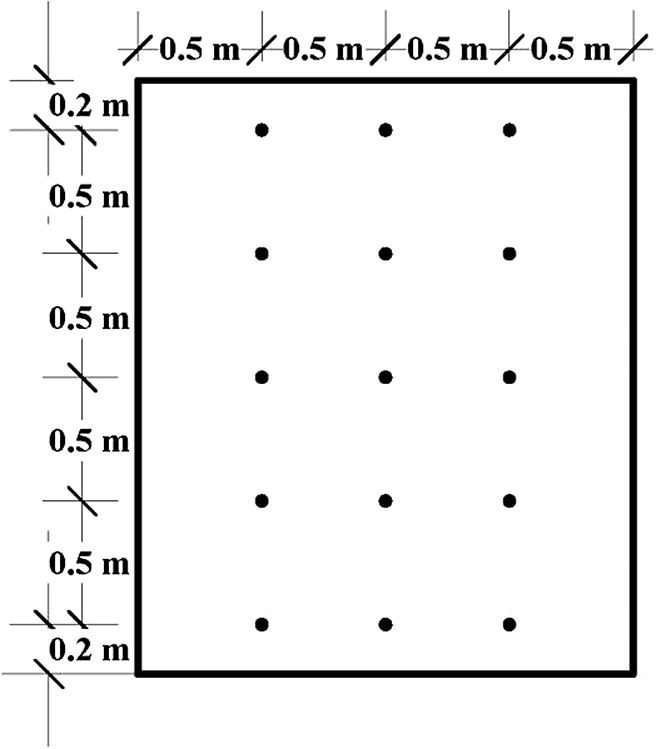
The experiment took place in the Lighting Laboratory at the University of Sydney, which provided the controlled environment necessary for precise illuminance measurements and consistent viewing conditions. The experimental setup consisted of a 10.0-m long by 2.4-m high-matte white vertical surface made from Gatorfoam®. The wall was divided into five equal sections, each 2.0-m wide, numbered 1 to 5 with labels positioned on the floor. Two seating positions were used to examine differences in symmetrical (position A) and asymmetrical (position B) locations. Position A, located in front of panel 3, had a maximum horizontal viewing distance of 6.4 m, and Position B, in front of panel 5, had a maximum horizontal viewing distance of 9.9 m (Figure 1). Each section was illuminated by one ETC Source 4 Series 2 Lustr theatrical luminaire with a 50-degree EDLT (high-resolution) lens. A theatrical profile luminaire was selected as the shuttering system enabled precise beam control and highly uniform illuminance distribution in each wall section. Each luminaire was located 4.0 m in front of each wall section. Luminaires for Sections 1, 2 and 4 were positioned perpendicular to each section’s center, while luminaires adjacent to seating positions (Sections 3 and 5) were offset 0.1 m to the left of center to accommodate lens tube placement relative to participant head position. The experimental setup is shown in Figure 1. All luminaires were positioned at a height of 1.2 m from the floor and included one neutral density filter (LEE Filters 298) for improved dimming resolution and two diffusers (Rosco 119).
Plan view of the experimental setup, showing area dimensions, participant seating positions, horizontal viewing distances, luminaire locations, wall location and panel numbers.

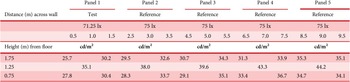
The emission of each luminaire’s red, green and blue LED channels was individually measured with a Photo Research Spectra Scan PR 730. The relative intensity required from each LED channel to produce light with a correlated color temperature (CCT) of 4000 K (CIE 1976 u’ = 0.2252, v’ = 0.5016) was calculated. The 4000 K CCT was chosen as it is commonly used in commercial interiors (European Standard 2021). The absolute intensities of the three LED channels were adjusted to achieve the desired illuminance on each section of the wall for each test lighting condition. The illuminance was measured with a Goldilux Autoranging light meter at 0.5 m spacing on each wall section (see Figure 2) and had an average illuminance of ±1% of the target illuminance (refer to Table 1 for target illuminances).
1x wall section illuminance measurement locations. This measurement grid was replicated on each wall section.

Target illuminance of wall panels for each test lighting condition. The measured average illuminance was ±1% of the target illuminance. Bold values indicate panels with changed illuminance for that test condition.

The illuminances in this study were selected by taking numerous measurements in various real-world office environments. The luminance from each of the two observer seating positions was also recorded for each lighting condition and each seating position at a height of 1.2 m from the floor (participants’ approximate eye position) using a Photo Research PR524 LITEMATE luminance meter. An example of the luminance measurements for test condition 1 from seating position A is shown in Table 2. The luminance measurements confirm that illuminance based lighting design decisions translate predictably into the visual experience of occupants.
Luminance measurements (cd/m2) for test condition 1, from seating position A. The luminance meter was at a height of 1.2 m from the floor. For this example, the test panel (panel 1) had a 5% lower illuminance (71.25 lx) than the reference panels

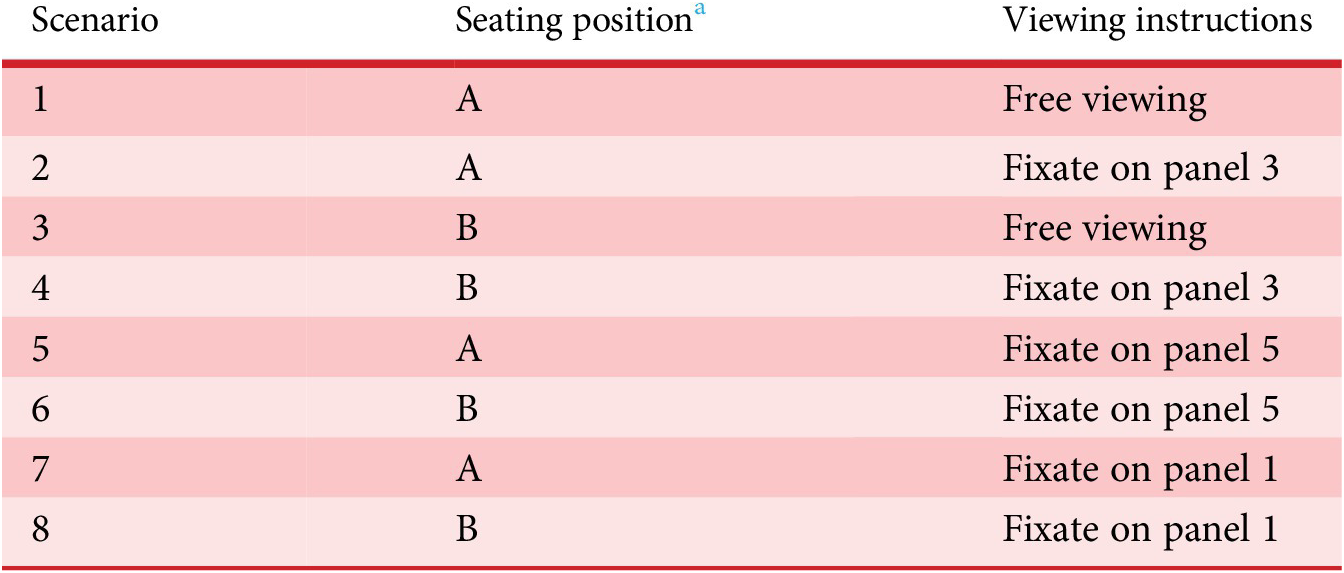
During the experimental trials, participants either had no restriction of their head and eye movements (free view) or were requested to fix their gaze on a designated panel number (fixed gaze). During the fixed gaze trials, participants were encouraged not to stare at a specific point on the wall and to blink and move their eyes naturally. Participants remained seated throughout the experiment. The combinations of the different seating positions and viewing instructions resulted in eight experimental scenarios described in Table 3.
Participant seating positions and viewing instructions for the eight experimental scenarios

a Refer to Figure 1
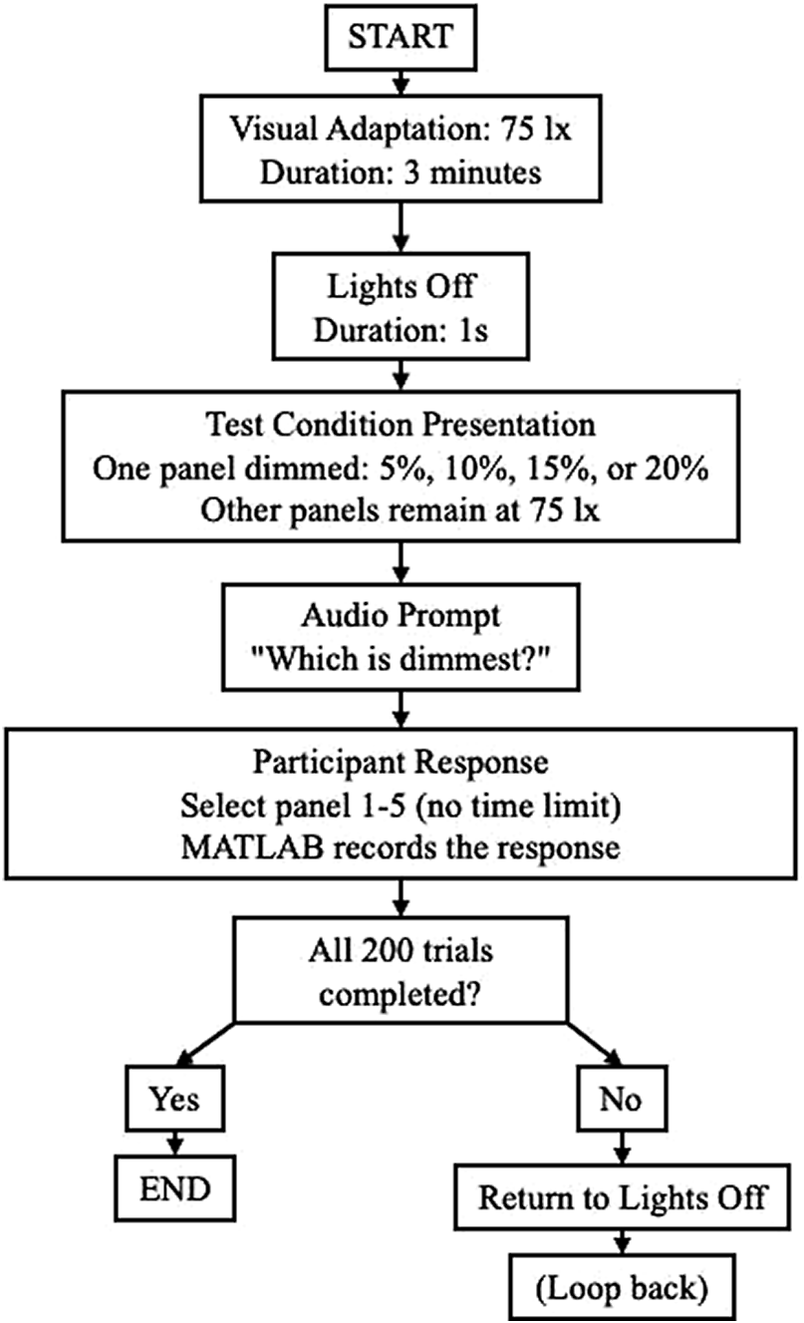
All participants were initially exposed to a vertical illuminance of 75 lx across all five wall sections for 3 min to establish visual adaptation. Each trial began with all lights being switched off for 1 s, followed by presentation of one experimental lighting condition. The transitions between lighting conditions were immediate. A computerized voice then prompted participants with “Which is dimmest?” Participants compared the wall sections and identified the one that appeared dimmer than the others, reporting their judgment using a wireless numeric keypad that referenced the printed panel numbers.
Response time was not limited. MATLAB recorded all responses (see Figure 3).
Photograph of a participant in seating position A undertaking the experimental task.

Each subject completed 10 repeated trials for each of the 20 test lighting conditions in a randomized sequence, as shown in Table 1. The test conditions always presented one of the five panels with an illuminance that was 5% (71.25 lx), 10% (67.50 lx), 15% (63.75 lx) or 20% (60 lx) less than the other four panels, which remained at the reference illuminance of 75 lx. A flow chart of the experimental procedure can be viewed in Figure 4.
Flow chart of experimental procedure.

The raw data (participants’ responses) collected from the experiments were binary data. Participants either successfully detected the dimmest wall section, which was coded as 1.0, or failed the detection, coded as 0.0. The percentages of correct responses were then calculated. Probit regressions were performed in SPSS to model the relationship between the probability of successful detection and the illuminance difference. Probit regression is a type of statistical regression model commonly used when the dependent variable is binary. It employs the cumulative distribution function of the standard normal distribution to convert linear predictors into probabilities, assuming detection thresholds follow a normal distribution across the population. This distinguishes it from logistic regression, which assumes a logistic distribution with heavier tails. This approach is particularly suitable for psychophysical experiments where responses are dichotomous (correct/incorrect), as the assumption of normality aligns well with psychophysical theory that individual detection thresholds are typically normally distributed around a population mean (Howell Reference Howell2012).
In a spatial five alternative forced choice (5AFC), subjects should correctly identify the dimmer wall section 20% of the time, even when no differences can be perceived (chance). Therefore, the discrimination threshold was defined as the illuminance difference (in percentage) when the predicted probability of a correct response was 60%, halfway between chance and maximum performance (Boothe Reference Boothe2002).
To estimate confidence intervals for the discrimination threshold, a simple nonparametric bootstrap procedure with 1000 samples was performed. Bootstrap resampling is a statistical method that generates multiple resampled datasets with replacement from the original data. It is commonly used to improve confidence interval estimation, especially when the theoretical distribution of the estimator is unknown or complex (Chernick Reference Chernick2011; Howell Reference Howell2012). Standard practice suggests that 1000 bootstrap samples provide the precision needed to estimate 95% confidence intervals (Chernick Reference Chernick2011). The bootstrap method, a statistical technique that resamples the data with replacements from the original dataset, is commonly used to improve confidence interval estimation (Chernick Reference Chernick2011). Statistical significance was determined by examining the overlap of 95% bootstrap confidence intervals around the discrimination thresholds with the predicted possibility of the correct response (60%), as “if the 95% confidence intervals do not overlap, then significant differences at a level of 5% are guaranteed” (Chao et al. Reference Chao, Gotelli, Hsieh, Sander, Ma, Colwell and Ellison2014, p. 57).
4. Results
This study analyzed the detectability of vertical wall illuminance differences for eight scenarios, as described in Table 1. Figure 5 shows the illuminance difference threshold for each of the five illuminated sections of the wall for each experimental scenario. The results suggest that the ability to perceive vertical illuminance differences is largely independent of observer location and gaze. Participants were consistently best at judging differences in illuminance in the center of the wall.
Discrimination thresholds (percentage illuminance difference) and corresponding values for each wall panel across eight experimental scenarios. Asterisks (*) denote statistically significant differences. The discrimination threshold was defined as the illuminance difference (in percentage) when the predicted possibility of the correct response was 60%, halfway between chance and maximum performance.

Scenarios 1 and 3 were the only instances where participants could move their gaze freely across all wall panels (numbered 1–5). The difference between scenarios 1 and 3 was the seating position. In scenario 1, participants sat at position A (Figure 1), centered in front of panel 3. This position produced the lowest threshold for panel 3 and the highest thresholds for panels 1 and 5 at the wall’s ends. In scenario 3, participants sat at position B (Figure 1) in front of panel 5. Despite different seating locations, participants performed similarly in both scenarios when gaze movement was unrestricted. In the fixed gaze scenarios, the results from scenarios 2 and 4 were as expected. In scenario 2, participants were in position A and fixed their gaze on panel 3. Participants were best at judging the illuminance difference of the central panels. In this instance, no confidence interval could be estimated for panel 1 due to the significant variation in the data. In scenario 4, the participants were seated in position B with their gaze fixed on panel 3. Their ability to detect illuminance differences was also best for the centrally located panels (2, 3 and 4). The results for scenarios 2 and 4 show that participants were similarly capable of judging illuminance differences on the central panels when their gaze was fixed on the central panel. However, the seating location had an effect on the participants’ ability to judge illuminance on one of the end panels.
The results of scenarios 5–8 were unexpected. In these scenarios, participants were still better at detecting illuminance differences on the more centrally located panels, despite focusing their gaze on an end panel. In scenario 5, participants fixed their gaze on panel 5 from seating position A. Performance was best for more centrally located panels (panels 3 and 4). Similarly, in scenario 7, participants were requested to fixate on panel 1 from position A. Subjects were most successful at judging differences in illuminance on panels 2 and 3. In scenario 8, participants were seated in position B and fixed their gaze on panel 1, located at the opposite end of the wall. Participants, however, were best at detecting illuminance differences for the panels located in the middle of the wall (panels 2 and 3).
The results from scenario 6 are arguably the most striking and best summarize the findings of this experiment. In this scenario, participants were in seating position B and fixated on panel 5. Although the participants’ gaze was fixed on the panel directly in front of them, they were better at judging illuminance on more centrally located panels than on panel 5. The results indicate that participants were poor at judging illuminance differences at the ends of walls, regardless of their seating location or fixation of their gaze. There was also considerable variability between participants for some conditions (specifically 2, 4, 7 and 8). Large confidence intervals were observed for the fixed gaze scenarios, which required participants to judge illuminance differences on panels in their peripheral vision. The most striking example was in scenario 2, in which participants were seated in front of panel 3 and fixed their gaze on panel 3. Participants’ judgment of illuminance on panel 1 was so variable that no confidence interval could be estimated. Similarly, the confidence interval for panel 5 was very large.
Finally, the data for all participants, scenarios and experimental conditions were combined, and average illuminance discrimination thresholds were obtained. A 95% confidence interval was calculated on the raw data using Probit regression analysis (SPSS) software. No bootstrapping was required to obtain this result. As Figure 5 illustrates, participants have the lowest detection threshold for the middle panel (panel 3). Panels 2 and 4 on each side of the center panel have similar results to each other, as do the outer panels (1 and 5). The slight differences between these pairs are expected as the seating locations were in front of panels 3 and 5. There was no seating location in front of panel 1. These combined results show a pattern consistent with the results found in each of the eight experimental scenarios.
5. Discussion
The initial hypothesis proposed that changes in vertical illuminance would be less noticeable with increased distance from the observer. However, the results revealed a different pattern. Participants consistently demonstrated better detection performance for centrally located wall panels (particularly panel 3), regardless of seating position or gaze direction. Most significantly, when participants were seated directly in front of end panels (such as scenario 6, where participants sat in front of panel 5 and directed their gaze toward it), they still performed better at detecting illuminance differences on the more centrally located panels. Rather than distance being the main factor influencing detection thresholds, the findings suggest that the human visual system has inherent limitations in detecting vertical illuminance differences at wall boundaries and corners. While this unexpected finding challenged the original assumptions, it reveals even greater potential for practical applications in energy-efficient lighting design.
The findings provide clear answers to both research questions posed in this study. Regarding the first question about how spatial separation affects the detection of vertical illuminance differences, the results reveal that spatial separation functions differently than initially hypothesized. Rather than detection sensitivity decreasing linearly with distance, the human visual system exhibits inherent limitations at wall boundaries and corners regardless of observer position or viewing distance. Participants consistently demonstrated superior detection performance for centrally located wall panels, with significantly reduced detection at wall ends even when seated directly in front of those sections. This spatial pattern remained consistent across all eight experimental scenarios, indicating that architectural boundaries and edges, rather than simple distance, are the primary factors limiting illuminance difference detection on vertical surfaces.
For the second research question about whether these thresholds can inform energy-efficient design strategies, the answer is affirmative. The quantified detection thresholds directly translate into actionable design guidelines: vertical illuminance in temporarily unoccupied open plan areas can be reduced by at least 10% without detection, while corner areas can accommodate reductions of 20–25%. These perceptual thresholds provide the scientific foundation for implementing occupancy-responsive lighting strategies using SSL technology and automated controls. Given that lighting accounts for 17% of commercial building energy consumption (CBECS 2017), these detection thresholds enable substantial energy savings while maintaining the perceived quality of illuminated environments. These findings challenge conventional lighting guidelines that advocate for high illuminance uniformity (AS/NZS 2006) and align with Kryszczuk & Boyce’s (Reference Kryszczuk and Boyce2002) study, where illuminance changes become detectable at approximately 20%.
This research establishes a foundational framework for energy-efficient lighting design by examining how subtle changes in illuminance can be implemented without compromising occupants’ visual quality. The study’s controlled laboratory methodology, utilizing a single matte white wall and theatrical luminaires, enabled the precise measurement of detection thresholds within a specific vertical illuminance range of 60–75 lx at a correlated color temperature of 4000 K. Participants, aged 18–50, represented typical working age populations engaged in seated detection tasks and provided conservative baseline data for perceptual capabilities. The laboratory setting allows researchers to isolate specific variables, minimize unpredictable external influences and precisely control the lighting environment.
A limitation of this study is the absence of ambient lighting in the experimental environment. The vertical illuminance levels (60–75 lx) were selected to align with values recommended in current standards, 50–150 lx for office walls (European Standard 2021). However, participants viewed these vertical surfaces in a laboratory rather than within the typical office context. While the vertical illuminance values themselves reflect realistic office conditions, the absence of surrounding ambient illumination means that participants’ eyes were primarily adapted to the vertical surface rather than to the higher overall room illumination. The visual system’s contrast sensitivity and discrimination thresholds vary with the adaptation state (Gescheider Reference Gescheider1997). The findings, therefore, establish detection thresholds for realistic vertical illuminance values but under isolated viewing conditions. Further field studies could be conducted in real office environments based on the findings of this research.
Furthermore, the research specifically concentrated on detection limits rather than acceptability or preference and did not include a distraction task. These considerations, along with the fact that occupants will tolerate reductions in illuminance if informed about the energy-saving benefits (Akashi & Neches Reference Akashi and Neches2005), suggest that illuminance could be decreased beyond what is detectable.
Building on these foundational findings, the research path points toward more comprehensive investigations that include various surface materials, furniture arrangements, and architectural lighting systems. The authors aim to expand beyond the current vertical illuminance focus to explore detection thresholds across horizontal and other surface orientations, ultimately examining all surfaces within three-dimensional spaces. Consequently, obtaining real-world validation that incorporates solid-state lighting (SSL) technology and occupancy-responsive controls, quantifying actual energy savings in operational buildings.
6. Conclusion
This research demonstrates that participants are consistently poor at detecting vertical illuminance differences at wall boundaries, regardless of viewing position or gaze direction. These findings challenge conventional uniformity requirements by establishing detection thresholds for commercial lighting design. Vertical illuminance can be reduced by 10% in open-plan areas and up to 25% in corner areas without detection, while maintaining perceived quality of the vertical illumination viewed at a distance. Since lighting accounts for 17% of commercial building consumption (CBECS 2017), implementing these thresholds offers substantial cost savings and environmental benefits. The study advances lighting design from prescriptive compliance to perceptually informed strategies, providing building designers, lighting professionals and facility managers with evidence-based approaches for optimizing illumination systems.
Acknowledgments
The authors thank Associate Professor Wendy Davis for her contributions to the experimental design and Dr. Timothy Lynch and Professor Emeritus Warren Julian for their editorial contributions.
Financial support
The authors report no funding.
Competing interest
The authors have no known conflicts to disclose.
Ethical statement
The research presented in this article has received ethical approval. Details are as follows: The University of Sydney, Human Research Ethics Committee (HREC). Protocol Title: The detectability of vertical illuminance differences across architectural space. First Named Chief Investigator: Wenye Hu. Protocol Number: 2019/986. Authorized Personnel: Joelene Elliott; Wenye Hu.


 Open access