


Introduction
Cotton is a crucial fiber, accounting for more than 90% of the total fiber traded globally (Wang et al. Reference Wang, Tu, Yuan, Zhu, Shen, Li, Liu, Pei, Wang, Zhao, Ye, Huang, Yan, Ma, Zhang, Liu, You, Yang, Liu, Huang, Li, Qiu, Zhang, Zhu, Jin, Yang, Min, Li, Chen, Zheng, Lindsey, Lin, Udall and Zhang2019). China is one of the leading cotton producers, with approximately 25% of its cotton being grown in the Yangtze River Valley (Yu et al. Reference Yu, Zhang and Feng2015). Weed competition significantly impacts cotton (Wang et al. Reference Wang, Ma, Jiang, Ren, Ma and Ma2015), leading to yield reductions ranging from 10% to 90% (Manalil et al. Reference Manalil, Coast, Werth and Chauhan2017). Factors like nutrients, water, and light are crucial for cotton growth and yield, and weed competition for resources hampers cotton’s development (Wang et al. Reference Wang, Ma, Jiang, Ren, Ma and Ma2015).
Preemergence herbicides followed by postemergence herbicide application are commonly used for weed control in the Yangtze River Valley, while few herbicides could be safely applied POST in cotton fields (Ma et al. Reference Ma, Ma, Peng, Xi, Ma and Li2011; Zhang Reference Zhang2003). Overreliance on one or more herbicides can lead to weed resistance (Charles et al. Reference Charles, Sindel, Cowie and Knox2019). Currently 86 cases of herbicide-resistant weeds have been reported in cotton fields worldwide (Heap Reference Heap2024). In China, weeds resistant to glyphosate and acetyl-CoA carboxylase inhibitors have been found in cotton fields, including goosegrass [Eleusine indica (L.) Gaertn.], crabgrass [Digitaria sanguinalis (L.) Scop.], Chinese sprangletop [Leptochloa chinensis (L.) Nees], redroot pigweed (Amaranthus retroflexus L.), common purslane (Portulaca oleracea L.), and black nightshade (Solanum nigrum L.) (Liu et al. Reference Liu, Xiang, Zong, Ma, Wu, Liu, Zhou and Bai2019; Wei et al. Reference Wei, Zhang, Zha, Wang and Wang2022). Hand hoeing is another common practice among growers in China, but it is labor-intensive, time-consuming, expensive, and often unsuccessful or excessively costly (Ma et al. Reference Ma, Ma, Peng, Xi, Ma and Li2011). Weed control is a major cost of production, and the use of herbicides has potential adverse effects on the environment and human health (Vulchi et al. Reference Vulchi, Bagavathiannan and Nolte2022). Therefore integrated weed management (IWM) systems are recommended for effective herbicide use and the development of optimal weed control strategies (Swanton et al. Reference Swanton, Mahoney, Chandler and Gulden2008; Swanton and Weise Reference Swanton and Weise1991).
The critical period of weed control (CPWC) is a crucial component of IWM systems and serves as the foundation for developing alternative weed management strategies (Swanton and Weise Reference Swanton and Weise1991). The CPWC, as described by Knezevic et al. (Reference Knezevic, Evans, Blankenship, Van Acker and Lindquist2002), is a specific stage in the crop growth cycle during which weeds must be controlled to prevent yield losses from surpassing an established threshold. This threshold is usually determined based on the cost of weed control methods. The CPWC refers to a specific level of weed competition and is determined for each weed–crop combination (Bridges and Chandler Reference Bridges and Chandler1987; Charles et al. Reference Charles, Sindel, Cowie and Knox2019; Papamichail et al. Reference Papamichail, Eleftherohorinos, Frouct-Williams and Gravanis2002; Tursun et al. Reference Tursun, Datta, Budak, Kantarci and Knezevic2016).
Factors like the timing of weed and crop emergence (Webster et al. Reference Webster, Grey, Flanders and Culpepper2009), environmental conditions (Bukun Reference Bukun2004; Tingle et al. Reference Tingle, Steele and Chandler2003), plant nutrition (Buchanan and McLaughlin Reference Buchanan and McLaughlin1975; Tursun et al. Reference Tursun, Datta, Tuncel, Kantaci and Knezevic2015), and row spacing (Buchanan et al. Reference Buchanan, Crowley and McLaughlin1977; Rogers et al. Reference Rogers, Buchanan and Johnson1976; Tursun et al. Reference Tursun, Datta, Budak, Kantarci and Knezevic2016) influence the CPWC. The CPWC is determined by establishing the critical time for weed removal (CTWR), the critical weed-free period (CWFP), and the yield loss threshold (Korres and Norsworthy Reference Korres and Norsworthy2015). The CTWR refers to the period after crop emergence during which weeds can compete with the crop without causing a yield loss exceeding the yield loss threshold. The CWFP, on the other hand, is the minimum period after crop emergence during which the crop must be kept weed-free to prevent yield losses exceeding the threshold.
Many studies have been carried out worldwide on the determination of CPWC under different soil and environmental conditions in various crops, such as cotton (Bryson Reference Bryson1990; Buchanan et al. Reference Buchanan, Crowley, Street and McGuire1980a, Reference Buchanan, Street and Crowley1980b; Bukun Reference Bukun2004; Charles et al. Reference Charles, Sindel, Cowie and Knox2019, Reference Charles, Sindel, Cowie and Knox2020a, Reference Charles, Sindel, Cowie and Knox2020b; Rogers et al. Reference Rogers, Buchanan and Johnson1976), corn (Zea mays L.) (Evans et al. Reference Evans, Knezevi, Lindquist, Shapiro and Blankenship2003a; Uremis et al. Reference Uremis, Uludag, Ulger and Cakir2009), soybean [Glycine max (L.) Merr.] (Arslan et al. Reference Arslan, Uremis and Uludag2006; Knezevic et al. Reference Knezevic, Evans and Mainz2003; Van Acker et al. Reference Van Acker, Swanton and Weise1993), and potato (Solanum tuberosum L.) (Ahmadvand et al. Reference Ahmadvand, Mondani and Golzardi2009; Karimmojeni et al. Reference Karimmojeni, Barjasteh, Mousavi and Bazrafshan2014; Monteiro et al. Reference Monteiro, Henriques and Moreira2011). The potential for weed competition is greater in cotton, mainly due to the slower growth of cotton seedlings, particularly in cool, wet weather (Buchanan and Burns Reference Buchanan and Burns1970).
Many variables have been manipulated to give cotton a competitive advantage over weeds (Rogers et al. Reference Rogers, Buchanan and Johnson1976), including changes in row spacing, fertilizer application, and cotton planting date (Webster et al. Reference Webster, Grey, Flanders and Culpepper2009). Molin et al. (Reference Molin, Hugie and Hirase2004) found that ultra-narrow row spacing of 25 cm may suppress weed development by reducing both vegetative and reproductive growth in a species-specific manner. Additionally, Iqbala et al. (Reference Iqbala, Manalilbcd, Chauhan and Adkins2020) demonstrated that narrow row spacing of 50 cm, as compared to wide row spacing of 100 cm at the same planting density, not only reduces weed growth and increases lint yield but also enhances the competitive ability of cotton plants during early weed–crop interference. Consequently, the CPWC is shorter in narrowly spaced cotton compared to widely spaced cotton (Iqbala et al. Reference Iqbala, Manalilbcd, Chauhan and Adkins2020; Rogers et al. Reference Rogers, Buchanan and Johnson1976; Tursun et al. Reference Tursun, Datta, Budak, Kantarci and Knezevic2016). Several studies have indicated that increasing the nitrogen fertilizer application rate early in the growing season can improve cotton’s ability to compete with weeds and prolong the duration of weed interference (Buchanan and McLaughlin Reference Buchanan and McLaughlin1975; Robinson Reference Robinson1976; Tursun et al. Reference Tursun, Datta, Tuncel, Kantaci and Knezevic2015). However, once weed density reaches 100% or a certain threshold, further nitrogen application no longer leads to higher cotton yields, and no cotton bolls are even produced (Robinson Reference Robinson1976).
In cotton, the CWFP was approximately 8 wk (Buchanan and Burns Reference Buchanan and Burns1970) or 11 to 12 wk (Bukun Reference Bukun2004; Cardoso et al. Reference Cardoso, Alves, Severino and Vale2011; Papamichail et al. Reference Papamichail, Eleftherohorinos, Frouct-Williams and Gravanis2002) in competition with natural weed populations, while the CTWR was only 4 wk (Buchanan and Burns Reference Buchanan and Burns1970) or 1 to 2 wk (Bukun Reference Bukun2004; Papamichail et al. Reference Papamichail, Eleftherohorinos, Frouct-Williams and Gravanis2002) in natural weed populations. The critical period for weed interference in cotton varies widely due to differences in weed species, density, morphology, growth habits, and life cycle (Bridges and Chandler Reference Bridges and Chandler1987; Bryson Reference Bryson1990; Keeley and Thullen Reference Keeley and Thullen1975, Reference Keeley and Thullen1983, Reference Keeley and Thullen1991; Tachie-Menson et al. Reference Tachie-Menson, Buah, Adu and Afutu2021; Webster et al. Reference Webster, Grey, Flanders and Culpepper2009). For example, in studies with barnyardgrass [Echinochloa crus-galli (L.) P. Beauv.], removal delayed for 3 wk after planting did not reduce cotton yield, requiring a 9-wk weed-free period to avoid significant yield loss (Keeley and Thullen Reference Keeley and Thullen1991). Additionally, the critical period for the control of johnsongrass [Sorghum halepense (L.) Pers.] in cotton was found to be between 3 and 5 wk after emergence at a density of more than 2 plants 9.8 m row−1 (Bridges and Chandler Reference Bridges and Chandler1987), while a weed-free period of 8 to 10 wk and a weed interference period of 2 to 4 wk were required for common cocklebur (Xanthium strumarium L.) at an average density of approximately 8 plants m−2 (Snipes et al. Reference Snipes, Street and Walker1987).
The CPWC varies depending on several factors, including weed density; weed species composition; time of weed emergence; crop species and variety; crop density; planting pattern; time of crop planting; climatic conditions; and soil characteristics like temperature, moisture, and fertility (Little et al. Reference Little, DiTommaso, Westbrook, Ketterings and Mohler2021; Stagnari and Pisante Reference Stagnari and Pisante2011). It is important to note that results on CPWC may not be universally applicable due to variations in soil and climatic conditions, as well as differences in weed species and community structure across countries, locations, and seasons (Bukun Reference Bukun2004; Evans et al. Reference Evans, Knezevic, Lindquist and Shapiro2003b; Knezevic et al. Reference Knezevic, Evans, Blankenship, Van Acker and Lindquist2002; Van Acker et al. Reference Van Acker, Swanton and Weise1993). No studies have been conducted to determine the CPWC in direct-seeded cotton under the climatic conditions of the Yangtze River Valley in China, and few studies have focused on the effects of weed competition in this crop. To minimize yield losses caused by weed competition, it is essential to reduce the manual weeding required in cotton fields. Because of variations in growth conditions and yield potential, the CPWC in direct-seeded cotton may vary along the Yangtze River in Anhui Province, China. A thorough understanding of the relationship between weeds and cotton is vital for IWM practices in this region and is of great interest to farmers.
The study aimed to determine the CPWC in direct-seeded cotton, gather information on how mixed natural weed populations affect this crop, and understand when yield-reducing competition occurs. The critical period was estimated using mixed natural weed populations to reflect actual field conditions. Weed control timing was then correlated with growing degree days (GDD) after cotton emergence.
Materials and Methods
Experimental Site
Field experiments were conducted at the Anqing Experimental Station of the Cotton Research Institute, Anhui Academy of Agricultural Science (30.477°N, 116.488°E), in 2011 and 2012. The site is located in the middle Yangtze River Valley, and its soil characteristics include sandy loam, pH ranging from 6.7 to 7.9, and organic matter ranging from 10.3 to 18.3 g kg−1.
The soil was prepared for cotton production according to local practice. In both years, the experimental plots were left fallow for the winter, cultivated in late March, and harrowed before planting. Cotton was sown at a density of 24,000 plants ha−1 with rows spaced 1.15 m apart and at a depth of 4 cm. The cotton cultivar used was ‘Wanzamian 11’, a commonly grown hybrid cotton cultivar in the region, sown on April 25, 2011, and April 24, 2012. Fertilizer was applied with compound fertilizer at 1,500 kg ha−1 (N:P2O5:K2O = 24:11:5, ≥40%, Zhengzhou Naweigao Fertilizer Co., Henan Province, China). All plots received 150 kg ha−1 of urea (46% N) and 150 kg ha−1 of KCl (60% K2O) at the flowering and boll stages. Furrow irrigation was used as needed to help the crop grow (Figure 1). Integrated pest management was considered before any pest control measures were taken. Naturally occurring weed populations were present in all trials. The main weeds in the experiments were goosegrass, crabgrass, Chinese sprangletop, barnyardgrass, copperleaf (Acalypha australis L.), redroot pigweed, and Japanese mazus [Mazus japonicus (Thunb.) Kuntze]. One month before sowing, glyphosate (Roundup® EC, 480 g ai L−1, Bayer Crop Science China, Shanghai, China) was applied at 960 g ai ha−1 in the experimental area. During the trials, weeds were removed by hand hoeing to avoid soil disturbance.

Figure 1. Daily maximum (Tmax) and minimum (Tmin) temperatures (C) (A) and rainfall (B) during the full cotton season at Anqing, Anhui Province, in 2011 and 2012, as recorded by the Anqing Meteorological Bureau. Furrow irrigation was used on August 3, 2011, and August 1 and 25, 2012.
Experimental Design
All trials used a randomized complete-block design with four replicates. Each plot consisted of four rows of cotton plants, each 12 m in length.
To determine the CPWC, we calculated the duration of weed interference (DWI) and the weed-free period (WFP). For the determination of DWI, plots were left weedy for 1, 2, 4, 6, 8, 10, 12, and 14 wk after emergence (WAE), then maintained weed-free. To determine WFP, plots were kept weed-free for 1, 2, 4, 6, 8, 10, 12, and 14 WAE, after which weeds were allowed to grow for the remainder of the growing season. The treatments were compared with two control plots, one kept weed-free and the other weed infested throughout the crop cycle. The cotton yields are expressed as lint + seed (before ginning). The two outer rows of each plot were used as buffer rows, and the two central rows were used for assessment.
Weed and Crop Measurement
The experiments were carried out in successive years with natural weed populations. The goal was to determine the effect of weed–crop competition on the accumulation of weed dry weight and density. Weed samples were collected randomly from four 0.5 × 0.5 m quadrats per plot in the central 8 m of two central rows at each weeding time in the weed-interfered plots and at the end of the growing season in the WFP plots. The weed biomass of weed-infested control was evaluated at 20 WAE. Weeds were cut at ground level and dried at 80 C to achieve a dry weight biomass. The density of each weed species was also recorded.
At maturity, an area corresponding to the central 8 m of the middle two rows of plants in each plot was harvested by hand. The numbers of cotton bolls and fruit branches per plant, plant height, stem diameter, and yield were determined in this area. Additionally, seed cotton weight per boll, lint percentage (ginning percentage), and fiber quality were measured using 100 ripe bolls selected from the middle two rows of each treatment plot at full cotton maturity. Measurements of weeds and crops were transformed to units of square meters and hectares, respectively.
Meteorological Data
Rainfall and daily maximum and minimum temperatures (T max, T min) (C) were obtained from the Anqing weather monitoring network, located within 5 km of the experimental site. These data pertain to the cotton-growing seasons of 2011 and 2012 and are shown in Figure 1.
Statistical Analysis
The logistic model of Equation 1 was fitted to the data for increasing weed duration on seed cotton yield and modified for increasing weed duration on cotton height and stem diameter (Knezevic et al. Reference Knezevic, Evans and Mainz2003):
 $$Y = \left[ {{1}\over{{{\rm{exp}}\left( {C \times \left( {x - D} \right)} \right) + F}}} + {{{F - 1}}\over{F}} \right] \times 100$$
where Y is cotton height, stem diameter, or relative seed cotton yield (percentage of season-long weed-free cotton). D stands for the inflection point, C and F are constants, and x refers to the length of weed interference measured in GDD from crop emergence.
The Gompertz model (Hall et al. Reference Hall, Swanton and Anderson1992) was used to describe the effect of the increasing duration of the WFP on cotton height, stem diameter, and relative yield. The model applied was as follows:
 $$Y = A \times exp[-B \times exp(-K \times x)] $$
where Y is cotton height, stem diameter, or relative seed cotton yield; A is the yield asymptote; B and K are constants; and x is the length of the WFP after emergence in GDD.
GDD, based on air temperatures, were used as explanatory variables in the regression analysis and accumulated from the planting date. A base temperature (T b ) of 15.5 C has been widely used to track phenological stages in cotton production (Viator et al. Reference Viator, Nuti, Edmisten and Wells2005). For each day, the GDD was calculated as follows:
 $${\rm{GDD}} = {{{{T_{{\rm{max}}}} + {T_{{\rm{min}}}}}}\over{2}} - {T_b}$$
In this study, the CPWC was determined using an arbitrary yield loss level of 5%.
To determine the type of relationship between weed dry weight and the treatments, a type I exponential curve was fitted to the series of weed-free treatments (Bukun Reference Bukun2004):
 $$Y = a \times exp(b \times x) $$
where Y represents the weed dry weight (g ha−1), a is the y intercept, b is the asymptote of the curve, and x is the WFP (in GDD). Additionally, Schumacher’s (Reference Schumacher1939) model was employed to analyze the weed biomass accumulated during the weed infestation duration:
 $$y = \exp \left( {a + {{b}\over{x}}} \right)$$
where Y is the weed dry weight (g ha−1), a is the maximum weed biomass, b is the curve’s asymptote, and x is the duration of the weed infestation period (in GDD).
The data were analyzed using general linear models to test for significant main effects and interactions. Weed infesting time and year were used as fixed factors due to significant interactions between weed hazard level and year; data were analyzed separately by year. To determine variation between treatments, analysis of variance and Duncan’s multiple range tests were used with SPSS 19 statistical software. Coefficients of determination (R 2) were calculated for nonlinear regression as a measure of goodness of fit for nonlinear models. All probabilities were two-tailed, with a significance level of P = 0.05. Nonlinear regression was analyzed and plotted using GraphPad Prism 9 statistical software.
Results and Discussion
Weed Measurement
The weed species and the degree of their infestation were quite similar in all plots. The weed community consisted of 27 species from 13 families in the experimental plots studied. Most of the species belong to the Poaceae family, with seven species, followed by the Compositae family with five species (Table 1). In both years, the most abundant species were goosegrass and copperleaf, which accounted for 54% and 82% of the total dry weight and 48% and 76% of the total density in 2011 and 2012, respectively.
Table 1. Weed composition and average density in unweeded controls measured at 1, 2, 4, 6, 8, 10, 12, and 14 wk after emergence at Anqing, Anhui Province, in 2011 and 2012. a

a Abbreviation: WAE, weeks after emergence.
b Poa annua L.
c Setaria viridis (L.) P. Beauv.
d Cyperus difformis L.
e Equisetum ramosissimum Desf.
f The other weed species include bermudagrass [Cynodon dactylon (L.) Pers.], shepherd’s purse [Capsella bursa-pastoris (L.) Medik.], sticky chickweed (Cerastium glomeratum Thuill.), Canada thistle [Cirsium arvense (L.) Scop.], black nightshade, cutleaf groundcherry (Physalis angulata L.), horseweed [Conyza canadensis (L.) Cronquist], and spotted spurge [Euphorbia maculata (L.) Small].
As the duration of weed infestation increased, both the density and the biomass of the weeds also increased (Table 1; Figure 2 A and B). However, the weed density reached its peak at 6 WAE (327 to 404 GDD), with 147 plants m−2 in 2011 and 608 plants m−2 in 2012. Subsequently, it gradually decreased from 8 WAE (535 to 581 GDD) onward (Table 1). This phenomenon may be attributed to both interspecific and intraspecific competition among the weed species being present at high densities (Chandler Reference Chandler1977; Papamichail et al. Reference Papamichail, Eleftherohorinos, Frouct-Williams and Gravanis2002). Weed dry weight did not significantly increase until the weed interference period was extended to 6 WAE (327 to 404 GDD), after which the weeds accumulated more dry matter, fitting Schumacher’s model (Figure 2 A and B). The total weed biomass in the weed interference treatment was higher in 2012 than it was in 2011, with the maximum total weed biomass ranging from 7,084 kg ha−1 in 2011 to 12,102 kg ha−1 in 2012 for the 20-wk interference period. Weed density was generally higher in 2012 than it was in 2011. In the continuous weed experiment field, an increased soil weed seed bank in 2012, coupled with more suitable temperatures and increased rainfall in May (Figure 1), resulted in increased weed density and biomass in the cotton field compared with 2011, leading to increased weed competition. On the other hand, weed dry weight was not significantly affected when weed control was greater than 6 WAE (327 to 404 GDD), and the weed biomass decreased with increasing weed-free duration, fitting the exponential model (Figure 2 C and D).

Figure 2. Effects of duration of weed interference (DWI) (A, B) and duration of weed-free period (WFP) (C, D) on weed dry weight accumulation at Anqing, Anhui Province, in 2011 and 2012. Black and white circles indicate observed data, and bars are standard errors of these data. Parameter values for the response curves are based on a Schumacher’s model Y = exp(a + b/x) (A, B) and an exponential model Y = a × exp(b × x) (C, D) and are shown in the equation, where Y is weed biomass and x is growing degree days (GDD) of weed interference (A, B) or weed-free (C, D).
Cotton Growth in Response to Weed Interference
The growth data are presented separately due to a significant interaction between years and treatment level. Cotton plant height and stem diameter changed in response to weed interference or WFPs, fitting well with the modified logistic and Gompertz models, respectively, as shown in Figure 3. These findings may offer valuable insights for future weed control recommendations (Michael et al. Reference Michael, Clarence and Glenn1992). When weed competition persisted for 10 WAE (795 GDD) or later in 2011 and for 6 WAE (404 GDD) or later in 2012, there was a significant reduction in cotton plant height. No reduction in height occurred when the cotton was kept weed-free for at least 6 wk (327 to 404 GDD) in 2011 and 2012. Cotton stem diameter was reduced when plots were weed-free for <8 WAE (535 GDD) in 2011 and <4 WAE (255 GDD) in 2012. Weed competition for 10 WAE (795 GDD) or later in 2011 and 6 WAE (404 GDD) or later in 2012 caused significant reductions in cotton stem diameter. At the end of the growing season, cotton plants in weed-free plots were 35 and 55 cm taller and 10 and 13 mm thicker in cotton stem diameter than those in weed-infested plots in 2011 and 2012, respectively.

Figure 3. Response of cotton plant height (A, B) and stem diameter (C, D) to increasing WFP and DWI at Anqing, Anhui Province, in 2011 (A, C) and 2012 (B, D). Black and white circles indicate observed data, and bars are their standard errors. White circles show the effect of the DWI on cotton height and stem diameter with curves based on the modified logistic model, and black circles show the effect of the increasing length of the WFP on cotton plant height and stem diameter with curves based on the Gompertz model. Parameters of the Gompertz and logistic models are shown in the equation, where Y is cotton height (A, B) or stem diameter (C, D) and x is GDD of weed interference or weed-free.
The experiment showed that cotton plant height and stem diameter decreased as weed infestation increased. This trend continued until the plants reached their lowest levels with season-long weed interference, consistent with the period reports (Buchanan and Burns Reference Buchanan and Burns1971; Bukun Reference Bukun2004; Evans et al. Reference Evans, Knezevic, Lindquist and Shapiro2003b). The results are in line with the findings of Keeley and Thullen (Reference Keeley and Thullen1991) that prolonged weed interference with mixed weed populations not only leads to shading effects from tall and stout weeds on cotton plants (Scott et al. Reference Scott, Askew, Wilcut and Brownie2000) but also potentially results in nutrient deficiencies in their growth (Zhang, Peng et al. Reference Zhang, Peng and Wang2022). This highlights the high sensitivity of cotton crops to weed interference. The experiment also observed that cotton stem diameter is slightly more sensitive to weed competition than height, contrary to the conclusion of Buchanan and McLaughlin (Reference Buchanan and McLaughlin1975). This observation may be attributed to the critical role that plant height plays in the ability of cotton to compete for light (Westoby Reference Westoby1998).
Seed Cotton Yield Components in Response to Weed Interference
In both years, weed interference had a negative impact on seed cotton yield components (Table 2). There was no significant effect of weed interference on the number of cotton bolls and fruit branch reduction per plant for the initial 8 WAE (535 GDD) in the 2011 and 4 WAE (255 GDD) in the 2012 growing seasons, respectively. Weed infestation had no significant effect on single-boll weight reduction in the first 12 WAE (878 GDD) in 2011 and 6 WAE (404 GDD) in 2012. When weeds interfered with cotton throughout the growing season, there was a 65% and 82% reduction in cotton fruit branch number and an 86% and 96% loss in cotton boll number in 2011 and 2012, respectively. The most significant impact of weed interference was on cotton boll number, with greater reductions observed in 2012 than in 2011.
Table 2. Effect of weed interference duration on seed cotton yields and yield components at Anqing, Anhui Province, in 2011 and 2012. a,b,c
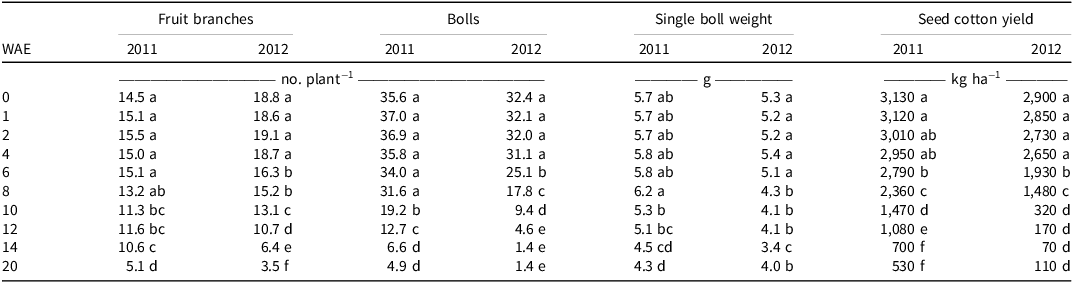
a Values are means.
b Abbreviation: WAE, weeks after emergence.
c Means within a column followed by the same letter are not significantly different according to Duncan’s multiple range test at the 0.05 level.
Compared with the weed-free plots, there was a significant decrease in the number of cotton fruit branches when the cotton was kept weed-free for the first 4 wk (229 to 255 GDD) in both years. Additionally, the reduction in cotton boll number was significant in the first 6- (327 GDD) and 8-wk (581 GDD) weed-free treatments in 2011 and 2012, respectively. Furthermore, cotton single boll weight decreased significantly in the first 4 wk (229 to 255 GDD) of weed-free treatment in both years. It is also worth noting that the cotton boll number is most sensitive to the WFP, and the effect of a WFP on seed cotton yield components was more significant in 2012 than it was in 2011 (Table 3).
Table 3. Effect of weed-free periods on seed cotton yields and yield components at Anqing, Anhui Province, in 2011 and 2012. a,b,c
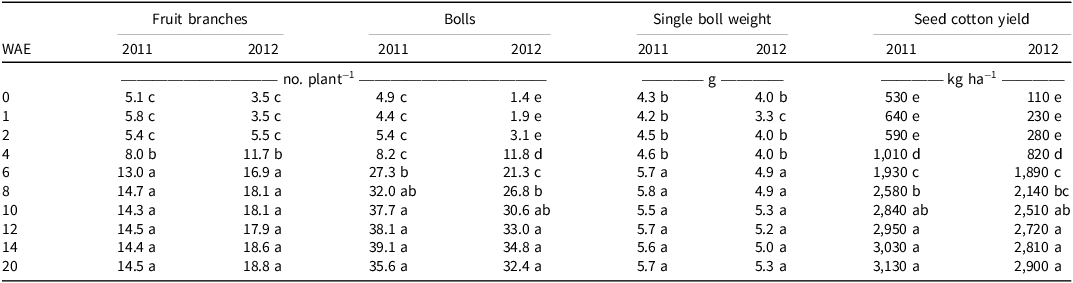
a Values are means.
b Abbreviation: WAE, weeks after emergence.
c Means within a column followed by the same letter are not significantly different according to Duncan’s multiple range test at the 0.05 level.
Increased weed competition tends to lead to a decrease in the number of bolls and fruit branches per cotton plant, as well as the individual boll weight. However, the lint percentage does not show a clear pattern of change in this study (data not presented). Among these traits, the number of bolls per plant is the most sensitive to weed competition, followed by the number of fruit branches, boll weight, and lint percentage (Evans et al. Reference Evans, Knezevi, Lindquist, Shapiro and Blankenship2003a; Li et al. Reference Li, Zhu, Lu, Ye, Ma, Ma and Cheng2017). Some researchers have emphasized that cotton yield losses were partly due to reduced boll size from weed competition (Buchanan and Burns Reference Buchanan and Burns1971; Byrd and Coble Reference Byrd and Coble1991). However, it has been demonstrated that boll number and lint percentage, as well as boll number and boll weight, jointly accounted for >70% of the genotypic and Genotype × Environment variations in lint yield. Furthermore, it was found that the number of bolls per unit area contributed the most to genotypic and Genotype × Environment variations for lint yield (Wu et al. Reference Wu, Jenkins, Mccarty and Zhu2004). It was confirmed that the number of bolls per plant and single boll weight were essential traits related to cotton yield under adversity (Sun et al. Reference Sun, Ma, Shi and Yang2023), and continued damage from weed infestations led to a decrease in boll number and single boll weight (Zhang, Peng et al. Reference Zhang, Peng and Wang2022). The reduction in the number of bolls per plant and individual boll weight with increasing spurred anoda density could be attributed to decreased fruiting positions (Molin et al. Reference Molin, Boykin, Hugie, Ratnayaka and Sterling2006). This indicates that the reduction in cotton yield caused by weed interference is attributed to a decrease in the number of fruiting branches per plant, which leads to a reduction in both the number of bolls per plant and the weight of individual bolls (Tingle et al. Reference Tingle, Steele and Chandler2003). Overall, the effects of weed competition for nutrients, water, and light throughout the full growing season resulted in shorter, thinner cotton plants; fewer fruiting branches and bolls per plant; smaller boll size; and, consequently, lower cotton yields in this study (Postma et al. Reference Postma, Hecht, Hikosaka, Nord, Pons and Poorter2021).
The duration of weed competition did not significantly affect cotton fiber properties, and cotton fiber properties were not significantly affected by variation in the WFP (data not shown). Micronaire, fiber strength, fiber elasticity, and 2.5% fiber span length were within acceptable marketing limits.
Seed Cotton Yield Response and Critical Period of Weed Control
Owing to significant interactions between years and treatment levels (data not shown), the data were not pooled across years. In 2011, the seed cotton yield in weed-free plots was 3,130 kg ha−1, which was higher than the yield of 2,900 kg ha−1 in 2012. These yields were similar to those reported in previous competition studies in cotton (Barnett and Steckel Reference Barnett and Steckel2013; Bukun Reference Bukun2004; Cardoso et al. Reference Cardoso, Alves, Severino and Vale2011; Korres and Norsworthy Reference Korres and Norsworthy2015) and lower than the yields reported by Charles et al. (Reference Charles, Sindel, Cowie and Knox2019, Reference Charles, Sindel, Cowie and Knox2020a, Reference Charles, Sindel, Cowie and Knox2020b). Cotton was strongly infested by naturally occurring weed flora in the Yangtze River Valley, with season-long interference resulting in an 83% reduction in seed cotton yield in 2011 and a 96% reduction in 2012. These reductions were similar to those reported by Cardoso et al. (Reference Cardoso, Alves, Severino and Vale2011) and slightly less than those reported by Bukun (Reference Bukun2004) and Papamichail et al. (Reference Papamichail, Eleftherohorinos, Frouct-Williams and Gravanis2002) for naturally occurring weed flora. This level of yield loss was comparable to the 84% reduction in cotton lint yield caused by mungbean [Vigna radiata (L.) R. Wilczek] (Charles et al. Reference Charles, Sindel, Cowie and Knox2020b) and Japanese millet [Echinochloa esculenta (A. Braun) H. Scholz] (Charles et al. Reference Charles, Sindel, Cowie and Knox2020a) and similar to the 97% yield loss reported by Keeley and Thullen (Reference Keeley and Thullen1991) for season-long competition with barnyardgrass at specific plant densities. The decline in seed cotton yield may be attributed to the types of weeds present in the Yangtze River Valley (Table 1), such as goosegrass (grass) and copperleaf (smaller broadleaf weeds of intermediate size). The competitive ability of these weeds varies depending on their species, size, and density.
There was a reduction in seed cotton yield with an increasing duration of weed presence in the two years fitted to the logistic model (Figure 4). Compared with the full-season weed-free plots, seed cotton yields were significantly reduced when weeds were not removed at 6 WAE or later in 2011 (535 GDD) and 2012 (404 GDD) (Table 2). Seed cotton yield increased with weed-free duration in a Gompertz manner (Figure 4). When the weed-free duration was <8 WAE in 2011 (535 GDD) and 2012 (581 GDD), seed cotton yield decreased significantly (Table 3). The results of yield with weed interference or weed freedom are similar to those of Bukun (Reference Bukun2004), Cardoso et al. (Reference Cardoso, Alves, Severino and Vale2011), Korres and Norsworthy (Reference Korres and Norsworthy2015), and Papamichail et al. (Reference Papamichail, Eleftherohorinos, Frouct-Williams and Gravanis2002), who found that cotton yield was positively correlated with the duration of the WFP after crop emergence and negatively correlated with the weed-infested period. It is evident that weeds that emerge at the same time as cotton or earlier are more competitive and cause more significant yield losses than weeds that emerge later in the cotton growth cycle (Barnett and Steckel Reference Barnett and Steckel2013; Zhang, Peng et al. Reference Zhang, Zhai and Huang2022). In the lower Yangtze River Valley, cotton’s peak flowering and fruiting periods occur in July and August, when soil moisture deficiency negatively affects plant morphological characteristics and yield components (Tohir et al. Reference Tohir, Rustam, Yang, Shukhrat, Sardorbek, Jaloliddin, Saidgani, Zhang and Alisher2018). However, there were more suitable temperatures and more rainfall in July and August 2011 (Figure 1), which was favorable for seed cotton yield development compared to 2012 (Bukun Reference Bukun2004; Rajcan and Swanton Reference Rajcan and Swanton2001). Thus the seed cotton yield in 2011 was higher than it was in 2012.

Figure 4. The relationship between cotton relative yield (% of season-long weed-free) and the duration of both weedy (white circles) and weed-free (black circles) intervals at Anqing, Anhui Province, in 2011 (A) and 2012 (B). The dots represent observed data and parameter values for response curves based on modified logistic and Gompertz models, respectively. The horizontal dashed lines indicate the 5% acceptable yield loss level used to determine the critical period for weed control (CPWC), while vertical dashed lines indicate the beginning and end of the CPWC with bracketed values. The parameters of the Gompertz (critical time for weed removal) and logistic (critical weed-free period) models are shown in the equation, where Y is cotton relative yield (% of season-long weed-free) and x is GDD of weed interference or weed-free. The point of minimum yield loss is indicated by the red lines.
The point where the weed removal and weed interference curves intersect represents the minimum yield loss point for a single weed control measure. This point can be used to measure the relative competitiveness of weeds and crops (Webster et al. Reference Webster, Grey, Flanders and Culpepper2009). In 2011, the point of minimum yield loss was 22% yield loss at 142 to 147 plants m−2, corresponding to 511 GDD and 2,440 kg weed biomass ha−1. In 2012, the minimum yield loss was 34% at a weed density of 608 plants m−2 (Table 1; Figure 4), corresponding to 460 GDD and 3,640 kg weed biomass ha−1 (Figures 2 and 4). These results are similar to those reported by Webster et al. (Reference Webster, Grey, Flanders and Culpepper2009) for Benghal dayflower (Commelina benghalensis L.) competing with cotton, where for cotton planted in June 2004, the point of minimum yield loss of 19% occurred at 174 g weed biomass m−2 and 373 GDD. Charles et al. (Reference Charles, Sindel, Cowie and Knox2019) also reported results for one common sunflower (Helianthus annuus L.) plant m−2 competing with cotton, showing a 20% yield reduction at 378 GDD and 139 g weed biomass m−2. Additionally, Charles et al. (Reference Charles, Sindel, Cowie and Knox2019, Reference Charles, Sindel, Cowie and Knox2020a) found that the point of minimum yield loss increased with increasing weed density for the mimic weeds common sunflower and Japanese millet in high-yielding cotton, which is consistent with the trend of yield reduction in cotton from 2011 to 2012 (Figure 4).
Using a 5% yield loss threshold, the critical weed removal time occurred at 218 GDD, ∼23 DAE in 2011, and at 145 GDD, ∼14 DAE in 2012 (Figure 4). This result differs from the results of previous studies that reported a 1- to 2-wk delay (Bukun Reference Bukun2004; Papamichail et al. Reference Papamichail, Eleftherohorinos, Frouct-Williams and Gravanis2002), 4 wk of weed interference (Buchanan and Burns Reference Buchanan and Burns1970; Ma et al. Reference Ma, Ma, Xi, Jiang, Ma and Li2012), or 31 d of weed interference (Cardoso et al. Reference Cardoso, Alves, Severino and Vale2011). However, it aligns with the results of Tingle et al. (Reference Tingle, Steele and Chandler2003) for smellmelon [Cucumis melo L. var. dudaim (L.) Naud.] at a density of 10 plants m−1 and of Webster et al. (Reference Webster, Grey, Flanders and Culpepper2009) for natural populations of Benghal dayflower in June-planted cotton. Similar results were also reported by Korres and Norsworthy (Reference Korres and Norsworthy2015) for naturally occurring weed flora in the absence of rye (Secale cereale L.) in 2009, where a rye cover crop could delay weed emergence and reduce both weed populations and weed biomass. On the other hand, the CWFP ended at 869 GDD, corresponding to 82 DAE in 2011 and 994 GDD (85 DAE) in 2012 for a 5% yield reduction threshold. These findings are consistent with previous research by Bukun (Reference Bukun2004) and Charles et al. (Reference Charles, Sindel, Cowie and Knox2020a) for 10 Japanese millet plants m−2 in high-yielding cotton. However, they are longer than the findings of Buchanan and Burns (Reference Buchanan and Burns1970), Cardoso et al. (Reference Cardoso, Alves, Severino and Vale2011), and Papamichail et al. (Reference Papamichail, Eleftherohorinos, Frouct-Williams and Gravanis2002).
It’s worth noting that using GDD as a temporal measurement can diminish the impact of seasonal temperature differences in the field experiment (Tursun et al. Reference Tursun, Datta, Budak, Kantarci and Knezevic2016; Webster et al. Reference Webster, Grey, Flanders and Culpepper2009). The onset of CPWC seems to be more affected by variations in weed density and environmental conditions than the end of CPWC (Michael et al. Reference Michael, Clarence and Glenn1992), and late weed emergence and reduced weed populations have been documented to affect the CPWC and its components (Korres and Norsworthy Reference Korres and Norsworthy2015). Changes in precipitation affect soil water content and nutrient availability, influencing photosynthesis and plant growth (Zhang, Zhai et al. Reference Zhang, Zhai and Huang2022). It has been observed that soil moisture levels have a more significant effect on weed infestation curves than on weed-free curves (Tingle et al. Reference Tingle, Steele and Chandler2003; Weaver et al. Reference Weaver, Kroppp and Groeneved1992). In the experiment, higher rainfall in May 2012 than in 2011 and increased weed density in early 2012 significantly affected cotton seedling growth (Figure 1; Table 1), leading to an earlier CPWC in 2012 than occurred in 2011.
Practical Implications
In the lower Yangtze River Valley, it is crucial to maintain a high level of weed control between 14 and 85 DAE to prevent crop losses from exceeding a 5% yield loss threshold. Even at lower weed densities, it is important to control weeds before they go to seed. This is crucial to protecting lint quality, avoid harvest problems, and delay herbicide resistance by massively reducing the number of seeds in the weed seedbank over time (Charles et al. Reference Charles, Sindel, Cowie and Knox2020b; Korres and Norsworthy Reference Korres and Norsworthy2015). To achieve high levels of weed control and reduce the weed seedbank, a more integrated approach to weed control is necessary. This includes using residual herbicides such as diuron, isoxaflutole, flumioxazin, oxyfluorfen, prometryn, and trifluralin, as well as POST applications of fluoroglycofen-ethyl, sethoxydim, fluazifop-p-butyl, acifluorfen, glyphosate, and glufosinate. Additionally, cotton growers should use spot spraying, cultivate between rows, and manually remove weeds that have escaped before setting the seed. It is essential to factor the costs of these different control methods into the critical-period model, as they will affect the weed control threshold.
Acknowledgments
We are grateful for the contributions of the many assistants involved in this project.
Competing interests
The authors declare no conflicts of interest.


 Open access