


Introduction
The principle that the preferences of elected representatives should match those of their voters is widely recognized as one of the cornerstones of a properly functioning democracy (Diamond and Morlino, Reference Diamond and Morlino2005; Powell, Reference Powell2000, Reference Powell2004). This alignment is crucial not only for normative and procedural issues but also affects the performance of the political system (Diamond and Morlino, Reference Diamond and Morlino2004). In this sense, elections serve as the primary mechanism for maintaining a continuous connection between the positions of representatives and the stances of the public (Dahl, Reference Dahl1989; Powell, Reference Powell2000).
This concept of representation – with policymakers’ preferences roughly mirroring those of the voters – has been consistently validated over years of research, as scholars underlined the high levels of mass-elite congruence across a wide array of topics (Lupu et al., Reference Lupu, Selios and Warner2017; Page and Shapiro, Reference Page and Shapiro1983; Thomassen and Schmitt, Reference Thomassen and Hermann Schmitt1997; Wlezien and Soroka, Reference Wlezien and Soroka2012). Nonetheless, there is also substantial evidence indicating that elected officials are more likely to align with wealthier or better educated segments of society (Dolný and Baboš, Reference Dolný and Baboš2015; Flavin, Reference Flavin2012; Flavin and Franko, Reference Flavin and Franko2017; Gilens, Reference Gilens2005, Reference Gilens2012; Lupu and Warner, Reference Lupu and Warner2022a, Reference Lupu and Warner2022b; Persson and Sundell, Reference Persson and Sundell2024; Peters and Ensink, Reference Peters and Ensink2015; Rosset and Stecker, Reference Rosset and Stecker2019; Winters and Page, Reference Winters and Page2009). This pattern of unequal representation has been observed not only in the United States, where it was first identified (Bartels, Reference Bartels2008), but also across European countries (Elsässer et al., Reference Elsässer, Hense and Schäfer2021; Giger et al., Reference Giger, Rosset and Bernauer2012; Peters and Ensink, Reference Peters and Ensink2015).
Yet, comparative research on unequal representation has emerged only recently, with some analyses exploring a specific range of policy issues (Donnelly and Lefkofridi, Reference Donnelly and Lefkofridi2014; Persson and Sundell, Reference Persson and Sundell2024; Traber et al., Reference Traber, Hänni and Häusermann2018). Furthermore, most studies in this field tend to focus either on specific policy areas – such as European integration (see Pareschi et al. Reference Pareschi, Giglioli and Baldini2023) – or on the general left–right dimension (e.g., Lupu and Warner, Reference Lupu and Warner2022a), typically examining representation gaps between the more and less affluent (or educated), as well as between ordinary citizens and business-oriented interest groups.
We argue that economic elites – individuals who own or hold top positions in large firms and business associations – represent a key factor in the political dynamics of modern democracies. Yet, the investigation of the differences between the political representation of voters vis-à-vis such elites remains largely unexplored. This paper aims to address this gap by providing a longitudinal comparative analysis of mass-elite congruence to address the extent to which the positions of party representatives elected to legislative offices effectively mirror the preferences of their voters and economic elites, respectively. Our study encompasses a broad range of policy issues and dimensions over ten years (2007–2017). This allows us to capture the effect of a major critical juncture, such as the Eurozone crisis, on European party systems.
Rather than utilizing income quantiles or other proxies to capture economic elites and measure their attitudes, we rely on survey questions administered to individuals belonging to this category across three waves of two separate mass-elite surveys: IntUne and EUENGAGE (Cotta et al., Reference Cotta, Isernia and Bellucci2013, Reference Cotta, Isernia, Basile, Borri, Marangoni, Olmastroni and Verzichelli2021). Through the use of an innovative measure – the Earth Mover’s Distance (EMD) (Lupu et al., Reference Lupu, Selios and Warner2017) – our study uncovers a general elite bias among elected party representatives, whose positions align more closely with the preferences of economic elites than with those of their voters, particularly on European integration policies and cultural values. However, our analysis also shows a significant reduction of said bias in the aftermath of the Eurozone crisis, thus indicating a substantial realignment on the part of the elected officials with the attitudes of their supporters. In line with previous literature on unequal representation and the affluence gap, we also find that representatives from governing and right-leaning political actors – as well as mainstream parties – are more likely to align themselves with economic elites.
Congruence and unequal representation
Broadly speaking, the literature on political representation in democratic systems aims at clarifying the relationship between voters and their elected representatives by examining congruence and responsiveness (for more, see Beyer and Hänni, Reference Beyer and Hänni2018). Congruence captures “the extent to which the actions of the representative are in line with the interests of the represented […], whereas responsiveness refers to how representatives change their behavior to become more congruent with the interests of the represented” (Golder and Ferland, Reference Golder, Ferland, Herron, Pekkanen and Shugart2018: 215), thereby capturing, respectively, “static and dynamic forms of representation”. Though analytically distinct, both concepts provide complementary information on the different dimensions of representation and democratic performance (Lax and Phillips, Reference Lax and Phillips2012). Given our research objectives, the study primarily focuses on analysing congruence in the policy preferences of elected party representatives, their supporters, and economic elites.
This approach is generally regarded as the most suitable for comparative analyses and scholarly works that aim to explore the extent to which elected officials reflect the stances of their electors (Lupu and Warner, Reference Lupu and Warner2022b). In this respect, researchers have extensively examined, among other things, the degree of ideological proximity between the public and its representatives (Dalton, Reference Dalton2015; Golder and Stramski, Reference Golder and Stramski2010; Huber and Powell, Reference Huber and Powell1994; Werner, Reference Werner2020), policy priorities and positions (Dageförde, Reference Dageförde2023; Devine and Ibenskas, Reference Devine and Ibenskas2021; Jones and Baumgartner, Reference Jones and Baumgartner2005; Rosset and Stecker, Reference Rosset and Stecker2019; Stecker and Tausendpfund, Reference Stecker and Tausendpfund2016), as well as voting behaviour in the legislative arena (Bartels, Reference Bartels1991; Hanretty et al., Reference Hanretty, Lauderdale and Vivyan2017) and policies enacted (Gilens, Reference Gilens2005, Reference Gilens2012). This research field has significantly evolved from its initial focus on the United States to include comparative analyses of European and Latin American countries.Footnote 1
Notably, scholars have devoted an increasing amount of attention to the issue of inequality in political representation (see Bartels, Reference Bartels2008). This line of inquiry posits that political representation is unequal across the public, with certain subgroups enjoying a disproportionate degree of clout. As a result, these specific subsections of the population often share a closer connection with political elites. Numerous studies found that representatives’ positions are likely to be more aligned with the stances of the more affluent section of the citizenry (Bartels, Reference Bartels2008; Flavin, Reference Flavin2012; Flavin and Franko, Reference Flavin and Franko2017; Lupu and Warner, Reference Lupu and Warner2022b, Reference Lupu and Warner2022a; Persson and Sundell, Reference Persson and Sundell2024; Peters and Ensink, Reference Peters and Ensink2015; Winters and Page, Reference Winters and Page2009) and/or better educated citizens (Dolný and Baboš, Reference Dolný and Baboš2015; Gilens, Reference Gilens2005, Reference Gilens2012; Rosset and Stecker, Reference Rosset and Stecker2019). Far from being restricted to a narrow set of topics, these studies demonstrate that unequal representation encompasses a broad range of cultural and economic issues in both the United States and Europe, underscoring the pervasive nature of this discrepancy.
Similarly, business-oriented interest groups have been found to exert a disproportionate influence. Although this phenomenon is not necessarily anti-democratic, as interest groups can strengthen the effect of citizens’ preferences or broaden the range of demands in a more representative manner (Judge and Thomson, Reference Judge and Thomson2019), it nonetheless raises important concerns. Evidence from the American context – both at the federal and the state level – suggests that business-oriented interest groups often dominate the political landscape to the detriment of the general population (Lax and Phillips, Reference Lax and Phillips2012) and issue-specific epistemic communities (Jacobs and Page, Reference Jacobs and Page2005), prioritizing their interests over broader societal concerns. More generally, studies of unequal representation can be placed within the theoretical traditions that emphasize the impact of economic elites on democratic representation (Gilens and Page, Reference Gilens and Page2014).
While recent scholarly work has expanded to include the European continent, the study of unequal representation remains predominantly centred on the American political landscape. Current research on Europe largely confirms the existence of a representation gap (Peters and Ensink, Reference Peters and Ensink2015) that favours wealthier citizens over their less affluent counterparts. However, comparative research on this topic “is still in its infancy” (Burgoon et al., Reference Burgoon, Lupu, Pontusson and Schakel2022: 301), with most studies focusing on single-country analyses (Elsässer et al., Reference Elsässer, Hense and Schäfer2021; Persson, Reference Persson2024; Schakel and Hakhverdian, Reference Schakel and Hakhverdian2018). Europe-based comparative research on representation gaps generally investigates the broader left-right ideological dimension (Giger et al., Reference Giger, Rosset and Bernauer2012; Lupu and Warner, Reference Lupu and Warner2022a, Reference Lupu and Warner2022b; Rosset et al., Reference Rosset, Giger and Bernauer2013) or specific issues like European integration (Thomassen and Schmitt, Reference Thomassen and Hermann Schmitt1997).
To this end, our study aims at exploring unequal representation in Europe across a more diverse range of policy issues. Notable works in this subfield include the study by Donnelly and Lefkofridi (Reference Donnelly and Lefkofridi2014), which assessed mass-elite congruence in 36 European countries between 1980 and 2009. In their analysis, the authors demonstrated that attitudes towards redistribution have a minimal effect on redistributive policies, whereas the attitudes of the more affluent primarily influence socio-cultural policies. Drawing on a wide range of policy attitudes across several decades, recent studies (Persson and Sundell, Reference Persson and Sundell2024; Traber et al., Reference Traber, Hänni, Giger and Breunig2022) confirm the existence of an affluence bias in European governments (Lupu and Warner, Reference Lupu and Warner2022a, Reference Lupu and Warner2022b). In particular, the preferences of higher-income citizens are more likely to be prioritized, especially when they diverge from those of less affluent groups (Traber et al., Reference Traber, Hänni, Giger and Breunig2022: 368). Additionally, evidence shows how the attitudes of wealthier citizens are also somewhat better reflected in policy changes (Gilens, Reference Gilens2012; Persson and Sundell, Reference Persson and Sundell2024).
Although the literature demonstrates that the patterns of unequal representation observed in the United States may also apply to Europe, these studies have often relied on income as the sole criterion for distinguishing between different segments of the population and singling out elites from the average voter. Yet, elite theories on unequal representation suggest a need to consider a wider array of economic indicators – income, wealth, business ownership, and leadership roles in major corporations or associations – to define the notion of economic elite more accurately.
In this sense, most studies on unequal representation have yet to comprehensively address the role that certain homogeneous groups of resourceful citizens might have on mass-elite congruence. The only available evidence from U.S.-based analyses highlights the outsized influence wielded by business-oriented interest groups, corporations, and professional associations on policy developments (Gilens and Page, Reference Gilens and Page2014; Jacobs and Page, Reference Jacobs and Page2005; Lax and Phillips, Reference Lax and Phillips2012). Much like the affluent, economic elites may provide political parties with vital organizational resources in exchange for privileged access and influence over policy agendas and decisions. More specifically, they may gravitate toward certain parties due to ideological proximity (Allern et al., Reference Allern, Klüver, Marshall, Otjes, Rasmussen and Witko2022), capacity to shape legislative outcomes (Fouirnaies and Hall, Reference Fouirnaies and Hall2014), and the possibility to either exploit mutually beneficial policy alignments (Hall and Deardorff, Reference Hall and Deardorff2006) or mitigate potential risks to their interests (Katsaitis, Reference Katsaitis2020).
These considerations highlight the need for an in-depth, longitudinal, and comparative analysis across Europe based on a more targeted definition of economic elites. This would enable a systematic assessment of whether and how the dynamics observed in the American context extend to Europe, providing a broader perspective on the role of economic elites in shaping political representation.
Elite bias and congruence in Europe
A substantial body of evidence on representation gaps between citizens and their representatives reveals that congruence is often relatively high on the general left–right dimension, while instances of incongruence become more pronounced on specific policy issues (Dalton, Reference Dalton2015; Rosset and Stecker, Reference Rosset and Stecker2019). Specifically, a persistent misalignment between pro-European political elites and more sceptical citizens has been repeatedly confirmed over the past several decades (Marzi and Pareschi, Reference Marzi and Pareschi2025; Mattila and Raunio, Reference Mattila and Raunio2006, Reference Mattila and Raunio2012; Real-Dato, Reference Real-Dato2017; Thomassen and Schmitt, Reference Thomassen and Hermann Schmitt1997; Vogel and Göncz, Reference Vogel, Göncz, Conti, Göncz and Real-Dato2019). Similarly, political elites have been found to adopt less conservative and authoritarian positions than the general public (Thomassen, Reference Thomassen2012). Overall, however, this research provides little insight into how the representation of citizens compares to that of other relevant societal groups.
With this in mind, our research seeks to understand the extent of elite bias in representation across several European democracies, as well as identify the factors that may significantly impact the incidence of this bias. Given the existing evidence of a systematic preference for wealthier citizens in various national contexts and policy areas (Lupu and Warner, Reference Lupu and Warner2022b; Persson, Reference Persson2024; Persson and Sundell, Reference Persson and Sundell2024), we anticipate the presence of similar patterns in European domestic political landscapes. However, our analysis operationalizes the notion of economic elite by referring specifically to individuals holding economically influential positions within a given country – owners or top managers of big firms, leaders of business associations (for the selection criteria of economic elites, see the Online Appendix). This conceptualization is functional to our research goal, as it defines a different approach to exploring unequal representation compared to existing research in Europe.
We depart from the premise that “national political and economic elites are more in tune with each other […] than with the respective populations” (Best, Reference Best, Best, Lengyel and Verzichelli2012: 238). This alignment can originate from various factors. Economic and business elites often play a crucial role in the electoral success of party representatives by providing campaign contributions, electoral support, or information supply (Erikson, Reference Erikson2015; Klüver and Pickup, Reference Klüver and Pickup2019; Schakel and Hakhverdian, Reference Schakel and Hakhverdian2018). Consequently, elected officials might favour the positions of these elites over those of their voters, highlighting the influence that the former can exert on shaping policy priorities. Furthermore, it has been suggested that elected representatives may naturally align more closely with the aforementioned subsections of the population due to shared characteristics – such as income, education, and social background – thereby further distancing themselves from the concerns of their average voters (Carnes and Lupu, Reference Carnes and Lupu2015; Thal, Reference Thal2017).
Given the structure and objectives of our research, we conceptualize political representation as the congruence between party representatives and their own electorates, rather than between representatives and the general public or median voter (Huber and Powell, Reference Huber and Powell1994; Powell, Reference Powell2000). Focusing on the alignment between party elites and their supporters enables us to identify patterns of bias that may be less visible in aggregate, system-level comparisons. This approach is well established in the congruence literature and has been implemented in a variety of ways (e.g., Mattila and Raunio, Reference Mattila and Raunio2006, Reference Mattila and Raunio2012; Dalton, Reference Dalton2015, Reference Dalton2017; Van De Wardt and Otjes, Reference Van De Wardt and Otjes2022; Werner, Reference Werner2020; Zhirnov et al., Reference Zhirnov, Thomeczek, Scotto di Vettimo, Lopez-Ortega, Krouwel, Antonucci, Di Stefano and Kesting2025, Reference Zhirnov, Thomeczeck, Antonucci, Scotto di Vettimo, Buma, Cristea, Kersting, Krouwel, Lange, Lopéz-Ortega, Thompson, Di Stefano and Ruggeri2026). Its roots can be traced back to the responsible party model and to the notion that party representatives are primarily accountable to their voters – the constituency to whom they must justify their actions – and that democratic representation should reflect the diversity of preferences within society (Adams, Reference Adams2001; Dalton, Reference Dalton2015). On this basis, we formulate the following expectation:
Hypothesis 1: The preferences of party representatives are more congruent with the preferences of economic elites than with those of their voters.
Comparative studies on unequal representation have also identified potential reasons for elite bias within specific countries, typically focusing on economic conditions and political institutional frameworks. For instance, economic inequality is believed to enhance the influence of affluent citizens on the policymaking processes (Erikson, Reference Erikson2015; Lupu and Warner, Reference Lupu and Warner2022b; Persson and Sundell, Reference Persson and Sundell2024; Rosset et al., Reference Rosset, Giger and Bernauer2013). In contrast, proportional representation (Huber and Powell, Reference Huber and Powell1994; McDonald and Budge, Reference McDonald and Budge2005) and other characteristics of a country’s partisan system (Belchior, Reference Belchior2013; Lupu, Reference Lupu2017) are associated with a higher degree of congruence.
However, these system-level explanations do not fully address the causes that may lead certain party representatives to be more positionally biased in favour of economic elites. To address this point, our remaining hypotheses explore additional party-level factors that may significantly affect unequal representation. Existing literature offers partial insights in this respect, as a whole plethora of attributes – political orientation, party type, party family, government status, and issue salience – have been widely used in analysing congruence (e.g., Costello, Reference Costello2021; Costello et al., Reference Costello, Toshkov, Bos and Krouwel2021; Dalton, Reference Dalton2015; Ibenskas and Polk, Reference Ibenskas and Polk2022; Zhirnov et al., Reference Zhirnov, Thomeczek, Scotto di Vettimo, Lopez-Ortega, Krouwel, Antonucci, Di Stefano and Kesting2025; Werner, Reference Werner2020). At the same time, to the best of our knowledge, these elements have yet to be associated with the presence of an elite bias.
Studies have also emphasized how some characteristics – such as party family and government status – correlate with a better representation of particular societal groups. O’Grady and Abou-Chadi (Reference O’Grady and Abou-Chadi2019) reveal that mainstream political actors are not likely to adjust their policies in response to shifts in public opinion. As confirmed by Brause and Kinski (Reference Brause and Kinski2024), this attitude suggests a potential focus on narrower sub-constituencies. Given these premises, we argue that the positions of mainstream parties are especially congruent with the attitudes of the winners of globalization. Several mechanisms may be drawn from the literature to explain this phenomenon. As mentioned earlier, higher-income citizens tend to vote, donate, and contact officeholders more often, increasing their visibility and incentivizing mainstream parties to court their support (Armingeon and Schädel, Reference Armingeon and Schädel2015). Additionally, descriptive proximity does matter. In Pitkin’s (Reference Pitkin1967) terms, citizens who descriptively resemble officeholders are more likely to have their voices heard. Since legislators – particularly those within mainstream parties – tend to be disproportionately affluent and highly educated, this homophily makes them more responsive to the interests of middle- and upper-class individuals (Carnes and Lupu, Reference Carnes and Lupu2015; Pontusson, Reference Pontusson2015).
We posit that the extent to which party stances are closer to the preferences of economic elites, if compared to those of party voters, depends on whether a given political formation hails from a mainstream partisan family. More specifically, we hypothesize that:
Hypothesis 2: Representatives from mainstream parties exhibit a higher economic elite bias than representatives from other parties.
We also extend this line of argument to government status, given the relevance of this aspect within the broader literature (Belchior, Reference Belchior2013). Recent evidence suggests that the high level of congruence exhibited by opposition forces and citizens progressively fades away once said political entities enter office (Romeijn, Reference Romeijn2020). In turn, this may stem from the need for governing parties to engage in compromises and pursue responsible policies (Deschouwer, Reference Deschouwer2008; Traber et al., Reference Traber, Hänni and Häusermann2018), which often leads them to adjust their positions more frequently than those of opposition parties.
Although these studies suggest that government status may be detrimental to the connection between representatives and the represented, they do not provide a definitive answer on whether the positions of political actors in government are closer to those of economic elites or to the stances of their voters. We posit that the mechanisms leading to elite bias – support in political campaigns and information supply (Erikson, Reference Erikson2015; Klüver and Pickup, Reference Klüver and Pickup2019) – gain additional importance for ruling parties. The need to maintain confidence among key economic and business stakeholders may lead representatives in office to adopt positions that more closely reflect those of economic elites. Hence, we also submit that:
Hypothesis 3: Representatives from parties in government exhibit a higher economic elite bias than representatives from other parties.
Finally, the existing body of research has indicated that economic crises significantly influence patterns of political representation. The Eurozone crisis, in particular, has been the subject of many studies aimed at examining its impact on mass-elite congruence across Europe (Akkerman et al., Reference Akkerman, De Lange and Rooduijn2016; Brause and Kinski, Reference Brause and Kinski2024; Carrieri and Vittori, Reference Carrieri and Vittori2021; Dageförde, Reference Dageförde2023; De Vries, Reference De Vries2022; Freire et al., Reference Freire, Lisi, Andreadis and Manuel Leite Viegas2014; Real-Dato, Reference Real-Dato2017; Traber et al., Reference Traber, Hänni and Häusermann2018, Reference Traber, Hänni, Giger and Breunig2022). While some articles successfully correlate the onset and intensity of the crisis to an enhanced discrepancy between political elites and the public on specific issues (Freire et al., Reference Freire, Lisi, Andreadis and Manuel Leite Viegas2014; Traber et al., Reference Traber, Hänni and Häusermann2018), other studies present a more nuanced view of these effects (Real-Dato, Reference Real-Dato2017). Regardless, the Great Recession substantively affected political representation by exacerbating economic inequality, which is generally associated with greater representation disparities (Donnelly and Lefkofridi, Reference Donnelly and Lefkofridi2014; Gilens, Reference Gilens2012; Traber et al., Reference Traber, Hänni, Giger and Breunig2022). Additionally, the crisis led to the increased politicization of certain issues – e.g., European integration – and challenged the connection between voters and mainstream parties (Dageförde, Reference Dageförde2023). This environment fostered the rise of several challengers, many of which embraced anti-establishment stances (Carrieri and Vittori, Reference Carrieri and Vittori2021; Hobolt and Tilley, Reference Hobolt and Tilley2016; Vasilopoulou, Reference Vasilopoulou2018). However, the impact of these developments on elite bias in representation remains uncertain, depending on the extent to which existing political entities adjusted their positions and how the new parties positioned themselves in relation to voters and economic elites. In light of the mixed results emerging from past research, we propose two explorative competing hypotheses to examine the effects of the Eurozone crisis on elite bias in congruence:
Hypothesis 4a: Representatives’ elite bias has increased in the aftermath of the Eurozone crisis.
Hypothesis 4b: Representatives’ elite bias has decreased in the aftermath of the Eurozone crisis.
Data and methodology
To test our hypotheses, we utilize data from cross-national mass-elite surveys covering 16 European countries in three different time periods (2007, 2016, and 2017). The 2007 data originate from the IntUne project (Cotta et al., Reference Cotta, Isernia and Bellucci2013). For 2016 and 2017, we draw from two rounds of surveys conducted as part of the Horizon 2020 EUENGAGE project (Cotta et al., Reference Cotta, Isernia, Basile, Borri, Marangoni, Olmastroni and Verzichelli2021). These surveys gathered information on a variety of policy issues utilizing a representative sample of citizens, elected representatives,Footnote 2 and national economic elites.Footnote 3 Importantly, each wave posed the same questions to all three groups. Detailed participant numbers for the general population and both elites across countries and years are available in the Online Appendix.
Overall, we identified 37 questions related mainly to European integration (tapping into both diffuse and policy-specific attitudes), as well as ideological self-identification, cultural values, economic policy preferences, and left-right positioning (see Online Appendix). This data enabled us to conduct a comprehensive longitudinal congruence analysis to determine whether party representatives elected to legislative office align more closely with their voters or economic elites across a broad set of politically relevant issues.Footnote 4
Dependent variable
In line with our conceptualization, our operationalization of congruence departs from approaches that focus on the distance between the median voter and the median legislator, as well as from many-to-many comparisons (e.g., Powell, Reference Powell2000; Golder and Stramski, Reference Golder and Stramski2010). Instead, we assess congruence by linking party representatives to their own voters.
Additionally, our operationalization of elite bias differs from the strategies commonly used in the unequal representation literature. Instead of dividing citizens into groups based on income (e.g., Flavin, Reference Flavin2012; Gilens, Reference Gilens2005; Persson and Sundell, Reference Persson and Sundell2024; Peters and Ensink, Reference Peters and Ensink2015; Schakel and Hakhverdian, Reference Schakel and Hakhverdian2018), education (e.g., Dolný and Baboš, Reference Dolný and Baboš2015; Rosset and Stecker, Reference Rosset and Stecker2019), or other economic indicators (e.g., Lupu and Warner, Reference Lupu and Warner2022b), we focus directly on economic elites, rather than citizen subgroups.
Our aim is not to replace these approaches, but to complement them. By examining the relative proximity of party representatives to economic elites and to their own voters – rather than to mass-based subgroups – we shift the focus from within-mass inequality to a cross-field comparison that captures a distinct mechanism of elite bias, one that may not be detected when benchmarks are derived solely from citizen-wide data. Moreover, anchoring the comparison in each party’s electorate may strengthen the interpretability of any observed “elite bias” as a deviation from party-voter congruence rather than a mere reflection of aggregate ideological positioning, thus adding further nuances to our understanding of unequal representation.
In terms of methodology, our study relies on the EMD (Lupu et al., Reference Lupu, Selios and Warner2017), which builds on the many-to-many conceptualization introduced by Golder and Stramski (Reference Golder and Stramski2010) to assess the similarity between two distributions – in our case, the ideological or policy preferences of party representatives and their voters, and party representatives and economic elites. EMD quantifies the “cost” required to transform one distribution into another (Lupu et al., Reference Lupu, Selios and Warner2017: 102), with lower scores indicating higher levels of congruence and vice versa.
Despite being a relatively new measure, the EMD has already been employed in several analyses (Devine and Ibenskas, Reference Devine and Ibenskas2021; Kübler and Schäfer, Reference Kübler and Schäfer2022; Lupu and Warner, Reference Lupu and Warner2022a, b; Van De Wardt and Otjes, Reference Van De Wardt and Otjes2022) due to its advantages over other methodologies, such as point-estimates or overlap metrics. While the former collapses each distribution of responses into single summary statistics, the latter requires scholars to bin the distributions into histograms. According to Lupu et al. (Reference Lupu, Selios and Warner2017: 96, 101), both methodologies may lead to information loss and within-bin variance, while the EMD is able to retain the full extent of the distribution comparisons – thus accounting for location, spread, and polarization – by computing the differences between two sample densities even in small sample settings (for an illustration of the EMD’s functioning and interpretation as a measure of congruence, see the Online Appendix).
Notwithstanding our methodological choice, we emphasize that our use of the EMD reflects the analytic needs and focus of our study and carries no normative implications. Other related approaches (for an overview, see Golder and Ferland Reference Golder, Ferland, Herron, Pekkanen and Shugart2018) may be preferable when the research question centres on, for example, median shifts or clearly defined support thresholds. Hence, our usage of the EMD should be read as complementary, not substitutive, within the broader set of congruence measures.
For the purposes of our research, we calculate EMD measures for each party with at least three surveyed representatives (N = 98).Footnote 5 First, we rescale the responses to the original questions between 0 and 1 for all questions (Devine and Ibenskas, Reference Devine and Ibenskas2021). Given that the EMD measure inherits the scale of the original distributions, this allows us to have comparable curves. Then, for each party and question, we assess the congruence between the preferences of the representatives and party voters (party-voters), and between the former and the stances of economic elites (party-elites). This yields a dataset comprising 2,610 party-year-issue triads, each with an EMD score for party-voters and party-elites congruence. Finally, we calculate elite bias as the difference of these EMD measures: Elite bias = ∆ EMD = EMD voters – EMD elites (cf. Lupu and Warner, Reference Lupu and Warner2022b). Positive values indicate the presence of elite bias, whereas negative estimates indicate a preference towards the attitudes of the party voters.
Figure 1 (left panel) plots the position of each triad according to its EMD values for voters and economic elites. In contrast, the right panel shows the relative frequency of elite and voter bias for each country. An initial assessment of the data from our DV shows a quite balanced landscape. In a few countries, party-elites congruence is more frequent than party-voters congruence, whereas in many cases the two have similar shares (for country-year patterns, see Online Appendix).
Instances and relative frequencies of elite and voter bias.
Source: Cotta et al. (Reference Cotta, Isernia and Bellucci2013, Reference Cotta, Isernia, Basile, Borri, Marangoni, Olmastroni and Verzichelli2021). Red dots indicate instances of elite bias and red bars their relative frequency, whereas blue dots and bars represent cases (and their relative frequency) where party-voters congruence is higher than party-elites’.

Explanatory variables
Our H1 is primarily descriptive, outlining basic patterns of congruence between representatives, economic elites, and party voters. In contrast, the other hypotheses aim at providing a better understanding of congruence patterns through a series of covariates. Specifically, H2 and H3 posit that elite bias is higher for representatives of mainstream and government parties, respectively. To identify the former, we refer to their affiliation with traditional party families: Christian democrats, social democrats, conservatives, and liberals (O’Grady and Abou-Chadi, Reference O’Grady and Abou-Chadi2019). Any formation that can be ascribed to one of the above macro-groups is considered a mainstream party and is coded as 1 (0 otherwise). With respect to government status, we employ a dummy variable that assigns a value of 1 to each party within the governing majority of their country at the time of each survey (0 otherwise).Footnote 6
Similarly, H4a and H4b explore how elite bias may have shifted in the years following the economic crisis. To examine these competing hypotheses, we introduce a binary variable that is set to 1 for the years after the crisis (0 otherwise). We consider May 2010 as the beginning of the Eurozone crisis and July 2013 as its end, as these dates correspond to the first agreement on a bailout package for the Greek government and the month following the first quarter of economic growth after the recession, respectively. It is worth noting that the analysis of these two competing hypotheses focuses solely on political parties and policy questions for which data are available both before and after the crisis.
Controls
Finally, we incorporate a comprehensive set of controls that are commonly included in analyses of unequal representation to address both party-level attributes and general political-economic conditions. Initially, we look at both the ideological orientation of each political actor along the left-right spectrum (Jolly et al., Reference Jolly, Bakker, Hooghe, Marks, Polk, Rovny, Steenbergen and Vachudova2022) and their vote share in the most recent national election. We expect that representatives from parties with right-leaning ideologies, which typically advocate for pro-business policies, may exhibit a higher degree of elite bias. The impact of vote share is less certain, and it is included to discern differences in representation between smaller and larger political actors. Our model also considers variables that previous works have identified as influential to better understand the dynamics of political representation (Golder and Stramski, Reference Golder and Stramski2010; Lupu et al., Reference Lupu, Selios and Warner2017; Persson, Reference Persson2024). These controls include the fragmentation of the party system (Laakso and Taagepera, Reference Laakso and Taagepera1979), the disproportionality of the electoral system (Gallagher, Reference Gallagher1991), and voter turnout in the latest elections. To explore the influence of economic conditions on representation (Gilens, Reference Gilens2012; Lupu and Warner, Reference Lupu and Warner2022b; Persson, Reference Persson2024; Rosset et al., Reference Rosset, Giger and Bernauer2013), we include the national unemployment rate and the Gini Index as indicators of economic inequality. Additionally, our analysis employs question fixed effects to control for issue-specific variations in congruence, as well as country fixed effects to mitigate the influence of unobserved contextual factors (for an overview of the main variables and their descriptive statistics, see the Online Appendix).
Results
To test H1, we use all the available party-year-issue triads in difference-in-means tests to rigorously determine whether party-elites congruence is higher than party-voters, thereby determining the statistical significance of any observed elite bias. For the remaining hypotheses, we employ multi-level regression models to test the association between our measure of economic elite bias against a selected set of explanatory and control variables.Footnote 7
The initial analysis reveals that the differences in average EMD scores are statistically significant (t = 4.17; P < 0.001), though moderate. More specifically, voters’ EMD and elites’ EMD equal 0.134 and 0.124, respectively. Hence, both constituencies exhibit some degree of incongruence with party positions, even if these findings indicate smaller average incongruence than other comparative studies using the same measure. For instance, Lupu and Warner (Reference Lupu and Warner2022a) find an EMD value of 0.18 among the more affluent (see also Persson and Sundell, Reference Persson and Sundell2024: 523)
The resulting elite bias (the difference between EMD measures) is just 0.01. Since positive values suggest the presence of an elite bias and vice versa, our results indicate that party representatives tend to align more closely with the economic elites than with their voters, even if only slightly. In practical terms, representatives’ positions are on average about 8% (0.01/0.124) more distant from their voters than from economic elites.
To examine the specifics of elite bias more closely, we analysed each of the six issue categories. The results are illustrated in Figure 2, which plots the estimated difference-in-means between congruence measures (for question-specific t-tests, see the Online Appendix). Of the six issue groups analysed, four show statistically significant differences in EMD values. On the one hand, we find that party representatives are more congruent with economic elites than with their voters on European integration policies (ΔEMD = 0.015) – but not on general attitudes towards the EU – and on cultural values (ΔEMD = 0.062). Given the EMD values for these issues, representatives are, on average, 13% and 51% farther from voters’ positions than from those of economic elites. On the other hand, we find evidence of voter bias in left–right positioning and in preferences on economic policy.
Results of the difference-in-means test, by issue category.
Source: Cotta et al. (Reference Cotta, Isernia and Bellucci2013, Reference Cotta, Isernia, Basile, Borri, Marangoni, Olmastroni and Verzichelli2021). Whiskers indicate 95% confidence intervals. Red (blue) bars indicate statistically significant elite (voters) bias.

Therefore, the difference-in-means tests lend only partial support to H1. On average, we identify a moderate elite bias, which becomes more pronounced on issues related to European policies and cultural values. However, we also find evidence of voter bias on issues related to the left-right dimension. Overall, the t-test results are also robust to the use of more traditional congruence measures (see Online Appendix). Note also that, if we focus solely on voters’ congruence – rather than differences in congruence between voters and economic elites – our results are largely in line with Dalton’s (Reference Dalton2015) study (for a comparison with policy responsiveness, see Dassonneville et al., Reference Dassonneville, Frechet, Jabbour, Ferland and Homola.2025, Donnelly and Lefkofridi, Reference Donnelly and Lefkofridi2014).
These results complement the existing literature in two ways. On the one hand, we confirm the existence of an average elite bias across all issues analysed, which is in line with recent studies investigating European countries (e.g., Lupu and Warner, Reference Lupu and Warner2022a; Persson and Sundell, Reference Persson and Sundell2024). Yet, our findings also unveil significant issue-specific differences, underlining the necessity of multidimensional approaches to the study of unequal representation (Dalton, Reference Dalton2015; Dassonneville et al., Reference Dassonneville, Frechet, Jabbour, Ferland and Homola.2025; Lupu and Warner, Reference Lupu and Warner2022a).
Prior studies on congruence and responsiveness suggest that politicians tend to align more closely with less affluent citizens on cultural issues and with wealthier citizens on economic issues, respectively (Lupu and Warner, Reference Lupu and Warner2022a; Schakel and Hakhverdian, Reference Schakel and Hakhverdian2018). However, our focus on voters and economic elites provides mixed evidence on both cases, offering a complement to – rather than a confutation of – existing comparative studies (more on this below).
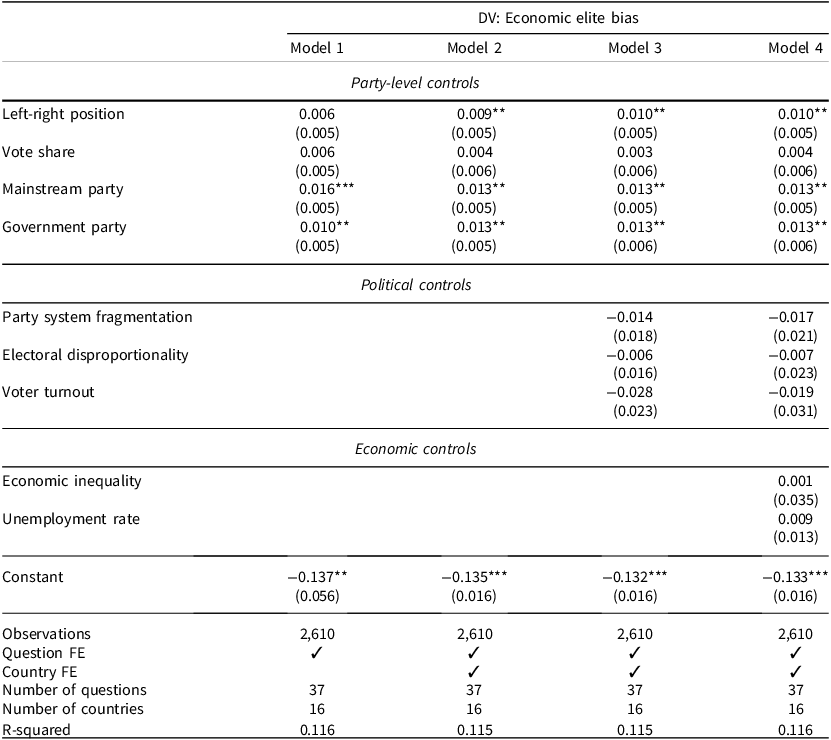
Moving on to the regression analysis, Table 1 presents the results from four models. Model 1 includes only party-level covariates and question dummies. Model 2 adds country fixed effects, while Models 3 and 4 progressively incorporate political and economic controls, respectively. Continuous variables are standardized by subtracting the mean and dividing by two standard deviations, so as to put them on roughly the same scale as binary variables (Gelman and Hill, Reference Gelman and Hill2006).
Models for economic elite bias in congruence

Note: Robust standard errors in parentheses. ***P < 0.01, **P < 0.05, *P < 0.1.
The results validate both H2 and H3. Indeed, the evidence demonstrates that representatives from mainstream parties exhibit a higher elite bias when compared to their non-mainstream counterparts. In the same vein, elected officials from parties in government tend to show a stronger alignment with the preferences of economic elites compared to those in opposition.
The substantive magnitude of these effects should be interpreted in light of the overall observed bias and the fact that our study focuses on differences between congruence measures rather than the measures themselves. Representatives from mainstream parties exhibit an elite bias of 0.013 points higher than those from the other category. Across the six question categories, elite bias ranges from −0.04 (voter bias on left-right positions) to 0.062 on cultural values (see Figure 2 above). Hence, mainstream parties increase elite bias by about 13% of the observed range. We find a similarly sized and independent effect for representatives of political formations in office compared to the opposition.
Finally, we also detect a significant association between the left-right position and the presence of elite bias: a two-standard-deviation increase in the left-right position increases said bias by approximately 10% of its range. This indicates that, on average, the further to the right party representatives are, the more they tend to align with economic elites. However, our analysis does not reveal any significant correlation between elite bias and country-specific political or economic conditions (cf. Rosset et al., Reference Rosset, Giger and Bernauer2013). Our results hold regardless of different model specifications, stricter inclusion criteria for parties, and the use of alternative congruence measures (see the Online Appendix).
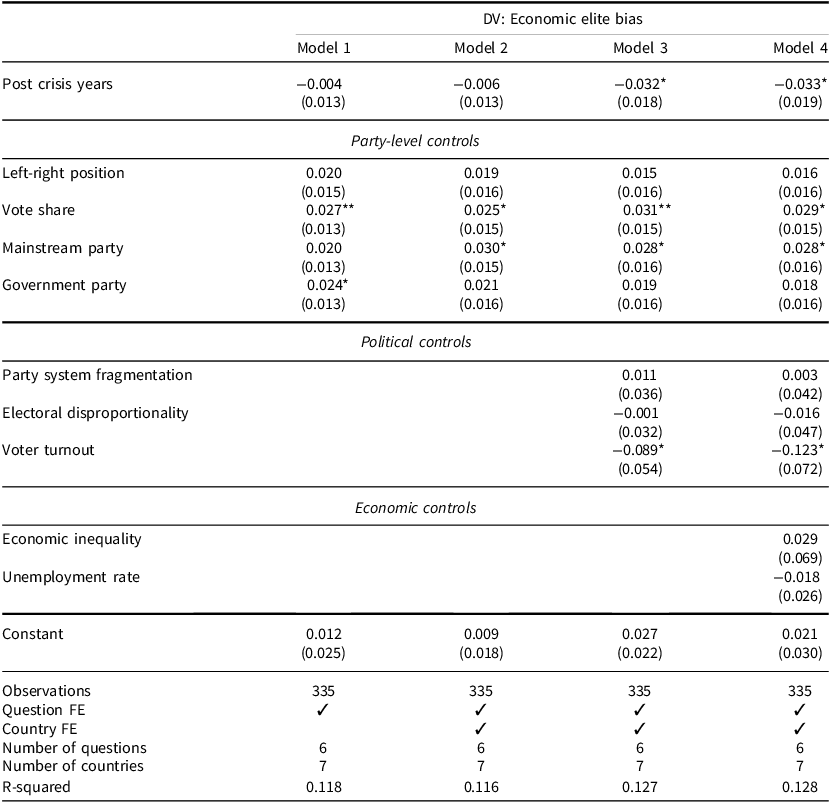
To explore the possibility of shifting congruence patterns in the aftermath of the Eurozone crisis – H4a and H4b – we employed similar regression models incorporating a post-crisis dummy variable (Table 2). As stated before, these models focus exclusively on parties and issues present both before and after the crisis to avoid the possibility that any observed shifts in elite bias might be ascribed to possible changes in the actors and/or the indicators observed.
Models for economic elite bias in congruence (Post crisis analysis)

Note: Robust standard errors in parentheses. ***P <0.01, **P < 0.05, *P < 0.1.
Our results indicate that the elite bias did not significantly increase. Quite the contrary, a negative coefficient for the Post crisis years dummy suggests a significant reduction in elite bias, in line with the descriptive analysis showing party-voters congruence surpassing party-elites congruence in the post-crisis period (see Online Appendix). Thus, we find support for H4b.
Whilst keeping in mind that the number of observations for the post-crisis analysis is substantially lower than that of the previous models – and that the set of parties included also differs – Table 2 shows that, even when focusing on more established parties and controlling for the post-crisis period, the contribution of parties from mainstream families to the elite bias remains statistically significant. The regressions also indicate that larger parties are more biased towards economic elites, and that higher electoral participation is associated with lower elite bias.
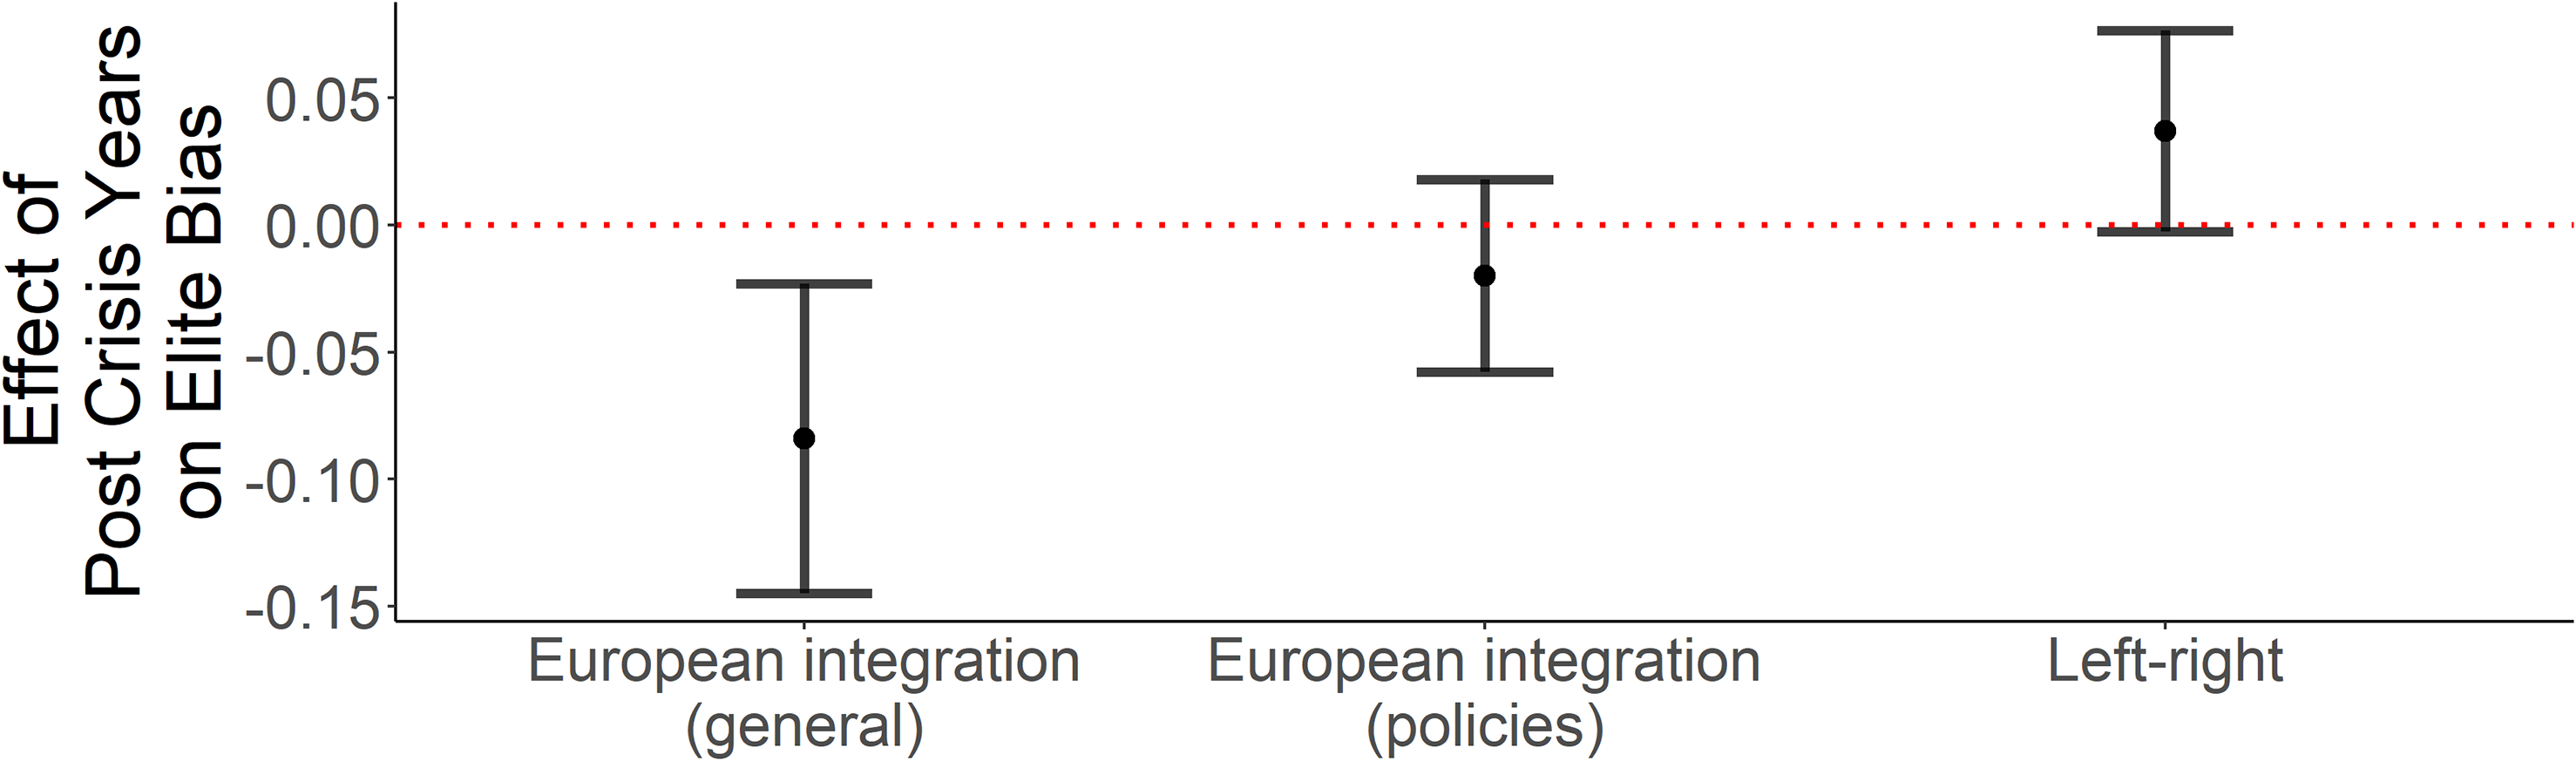
Given also the differences in elite bias across issue types (Figure 2), we decided to explore whether the effect of the post-crisis variable is consistent across the various categories of questions. We run separate models for each issue type for which we have questions asked both before and after the crisis. Due to the limited number of observations within each group, we focus only on the covariates that achieved statistical significance in our models in Table 2.
The full results are reported in the Online Appendix, and Figure 3 plots the coefficient of the post-crisis dummy. It emerges that the reduction in elite bias of existing parties can be mostly traced back to congruence on general attitudes towards European integration. On the left-right positioning, where party representatives were on average closer to their voters, elite bias appears to increase, though the coefficient is just short of statistical significance.
Coefficient plot of post-crisis models, by issue type (Table B4).
Note: Whiskers indicate 90% confidence intervals.

Discussion
Our study conducted a longitudinal and comparative congruence analysis to determine whether party representatives align more closely with economic elites than their voters across various attitudinal and policy issues. Moving beyond traditional reliance on income percentiles, we specifically operationalized economic elites as individuals holding senior positions within large corporations and business associations to have a better understanding of their disproportionate influence on political representation. Additionally, we opted for the innovative EMD (Lupu et al., Reference Lupu, Selios and Warner2017) over conventional mean comparisons and distribution overlaps to measure congruence, as the EMD retains the full information of the distribution while avoiding the information loss and within-bin variance associated with other methodologies. All in all, our analysis of party-year-issue triads allowed us to shed light on the evolving dynamics of the European political landscape.
Our results add important nuance to claims about unequal representation in Europe. Looking at EMD-based congruence for voters only (i.e., not comparing voters v. economic elites), we find – broadly consistent with Dalton’s (Reference Dalton2015) findings – that party representatives are most congruent with their voters’ preferences on left-right and economic policy issues, and least congruent on cultural values and European integration (see instead Dassonneville et al., Reference Dassonneville, Frechet, Jabbour, Ferland and Homola.2025; Donnelly and Lefkofridi, Reference Donnelly and Lefkofridi2014 for studies on responsiveness).
Regarding H1, our findings confirm the existence of an elite bias. On average, party representatives’ positions are closer to those of economic elites than to those of their voters. The substantive magnitude of this bias is moderate, yet consistent with evidence from other studies on unequal representation (Lupu and Warner, Reference Lupu and Warner2022a; Persson and Sundell, Reference Persson and Sundell2024).
At the same time, we observe substantial cross-domain variation. The fact that elite bias differs substantially by issue area underscores the importance of adopting both a multidimensional (i.e., not focusing only on the average congruence across multiple issues) and less aggregate (i.e., focusing on party voters rather than the entire voter population) approach to the study of representation. In fact, parties may decide to target their specific constituency, rather than a more abstract median or average voter, and may do so more on some issues than on others (Dalton, Reference Dalton2015; Dassonneville et al., Reference Dassonneville, Frechet, Jabbour, Ferland and Homola.2025; Rosset and Stecker, Reference Rosset and Stecker2019). Although, on average, the preferences of elected representatives align more closely with those of economic elites than with those of their voters, we also find – consistent with Lupu and Warner (Reference Lupu and Warner2022a) – significant variation across issue categories. Taken together, our findings suggest that once we move beyond the simple divide between more and less affluent citizens and look at party voters more specifically, claims of a generalized overrepresentation of economic elites in Europe, as posited in earlier research (Giger et al., Reference Giger, Rosset and Bernauer2012), require refinement.
Our results appear to diverge from the few comparative studies on European countries that examine issue domains separately. We contend, however, that this divergence stems largely from our more targeted research focus, both in terms of elite definition and operationalization and with regard to the party-voter focus. Contrary to Lupu and Warner (Reference Lupu and Warner2022a), we find that economic elites are better represented in cultural values and European integration policies. In contrast, voters are better represented on economic issues and the left-right dimension. We explain this difference on two grounds. On the one hand, by understanding economic elites as a separate societal group – rather than simply as more affluent citizens – we find a clearer overlap between economic elites and party representatives’ positions on cultural values issues. Yet, this overlap is, on average, weaker on economic or left-right issues, as economic elites tend to have more right-leaning positions (see our example in the Online Appendix). Representatives of right-leaning parties exhibit the strongest congruence with these positions, whereas congruence declines progressively along the spectrum toward the left, in line with the positive coefficient for the left–right position variable in Table 1.
On the other hand, our focus on congruence between party representatives and their own voters, rather than between representatives and the general public (cf. Lupu and Warner, Reference Lupu and Warner2022a; Persson, Reference Persson2024; Persson and Sundell, Reference Persson and Sundell2024), enables us to more accurately track incongruence within the party system and suggest possible ways to mitigate it. It is possible that the aggregate similarities between representatives and public opinion on issues such as left-right and cultural attitudes, to mention two domains in our analysis, may conceal the fact that no single party represents voters equally well across both. In such cases, voters are forced to prioritize one set of issues over another.
By looking at the actual dyadic correspondence between elected party representatives and their supporters (cf. Zhirnov et al., Reference Zhirnov, Thomeczek, Scotto di Vettimo, Lopez-Ortega, Krouwel, Antonucci, Di Stefano and Kesting2025) – rather than the voters-versus-economic-elites comparison – our results show that voters tend to support parties whose representatives hold preferences closer to their own than to those of economic elites on economic policy issues and the left-right dimension. This pattern produces the observed voter bias in these domains (see Figure 2). However, the same parties often adopt positions on cultural values and European integration that are closer to the preferences of economic elites, thereby generating elite bias on these issues.
Turning to the determinants of elite bias, our findings broadly align with the existing literature on the limited impact of country-level political or economic factors (Lupu and Warner, Reference Lupu and Warner2022b; Persson and Sundell, Reference Persson and Sundell2024; Rosset and Stecker, Reference Rosset and Stecker2019), whilst adding further insights into the party-level determinants of elite bias. Our multi-level regressions also demonstrate a significant proximity between mainstream political figures and economic elites, substantiating H2. We find a similar effect among elected officials from governing parties (H3). Our analysis also reveals that the further to the right a party is positioned, the more its representatives align with economic elites rather than with their voters. These effects are independent of one another, implying that a right-leaning governing mainstream party will exhibit a substantial elite bias.
Finally, with regard to our set of two competing hypotheses (H4a and H4b), our investigation shows a significant reduction in elite bias from 2013 onwards, suggesting a closer alignment between party representatives and their voters vis-à-vis economic elites in the aftermath of the Eurozone crisis. Further inspection tentatively suggests that this improvement is primarily due to a more accurate representation of voters on matters related to European integration policies. By contrast, elite bias may have actually increased on the left-right dimension, though the limited number of observations prevents us from making conclusive claims. Should these preliminary findings be confirmed, they would indicate that parties are strategically repositioning themselves by moving closer to their voters on issues where elite bias was pronounced (European integration), while shifting in the opposite direction on issues where voters were already better represented than elites (left-right positioning).
Our study carries several implications for the literature and points to new avenues for research. First, it underscores the importance of accounting for the multifaceted nature of political representation, particularly when examining unequal representation. Focusing on responsiveness rather than congruence – or adopting a dyadic party-voters perspective instead of comparing parties to the mass public as a whole – are not merely alternative methodological strategies. Rather, they embody distinct yet complementary conceptions of representation. It is therefore crucial to keep these differences in mind when situating our findings within the broader literature on unequal representation in Europe.
Second, the existence of strong elite bias in specific issues rather than others (Figure 2), and the differing dynamics between the pre- and post-crisis years (Table 2 and Figure 3) highlight the need for closer scrutiny of issue-specific and longitudinal patterns of unequal representation. Do cross-issue variations in congruence reflect differences in the electoral salience of the issues in question? The observed decline in elite bias on European integration may indicate parties’ awareness of the growing salience of this dimension for electoral competition. Moreover, since our post-crisis models focus only on parties active both before and after the crisis, it remains an open question whether the reduction in elite bias reflects, at least in part, a reaction to the entry of representatives from new actors into the political arena.
Finally, our findings offer limited insight into the mechanisms underpinning elite (or voter) bias. While we rely on existing theories to guide our choice of explanatory variables, our models do not allow for causal inference. Nonetheless, understanding why party representatives’ positions align more closely with those of economic elites than with those of their own voters is key to evaluating the democratic implications of elite bias and for reflecting on possible remedies.
Supplementary material
The supplementary material for this article can be found at https://doi.org/10.1017/S1755773926100472.
Data availability statement
Replication data and codes for this article can be found on GitHub at: https://github.com/mscottodivettimo/replication_marzi-scotto_whomdoyouserve.
Acknowledgements
We want to thank Christel Koop, Jan Philipp Thomeczek, Francesco Visconti, and Andrei Zhirnov for their helpful comments on previous versions of this article. We have also benefited from feedback from the European Consortium for Political Research General Conference in Prague (2023) and the 2023 Annual Meeting of the Italian Political Science Association. We acknowledge the use of ChatGPT-5, a generative AI tool, for language improvement in the preparation of this article.
Author contribution
Both authors contributed equally to the paper.
Funding statement
This research received financial support from the Leverhulme Early Career Fellowship ECF-2023-018 (Michele Scotto di Vettimo) and from the project ‘The Representative DIsconnect: diagnosis and strategies for RECTification’ (HORIZON-CL2-2022-DEMOCRACY-01/HORIZON-RIA, Grant no. 101095142) funded by the European Union’s Horizon Europe research and innovation programme. For information, see: https://redirect.unisi.it/.
Competing interests
We wish to state that there is no conflict of interest associated with this publication.


 Open access