





With the increasing use of computers, tablets, smartphones, and e-readers, traditional paper-based reading has gradually shifted toward digital formats (e.g., Støle et al., Reference Støle, Mangen and Schwippert2020). This transition is particularly evident in education, where digital devices have been widely adopted to support language learning in classrooms (Salmerón et al., Reference Salmerón, Delgado, Vargas and Gil2021). Reading on digital devices offers several advantages, including portability, easy access to diverse online texts, and interactive features that can enhance learners’ motivation (Reiber-Kuijpers et al., Reference Reiber-Kuijpers, Kral and Meijer2021). Despite these benefits, researchers have questioned whether digital formats influence reading comprehension differently from paper reading (e.g., Clinton, Reference Clinton2019; Delgado et al., Reference Delgado, Vargas, Ackerman and Salmerón2018; Yang & Hu, Reference Yang and Hu2024).
In first language (L1) reading, extensive research has examined the effects of reading medium (paper versus screen) on comprehension. Several meta-analyses have found evidence for screen inferiority (Clinton, Reference Clinton2019; Delgado et al., Reference Delgado, Vargas, Ackerman and Salmerón2018; Kong et al., Reference Kong, Seo and Zhai2018), often attributed to increased cognitive load resulting from distractions and the lack of fixed spatial cues (Sanchez & Wiley, Reference Sanchez and Wiley2009) and to shallow processing fostered by digital environments (Annisette & Lafreniere, Reference Annisette and Lafreniere2017). However, despite growing interest in second language (L2) digital reading, findings on reading medium effects remain inconsistent (e.g., no medium effect was found by Yeom & Jun, Reference Yeom and Jun2020; screen inferiority was observed by Yu et al., Reference Yu, Zhou, Yang and Hu2022), and no known meta-analysis to date has synthesized this evidence. Accordingly, further research is needed in the L2 context, particularly among younger learners, often described as digital natives (Prensky, Reference Prensky2001). As younger generations are increasingly exposed to digital devices from an early age and digital technologies become more prevalent in schools, the role of reading medium in younger learners warrants closer attention (Støle et al., Reference Støle, Mangen and Schwippert2020). In addition, although text and task features (e.g., text genre and time on task) have been widely examined in reading medium research (Delgado et al., Reference Delgado, Vargas, Ackerman and Salmerón2018), the role of individual differences remains underexplored. Cognitive resources, L2 linguistic knowledge, and experience with digital devices play an important role in reading and may shape how readers process texts across different reading media (e.g., Chen et al., Reference Chen, Cheng, Chang, Zheng and Huang2014; Jeon & Yamashita, Reference Jeon, Yamashita, Li, Hiver and Papi2022). Building on these considerations, the present study investigates how reading medium affects adolescents’ L2 reading comprehension and whether its effects vary as a function of three learner-related factors: working memory, L2 proficiency, and digital device usage.
Literature review
The effect of reading medium on L1 and L2 reading comprehension
A substantial body of research has examined whether reading comprehension differs between paper and digital formats. Several meta-analyses in L1 contexts have reported that reading on screens is associated with slightly poorer comprehension than reading on paper, a phenomenon widely referred to as screen inferiority (Clinton, Reference Clinton2019; Delgado et al., Reference Delgado, Vargas, Ackerman and Salmerón2018; Kong et al., Reference Kong, Seo and Zhai2018). For example, Delgado et al. (Reference Delgado, Vargas, Ackerman and Salmerón2018) synthesized 54 primary studies using both between- and within-participant designs and found a small but significant advantage for paper over digital reading (Hedges’ g = −0.21). The analysis further indicated that the paper advantage was more pronounced under time constraints and for expository texts rather than narrative texts. Similar patterns were reported by Kong et al. (Reference Kong, Seo and Zhai2018) and Clinton (Reference Clinton2019), who also found small disadvantages for screen-based reading relative to paper.
Theoretical frameworks in reading research help explain how readers construct meaning from text and provide insight into the observed screen inferiority. One influential framework is the construction–integration model of text comprehension (Kintsch, Reference Kintsch1998), which conceptualizes reading as a process in which readers construct multiple levels of mental representations from text and integrate them with prior knowledge to build a coherent understanding. According to this model, readers form representations ranging from surface structure (lexical and syntactic levels) to a textbase representing propositional meaning, which is then integrated with background knowledge to construct a situation model. Successful comprehension therefore requires maintaining and integrating multiple pieces of information while suppressing irrelevant interpretations.
Digital reading environments may disrupt these processes in several ways. According to cognitive load theory (Sweller, Reference Sweller, Mestre and Ross2011), readers have limited cognitive resources for processing information, and extraneous cognitive load—demands arising from how information is presented rather than from the information itself (e.g., interface-related processes such as navigation or scrolling)—may be greater when reading from screens than from paper (Curum & Khedo, Reference Curum and Khedo2021). For example, printed texts provide stable spatial cues because the entire text is physically available and organized into fixed pages, allowing readers to relocate information more easily (Mangen et al., Reference Mangen, Walgermo and Brønnick2013). In contrast, digital formats often rely on scrolling or zooming, which can disrupt spatial memory and make it more difficult to track previously read information (Yu et al., Reference Yu, Zhou, Yang and Hu2022). Additionally, digital devices are often associated with rapid interaction and immediate rewards (e.g., web browsing or messaging), which may promote more superficial engagement with texts, a phenomenon commonly referred to as the shallowing hypothesis (Annisette & Lafreniere, Reference Annisette and Lafreniere2017; Lauterman & Ackerman, Reference Lauterman and Ackerman2014).
Despite the increasing number of studies on L2 digital reading, findings on reading medium effects remain mixed. Some studies report results consistent with screen inferiority. For example, Yu et al. (Reference Yu, Zhou, Yang and Hu2022) compared reading comprehension on paper and mobile phones among Chinese college students who learn English as a foreign language (EFL) using a counterbalanced design and found higher comprehension accuracy for paper (p = .044, d = 0.298) across literal, inferential, and evaluative questions. However, other studies report no significant differences between paper and digital reading (e.g., Hou et al., Reference Hou, Lee and Doherty2022; Yeom & Jun, Reference Yeom and Jun2020). Hou et al. (Reference Hou, Lee and Doherty2022) examined Chinese EFL college students’ comprehension across paper and several digital conditions (tablet, mobile phone, and computer) and found comparable outcomes across formats. Likewise, Yeom and Jun (Reference Yeom and Jun2020) reported similar comprehension performance across paper and computer reading among Korean EFL learners. These mixed findings suggest that the effect of reading medium in L2 contexts may depend on additional factors, such as learner characteristics.
Individual differences and L2 reading
Reading comprehension is shaped by multiple learner characteristics, including cognitive resources, linguistic knowledge, and experience with reading tools. Differences in these factors may influence how readers process texts and engage with different reading media. The present study focuses on three learner-related factors particularly relevant to L2 reading: working memory, L2 proficiency, and digital device usage.
Working memory and reading comprehension
Working memory is a limited-capacity cognitive system responsible for temporarily storing and processing information while maintaining attentional control (Baddeley & Hitch, Reference Baddeley and Hitch1974). In reading, it supports the simultaneous processing of incoming linguistic input and the maintenance of previously processed information, enabling readers to construct coherent representations of text meaning. Readers identify visual word forms, retrieve lexical and semantic information from long-term memory, and integrate these elements with contextual information across sentences. From the perspective of the construction–integration model of comprehension (Kintsch, Reference Kintsch1998) and cognitive load theory (Sweller, Reference Sweller, Mestre and Ross2011), working memory thus plays a crucial role in constructing and integrating multiple levels of textual representation.
To capture the dual role of storage and processing in working memory, researchers commonly use complex span tasks (Conway et al., Reference Conway, Kane, Bunting, Hambrick, Wilhelm and Engle2005). Among these, the reading span task (Daneman & Carpenter, Reference Daneman and Carpenter1980) has been particularly influential in reading research. In this task, participants make semantic or syntactic judgments about sentences while simultaneously recalling elements such as sentence-final words or letters. Other commonly used measures include operation span, digit span (forward and backward), and counting span tasks (In’nami et al., Reference In’nami, Hijikata and Koizumi2022; Shin & Hu, Reference Shin, Hu, Schwieter and Wen2022).
Research has consistently demonstrated a positive relationship between working memory capacity and reading comprehension. In L1 contexts, meta-analytic evidence indicates that readers with greater working memory capacity can better maintain and integrate textual information during comprehension (Daneman & Merikle, Reference Daneman and Merikle1996). Similar patterns have been observed in L2 contexts. For example, In’nami et al. (Reference In’nami, Hijikata and Koizumi2022) reported a positive meta-analytic correlation between working memory capacity and L2 reading comprehension (r = .30), corresponding to a small effect size based on Plonsky and Oswald’s (Reference Plonsky and Oswald2014) benchmarks for L2 research. A separate meta-analysis focusing on reading span tasks also found a small but positive relationship (r = .30) between working memory and L2 reading performance (Shin, Reference Shin2020). Evidence from individual primary studies also supports this relationship. For example, Brunfaut et al. (Reference Brunfaut, Kormos, Michel and Ratajczak2021) showed that working memory scores measured using digit span and symmetry span tasks were positively associated with performance on the TOEFL Junior reading test among Hungarian adolescent learners (OR = 1.48, 95% CI [1.10, 2.00], p = .009).
Working memory may be particularly important in L2 reading because readers often possess more limited lexical and syntactic knowledge, placing greater demands on lower-level processes such as word recognition and lexical access (Koda, Reference Koda1990; Nassaji, Reference Nassaji2014). As a result, fewer cognitive resources may remain available for higher-level processes such as inference generation and discourse integration. Digital reading environments may further increase these demands. Features such as scrolling can remove previously read text from view, requiring readers to retain earlier information in memory while processing new content (Sanchez & Wiley, Reference Sanchez and Wiley2009). Similarly, zooming or navigating digital interfaces may disrupt readers’ spatial awareness of text structure and make it more difficult to relocate and recall information (Chen & Lin, Reference Chen and Lin2016; Delgado et al., Reference Delgado, Vargas, Ackerman and Salmerón2018). Piolat et al. (Reference Piolat, Roussey and Thunin1997) also showed that pagelike formats facilitated relocation of information more effectively than scrolling formats. These interface-related processes may impose additional extraneous cognitive load, potentially increasing the importance of working memory during digital reading comprehension. Accordingly, working memory capacity may moderate the relationship between reading medium and comprehension performance, particularly in L2 contexts where cognitive demands are already high. Supporting this possibility, de Azevedo et al. (Reference de Azevedo, Oliveira, Finger and Tomitch2025) examined the role of working memory in L2 English learners during digital reading while listening to music and found that readers with higher working memory recalled more secondary details than those with lower working memory. However, relatively few studies have directly examined how working memory moderates comprehension differences between paper and screen reading.
L2 proficiency and reading comprehension
L2 proficiency is another key factor influencing reading comprehension. According to the Lexical Quality Hypothesis (Perfetti, Reference Perfetti, Segers and van den Broek2017), skilled reading depends on the quality of lexical representations in memory. High-quality lexical representations involve well-integrated orthographic, phonological, and semantic information. When lexical representations are well specified, word recognition becomes more automatic, reducing the cognitive resources required for lower-level processing and allowing readers to allocate more resources to higher-level processes. Accordingly, overall L2 proficiency has frequently been used as a predictor of L2 reading comprehension in previous research (e.g., Lee & Schallert, Reference Lee and Schallert1997). More proficient readers also tend to use reading strategies more efficiently and monitor their comprehension more effectively (Jeon & Yamashita, Reference Jeon, Yamashita, Li, Hiver and Papi2022).
Research examining whether proficiency moderates reading medium effects has produced mixed findings. Some studies suggest that less proficient readers may be more negatively affected by digital reading environments. For example, Salmerón et al. (Reference Salmerón, Delgado, Vargas and Gil2021) found that low-proficiency primary school readers performed worse on tablets than on paper, whereas high-proficiency readers showed comparable performance across media in L1 context. Similarly, Lenhard et al. (Reference Lenhard, Schroeders and Lenhard2017) reported that more proficient L2 readers showed smaller performance gaps between paper and screen reading, suggesting that skilled readers may better compensate for challenges posed by digital formats. However, Støle et al. (Reference Støle, Mangen and Schwippert2020) found screen inferiority across proficiency levels among L1 Norwegian primary school students, with the strongest effects among high-achieving readers. The authors suggested that even skilled readers may be more disadvantaged by digital reading because the higher-order inferential processes they are more likely to engage in appear particularly vulnerable in digital environments. Given these mixed findings and the relatively limited number of L2 studies examining this moderating role, further research is needed to clarify how L2 proficiency interacts with reading medium effects.
Exposure to digital devices and reading comprehension
Experience with digital devices may influence reading performance across media in different ways. One possibility is that greater familiarity with digital interfaces improves readers’ ability to navigate digital texts and develop effective strategies for screen-based reading (Chen et al., Reference Chen, Cheng, Chang, Zheng and Huang2014). Over time, increased experience with digital environments may therefore reduce differences between paper and screen reading. In contrast, the shallowing hypothesis suggests that frequent digital device use may promote superficial rather than deep processing, potentially leading to poorer reading outcomes (e.g., Annisette & Lafreniere, Reference Annisette and Lafreniere2017).
Empirical findings on the moderating role of digital device usage in reading medium effects have likewise been mixed. Chen et al. (Reference Chen, Cheng, Chang, Zheng and Huang2014) found that students with greater familiarity with tablet devices performed better on summarization tasks than those with lower familiarity, suggesting that experience with digital tools may support effective strategies for interacting with digital texts. However, other research indicates that increased exposure to digital devices does not necessarily improve reading comprehension (e.g., Duncan et al., Reference Duncan, McGeown, Griffiths, Stothard and Dobai2016). For example, Delgado et al. (Reference Delgado, Vargas, Ackerman and Salmerón2018) used publication year as a proxy for increasing exposure to digital technologies over time and found that the gap between paper and digital reading actually increased. This pattern has been interpreted as evidence that extensive digital device use may encourage multitasking, rapid information scanning, and superficial processing rather than deep engagement with texts (Lauterman & Ackerman, Reference Lauterman and Ackerman2014). Recent research also suggests that the effects of digital device use on learning may depend on how devices are used. Yun and Kim (Reference Yun and Kim2025), for example, distinguished between using devices for learning purposes, entertainment, and multiple functions among Korean high school students. Their results showed that device usage for learning purposes was associated with higher academic engagement and better learning outcomes, whereas non-academic device usage was associated with lower engagement. These findings suggest that the relationship between digital device usage and reading comprehension may depend on the purpose of device interactions. With growing interest in this issue, further research is needed to examine how digital device experience interacts with reading medium effects, particularly in L2 contexts and among adolescent learners.
The present study
As noted above, this study aims to investigate how the reading medium affects L2 reading comprehension and whether this relationship is moderated by individual differences. The research questions (RQs) and hypotheses (Hs) are outlined below:
RQ1. To what extent does the reading medium (paper vs. screen) affect L2 reading comprehension?
H1. Lower L2 reading comprehension is expected in the screen condition than in the paper condition (i.e., screen inferiority), in line with L1 meta-analyses and L2 findings reporting poorer comprehension on screens than on paper (e.g., Delgado et al., Reference Delgado, Vargas, Ackerman and Salmerón2018; Yu et al., Reference Yu, Zhou, Yang and Hu2022).
RQ2. To what extent does working memory moderate the relationship between reading medium and L2 reading comprehension?
H2. Working memory is expected to moderate the relationship between reading medium and L2 reading comprehension. Specifically, the lower comprehension associated with screen reading relative to paper reading is expected to be more pronounced as working memory decreases, given that tablet reading can increase cognitive load and may disadvantage lower-capacity readers more than higher-capacity readers (Sanchez & Wiley, Reference Sanchez and Wiley2009).
RQ3. To what extent does L2 proficiency moderate the relationship between reading medium and L2 reading comprehension?
H3. L2 proficiency is expected to moderate the relationship between reading medium and comprehension. In particular, the gap between poorer screen reading and relatively better paper reading is expected to widen as L2 proficiency decreases, because lower-proficiency readers are less likely to monitor their comprehension and to employ effective strategies when reading digitally (Salmerón et al., Reference Salmerón, Delgado, Vargas and Gil2021).
RQ4. To what extent does digital device usage moderate the relationship between reading medium and L2 reading comprehension?
H4. Digital device usage is not expected to significantly moderate the relationship between reading medium and L2 reading comprehension, given inconsistent findings in prior research (e.g., Chen et al., Reference Chen, Cheng, Chang, Zheng and Huang2014; Delgado et al., Reference Delgado, Vargas, Ackerman and Salmerón2018).
Method
Design
The study employed a within-participant design, with the reading medium (paper vs. screen) as the predictor and reading comprehension accuracy as the outcome. All participants completed two reading comprehension test sets (Set A and Set B). Each set was administered under both reading conditions using a counterbalanced design, such that each participant completed one set in print and the other on a tablet. Tablets were selected because these handheld devices are portable and have become widely used among adolescents, not only for entertainment but also as reading devices in school settings (Salmerón et al., Reference Salmerón, Delgado, Vargas and Gil2021, Reference Salmerón, Altamura, Delgado, Karagiorgi and Vargas2024). Additionally, the participants’ school had provided each student with a tablet for classroom learning, ensuring that all participants had easy access to the device and had been regularly exposed to its use for at least a year. Working memory, L2 proficiency, and digital device usage were examined as moderators of medium effects.
Participants
Participants were 245 eighth-grade students from a middle school in a metropolitan city in South Korea. The final sample included 240 participants (male: n = 109; female: n = 131), as five students did not complete the reading comprehension tests in one of the two conditions (for more details, see Data analysis). Based on the background survey responses (N = 234), participants ranged in age from 12 to 15 years (M = 13.42, SD = 0.56). All were native Korean speakers learning EFL. Participants began learning English at a mean age of 7.28 years (SD = 2.08). Only three participants had spent more than three months in an English-speaking country. Self-reported English proficiency (5-point Likert scale) had the following mean scores: reading (M = 3.10, SD = 0.93); listening (M = 3.59, SD = 0.91); speaking (M = 2.99, SD = 0.91); writing (M = 2.94, SD = 0.94). Following the experiment, all participants received light refreshments—rather than monetary rewards—as compensation for their participation, in line with the educational purpose of the study.
Instruments
Reading comprehension tests
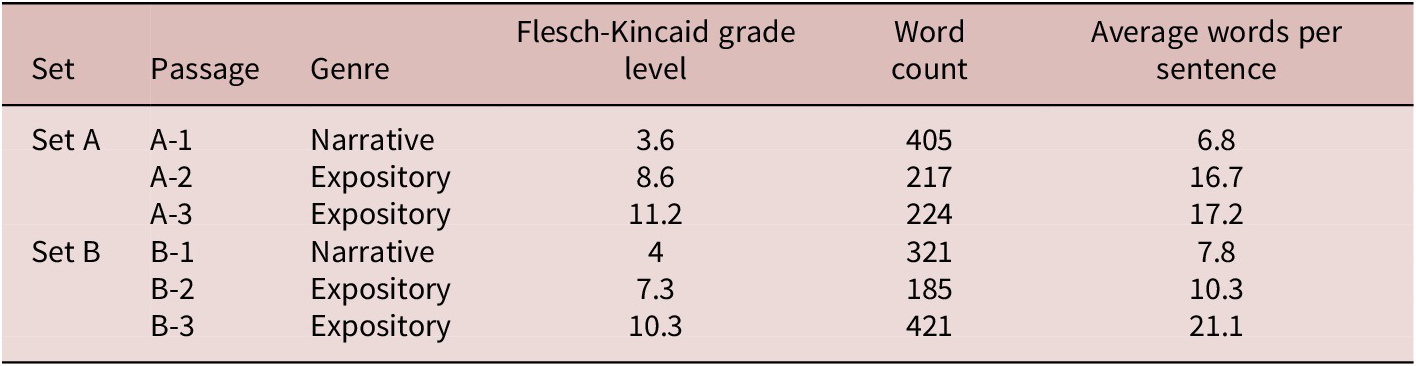
To evaluate reading performance under both medium conditions, reading comprehension tests were adapted from the TOEFL Junior Standard Test, which has an established validity argument for use with secondary-school EFL learners (Hsieh, Reference Hsieh2024). Passages and multiple-choice comprehension questions were selected from the Reading Comprehension section (Part 3) of the practice tests (Educational Testing Service, 2012, 2014). To counterbalance the effects of reading medium, two sets of reading comprehension tests were created (see Appendix A in the Supplementary Materials). Each set (Table 1) consisted of three passages, accompanied by six to eleven comprehension questions per text (a total of 25 questions in Set A and 24 in Set B). Both narrative and expository texts were included in each set, as prior research has suggested that text genre may influence the effects of reading medium on reading comprehension (e.g., Clinton, Reference Clinton2019). To ensure appropriateness, the lead researcher and an experienced English language teacher familiar with the target population (with six years of experience teaching the same age group) carefully reviewed the tests and confirmed their suitability for the present study, after which a few challenging words (e.g., perch) were glossed with Korean translations. The reading comprehension tests demonstrated high internal consistency (Cronbach’s α = .92, 95% CI [.91, .93]).
Characteristics of experimental passages

Table 1. Long description
The table has six columns: Set, Passage, Genre, Flesch-Kincaid grade level, Word count, and Average words per sentence. From the top row, column headers are Set, Passage, Genre, Flesch-Kincaid grade level, Word count, Average words per sentence. The first group is Set A. Passage A–1 is Narrative, grade 3.6, 405 words, 6.8 average words per sentence. Passage A–2 is Expository, grade 8.6, 217 words, 16.7 average words per sentence. Passage A–3 is Expository, grade 11.2, 224 words, 17.2 average words per sentence. The next group is Set B. Passage B–1 is Narrative, grade 4, 321 words, 7.8 average words per sentence. Passage B–2 is Expository, grade 7.3, 185 words, 10.3 average words per sentence. Passage B–3 is Expository, grade 10.3, 421 words, 21.1 average words per sentence.
Both sets were prepared for printed and tablet formats (Appendix B). On each medium, passages were displayed on the left and comprehension questions on the right, with passages occupying a larger portion of the layout (approximately 2:1 on paper and 1.5:1 on tablets). For each set, the three passages (e.g., Passages 1–3) were presented in different counterbalanced orders across participants. In the paper condition, six versions of the test booklets (e.g., 1–2–3, 1–3–2) were prepared, and participants were randomly assigned to one version, whereas in the tablet condition, a randomization function assigned one of the possible passage orders to each participant. Paper tests were printed on B4 double-sided sheets; passages were presented in full, and text was repeated on pages with questions to maintain context. Tablet versions were web-based (JavaScript) to record participant IDs and responses and were optimized for approximately 10.4-inch screens. Passages and comprehension questions were scrollable, presented side by side, and navigable with “Previous” and “Next” buttons. Both orientations and a zoom-in function were supported. Each multiple-choice question allowed only one response.
Working memory task
Working memory was assessed using a reading span task (Appendix C), adapted for tablet-based administration with Korean teenage participants. In this study, 42 sentences (19 plausible, 23 implausible) were adapted from Kim (Reference Kim2010), originally based on Kane et al. (Reference Kane, Hambrick, Tuholski, Wilhelm, Payne and Engle2004), with several modifications. Following the recommendation of In’nami et al. (Reference In’nami, Hijikata and Koizumi2022), all sentences were translated into Korean to minimize potential confounding effects of L2 proficiency. To ensure translation accuracy, two English teachers (native Korean speakers fluent in English) performed a back-translation. In addition, the lead researcher and one Korean language teacher familiar with the target population revised a few difficult words (e.g., “prosecutor” and “hostages”) to more familiar terms while maintaining plausibility. The Korean version averaged 8.74 words per sentence (SD = 1.62; min = 6; max = 12), based on spacing units. The recall items were also changed from English alphabet letters (used in the original version) to randomly selected Korean consonants. The 42 sentences were randomly grouped into sets of 2 to 5 sentence-letter pairs, and each set size was repeated 3 times, resulting in a total of 42 trials (i.e., (2 + 3 + 4 + 5) × 3 = 42). Lastly, unlike Kim (Reference Kim2010), where participants read sentences and letters aloud, the reading span task in the present study was administered silently.
The reading span task was developed using jsPsych, an open-source JavaScript-based experiment builder that runs in a web browser. The task was designed for a touchscreen interface, and it followed the procedure described below. After task instructions and two practice sessions, participants completed the main task, in which sets of two to five sentence–letter pairs were presented in randomized order for each participant to minimize potential order effects and discourage strategic allocation of attention. Participants were presented with isolated Korean consonant letters to minimize the influence of reading ability (e.g., Conway et al., Reference Conway, Kane, Bunting, Hambrick, Wilhelm and Engle2005). The semantic judgment task was self-paced, and the reaction times were recorded. After each response, a single Korean consonant letter appeared on the screen for one second. At the end of each set, participants were asked to recall the letters in order by selecting from on-screen buttons displaying all Korean consonants, along with an “I don’t know” option, which enabled partial scoring based on positional accuracy. Split-half reliability was calculated by correlating odd- and even-numbered sets and applying the Spearman–Brown correction, yielding an estimate of r = .71, 95% CI [.62, .77].
L2 proficiency test
To measure overall L2 proficiency, which was examined as a moderator of the reading medium effect, the study used the 2018 National Academic Achievement Test of English, developed by the Korea Institute for Curriculum and Evaluation (Appendix D). This nationwide, curriculum-based assessment is administered annually to evaluate secondary school students’ English achievement. The test is developed by experienced English language teachers and curriculum experts to ensure alignment with national curriculum standards, providing evidence of content validity as a measure of English proficiency. In the present sample, the test demonstrated high internal consistency (Cronbach’s α = .88, 95% CI [.86, .90]). In consultation with an English teacher, the version developed for 11th-grade students was selected to better distinguish proficiency levels among the participants.
The test consisted of 40 items: 34 multiple-choice questions and six fill-in-the-blank questions. The items assessed four skills: listening (11 items), speaking (5 items), reading (17 items), and writing (7 items). The listening section included both dialogues (4–5 conversational turns) and monologues (81–103 words). All reading items were passage-based (80–178 words). Speaking and writing items indirectly and directly measured productive skills (e.g., choosing the most appropriate response, completing a summary sentence). The fill-in-the-blank questions required participants to write either a single word in a controlled format (e.g., a word beginning with a specific letter or selected from a given text) or a clause. The test was administered on double-sided B4 paper.
Digital device usage questionnaire
A digital device usage questionnaire was developed to evaluate participants’ tablet use. It consisted of 18 items, including 13 items adapted from the tablet familiarity questionnaire developed by Zheng et al. (Reference Zheng, Cheng, Xu, Chen, Huang, Chen, Kumar, Kinsuk and Kong2015). From their five-factor framework (tablet ability, use and experience, availability, entertainment, and problem solving), two to three representative items per category were selected based on the relevance to the target population. All selected items had factor loadings above 0.40. One original item, “I usually use tablet computers to read e-books,” was split into two items (Q16, Q4) assessing e-book reading in Korean and English. Additionally, five items (Q3, Q8, Q10, Q13, Q18) were newly created to assess reading habits and English learning on tablets. These included items such as whether participants felt comfortable using zooming or scrolling functions while reading on tablets. Responses were recorded on a five-point Likert scale (1 = “Strongly disagree,” 5 = “Strongly agree”), with three items (Q3, Q5, Q8) negatively worded. All items were translated into Korean and back-translated into English by a bilingual English teacher to ensure translation accuracy. The final questionnaire was created using Google Forms for administration on tablets. All non-copyrighted materials are available on the OSF repository (https://osf.io/t4732/).
Procedure
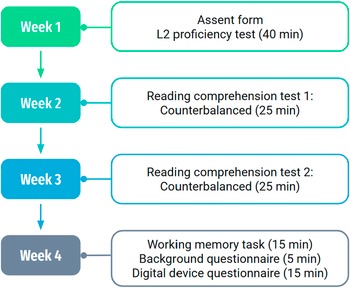
The study was conducted in intact classroom settings during regular English instruction (Spring 2025). It spanned four weeks with one 45-minute session per week across eight intact classes (Figure 1). In Week 1, the researcher introduced the study, obtained assent, and administered the L2 proficiency test (40 minutes) in a paper-and-pencil format. In Week 2, participants completed one of the two reading comprehension sets (Set A or Set B). Half of the participants took the test on a tablet provided by the school, and the other half completed the paper-based version (25 minutes). In Week 3, participants completed the other test (25 minutes), with the medium format and test sets counterbalanced to mitigate potential order effects and practice effects. That is, participants who took Set A on a tablet in Week 2 switched to the paper-based version of Set B in Week 3, and vice versa. The remaining time was displayed on a TV monitor (paper condition) or at the bottom of the tablet screen (tablet condition). The lead researcher monitored the testing sessions (Weeks 2–3) in both conditions. In the paper condition, the tests were collected from all participants when the 25-minute period ended. In the tablet condition, participants could submit their responses by pressing the “Submit” button once they had completed the test, at any time within the 25-minute window; if they did not submit before the time limit, their responses were automatically saved when the 25 minutes elapsed. In Week 4, participants completed the reading span task (15 minutes), the background questionnaire (5 minutes), and the digital device usage questionnaire (15 minutes), all on tablets and accessed via QR codes shared on the classroom TV screen. The session ended with a researcher-led debrief. All procedures were approved by the Institutional Review Board (IRB).
Experimental procedure.

Scoring
Reading comprehension accuracy was dichotomously scored (1 = correct, 0 = incorrect) with no partial credit, and item-level data were retained for analysis. L2 proficiency items were also scored dichotomously and summed to produce a total score. All responses were scored by the lead researcher and then reviewed by an English language teacher. The inter-rater reliability was high (r = .99). The few discrepancies mainly involved singular–plural mismatches (e.g., stranger instead of strangers) or letter-identification ambiguities and were resolved through discussion. Working memory scores were calculated using partial unit scoring, defined as the proportion of letters correctly recalled within each set (Conway et al., Reference Conway, Kane, Bunting, Hambrick, Wilhelm and Engle2005). These proportions were averaged across sets to compute participants’ working memory scores. To ensure engagement with the processing component, plausibility responses with reaction times exceeding 10,000 ms were scored as incorrect. This threshold was set longer than in previous college-based studies to accommodate the younger sample. Participants whose judgment accuracy fell more than 2.5 SD below the sample mean were excluded. After exclusion, the mean accuracy on the semantic judgment task was .82 (SD = .12). Finally, digital device usage scores were calculated by first reverse-scoring negatively worded items and then deriving factor scores from 13 selected items (five items were excluded from the original 18; see Appendix E).
Data analysis
Analyses were conducted in R (R version 4.5.1; R Core Team, 2025). Before addressing the research questions, the structure of the digital device usage questionnaire was examined with exploratory factor analysis (EFA). For RQ1, participants who completed the reading comprehension test in only one medium (n = 5; three: tablet only, two: paper only) were excluded, leaving 240 for analysis. Logistic mixed-effects models were fitted using the lme4 package (version 1.1.37; Bates et al., Reference Bates, Mächler, Bolker and Walker2015), with reading accuracy coded as a binary outcome and reading medium included as a dummy-coded fixed effect (paper = 0, tablet = 1).
For the remaining RQs, participants who did not complete the working memory test (n = 6), the proficiency test (n = 4), or the questionnaire (n = 6) were excluded from the respective analyses. Five additional participants were removed from the working memory analyses because their z-scored plausibility accuracy fell more than 2.5 SD from the mean. All continuous moderators, including working memory (RQ2: average accuracy rate), L2 proficiency (RQ3: sum score), and digital device usage (RQ4: factor scores), were z-scored to enable comparability across scales. Logistic mixed-effects models were then constructed following the same structure as for RQ1, and a single moderator was added as an interaction with medium.
Each model initially included a maximal random-effects structure (Barr et al., Reference Barr, Levy, Scheepers and Tily2013). In cases of non-convergence, the structure was simplified by removing random components with the smallest variance until convergence was achieved. Final models were selected based on likelihood ratio tests using the anova() function in R. Model diagnostics were conducted using the DHARMa package (version 0.4.7; Hartig, Reference Hartig2024). Diagnostic tests indicated no evidence of overdispersion or outliers (all ps > .05). Although the Kolmogorov–Smirnov test indicated deviations from uniformity in some models, details on alternative model specifications are reported in Tables 5–7 and Appendix H. Multicollinearity was assessed using the car package (version 3.1.5; Fox & Weisberg, Reference Fox and Weisberg2019), with variance inflation factors below 1.4 for all predictors.
Results
RQ1. Effect of reading medium
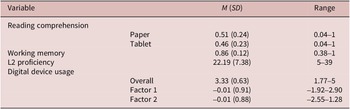
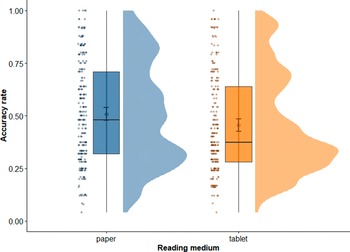
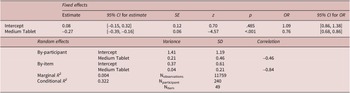
Descriptive statistics for comprehension accuracy rate by reading medium are presented in Table 2. As illustrated in Figure 2, the paper condition (M = 0.51, SD = 0.24, SE = 0.02, 95% CI [0.48, 0.54]) yielded higher accuracy than the tablet condition (M = 0.46, SD = 0.23, SE = 0.01, 95% CI [0.43, 0.48]). The best-fitting logistic mixed-effects model (Table 3) indicated that reading medium was a significant predictor, with lower accuracy in the tablet condition compared to the paper condition (β = –0.27, SE = 0.06, z = –4.57, p < .001). The odds of a correct response were 23.9% lower for tablet reading relative to paper reading (OR = 0.76). The model explained 0.4% of the variance with the fixed effects alone and 32.2% with both fixed and random effects.
Descriptive statistics for the study variables
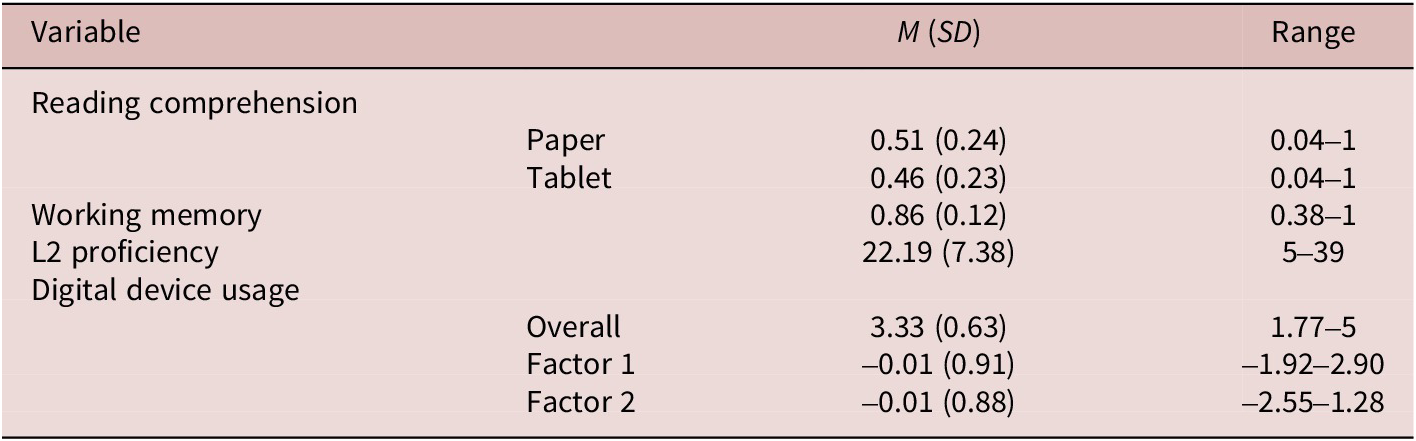
Table 2. Long description
Beginning at the top row, the table lists variables in the first column, with subcategories for reading comprehension and digital device usage. For reading comprehension, paper scores are 0.51 (0.24) with a range of 0.04 to 1, tablet scores are 0.46 (0.23) with a range of 0.04 to 1. Working memory is 0.86 (0.12), range 0.38 to 1. L2 proficiency is 22.19 (7.38), range 5 to 39. Digital device usage overall is 3.33 (0.63), range 1.77 to 5. Factor 1 is minus 0.01 (0.91), range minus 1.92 to 2.90. Factor 2 is minus 0.01 (0.88), range minus 2.55 to 1.28. All values are aligned horizontally with means and standard deviations in the third column and ranges in the fourth column. The note below clarifies scoring conventions: reading comprehension and working memory are proportion correct, L2 proficiency is a raw sum score, digital device usage is a mean Likert-scale score, and Factor 1 and Factor 2 are standardized latent factor scores.
Note: Reading comprehension and working memory scores represent proportion correct (accuracy rates). L2 proficiency scores are reported as raw sum scores. For the digital device usage questionnaire, the reported score represents the mean of the 1–5 Likert-scale items. Factor 1 and Factor 2 values are standardized latent factor scores. A correlation matrix of all primary study variables is provided in Appendix F.
Accuracy rate by reading medium.
Note: This figure compares comprehension accuracy between the paper and tablet conditions (large dots indicate means; error bars represent 95% confidence intervals). Accuracy is higher and more evenly distributed in the paper condition, whereas scores in the tablet condition cluster toward the lower end of the distribution, as reflected by the lower median within the box.
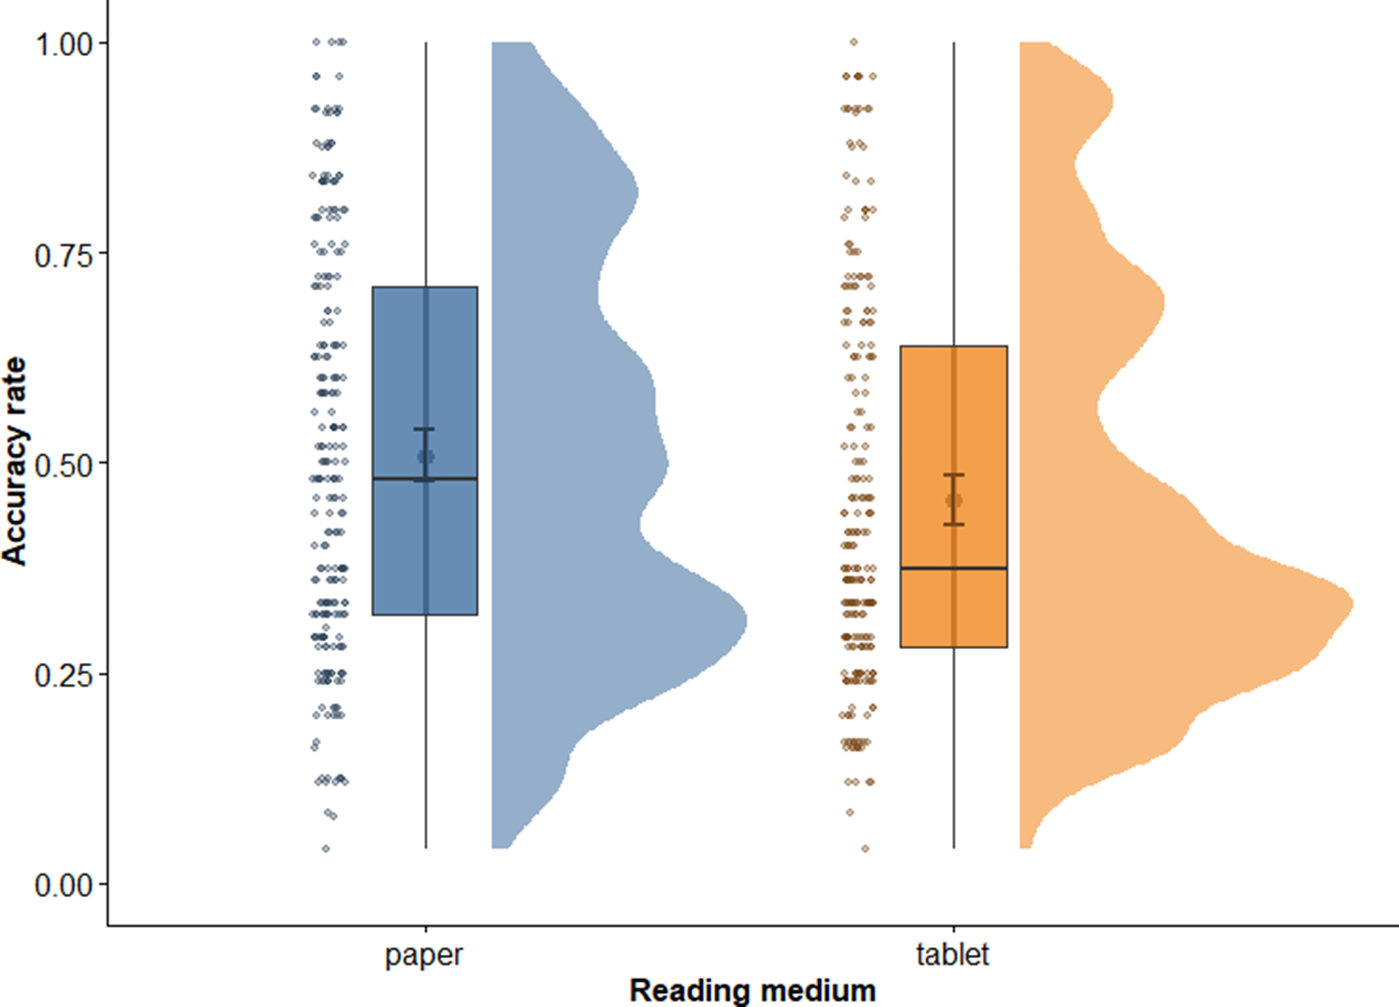
Figure 2. Long description
The x-axis is labeled reading medium with two categories: paper on the left and tablet on the right. The y-axis is labeled accuracy rate, ranging from 0.00 at the bottom to 1.00 at the top. Each reading medium displays a vertical box plot with overlaid scatter points and a violin plot. For paper, the box plot is blue, centered around a median near 0.50, with the interquartile range spanning roughly 0.30 to 0.70. The mean is marked by a large dot, and error bars indicate the 95 percent confidence interval. The blue violin plot shows a relatively uniform density across the range. For tablet, the box plot is orange, with a median near 0.35 to 0.40 and the interquartile range from about 0.25 to 0.60. The mean is lower than for paper, and the error bars are present. The scatter points cluster more toward the lower end, and the orange violin plot is denser below 0.50, tapering off above. This indicates that accuracy rates are higher and more evenly distributed for paper, while tablet scores are lower and more concentrated at the lower end.
Best-fitting logistic mixed-effects model for reading medium and comprehension accuracy (RQ1)
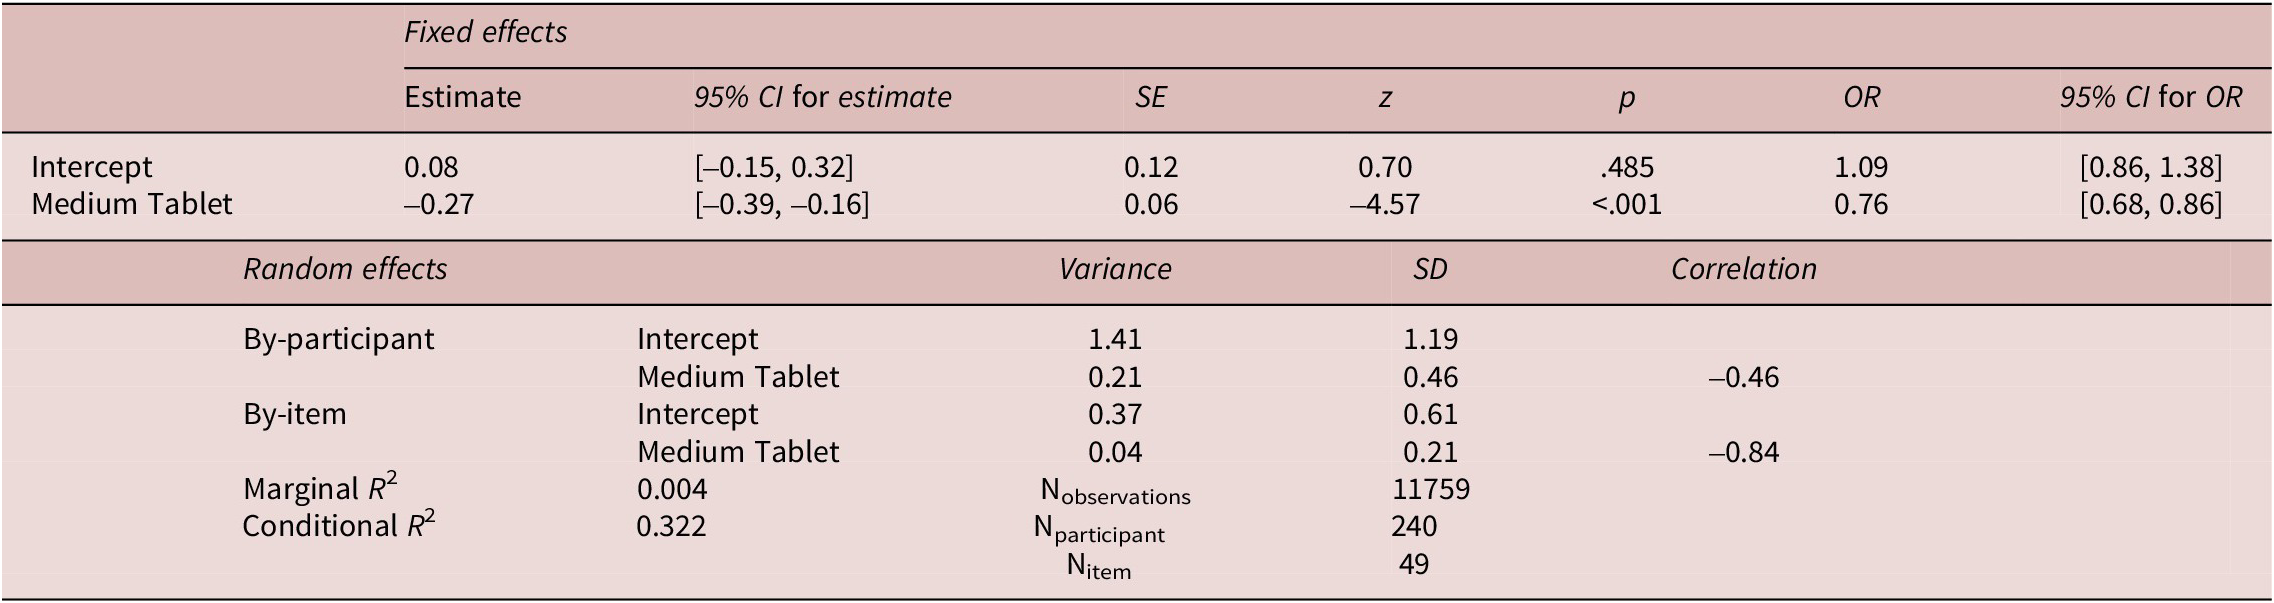
Table 3. Long description
The first section lists fixed effects: Intercept with estimate 0.08, 95 percent confidence interval negative 0.15 to 0.32, standard error 0.12, z 0.70, p 0.485, odds ratio 1.09, 95 percent confidence interval 0.86 to 1.38. Medium Tablet has estimate negative 0.27, 95 percent confidence interval negative 0.39 to negative 0.16, standard error 0.06, z negative 4.57, p less than .001, odds ratio 0.76, 95 percent confidence interval 0.68 to 0.86. The next section presents random effects: By-participant Intercept variance 1.41, standard deviation 1.19; Medium Tablet variance 0.21, standard deviation 0.46, correlation negative 0.46. By-item Intercept variance 0.37, standard deviation 0.61; Medium Tablet variance 0.04, standard deviation 0.21, correlation negative 0.84. Marginal R squared is 0.004, Conditional R squared is 0.322. Sample sizes are N observations 11759, N participant 240, N item 49. The note clarifies that Intercept refers to the paper-based reading condition and O R means odds ratio. Additional analysis found narrative texts yielded higher comprehension accuracy than expository texts, beta equals 0.41, S E equals 0.17, p equals .018, with no significant interaction, beta equals negative 0.02, S E equals 0.09, p equals .816, indicating the medium effect did not differ across genres.
Note: Intercept = paper-based reading condition; OR = odds ratio. An additional mixed-effects analysis including text genre and its interaction with reading medium was conducted in response to reviewer comments. Narrative texts yielded higher overall comprehension accuracy than expository texts (β = 0.41, SE = 0.17, p = .018), but no significant interaction was observed (β = −0.02, SE = 0.09, p = .816), indicating that the magnitude of the medium effect did not differ across genres.
RQ2. Interaction of reading medium and working memory
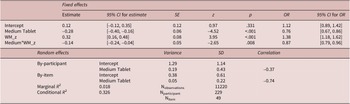
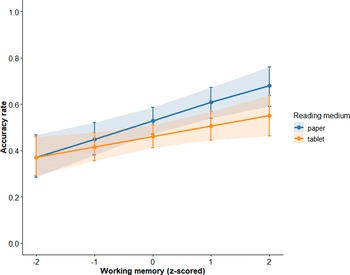
To address RQ2, the interaction between medium and working memory in predicting comprehension accuracy was examined. The reading span score is reported in Table 2, and the final logistic mixed-effects model is shown in Table 4. When working memory was held at its standardized mean, reading medium remained a significant predictor, with lower performance in the tablet condition than in the paper condition (β = –0.28, SE = 0.06, z = –4.52, p < .001). Working memory also had a significant main effect (β = 0.32, SE = 0.08, z = 3.95, p < .001), indicating that higher capacity was associated with greater comprehension accuracy. Notably, the interaction between reading medium and working memory was significant (β = –0.14, SE = 0.05, z = –2.65, p = .008). As illustrated in Figure 3, the performance gap between the two media widened with increasing working memory. Participants showed approximately 12.9% lower odds of a correct response per 1 SD increase in working memory compared to the paper condition (OR = 0.87). The fixed effects accounted for 1.8% of the variance, while the full model (fixed + random effects) explained 32.6%.
Best-fitting model for reading medium × working memory (RQ2)
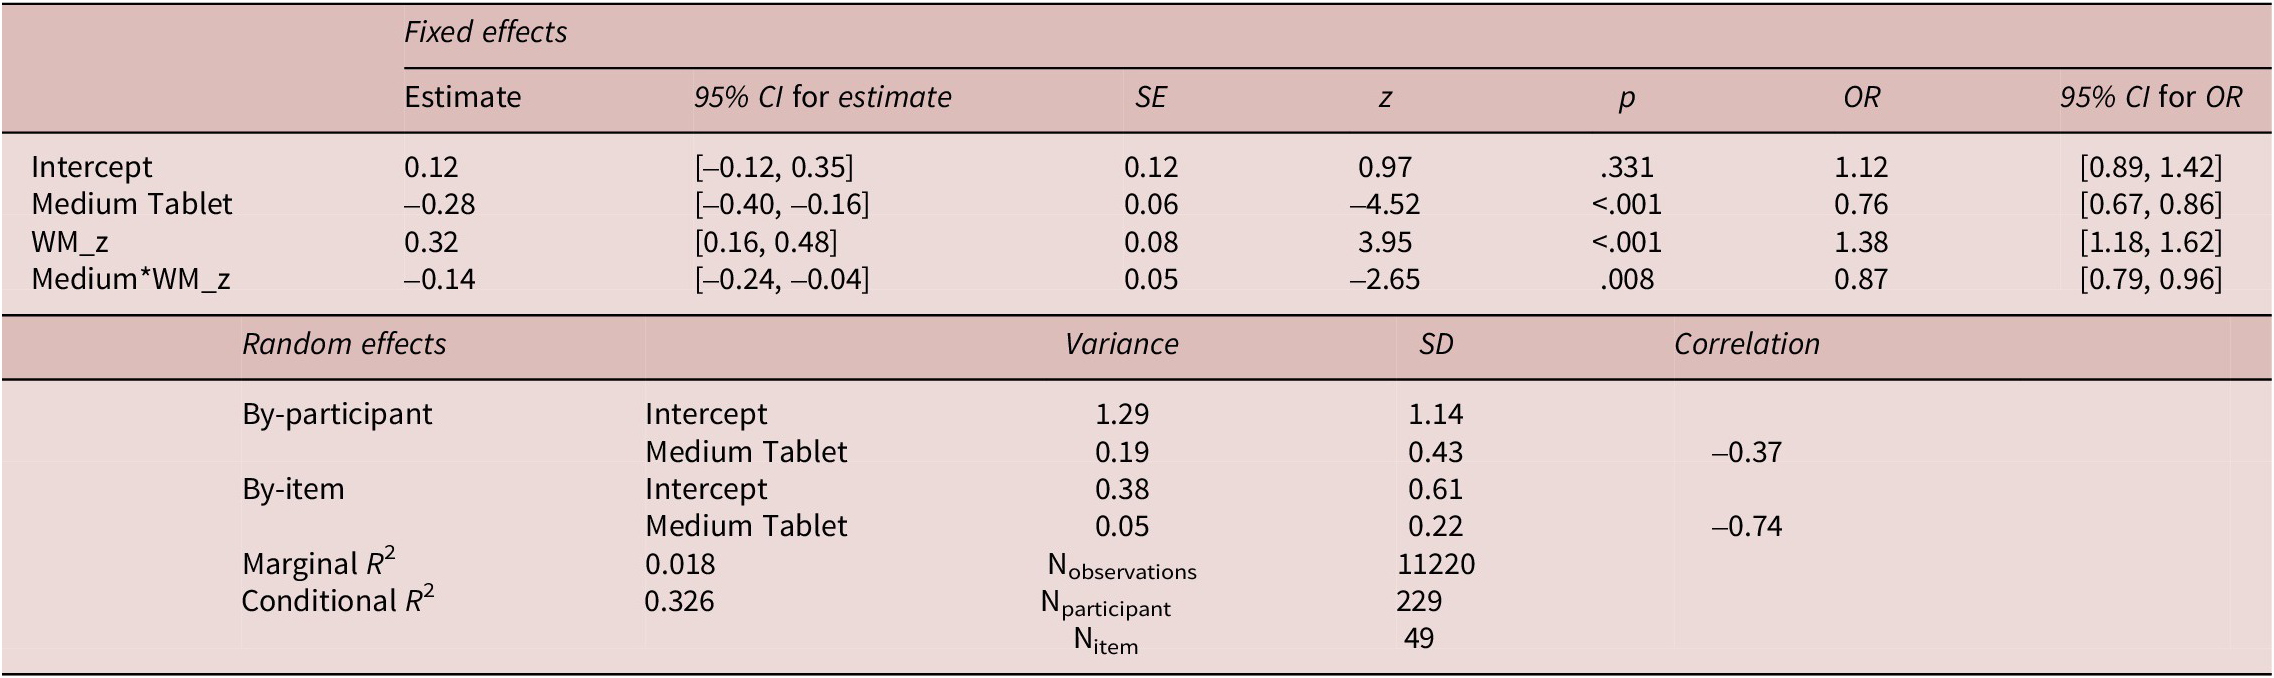
Table 4. Long description
The table begins with fixed effects listed in four rows: Intercept, Medium Tablet, W M sub z, and Medium times W M sub z. For each, columns display Estimate, 95 percent confidence interval for estimate, S E, z, p, O R, and 95 percent confidence interval for O R. Intercept has an estimate of 0.12, confidence interval negative 0.12 to 0.35, S E 0.12, z 0.97, p 0.331, O R 1.12, confidence interval 0.89 to 1.42. Medium Tablet has estimate negative 0.28, confidence interval negative 0.40 to negative 0.16, S E 0.06, z negative 4.52, p less than .001, O R 0.76, confidence interval 0.67 to 0.86. W M sub z has estimate 0.32, confidence interval 0.16 to 0.48, S E 0.08, z 3.95, p less than .001, O R 1.38, confidence interval 1.18 to 1.62. Medium times W M sub z has estimate negative 0.14, confidence interval negative 0.24 to negative 0.04, S E 0.05, z negative 2.65, p .008, O R 0.87, confidence interval 0.79 to 0.96. The next section presents random effects. By-participant random effects include Intercept with variance 1.29, S D 1.14, and Medium Tablet with variance 0.19, S D 0.43, correlation negative 0.37. By-item random effects include Intercept with variance 0.38, S D 0.61, and Medium Tablet with variance 0.05, S D 0.22, correlation negative 0.74. The final section shows marginal R squared 0.018, conditional R squared 0.326, N sub observations 11220, N sub participant 229, N sub item 49. The note clarifies W M sub z is z-scored working memory score and details model selection and random effect computation constraints.
Note: WM_z = z-scored working memory score. Although anova() indicated that the model with “medium|participant” and “medium+WM_z|item” random effects was optimal, random-effect variances could not be computed for R 2. Accordingly, the final model retained only the medium slope (excluding “WM_z”) for both participant and item.
Reading medium × working memory.
Note: Figures 3–5 display model-based predicted accuracy rates across the range of ±2 SD of the standardized moderator variable, following a simple-slope approach. These predictions were estimated using ggpredict() from the ggeffects R package (version 2.3.0; Lüdecke, Reference Lüdecke2018). Accuracy increased with working memory in both conditions; however, the paper–tablet gap widened at higher levels of working memory. Model-based marginal effects of reading medium across levels of working memory and the corresponding Johnson–Neyman analysis are presented in Appendix G (Figure G1).
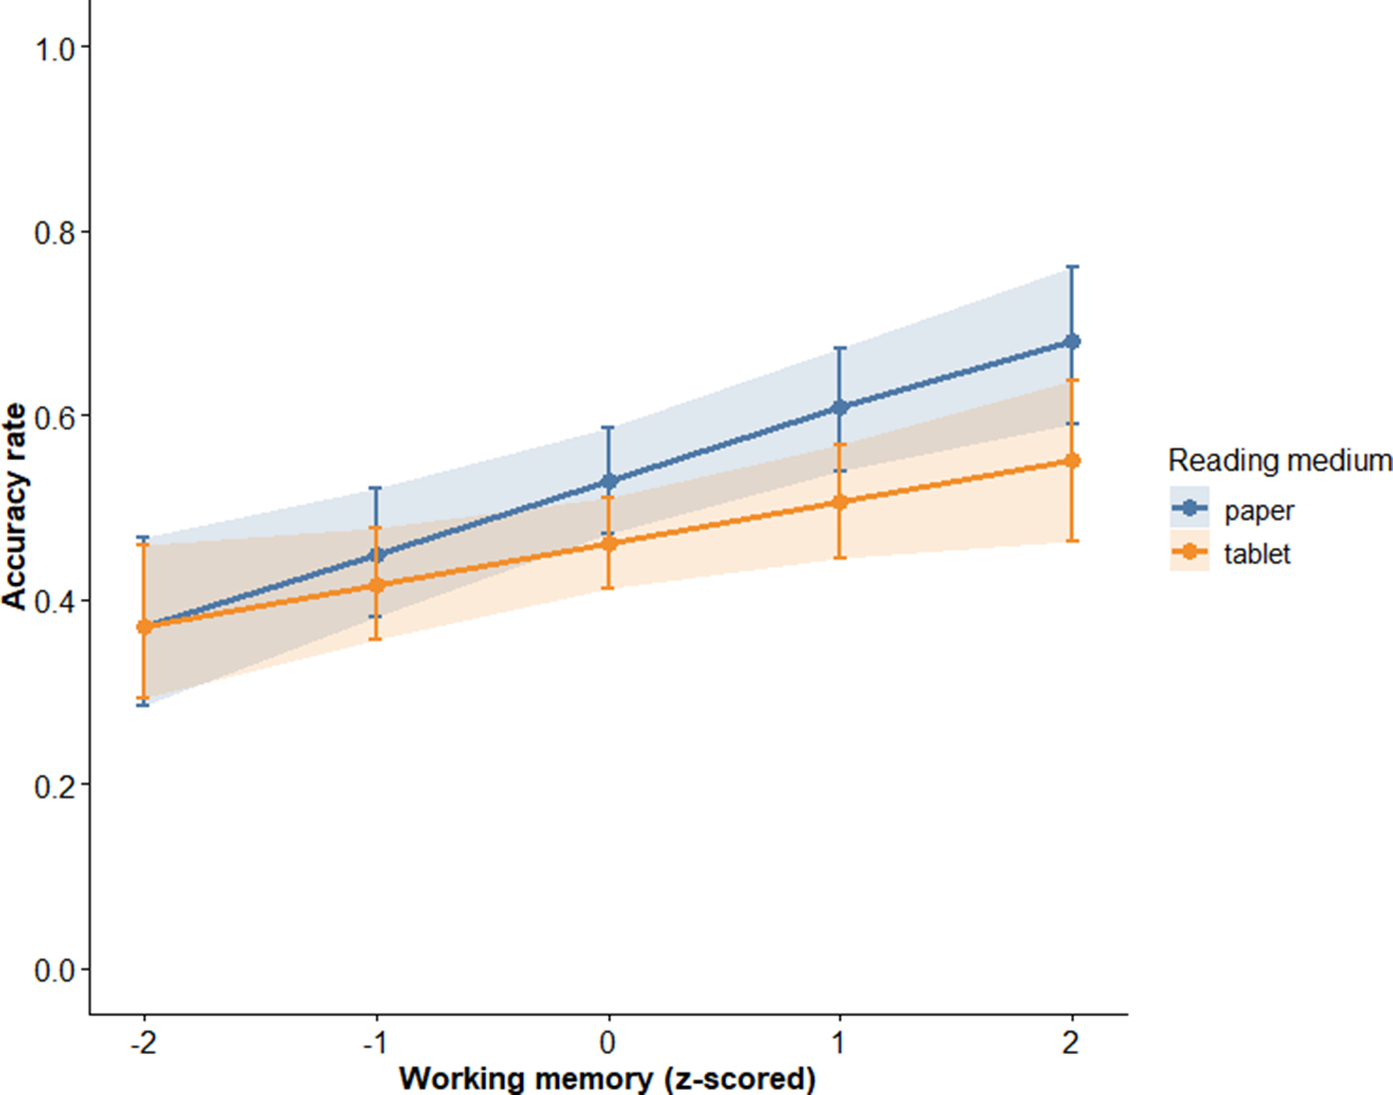
Figure 3. Long description
The x-axis is labeled working memory z-scored, ranging from minus 2 to plus 2. The y-axis is labeled accuracy rate, ranging from 0 to 1. Two lines represent reading medium: blue for paper and orange for tablet, with a legend at the right. Both lines show a positive linear trend, with accuracy rate increasing as working memory increases. The blue paper line starts near 0.4 at minus 2 and rises to about 0. 65 at plus 2. The orange tablet line starts near 0.4 at minus 2 and rises to about 0. 5 at plus 2. The gap between the lines widens as working memory increases. Shaded regions around each line indicate confidence intervals, which overlap at lower working memory values but diverge at higher values. Error bars are present at each plotted point.
RQ3. Interaction of reading medium and L2 proficiency
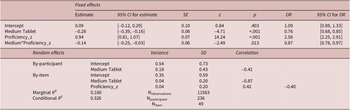
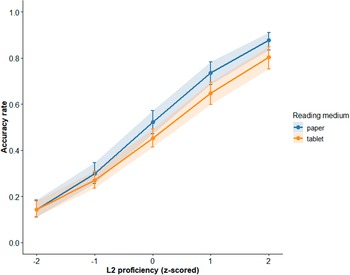
For RQ3, we examined whether L2 proficiency moderated the effect of reading medium on comprehension accuracy. Descriptive statistics for L2 proficiency test are presented in Table 2. The final logistic mixed-effects model (Table 5) revealed that, when proficiency was held at its standardized mean, reading medium was a significant predictor (β = –0.28, SE = 0.06, z = –4.71, p < .001). Proficiency showed a strong positive association with comprehension accuracy (β = 0.94, SE = 0.07, z = 14.24, p < .001), suggesting that more proficient participants tended to achieve higher scores. The interaction between reading medium and proficiency was also significant (β = –0.14, SE = 0.06, z = –2.49, p = .013). As shown in Figure 4, the accuracy gap between the two media increased with proficiency: For a 1 SD increase in proficiency, the odds of a correct response were about 12.9% lower in the tablet condition than in the paper condition (OR = 0.87). Notably, the fixed effects accounted for 16.0% of the variance, and the full model explained 32.6%.
Best-fitting model for reading medium × L2 proficiency (RQ3)
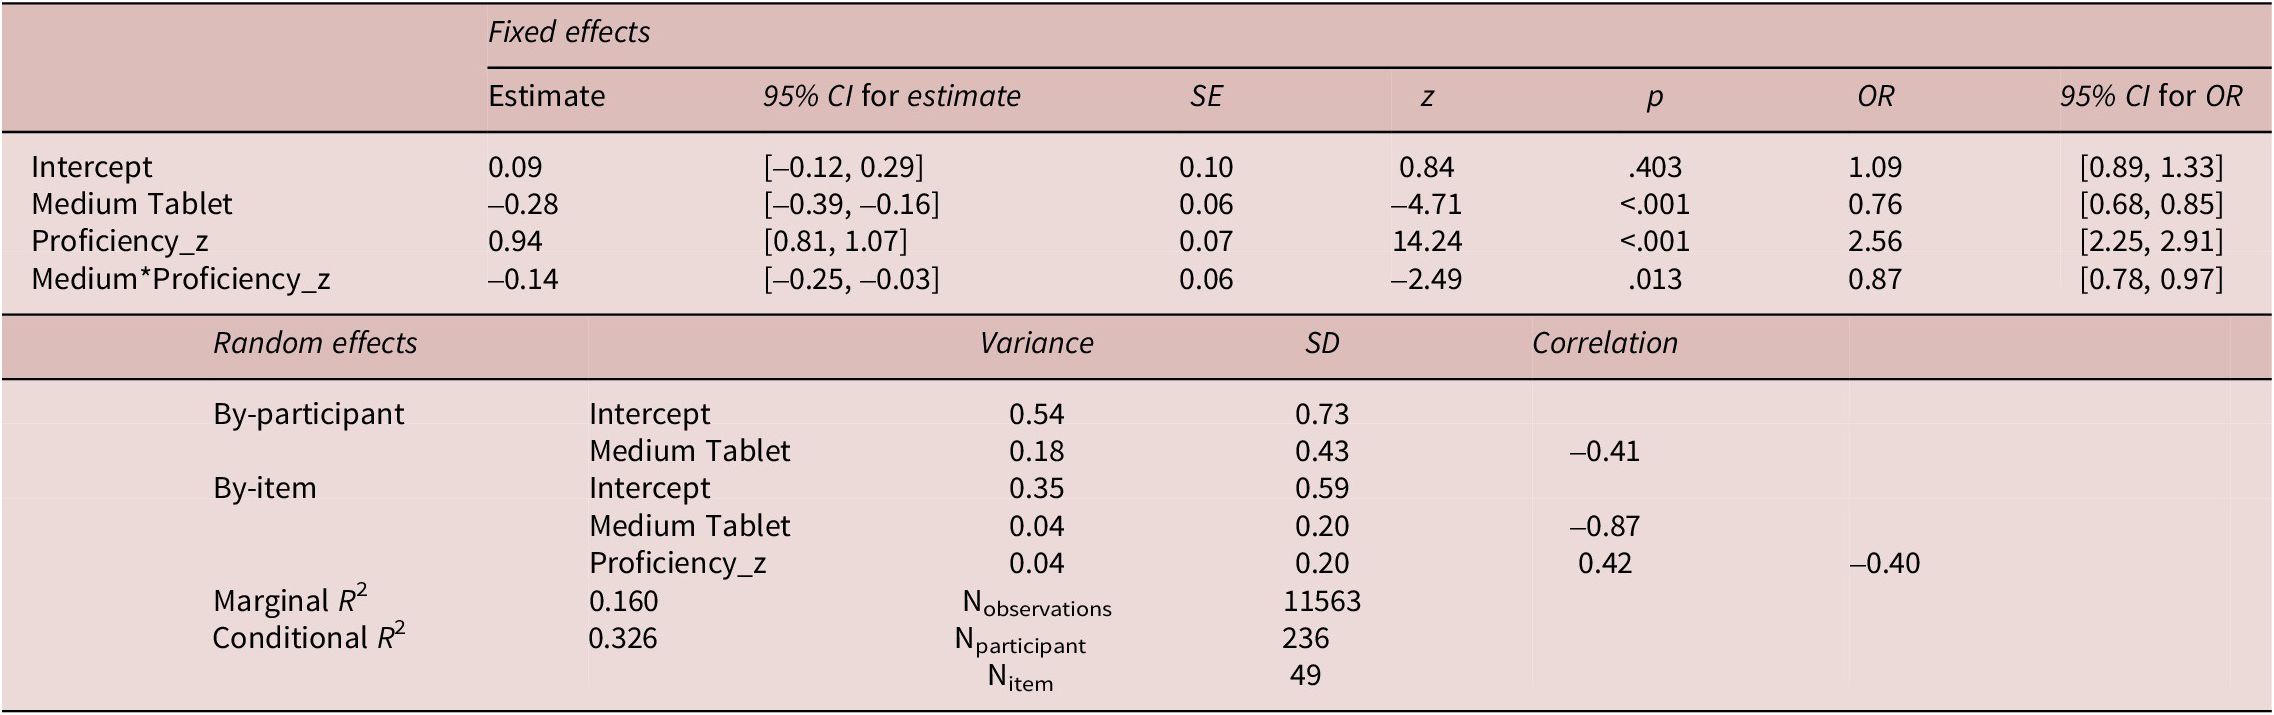
Table 5. Long description
Beginning with fixed effects, the table lists Intercept (estimate 0.09, 95 percent confidence interval negative 0.12 to 0.29, S E 0.10, z 0.84, p 0.403, odds ratio 1.09, 95 percent confidence interval 0.89 to 1.33), Medium Tablet (estimate negative 0.28, 95 percent confidence interval negative 0.39 to negative 0.16, S E 0.06, z negative 4.71, p less than 0.001, odds ratio 0.76, 95 percent confidence interval 0.68 to 0.85), Proficiency_z (estimate 0.94, 95 percent confidence interval 0.81 to 1.07, S E 0.07, z 14.24, p less than 0.001, odds ratio 2.56, 95 percent confidence interval 2.25 to 2.91), and Medium times Proficiency_z (estimate negative 0.14, 95 percent confidence interval negative 0.25 to negative 0.03, S E 0.06, z negative 2.49, p 0.013, odds ratio 0.87, 95 percent confidence interval 0.78 to 0.97). Random effects are shown for by-participant (Intercept variance 0.54, S D 0.73), Medium Tablet (variance 0.18, S D 0.43, correlation negative 0.41), by-item (Intercept variance 0.35, S D 0.59), Medium Tablet (variance 0.04, S D 0.20, correlation negative 0.87), and Proficiency_z (variance 0.04, S D 0.20, correlation 0.42, correlation negative 0.40). Marginal R squared is 0.160, conditional R squared is 0.326. Sample sizes are N observations 11563, N participant 236, N item 49. The note clarifies that Proficiency_z is z-scored proficiency and that while anova identified this as the best-fitting model, the K S test based on G G plot residuals indicated significant deviation (p equals 0.003). Results with only random intercepts showed no deviation (K S test p equals 0.555).
Note: Proficiency_z = z-scored proficiency. While anova() identified this as the best-fitting model, the KS test based on the GG-plot residuals indicated a significant deviation (p = .003). Results with only random intercepts (Appendix H, Table H1) showed no deviation (KS test: p = .555).
Reading medium × L2 proficiency.
Note: Students with higher L2 proficiency achieved greater comprehension accuracy in both conditions, but the difference between paper and screen reading increased as proficiency increased. Model-based marginal effects of reading medium across levels of proficiency and the corresponding Johnson–Neyman analysis are presented in Appendix G (Figure G2).

Figure 4. Long description
The x-axis represents L2 proficiency (z-scored) ranging from negative 2 to 2. The y-axis shows accuracy rate from 0 to 1. Two lines are plotted: blue for paper and orange for tablet, as indicated by the legend at the right center. Both lines show a positive linear trend, with accuracy rate increasing as L2 proficiency increases. The blue paper line remains higher than the orange tablet line for nearly all proficiency levels. The gap between the two lines widens as proficiency increases. Shaded regions around each line indicate confidence intervals, and error bars are present at each data point. The lowest proficiency (z-score negative 2) shows both media with similarly low accuracy rates.
RQ4. Interaction of reading medium and digital device usage
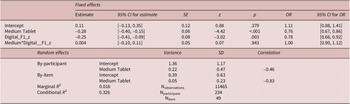
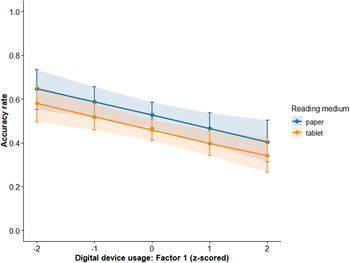
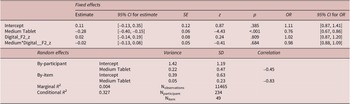
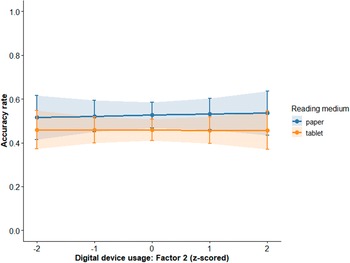
This analysis assessed the role of digital device usage in the relationship between reading medium and accuracy. Based on the EFA, the questionnaire yielded two factors—Tablet Use and Experience (Factor 1) and Tablet Proficiency (Factor 2)—with adequate factorability (KMO = .83; Bartlett’s χ2(78) = 966.48, p < .001), together explaining 40% of the total variance. Both factors demonstrated satisfactory internal consistency (α = .82, 95% CI [.79, .86]; α = .73, 95% CI [.68, .78]; see Appendix E for full psychometric details). For Factor 1, the logistic mixed-effects model (Table 6) revealed that both reading medium (β = –0.28, SE = 0.06, z = –4.42, p < .001) and device usage (β = –0.25, SE = 0.08, z = –3.02, p = .003) were significant predictors: Tablet reading reduced comprehension accuracy, and higher tablet use and experience scores predicted poorer comprehension performance. However, there was no significant interaction between the two (β = 0.004, SE = 0.05, z = 0.07, p = .943). As presented in Figure 5, the negative association between device usage and comprehension remained consistent across both media (OR = 1.00). The fixed effects accounted for 1.6% of the variance, while the full model explained 32.6%. For Factor 2, the model (Table 7) confirmed that reading medium was a significant predictor (β = –0.28, SE = 0.06, z = –4.43, p < .001), whereas neither tablet proficiency (β = 0.02, SE = 0.08, z = 0.24, p = .809) nor its interaction with medium was significant (β = –0.02, SE = 0.05, z = –0.41, p = .684; Figure 6). This model explained 0.4% of the variance, and the full model explained 32.7%.
Best-fitting model for reading medium × digital device usage (RQ4): Factor 1
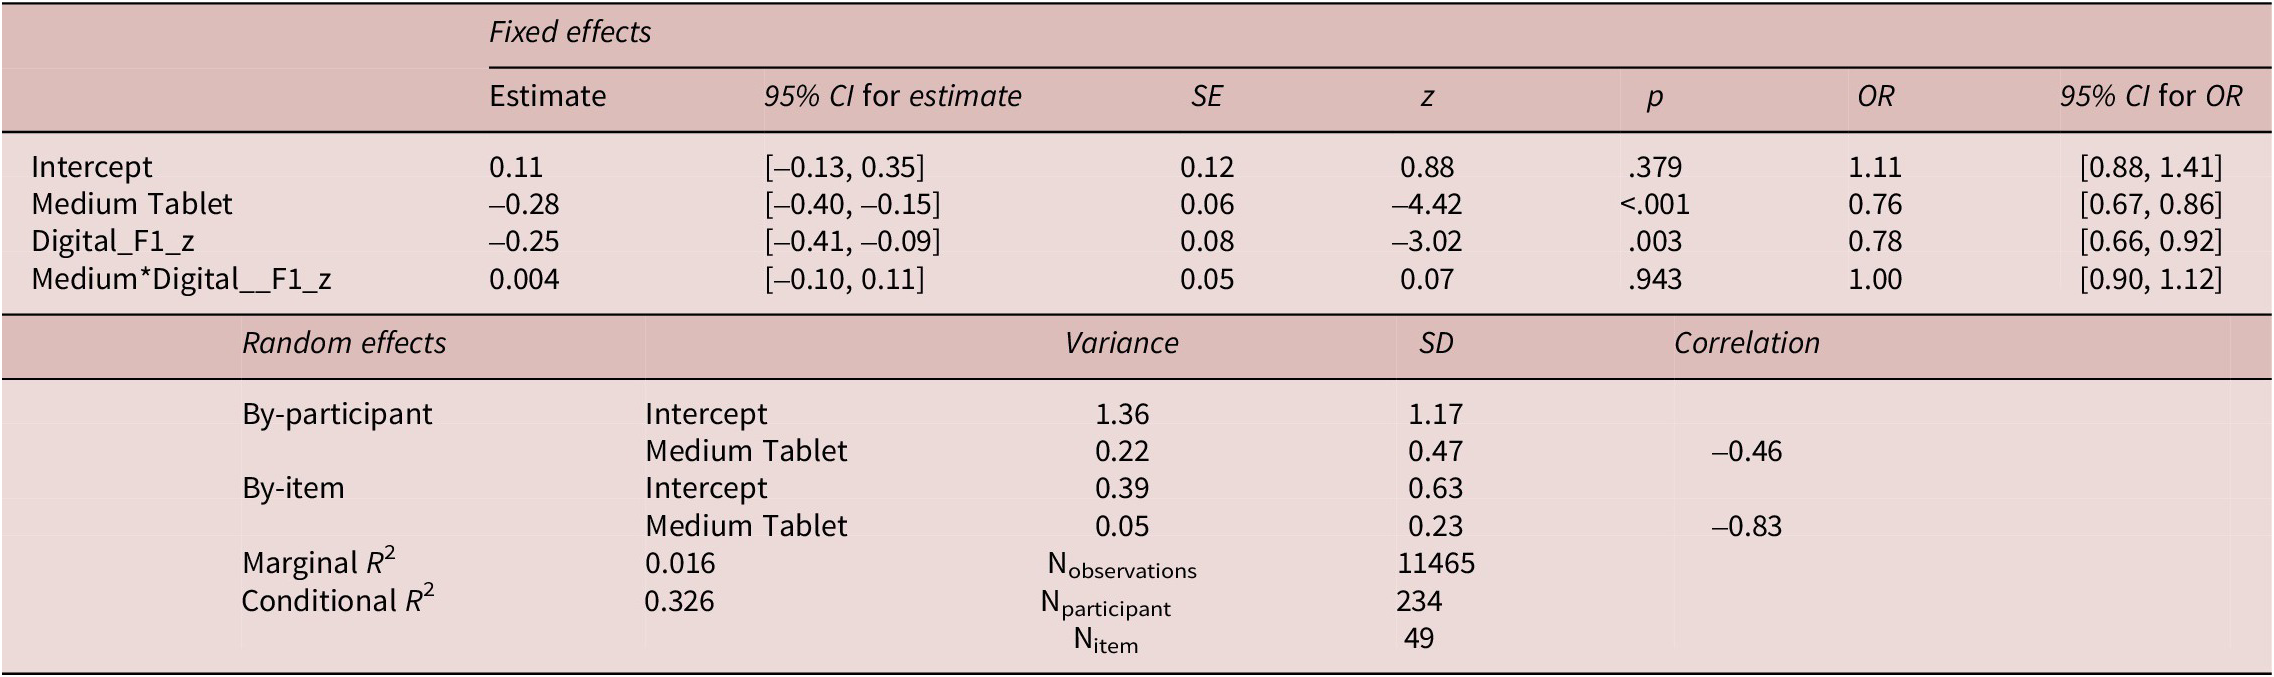
Table 6. Long description
The table is organized into fixed effects and random effects. The fixed effects section lists Intercept, Medium Tablet, Digital_F1_z, and Medium times Digital_F1_z. For each, the columns are Estimate, 95 percent confidence interval for estimate, S E, z, p, O R, and 95 percent confidence interval for O R. Intercept has estimate 0.11, confidence interval negative 0.13 to 0.35, S E 0.12, z 0.88, p 0.379, O R 1.11, confidence interval 0.88 to 1.41. Medium Tablet has estimate negative 0.28, confidence interval negative 0.40 to negative 0.15, S E 0.06, z negative 4.42, p less than 0.001, O R 0.76, confidence interval 0.67 to 0.86. Digital_F1_z has estimate negative 0.25, confidence interval negative 0.41 to negative 0.09, S E 0.08, z negative 3.02, p 0.003, O R 0.78, confidence interval 0.66 to 0.92. Medium times Digital_F1_z has estimate 0.004, confidence interval negative 0.10 to 0.11, S E 0.05, z 0.07, p 0.943, O R 1.00, confidence interval 0.90 to 1.12. The random effects section is divided by participant and by item. By participant, Intercept variance is 1.36, S D 1.17; Medium Tablet variance is 0.22, S D 0.47, correlation negative 0.46. By item, Intercept variance is 0.39, S D 0.63; Medium Tablet variance is 0.05, S D 0.23, correlation negative 0.83. Marginal R squared is 0.016, Conditional R squared is 0.326. N observations is 11465, N participant is 234, N item is 49. The table note defines Digital_F1_z as z-scored Factor 1 digital device usage score, and states that although anova open parenthesis close parenthesis indicated this as the best-fitting model, the K S test indicated a significant deviation, p equals 0.045. A random-intercepts-only model showed no deviation, K S test p equals 0.351.
Note: Digital_F1_z = z-scored Factor 1 digital device usage score. Although anova() indicated this as the best-fitting model, the KS test indicated a significant deviation (p = .045). A random-intercepts-only model (Appendix H, Table H2) showed no deviation (KS test: p = .351).
Reading medium × digital device usage: Factor 1 (tablet use and experience).
Note: Higher tablet use and experience scores were associated with lower accuracy; this pattern was observed similarly across both reading media conditions.

Figure 5. Long description
The x-axis is labeled digital device usage, Factor 1, z-scored, spanning from minus 2 to 2. The y-axis is labeled accuracy rate, ranging from 0 to 1. Two lines are plotted: blue for paper and orange for tablet, as indicated by the legend at the right. Both lines show a negative slope, indicating that as digital device usage increases, accuracy rate decreases. The blue line (paper) starts near 0.65 at minus 2 and ends near 0.4 0 at 2. The orange line (tablet) starts near 0.5 8 at minus 2 and ends near 0.35 at 2. Shaded regions around each line represent confidence intervals. At all points, the tablet line is below the paper line, indicating lower accuracy for tablet users across all levels of device usage.
Best-fitting model for reading medium × digital device usage (RQ4): Factor 2
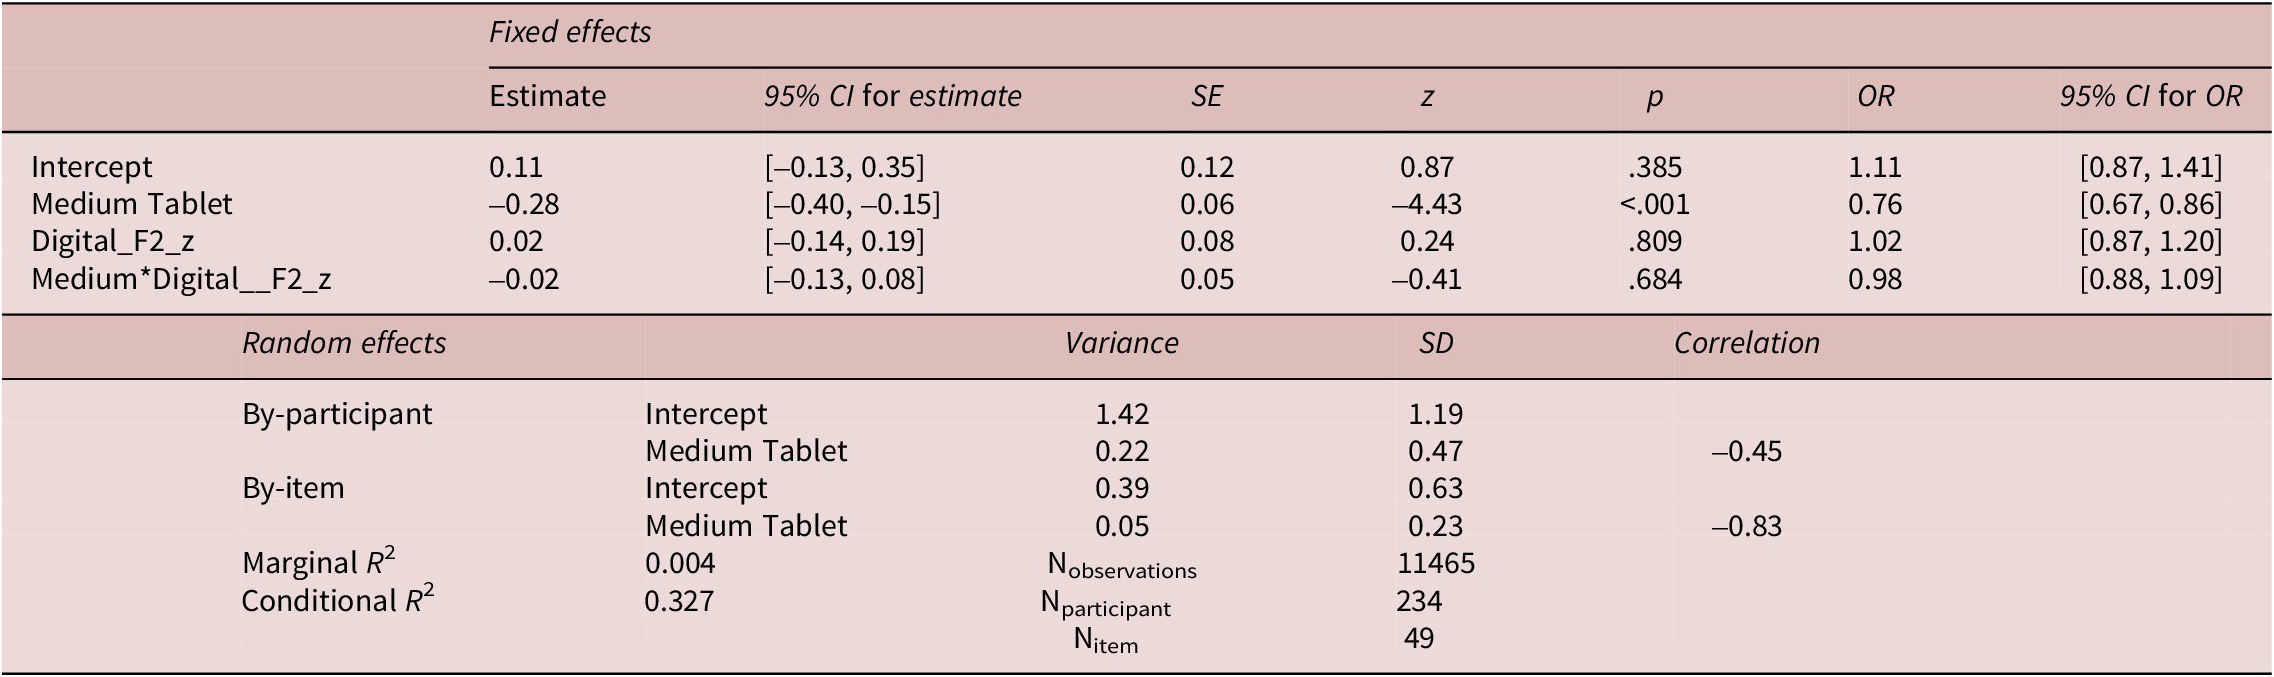
Table 7. Long description
Beginning at the top, the fixed effects section lists Intercept, Medium Tablet, Digital F 2 z, and Medium times Digital F 2 z. The Intercept estimate is 0.11 with a 95 percent confidence interval from minus 0.13 to 0.35, standard error 0.12, z value 0.87, p value 0.385, odds ratio 1.11, and odds ratio confidence interval from 0.87 to 1.41. Medium Tablet has an estimate of minus 0.28, confidence interval from minus 0.40 to minus 0.15, standard error 0.06, z value minus 4.43, p value less than .001, odds ratio 0.76, and odds ratio confidence interval from 0.67 to 0.86. Digital F 2 z has an estimate of 0.02, confidence interval from minus 0.14 to 0.19, standard error 0.08, z value 0.24, p value 0.809, odds ratio 1.02, and odds ratio confidence interval from 0.87 to 1.20. Medium times Digital F 2 z has an estimate of minus 0.02, confidence interval from minus 0.13 to 0.08, standard error 0.05, z value minus 0.41, p value 0.684, odds ratio 0.98, and odds ratio confidence interval from 0.88 to 1.09. The random effects section is divided by participant and by item. By participant, Intercept variance is 1.42, standard deviation 1.19. Medium Tablet variance is 0.22, standard deviation 0.47, correlation minus 0.45. By item, Intercept variance is 0.39, standard deviation 0.63. Medium Tablet variance is 0.05, standard deviation 0.23, correlation minus 0.83. At the bottom, marginal R squared is 0.004, conditional R squared is 0.327. N observations is 11,465, N participant is 234, N item is 49. Digital F 2 z is defined as z-scored Factor 2 digital device usage score. The KS test p value is 0.038, indicating significant deviation, while a random-intercepts-only model showed no deviation with KS test p value 0.342.
Note: Digital_F2_z = z-scored Factor 2 digital device usage score. Although anova() indicated this as the best-fitting model, the KS test indicated a significant deviation (p = .038). A random-intercepts-only model (Appendix H, Table H3) showed no deviation (KS test: p = .342).
Reading medium × digital device usage: Factor 2 (tablet proficiency).
Note: Tablet proficiency showed virtually no effect on comprehension, and accuracy remained nearly flat across both media.

Discussion
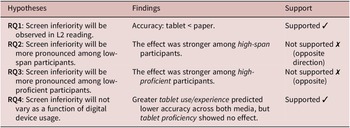
This study examined the impact of reading medium (paper vs. tablet) on adolescent EFL learners’ comprehension accuracy and tested working memory, L2 proficiency, and digital device usage as potential moderators (see Table 8 for a summary).
Summary of results
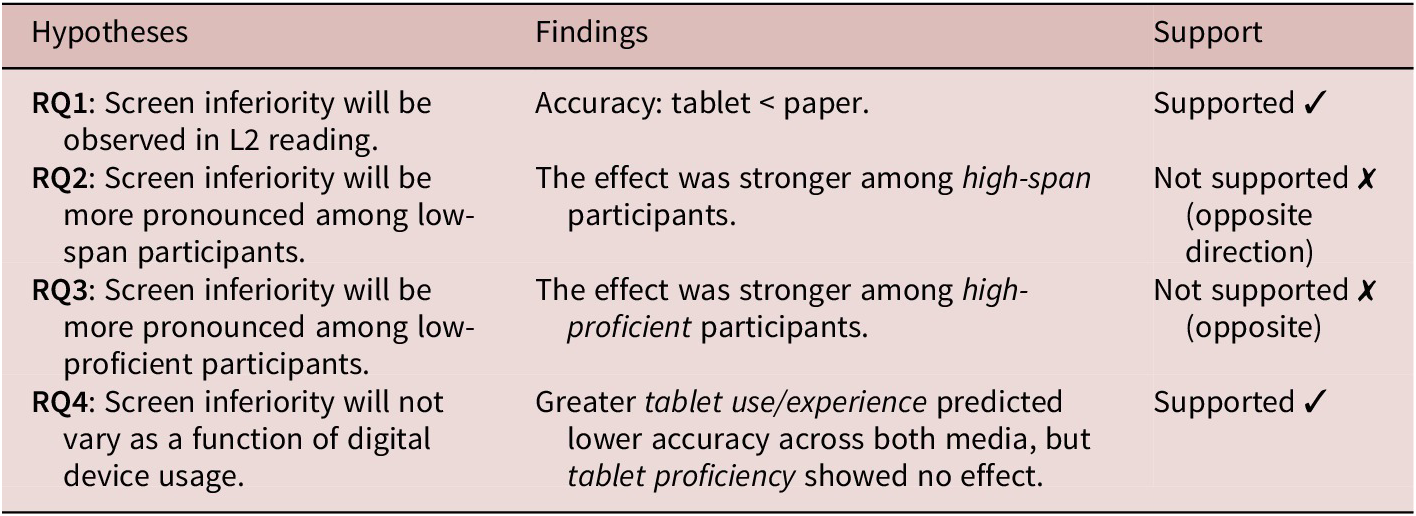
Table 8. Long description
The table has three columns labeled Hypotheses, Findings, and Support. Row one: RQ1 states screen inferiority will be observed in L2 reading; the finding showed that accuracy on tablets was lower than on paper; the hypothesis is marked as supported with a check mark. Row two: RQ2 predicts that screen inferiority will be more pronounced among low-span participants; the finding showed that the effect was stronger among high-span participants; the hypothesis is marked as not supported with an X and a note indicating the opposite direction. Row three: RQ3 predicts that screen inferiority will be more pronounced among low-proficient participants; the finding showed that the effect was stronger among high-proficient participants; the hypothesis is marked as not supported with an X and a note indicating the opposite direction. Row four: RQ4 predicts that screen inferiority will not vary as a function of digital device usage; the finding showed that greater tablet use or experience predicted lower accuracy across both media, but tablet proficiency showed no effect; the hypothesis is marked as supported with a check mark.
Screen inferiority in L2 reading comprehension accuracy
The first research question examined screen inferiority effects by comparing paper and tablet reading. Consistent with our hypothesis, participants performed significantly worse in the tablet condition than in the paper condition. This finding aligns with a substantial body of research documenting screen inferiority in L1 reading comprehension (Clinton, Reference Clinton2019; Delgado et al., Reference Delgado, Vargas, Ackerman and Salmerón2018; Kong et al., Reference Kong, Seo and Zhai2018) and extends this pattern to young L2 learners.
Several mechanisms may account for the lower comprehension accuracy observed in the tablet condition. One explanation is the shallowing hypothesis, which proposes that frequent interactions with digital environments encourage surface-level processing strategies (Annisette & Lafreniere, Reference Annisette and Lafreniere2017). Readers accustomed to rapidly browsing digital content may be more likely to skim or scan texts rather than construct detailed mental representations (Singer & Alexander, Reference Singer and Alexander2017). Younger learners, who are often exposed to digital devices from an early age before fully developing their reading skills, may be particularly susceptible to such effects. The present findings therefore suggest that screen inferiority in L2 reading may occur not only among adult learners as documented elsewhere in the literature (e.g., Chinese EFL college students; Yu et al., Reference Yu, Zhou, Yang and Hu2022) but also among younger learners.
Features of digital reading environments may also contribute to screen inferiority. Unlike printed texts, which provide stable spatial cues, digital formats often require scrolling or zooming, which can disrupt readers’ spatial representation of the text and make it more difficult to relocate previously read information (Støle et al., Reference Støle, Mangen and Schwippert2020). Supporting this view, studies that removed scrolling have sometimes reported no significant medium differences (Chen et al., Reference Chen, Cheng, Chang, Zheng and Huang2014; also Clinton-Lisell & Litzinger, Reference Clinton-Lisell and Litzinger2026, for a meta-analysis). In addition, evidence from questionnaire data (Yang & Hu, Reference Yang and Hu2024) and eye-tracking research (e.g., Jeong & Gweon, Reference Jeong and Gweon2021) suggests that digital reading may impose additional extraneous cognitive load, making the construction and integration of text meaning more demanding.
The moderating role of working memory
The second research question examined whether working memory moderated the relationship between reading medium and comprehension. As expected, higher working memory capacity, even when measured with an L1 reading span task, predicted better overall L2 reading comprehension. This finding is consistent with previous meta-analytic evidence showing a positive association between working memory and L2 reading performance (In’nami et al., Reference In’nami, Hijikata and Koizumi2022; Shin, Reference Shin2020). Contrary to our initial hypothesis, however, the screen inferiority effect increased as working memory capacity increased. High-span readers showed a clearer advantage in the paper condition than in the tablet condition, whereas the difference between media was smaller among low-span readers.
One possible explanation relates to text difficulty. In the present study, comprehension accuracy averaged around 50%, suggesting that the texts were relatively demanding for the target adolescent L2 readers. Under such conditions, even high-span readers may need to allocate substantial cognitive resources to lower-level processes such as lexical access and syntactic parsing. When additional digital-specific demands—such as scrolling or reduced spatial stability—are introduced, these cumulative processing costs may further reduce the resources available for higher-level integrative processing. As a result, high-span readers may benefit more from the stable spatial cues provided by paper, whereas these advantages may be diminished in the tablet condition. Low-span readers, by contrast, may already operate near their capacity limits regardless of reading medium, leaving less room for medium-related differences to emerge.
Another possible explanation relates to differences in reading behavior across media. Jian (Reference Jian2022) reported that readers of digital texts engaged in significantly less rereading than readers in the print condition, suggesting lower allocation of cognitive resources during comprehension. Because revisiting earlier parts of a text supports integration of textual information, reduced rereading may mean that even high-span readers do not fully leverage their cognitive resources in digital environments, resulting in lower comprehension accuracy compared to paper.
Future research may examine whether medium effects vary across texts of different difficulty levels and how text difficulty interacts with working memory capacity. In addition, incorporating multiple working memory measures, including spatial working memory tasks (e.g., symmetry span; Kane et al., Reference Kane, Hambrick, Tuholski, Wilhelm, Payne and Engle2004), may provide a more comprehensive understanding of how different working memory components contribute to screen inferiority effects. For example, Tüchler and Cain (Reference Tüchler and Cain2025) found that spatial working memory was positively associated with readers’ ability to locate information in text and that location recall was significantly poorer in digital than in print formats. Such approaches may clarify the roles of both verbal and non-verbal working memory in screen inferiority.
The moderating role of L2 proficiency
The third research question examined whether L2 proficiency moderated the relationship between reading medium and comprehension accuracy. As expected, higher proficiency predicted better comprehension performance overall. However, similar to the pattern observed for working memory, the difference between paper and tablet reading increased as proficiency increased. We initially hypothesized that high-proficiency learners would show a smaller paper–tablet gap, assuming that their more automated lower-level processes and effective strategy use would support comprehension across media. Contrary to this prediction, however, the gap increased with proficiency, and the fixed effect alone accounted for 16% of the variance.
This finding partly aligns with that of Støle et al. (Reference Støle, Mangen and Schwippert2020). They reported screen inferiority across all proficiency groups among Norwegian primary school students, with the largest effects among high-performing readers. The authors suggested that skilled readers are more likely to engage in higher-order comprehension processes such as inference generation, which may be particularly vulnerable to disruptions introduced by digital environments. Similarly, high-proficiency learners in the present study may have benefited more from paper reading, which may better support deep reading. With well-integrated lexical representations, these learners are more capable of higher-order inferential processing (Perfetti, Reference Perfetti, Segers and van den Broek2017). However, such higher-order processes may be particularly vulnerable in digital reading environments (Park & Lee, Reference Park and Lee2021). Supporting this interpretation, Park and Lee (Reference Park and Lee2021) found that Korean elementary EFL learners recalled more information in the print condition than in the tablet condition, suggesting that deeper comprehension processes may be less effectively supported on screens. In contrast, low-proficiency learners, who primarily succeed at literal comprehension, may be less sensitive to medium effects. A floor effect may also contribute to the smaller differences between media among low-proficiency learners.
Another possible explanation is that reading strategies developed by proficient learners may transfer more effectively to paper than to digital environments. Because strategy use was not directly measured in this study, this interpretation remains tentative. However, Yu et al. (Reference Yu, Zhou, Yang and Hu2022) reported that learners used global, problem-solving, and support strategies more effectively on paper than on tablets. For instance, global strategies such as previewing a text to gain an overall sense may be more difficult to apply on small screens. Alternatively, more proficient readers may exhibit greater overconfidence when reading on screens (metacognitive deficit hypothesis; Delgado & Salmerón, Reference Delgado and Salmerón2021), potentially leading to reduced strategy use and poorer comprehension. Future research may compare strategy use across media and proficiency levels (e.g., whether high-proficiency learners apply strategies effectively in print but less so on tablets, while low-proficiency learners use them less effectively in both media).
The role of digital device usage
The final research question examined whether digital device usage influenced comprehension across reading media. Greater tablet use and experience were associated with lower comprehension accuracy across both paper and tablet conditions, whereas tablet proficiency showed no significant effect.
This pattern is consistent with Delgado et al.’s (Reference Delgado, Vargas, Ackerman and Salmerón2018) meta-analysis, which suggested that increased exposure to digital devices does not necessarily improve reading comprehension and may even contribute to less effective reading habits. One possible explanation is the shallowing hypothesis, which proposes that frequent engagement with digital environments encourages surface-level engagement rather than sustained attention and deep comprehension (Annisette & Lafreniere, Reference Annisette and Lafreniere2017; Lauterman & Ackerman, Reference Lauterman and Ackerman2014). Because digital interactions often involve browsing, scrolling, and rapidly switching between information sources, readers may become accustomed to scanning texts rather than constructing detailed mental representations. Such processing habits may transfer not only to digital reading but also to paper-based reading tasks, potentially reducing readers’ ability to engage in deeper integrative comprehension across reading environments.
At the same time, this finding contrasts with some previous studies suggesting that familiarity with digital tools can facilitate digital reading. For example, Chen et al. (Reference Chen, Cheng, Chang, Zheng and Huang2014) reported that university students with greater tablet familiarity performed better on summarization tasks. One possible explanation for this discrepancy concerns age and patterns of device use. Younger learners’ digital device use is often associated with entertainment activities such as social media or video consumption rather than academic reading. Without explicit guidance on how to use digital devices for learning, frequent device use may reinforce superficial processing habits rather than support the development of effective reading strategies.
Pedagogical implications
The findings of the present study have several pedagogical implications. First, the interaction effects observed in this study suggest that high-performing learners may not automatically benefit from digital reading environments. Even students with strong working memory capacity or high L2 proficiency showed reduced advantages when reading on tablets. These findings suggest that educators should provide explicit instruction on effective cognitive and metacognitive screen-based reading strategies, such as active annotation, self-questioning, and strategic rereading, to promote deeper processing. External spatial mapping (e.g., mind maps or semantic mapping) may also help compensate for the lack of stable spatial cues in digital environments. Moreover, digital reading environments may benefit from interface design improvements that reduce distractions, such as pagelike layouts and blocking notifications during concentrated reading. Critically, although digital devices are increasingly integrated into educational settings, careful guidance on the use of tablets among young learners is needed, and paper reading may still offer advantages for deeper comprehension.
Limitations and future research
Despite the contributions of this study, several limitations should be acknowledged. First, the study did not collect behavioral measures such as scrolling frequency, zooming activity, or distraction-related data. Future research could incorporate interaction logs to better understand the mechanisms underlying screen inferiority. Second, although the comprehension tests were time-limited, actual reading time was not recorded. Recording reading time would help determine whether lower performance in digital conditions reflects speed–accuracy trade-offs or longer but less effective reading processes. Third, the comprehension tests relied exclusively on multiple-choice questions without an “I don’t know” option, which may have increased guessing. Future studies could incorporate this option or include open-ended tasks (e.g., summarization or short-answer responses) to better capture comprehension processes. Fourth, comprehension accuracy was not differentiated between literal and inferential items. Because inferential comprehension places greater demands on cognitive resources, it may interact more strongly with learner-related variables and reading medium. In addition, features of the working memory task—such as the type of task used, whether it is administered in the L1 or L2, and how performance is scored—could be systematically varied to better understand the moderating role of working memory, as these characteristics can influence the relationship between L2 reading and working memory (e.g., Shin, Reference Shin2020). Similarly, more detailed measures of digital reading habits may clarify whether familiarity with digital reading itself, rather than general device use, predicts better digital reading outcomes. Future research could also examine different age groups and interactive digital features (e.g., hyperlinks or annotations) to better understand how developmental stages and digital presentation formats influence L2 reading comprehension.
Conclusion
This study examined whether reading on a tablet leads to lower reading accuracy than reading on paper and whether individual differences in working memory, L2 proficiency, and digital device usage moderate this relationship. The results revealed a screen inferiority effect among Korean adolescent EFL learners. Moreover, the effect was more pronounced with increasing working memory capacity and L2 proficiency, whereas digital device usage did not moderate the relationship between reading medium and comprehension. These findings suggest that explicit guidance for reading on digital devices and pedagogical support that promotes deeper digital reading may be necessary even for high-performing readers. Future research examining diverse learner characteristics and digital reading environments may further clarify the mechanisms underlying L2 digital reading.
Supplementary material
The supplementary material for this article can be found at http://doi.org/10.1017/S0272263126101752.
Data availability statement
The experiment in this article earned Open Materials badges for transparent practices. The materials are available at: https://osf.io/t4732/.
Acknowledgments
We are grateful to Dr. Kira Gor and Dr. Bronson Hui for their insightful feedback on earlier versions of this work, particularly during the first author’s qualifying paper proposal and defense. We also thank the three anonymous reviewers and the handling editor, Dr. Luke Plonsky, for their valuable comments. We further appreciate the feedback received at the Second Language Research Forum 2025. Finally, we thank the students who generously participated in this study.
Competing interests
The authors declare none.


 Open access

