





1. Introduction
Turbulent combustion is an inherently complex flow problem, coupled with substantial heat release and inter-diffusion of a large number of species generated by a complex network of chemical reactions. A general classification of turbulent combustion is based on the ratio of the turbulent to chemical time scales. When the chemistry is slow, it occurs in a distributed manner throughout a large portion of the flow as in tubular reactors employed in the chemical processing industry. In applications associated with power generation, furnaces, boilers and propulsion, the chemistry is rapid, and occurs in relatively thin layers, or flames, embedded within a three-dimensional turbulent flow. The turbulent eddies advect and distort the flame, potentially altering its internal structure, whilst the gas expansion generated by the heat released by the chemical reactions affects the surrounding flow field. Studying these highly nonlinear coupled processes, forms a fundamental challenge in combustion theory. Progress has therefore relied primarily on numerical simulations guided by empiricism and physical reasoning. A regime of turbulent combustion that can be addressed more systematically is the fast chemistry limit, namely when the chemistry is assumed rapid compared with all of the turbulence.
In premixed systems, the burning may be characterized by the mean speed with which the flame propagates into the fresh turbulent mixture, or the turbulent flame speed. While its practical importance is evident, equally important is to understand the key mechanisms responsible for the topological changes of the flame surface that occur as a result of the turbulence, and identify pertinent parameters that characterize these changes. Additional complexities that affect the propagation of turbulent flames result from intrinsic combustion instabilities, which are known to distort the flame even under laminar conditions. The most prominent one is the hydrodynamic, or Darrieus–Landau (DL) instability, which arises by virtue of thermal-expansion-induced velocities and is thus ubiquitous to all premixed flames. The objective of this work is to explore fundamental aspects of premixed flames in homogeneous isotropic turbulent flows, examine the mechanisms governing flame–turbulence interactions, and identify the impact of the DL instability on the propagation.
Our study is based on the hydrodynamic theory of premixed flames, derived systematically using a multi-scale approach that assumes that the flame thickness is much smaller than all other fluidynamical length scales (Matalon & Matkowsky Reference Matalon and Matkowsky1982). The flame is thus confined to a surface that separates the fresh mixture from the combustion products, and propagates relative to the incoming flow at a speed determined by the thermo-chemical properties of the mixture, as well as the diffusion and reaction processes taking place within the thin flame zone. The entire formulation, which has been cast in coordinate-free form, lends itself to a hydrodynamic free-boundary problem (Matalon & Matkowsky Reference Matalon and Matkowsky1983), where the flow on either side of the flame front must be determined from the Navier–Stokes equations with different densities. The combustion processes are characterized by two lumped parameters: the unburned-to-burned density ratio or thermal expansion, which depends on the heat released by the chemical reactions, and the Markstein length, which is a parameter on the order of the flame thickness that depends on the state and physico-chemical properties of the combustible mixture. The present investigation is the first that addresses the propagation of turbulent flames in three-dimensional turbulent flows, within the context of the hydrodynamic theory. Previous investigations have been limited to two-dimensional flows, which evidently lack important features of turbulence (Creta & Matalon Reference Creta and Matalon2011a; Fogla, Creta & Matalon Reference Fogla, Creta and Matalon2015, Reference Fogla, Creta and Matalon2017). Despite this limitation, the acquired results from these studies captured complex topological configurations, including folding and pinching of surface elements, and creation of pockets of unburned gas, all of which are commonly observed in laboratory flames. These studies also instigated the development of a hybrid Navier–Stokes/level-set methodology to address the embedding of a curve (representing the flame) in a two-dimensional turbulent-like flow, which has been extended in the present work to the propagation of flame surfaces in three-dimensional turbulent flow fields.
Although direct numerical simulations (DNS) of the complete three-dimensional governing equations (albeit with simplified chemistry) have been used in recent years in turbulent combustion studies, the high computational cost involved limits the scope of such studies (Rutland & Cant Reference Rutland and Cant1994; Trouvé & Poinsot Reference Trouvé and Poinsot1994; Bell, Day & Grcar Reference Bell, Day and Grcar2002; Aspden Reference Aspden2008; Poludnenko & Oran Reference Poludnenko and Oran2010, Reference Poludnenko and Oran2011; Chen Reference Chen2011; Hamlington, Poludnenko & Oran Reference Hamlington, Poludnenko and Oran2011; Uranakara et al. Reference Uranakara, Chaudhuri, Dave, Arias and Im2016; Manias et al. Reference Manias, Tingas, Minamoto and Im2019; Klein et al. Reference Klein, Herbert, Kosaka, Böhm, Dreizler, Chakraborty, Papapostolou, Im and Hasslberger2020); the investigations are typically restricted to small domains and/or short time intervals, and focus on a particular set of conditions associated with a specific mixture. The approach proposed here is computationally affordable, and thus permits examining the morphological changes of the flame surface, the propagation speed of the turbulent flame, and the impact of the flame on the turbulent flow, while varying the level of turbulence from low to moderate values and adjusting the other parameters to represent mixtures of various properties. Moreover, the model makes transparent the physical interactions occurring between the flame and the fluid flow. Quantities related to the flame surface, such as speed, curvature, strain, degree of wrinkling and burning rates, are determined unambiguously. This marks a clear advantage over simulations that, similar to experiments, rely on an arbitrarily selected iso-surface of temperature or concentration to represent the flame surface, an approach that may introduce ambiguity in the reporting combustion characteristics. Finally, unlike other common strategies in turbulence modelling, the current approach is based on physical first principles, free of ad hoc closure assumptions and/or adjusting parameters.
In the simulations reported below, we address the complex dynamics that result from the interaction of a premixed flame with a turbulent flow, and examine the ramifications of the flow on the flame and the reciprocal effects on the flow, while segregating the influences of the DL instability on the propagation. In a laminar environment, the DL instability can be recognized visually or by tracing the distribution of the local flame curvature. Identifying the instability in a turbulent environment is not as straightforward, because fluctuations of the flame surface resulting from the turbulence are interlaced with disturbances caused by gas expansion, making the distinction difficult even at relatively low intensities. A number of experimental studies (Paul & Bray Reference Paul and Bray1996; Kobayashi, Kawabata & Maruta Reference Kobayashi, Kawabata and Maruta1998; Savarianandam & Lawn Reference Savarianandam and Lawn2006; Troiani, Creta & Matalon Reference Troiani, Creta and Matalon2015; Bauwens, Bergthorson & Dorofeev Reference Bauwens, Bergthorson and Dorofeev2017) and simulations (Akkerman & Bychkov Reference Akkerman and Bychkov2003; Creta, Fogla & Matalon Reference Creta, Fogla and Matalon2011; Creta et al. Reference Creta, Lamioni, Lapenna and Troiani2016; Fogla et al. Reference Fogla, Creta and Matalon2015, Reference Fogla, Creta and Matalon2017; Yu, Bai & Bychkov Reference Yu, Bai and Bychkov2015; Lapenna et al. Reference Lapenna, Lamioni, Troiani and Creta2019) have provided insight on the effect of the DL instability on turbulent flames. More recent studies including DNS for Bunsen flames (Klein, Alwazzan & Chakraborty Reference Klein, Alwazzan and Chakraborty2018; Lapenna et al. Reference Lapenna, Lamioni, Troiani and Creta2019, Reference Lapenna, Troiani, Lamioni and Creta2021; Zhang et al. Reference Zhang, Patyal, Huang and Matalon2019; Rasool, Chakraborty & Klein Reference Rasool, Chakraborty and Klein2021) have shown an interplay between the underlying turbulent field and the flame region under different pressures and Lewis number conditions, highlighting the role that DL instability plays in modifying flame topologies, surface curvature, impact on flame stretch and consumption speed. We extend this work with a systematic parametric investigation of the impact of the DL instability on freely propagating premixed flames in three-dimensional turbulent flows and the resulting modification of the induced flow. The effects of flow on the flame that will be addressed consist of the topological changes associated with flame displacement and curvature, the extent of surface wrinkling and folding of the flame surface, and the overall flame brush thickness. Aspects associated with the effect of the flame on the flow include enstrophy production/destruction by vortex stretching, dilatation and baroclinic torque, and scalar gradient creation/dissipation by gas expansion. Although these issues have been addressed previously in a number of simulations (Ashurst, Peters & Smooke Reference Ashurst, Peters and Smooke1987b; Swaminathan & Grout Reference Swaminathan and Grout2006; Hamlington et al. Reference Hamlington, Poludnenko and Oran2011; Chakraborty Reference Chakraborty2014), the present results examine the trend associated with increasing the turbulence level from low to moderate values, and the distinction in flame–turbulence interactions when the DL instability is effective or inoperative.
2. Formulation
In this section, we present the mathematical formulation of the hydrodynamic model and briefly describe the numerical methodology used to simulate the flame propagation in a turbulent flow.
2.1. Hydrodynamic model
The hydrodynamic model is based on an analysis that exploits the difference of scales between the dimension characterizing the flame size, or the flow field  $L$, and the representative flame thickness, or diffusion length $l_{f}$ (Matalon & Matkowsky Reference Matalon and Matkowsky1982; Matalon, Cui & Bechtold Reference Matalon, Cui and Bechtold2003). The flame region consisting of the preheat and reaction zones is typically thin compared to the hydrodynamic length, such that $\delta \equiv l_f/L \ll 1$. Viewed on the hydrodynamical scale, the flame can therefore be treated as a surface separating the cold fresh mixture from hot burned products. Let the flame front be described by a function $\psi (\boldsymbol {x},t)=0$, where $\psi <0$ identifies the unburned gas and $\psi >0$ the burned gas regions. Each point on this surface propagates relative to the incoming unburned gas at a speed $S_f \equiv - V_{f} + \boldsymbol {v^{*}} \boldsymbol {\cdot } \boldsymbol {n}$, where $\boldsymbol {v}$ is the gas velocity, with the superscript $*$ indicating conditions on the unburned side of the flame surface, $\boldsymbol {n}$ is a unit normal to the surface pointing towards the burned gas, and $V_{f}$ is the propagation speed measured relative to a fixed coordinate system. Expressed as functions of the flame front,
 \begin{equation} \boldsymbol{n} = \frac{\boldsymbol{\nabla} \psi }{\lvert {\boldsymbol{\nabla} \psi} \rvert }, \quad V_{{f}} ={-} \frac{1 }{\lvert {\boldsymbol{\nabla} \psi} \rvert}\,\frac{\partial \psi }{\partial t} , \end{equation}
where  $t$ is the time.
The flow on either side of the flame surface is governed by the Navier–Stokes equations, with the density given by
 \begin{equation} \rho = \begin{cases} \rho_u, & \text{for} \ \psi(\boldsymbol{x},t) < 0 ,\\ \rho_b, & \text{for} \ \psi(\boldsymbol{x},t) > 0, \end{cases} \end{equation}
where the subscripts  $u$ and $b$ denote unburned and burned values, respectively. Conservation of mass and momentum across the flame surface is enforced through the Rankine–Hugoniot jump relations
 \begin{equation} \left. \begin{gathered} {}[\![ \rho (\boldsymbol{v} \boldsymbol{\cdot} \boldsymbol{n} - V_{{f}}) ]\!] = 0, \\ [\![ \boldsymbol{n} \times (\boldsymbol{v} \times \boldsymbol{n}) ]\!] = 0, \\ [\![ p + \rho (\boldsymbol{v} \boldsymbol{\cdot} \boldsymbol{n}) (\boldsymbol{v}\boldsymbol{\cdot} \boldsymbol{n} - V_{{f}}) ]\!] = 0, \end{gathered} \right\} \end{equation}
where  $[\![ \chi ]\!]$ denotes the jump in the quantity $\chi$, namely the difference between its values at $\psi = 0^{+}$ and $\psi = 0^{-}$.
An expression for the flame speed  $S_{f}$ is obtained by resolving the internal flame structure on the diffusion length scale $l_{f}$. For a two-reactant (fuel and oxidizer) mixture undergoing a chemical reaction modelled by an overall single step with a large activation energy, it is given by
 \begin{equation} S_f = S_L - \mathcal{L} \, \mathbb{K}, \end{equation}
where  $S_L$ is the laminar flame speed and $\mathbb {K}$ is the flame stretch rate, which measures the rate of distortion of the flame surface due to its motion and the non-uniform flow into which it propagates. Flame stretch is given by
 \begin{equation} \mathbb{K} ={-} V_{f} \, \kappa - \boldsymbol{n} \boldsymbol{\cdot} \boldsymbol{\nabla} \times \left(\boldsymbol{v} \times \boldsymbol{n} \right) \ \overset{\rm or}{=} \ - V_{f} \, \kappa + \boldsymbol{\boldsymbol{\nabla}}_{s} \boldsymbol{\cdot} {\boldsymbol v}_{s}, \end{equation}
where  ${\boldsymbol v}_{s}$ is the component of the velocity vector tangent to the flame surface, and $\boldsymbol {\nabla }_{s}$ the surface gradient (Matalon Reference Matalon1983). The first term in these expressions corresponds to surface dilatation resulting from the motion of the flame whose local (mean) curvature is $\kappa = - \boldsymbol {\nabla } \boldsymbol {\cdot } \boldsymbol {n}$, and the second term corresponds to surface extension due to the velocity gradient along the flame surface. Since ${\boldsymbol v}_{s}$ is continuous across the flame, the stretch rate is defined uniquely and can be evaluated on either side of the flame surface. Flame stretch may also be expressed as a combination of curvature and hydrodynamic strain, namely in the form $\mathbb {K} = S_{L} \kappa + K_{S}$ where $K_{S} = -\boldsymbol {n} \boldsymbol {\cdot } \boldsymbol {S} \boldsymbol {\cdot } \boldsymbol {n}$, with $\boldsymbol {S}$ the rate of strain tensor, provided that the constraint $\boldsymbol {\nabla } \boldsymbol {\cdot } \boldsymbol {v} = 0$ is applied when evaluating $\mathbb {K}$, as appropriate for the hydrodynamic model. Otherwise, the definition of stretch is ambiguous and depends on the location selected to represent the flame surface within the flow field. The dependence of the flame speed on the properties of the combustion mixture is captured by the Markstein length $\mathcal {L}$, which is proportional to the flame thickness $l_f$ and depends on the composition and equivalence ratio of the mixture, the reaction orders of the chemical reaction rate, the diffusive properties of the reactants, and the overall heat release (Matalon et al. Reference Matalon, Cui and Bechtold2003).
2.2. Numerical methodology
Numerical implementation of the hydrodynamic model is carried out using a hybrid Navier–Stokes/level-set methodology that generalizes the earlier approach implemented successfully in laminar and turbulent two-dimensional flows, where the flame is effectively a curve in the plane of motion (Creta & Matalon Reference Creta and Matalon2011a,Reference Creta and Matalonb; Fogla et al. Reference Fogla, Creta and Matalon2015). Its extension to three-dimensional flows, where the flame front is a two-dimensional surface, was initiated by Patyal & Matalon (Reference Patyal and Matalon2018) and used to simulate flame propagation in a laminar setting. It necessitated the development of new algorithms, focusing on the representation of the flame in intrinsic surface coordinates, and on accurate calculation of interfacial quantities such as curvature, strain, local gas velocity and stretch. A brief overview of the methodology and its application to turbulent flows is given below.
The piecewise-constant function (2.2) representing the density across the flame is smeared over a few computational cells and expressed in the form
 \begin{equation} \rho = \rho_u - \tfrac{1}{2}(\rho_u - \rho_b) \left[1 + \text{tanh}\, (\psi/h) \right], \end{equation}
where  $h$ is a measure of the ‘numerical flame thickness’ and controls the number of cells needed to transition between either side of the flame, taken here as twice the cell size. Mass conservation across the flame is satisfied by introducing a source term in the continuity equation, namely
 \begin{equation} \boldsymbol{\nabla} \boldsymbol{\cdot} \boldsymbol{v} = \rho_u S_f\,\dfrac{\partial}{\partial n} \left(\dfrac{1}{\rho}\right) , \end{equation}
where  ${\partial / \partial n}$ is the directional derivative along the coordinate $n$ normal to the flame surface (Rastigejev & Matalon Reference Rastigejev and Matalon2006b). Equation (2.7) confirms that the divergence-free condition is satisfied away from the flame surface, and its continuous representation across the flame allows for the flow field to be determined by solving the momentum equation
 \begin{equation} \rho \, \frac{{\rm D\ {\boldsymbol v}} }{{\rm D} t} ={-}\boldsymbol{\nabla} p + \mu {\nabla}^{2} {\boldsymbol v} \end{equation}
over the entire computational domain; here,  $\textrm {D}/ \textrm {D} t \equiv \partial /\partial t + \boldsymbol {v} \boldsymbol {\cdot } \boldsymbol {\nabla }$ is the convective derivative, $p$ is the pressure, and $\mu$ is the viscosity of the mixture, assumed constant. The instantaneous shape and location of the flame surface are described by the evolution equation
 \begin{equation} \frac{\partial \psi }{\partial t} + V_f \, \lvert {\boldsymbol{\nabla} \psi} \rvert = 0, \end{equation}
where  $V_f$ is calculated from the definition of the flame speed and its dependence on flame stretch given by (2.4). As $h \to 0$, the distribution (2.6) approaches the piecewise density function (2.2), and when integrating (2.7) and (2.8) across the flame front, the Rankine–Hugoniot relations are recovered. Thus although the variations inside the thin numerical flame zone are not physically resolved, the variations outside the flame zone are accurate in an asymptotic sense.
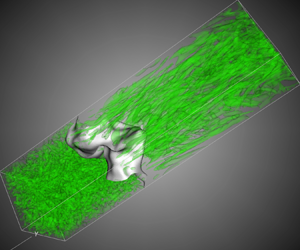
The nonlinear problem (2.6)–(2.9) involves a feedback between the Navier–Stokes solver and the level-set algorithm, with the source term in (2.7) representing the link between these two modules. The Navier–Stokes equations are solved using a parallel low-Mach-number variable-density solver. The algorithms that involve the embedding of the flame surface into the flow field and its evolution in time follow the methodology of Patyal & Matalon (Reference Patyal and Matalon2018). Since in a turbulent flow the flame has a tendency to fold and form pockets of unburned gas that get consumed separately, as observed in figure 1, the amalgamated surface can no longer be represented by a single-valued function, and a generic representation of the surfaces with disjointed interfaces is required. Details of the surface parametrization, its reconstruction at every time step, and the determination of the interfacial properties needed to describe accurately the evolution of the flame front, are discussed in Patyal & Matalon (Reference Patyal and Matalon2018). Finally, due to the limitation of the model that is valid strictly for weakly-stretched flames, the parametric space of turbulence intensities is restricted by the requirement that the local flame speed  $S_f$ remains positive and above a threshold value during the entire simulation. For each case, any local instances of negative $S_f$ are set to zero, with this cutoff operation tracked and limited to no more than 5 % of the total number of points on the flame surface. The limiting values of Markstein number and turbulence intensity are thus set when this threshold is crossed.
Schematic of the proportional integral derivative (PID) control system used to control the mean flame position and the turbulence intensity and scale. The highly corrugated flame surface shown in grey consists, in addition to the main surface, of small disjoint pockets of unburned gas; the flow field illustrated by vorticity iso-contours is shown in green. The figure is based on a representative simulation with  ${\mathcal {L}} = 0.018 l_f$, thermal expansion $\sigma = 5$, and turbulence intensity $u'/S_L = 1.5$.

2.3. Turbulent flow field
The primary objective of this work is to enhance understanding of flame propagation in a turbulent environment by performing a parametric study of intrinsic combustion properties and system operating conditions. To this end, it is essential to ensure that the computations first reach a statistical steady state before quantities of interest are approximated by averaging over a large number of realizations, or eddy turnover times. The relative simplicity of the hydrodynamic model, as opposed to DNS of the complete governing equations, allows for the estimation of combustion quantities, such as turbulent flame speed or probability distribution of flame properties, by performing an ensemble average over a large number of eddy turnover times to represent accurately the unsteady dynamics. In the present simulations, this was done by choosing a minimum averaging period of 40–60 eddy turnover times spread over at least 600–1000 realizations, after a statistical steady state was achieved.
A realization of homogeneous isotropic turbulence was generated using TuGen (Gilling Reference Gilling2009a,Reference Gillingb), a turbulent field generator based on Mann's method for producing a divergence-free field of synthetic turbulence (Mann Reference Mann1998). To ensure a large number of independent realizations, the turbulent field was simulated on a sufficiently long domain, measuring  $L \times 64 L \times L$. The turbulent fluctuations, which were created with a zero mean, were then superposed with a mean velocity $v_{in}$ and provided as an inflow to the flame propagating towards the flow, in a domain of size $L \times 4 L \times L$ with periodic boundary conditions in the transverse directions and an outflow boundary condition at the top of the domain (see figure 1). The creation of the turbulent fluctuations on a much larger domain was done to ensure that each instantaneous realization of turbulence was not correlated in time such that there was no inherently imposed periodicity to the problem. The turbulent field was verified to be homogeneous, isotropic and divergence-free, with auto- and cross-correlation functions agreeing with theoretical predictions by von Kármán (Reference von Kármán1948). A sample calculation of the one-dimensional turbulent kinetic energy spectrum displayed in figure 2 for a range of integral scales shows that the turbulent field captures the behaviour characteristic of the inertial subrange in fully developed turbulent flows.
Turbulence kinetic energy spectrum as a function of wavenumber  $k$, of pre-generated fields of various turbulence integral scales $\ell /L$, showing the $-5/3$ characteristic slope of the inertial subrange.

To achieve a statistical steady state, two concurrent control systems using a PID-like closed loop control strategy are employed to monitor independently mean flame position and turbulence intensity close to the flame at a user-specified location. This target is set near the flame surface on its unburnt side and away from the inlet to avoid extremely large velocity gradients at the boundary. We avoid conditioning parameters directly on the flame surface as inputs for the PID controller to prevent its destabilization and get a faster convergence. As an example of one of the controllers, to statistically keep the flame at a fixed location along the direction of flow, the mean inflow velocity  $v_{{in}}$ is modulated according to
 \begin{equation} \frac{{\rm d}{v}_{{in}} }{{\rm d}t} ={-}K_p\ e(t) - K_d\,\frac{{\rm d}{e} }{{\rm d} t} , \end{equation}
where  $e(t)$ is the displacement of the instantaneous mean flame position from a user-specified value, with the temporal derivative of the error acting to minimize overshoot. For each controller, the constants $K_p$ and $K_d$ were tuned appropriately, with the constant of the integral term set to zero based on numerical experimentation. For controlling the flame position, constant values $K_p=100$, $K_d=10$ were used, while for the turbulence intensity, these were set to $K_p=2$, $K_d=0.2$. The flow control system is of significant importance when investigating the dependence of flame speed on turbulence intensity and/or integral scale, allowing us to relate flame properties to the local turbulence conditions rather than conditions at the inflow boundary, which, due to decaying turbulence, are generally modified when reaching the flame. It also permits using a relatively smaller domain to study turbulent flame propagation, making a parametric study computationally affordable. A similar control system was used in the DNS study of Bell et al. (Reference Bell, Cheng, Day and Shepherd2007) to maintain and stabilize the flame within the integration domain, but other studies initialized the turbulence in the entire domain, and studied transient evolution of flames in decaying turbulence (Chen & Im Reference Chen and Im2000; Im & Chen Reference Im and Chen2002), or re-energized the system by injecting velocity perturbations at the largest scale of the flow to constantly maintain the mean turbulence intensity (Poludnenko & Oran Reference Poludnenko and Oran2011).
A schematic of the control system is shown in figure 1, where the instantaneous turbulence intensity and mean flow speed were controlled using the strategy described above. The highly corrugated flame surface (in grey), which includes small pockets of unburned gas disjoint from the main surface, is clearly delineated from the background. The turbulent flow field is illustrated by coloured contours (in green) showing vorticity iso-surfaces based on the so-called Q-criterion (discussed below) that enables us to identify specifically regions of greater intensity. Figure 3 shows a test where the target flame position and turbulence intensity in the simulations were specified as  $1.5$ and $1.0$ in units of $L$ and $S_L$, respectively. As observed, the control system is able to provide critical damping for mean flame position in figure 3(a) and turbulence intensity in figure 3(b), thereby allowing a statistical steady state to be reached. The corresponding mean inflow velocity (scaled by the laminar flame speed) shown in figure 3(c), may be referred to properly as the turbulent flame speed $S_T$.
Results of the closed-loop control system based on a representative simulation with  $\sigma = 5$ and $\mathcal {M}^{-1} = 75$. Shown here is the approach in time of (a) the mean flame position to the target position $y = 1.5$, (b) the mean turbulence intensity to two target values $u^{\prime }/S_L = 1.0, 2.0$, and (c) the resulting mean inflow velocity. The asymptote in (c) then corresponds to the turbulent flame speed.

2.4. Dimensionless parameters
When recast in dimensionless form using  $L$,
$L$,  $S_L$, $L/S_L$ and $\rho _u S_L^{2}$ as units of length, velocity, time and pressure, the hydrodynamic model involves three dimensionless parameters: the Markstein number ${\mathcal {M}} = {\mathcal {L}}/L$, the density contrast or thermal expansion parameter $\sigma = \rho _u/\rho _b$, and the Reynolds number ${Re} = L \rho _u S_L / \mu$. The Markstein number ${\mathcal {M}}$ differs from the conventional definition by the factor $l_f/L$ representing the nominal flame thickness, which can be estimated easily for different mixtures as discussed in Fogla et al. (Reference Fogla, Creta and Matalon2015). Typically, the pressure level, the fuel and oxidizer type, the composition of the mixture, the physico-chemical properties of the reactants, and the heat release determine the laminar flame speed $S_L$, the thermal expansion $\sigma$, and the Markstein number $\mathcal {M}$. The pre-generated flow field is characterized by the turbulence intensity $u'/S_L$, defined as the r.m.s. of velocity fluctuation and expressed in units of the laminar flames speed, and the integral length scale $\ell /L$.
In the simulations reported below, the thermal expansion coefficient was chosen as  $\sigma =5$, the turbulence integral scale was chosen as $\ell /L = 0.1$, and a range of flow and mixture conditions were examined, as summarized in table 1. Only mixtures with ${\mathcal {M}} > 0$ were studied, representing those deficient in their heavier component, such as lean hydrocarbon–air or rich hydrogen–air mixtures. The ${{O}}(\delta ^{-1})$ Reynolds number was assumed as ${Re} = 10^{6}$ such that, consistent with the hydrodynamic model, viscous effects add only a small degree of dissipation to an otherwise inviscid flow. All studies were run with a grid resolution of 64 points per unit length $L$. Select cases were also tested for grid independence at 128 and 256 points per unit length, with a noted maximum variation in flame speeds at 3 % and 7 % respectively. Though the range of parameters considered in this work are modest due to a limitation on computational resources, the numerical methodology is easily extendable to large domains over long time intervals with parameters that can be associated with a variety of fuels and/or mixture conditions.
Parametric space spanned by the simulations.

3. Influences of the Darrieus–Landau instability
One of the prominent instabilities in premixed combustion is the hydrodynamic, or Darrieus–Landau (DL) instability. It results from gas expansion caused by the heat released by the chemical reactions, which induces hydrodynamic disturbances that enhance perturbations of the flame front. The DL is a long-wave instability, which can be suppressed in relatively narrow domains when diffusion effects act to stabilize the short wavelength disturbances – namely, in mixtures of sufficiently large positive Markstein number. Accordingly, planar flames are stable when  ${\mathcal {M}} > {\mathcal {M}}_c$, with the critical Markstein number given by
 \begin{equation} {\mathcal{M}}_c = \frac{\sigma -1 }{2{\rm \pi} (3 \sigma -1)} . \end{equation}
For  ${\mathcal {M}} < {\mathcal {M}}_c$, the nonlinear evolution of nominally planar flames leads to cusp-like structures, i.e. conformations with pointed crests intruding into the burned gas, that propagate at a constant speed $U_L > S_L$. With decreasing ${\mathcal {M}}$, i.e. moving away from criticality into the unstable domain, the crests become sharper, pointing further into the burned gas region, and the flames propagate faster. The nonlinear development under laminar conditions has been studied for realistic gas expansion in two- and three-dimensional flows (Rastigejev & Matalon Reference Rastigejev and Matalon2006a; Creta & Matalon Reference Creta and Matalon2011b; Patyal & Matalon Reference Patyal and Matalon2018).
In analogy to this characterization, Creta & Matalon (Reference Creta and Matalon2011a) identified two distinct regimes of flame propagation in turbulent flows; a sub-critical regime, where the DL instability has minimal to no effect on the flame, and its fluctuating surface remains planar on average, and a super-critical regime, where the turbulent flame is affected strongly by the instability and develops frequent cusp-like structures on its surface, reminiscent of the unstable flames under laminar conditions. The sub- and super-critical regimes depend on whether  $\mathcal {M}$ is above/below a critical value, approximately equal to (3.1). Unlike ${\mathcal {M}}_c$, which is obtained from a linear stability analysis that treats the flame as a surface of density discontinuity, the characterization in a turbulent flow is based on simulations with a small non-zero value of the numerical flame thickness, known to slightly underestimate the critical value of $\mathcal {M}$ (Patyal & Matalon Reference Patyal and Matalon2018). Note that the critical Markstein number at which a fluctuating turbulent flame becomes highly corrugated, or unstable, can be different from its laminar counterpart.
In the following, we examine the effects of a turbulent flow field on the flame topology, surface conformation and surface wrinkling. Since the DL instability is primarily a consequence of thermal expansion, the simulations are performed under three different conditions: a non-reacting interface, which is not subjected to the instability; a sub-critical flame, which is inherently stable; and a super-critical flame, where the influence of the instability is notable. The non-reacting interface is simulated by propagating a passive interface in a constant-density turbulent flow with the interface exerting no feedback on the flow field – i.e. with  $\rho = \rho _u$ and the source term in (2.7) set to zero. The simulations of sub- and super-critical flames account fully for gas expansion, and are distinguished primarily by the specified Markstein number. The non-reacting (NR) interface serves to establish a baseline to differentiate between the presence/absence of thermal expansion and the influence, or lack, of the instability.
For convenience, the results reported below are presented in terms of the reciprocal of the Markstein number, such that sub- and super-critical conditions correspond to  ${\mathcal {M}}^{-1}$ below/above criticality; for $\sigma = 5$, the critical value is approximately $25$, slightly larger than ${\mathcal {M}}_c^{-1} = 22$. In the remainder of the paper, the values $\mathcal {M}^{-1} = 22.5$ and $\mathcal {M}^{-1} =75$ were selected to represent sub- and super-critical conditions, respectively.
3.1. Flame topology
Under laminar conditions, the DL instability can be recognized by visual inspection, but this becomes more complicated in a turbulent environment. Since it is easier to visualize these convoluted structures in two dimensions, when the flame surface degenerates to a curve in the plane of motion, we show in figure 4 results of sub- and super-critical flames for varying turbulence intensities  $u^{\prime }/S_L$. Each panel shows a flame brush, which consists of instantaneous snapshots of the flame front superimposed on each other about a mean position that has been modulated by the control system. For low turbulence intensities, the sub-critical flame brush in figure 4(a) remains nearly planar with no preferred orientation towards the unburned or burned gas regions. As the turbulence intensity increases, the flame brush thickens; the flames experience larger fluctuations but remain equally distributed between the unburned and burned sides. For $u'/S_L = 1.8$, the flames no longer bear resemblance to the nearly planar conformations observed at lower values of turbulence intensity, and appear to be controlled by the turbulence. In contrast, the super-critical flame brush in figure 4(b) shows that the flames at low turbulence intensities develop distinct cusp-like structures pointing towards the burned gas region, reminiscent of the DL unstable flames in laminar conditions. These structures appear at first resilient to turbulent fluctuations and preserve their general shape while translating back and forth in the transverse direction. At higher turbulence intensities, the flames lose their characteristic shape and, similar to the sub-critical flames, develop into a flame brush that is dominated primarily by the turbulence with no visible effect of the instability. The distinction between sub- and super-critical flames becomes invisible at higher intensity values. The fluctuating surface gets tangled up by the turbulence and develops folds that often pinch off, forming pockets of unburned gas that burn instantaneously once detached from the main flame surface. The existence of a regime where the DL instability has limited-to-no influence on the turbulent flame has been observed experimentally (Al-Shahrany et al. Reference Al-Shahrany, Bradley, Lawes, Liu and Woolley2006; Bradley et al. Reference Bradley, Lawes, Liu and Mansour2013; Troiani et al. Reference Troiani, Creta and Matalon2015) and in simulations (Boughanem & Trouvé Reference Boughanem and Trouvé1998; Chaudhuri, Akkerman & Law Reference Chaudhuri, Akkerman and Law2011), and will be examined further below. The two-dimensional results shown in figure 4 were presented for ease of illustration; the remainder of the paper pertains to the topology and propagation of flame surfaces in three-dimensional flows.
Instantaneous snapshots of fluctuating flames in a two-dimensional turbulent flow under increasing values of turbulence intensity  $u'/S_L$. The region between the dashed red lines denoted by $\delta _T$, which marks the region where the p.d.f. of the flame position is above a minimal threshold, is a measure of the flame brush thickness. (a) Flame brush for sub-critical conditions ( $\mathcal {M}^{-1} = 22.5$). (b) Flame brush for super-critical conditions ( $\mathcal {M}^{-1} = 75$).

To quantify differences in flame topology, we present in figure 5 the probability distribution function (p.d.f.) of the position of an NR interface and of sub- and super-critical flames, for increasing values of  $u'/S_L$. The mean position $y=1.5$, as determined by the PID controller, is marked by the vertical dashed line; it was selected sufficiently far from the lower boundary of the domain to allow for the induced flow resulting from gas expansion to develop and interact with the flame. The length of the domain was chosen long enough to ensure that the fluctuating flames remain within the domain of integration at all times, and to allow for complete consumption of the pockets of unburned gas that get randomly detached from the flame surface. The p.d.f.s of the NR interface in figure 5(a) are distributed symmetrically about the mean and show no affinity towards one of the two sides. This is to be expected because a passive interface does not have a feedback effect on the surrounding flow field. As the turbulence intensity increases, the p.d.f.s widen, due to larger fluctuations of the interface, while retaining their symmetrical nature. The p.d.f.s of the sub-critical flames, shown in figure 5(b), also display a symmetric distribution about the mean despite the large variation in density across the interface that affects the surrounding flow field. In this regime, the perturbations induced by thermal expansion are damped by diffusion and therefore have no overall effect on the flame topology. Here too, the distribution widens when increasing the turbulence intensity due to enhanced turbulent fluctuations. This behaviour changes drastically for super-critical flames, as seen in figure 5(c), because, despite the stabilizing influences of diffusion, hydrodynamic effects tend to amplify velocity perturbations induced by gas expansion. The asymmetric bimodal p.d.f. with its extended tail towards the burned gas region is a direct consequence of the sharp crests intruding into the burned gas, which is a reminiscent of the DL instability in laminar flames (Patyal & Matalon Reference Patyal and Matalon2018). As the turbulence intensity increases and the flame surface becomes increasingly controlled by the turbulence, the p.d.f.s lose their distinct distribution; they tend towards a symmetric distribution and widen due to the thickening of the flame brush.
Distribution function of the position of a passive (NR) interface and sub- and super-critical flames relative to the mean value  $y=1.5$, at various intensities $u'/S_L$. (a) Non-reacting (NR) interface. (b) Sub-critical flame. (c) Super-critical flame.

The p.d.f. of the local curvature of the flame front can also be used to quantify differences in flame topology, as shown in figure 6 for increasing values of the turbulence intensity. The sub-critical flame exhibits a symmetric distribution about  $\kappa = 0$, indicating that the flame is equally as convex as it is concave, which verifies that it remains planar on average. In contrast, the super-critical flame, which is strongly affected by the DL instability, shows a bias in its p.d.f. It displays a preferential distribution towards larger negative curvatures, corresponding to the sharp crests and creases pointing into the burned gases, and a smaller distribution of positive curvatures, corresponding to the smoother troughs of the flame surface. As the turbulence intensity increases, the distribution begins to widen, encompassing a much larger range of positive and negative curvatures than for a sub-critical flame, and it loses gradually its asymmetric behaviour. Skewed distributions of flame surface curvature towards negative values have been reported previously in numerical simulations (Echekki & Chen Reference Echekki and Chen1996; Treurniet, Nieuwstadt & Boersma Reference Treurniet, Nieuwstadt and Boersma2006), for values $u'/S_L = 2.35- 4.2$. The distinct features of the results displayed in figure 6 are the tendency of the p.d.f. towards a symmetric distribution, as the turbulence intensity increases, and the characterization of the DL influence in terms of a physically measurable Markstein number.
Distribution function of the local curvature of the flame surface for sub- and super-critical conditions at various turbulence intensities  $u'/S_L$. (a) Sub-critical flame. (b) Super-critical flame.

In summary, the distribution of key characteristics of the flame surface, such as local flame displacement and curvature, serves as useful markers to enhance understanding of the interplay between turbulence and the DL instability, particularly at high intensities where it may not be possible to identify visually the topological changes.
3.2. Flame brush thickness
A useful measure quantifying the extent of flame fluctuations is the flame brush thickness  $\delta _T$, defined as the width of the p.d.f. of the flame position, shown schematically in figure 4. The dependence of $\delta _T$ on turbulence intensity for different values of the Markstein number is shown in figure 7. Remarkable differences are observed between sub- and super-critical flames. For sub-critical conditions, the flame brush thickness $\delta _T \rightarrow 0$ when $u'/S_L \to 0$, corresponding to a stable planar flame propagating in a quiescent mixture. For super-critical conditions, the flame brush thickness $\delta _T$ tends to a constant when $u'/S_L \to 0$, corresponding to the amplitude of the DL cusp-like structure, which is the only stable state under such conditions. For given turbulence conditions, the flame brush thickens with increasing ${\mathcal {M}}^{-1}$, because of the deeper intrusion of the cusp-like conformations into the burned gas, consistent with the nonlinear stability results of Patyal & Matalon (Reference Patyal and Matalon2018). In both cases, the flame brush thickness increases monotonically with increasing turbulence level due to the growing fluctuations. Although for low intensities the thickness $\delta _T$ of the super-critical flames is significantly larger than the thickness of a sub-critical flame, the difference diminishes when increasing the turbulence intensity. It may therefore be anticipated that at sufficiently large values of $u'/S_L$, both flames will be controlled by the turbulence, and $\delta _T$ will approach a common value asymptotically, independent of the Markstein number.
The dependence of the flame brush thickness  $\delta _T$ on turbulence intensity $u'/S_L$ for various values of the Markstein number; the value ${\mathcal {M}}^{-1} = 22.5$ corresponds to sub-critical conditions, and all the larger values correspond to super-critical conditions.

3.3. Surface wrinkling
The extent of wrinkling of a flame surface may also be used to differentiate sub- and super-critical conditions, and to understand the changes in the surface morphology resulting from the underlying turbulent flow. It may be measured by plotting the p.d.f. of the components of the unit normal vector  ${\boldsymbol n} = (n_x, n_y, n_z)$, conditioned on the flame surface. Based on the adopted convention, $\boldsymbol n$ points towards the burned gas region, with the flame propagating along the negative $y$-direction. Since periodic boundary conditions have been assumed in the transverse $x$- and $z$-directions, it is sufficient to focus on only one of the transverse components, say $n_x$, with the observations extended easily to $n_z$. Figures 8(a,b) show that both the passive interface and the sub-critical flame exhibit symmetric distributions of $n_x$ with a zero mean, suggestive of a nearly planar surface. With increasing turbulence intensity, the p.d.f. widens due to more frequent fluctuations, but retains its symmetric nature. The similarity between the two confirms that the wrinkling of a sub-critical flame is affected minimally by gas expansion. In contrast, the distribution of $n_x$ for a super-critical flame in figure 8(c) shows a starkly different behaviour, with peaks in both $n_x = {\pm }1$. This distinctive distribution, which results from frequent formation of cusps and creases along the flame surface, weakens at higher turbulence levels.
Distribution of the transverse component  $n_x$ of the unit normal vector, conditioned on the flame surface, for a passive interface and for sub- and super-critical flames at various turbulence intensities $u'/S_L$. (a) Non-reacting interface. (b) Sub-critical. (c) Super-critical.

A more useful measure of the extent of wrinkling is the conditional p.d.f. of the axial component  ${n}_y$ of the normal vector, which is directed along the mean flow direction. Since the cusp-like structure of a super-critical flame has a direct impact on the distribution of $n_y$, we begin by examining the nature of the p.d.f. under laminar conditions. The flame structure resulting from the DL instability, as shown in figure 9(a), has a tent-like conformation, consisting of a narrow rounded crest and wider troughs with ridges or creases formed along its surface. Key components of the flame surface are shown in figures 9(c–e); these include the rounded crest, the surface with the creases removed, and the troughs surfaces where both the crest and creases are removed. Evidently, the p.d.f. of $n_y$ in this case is strictly positive, as seen in figure 9(b). It has a bimodal distribution with peaks resulting from the negatively stretched regions of the flame (the crest and the sharp creases); in their absence, the troughs areas exhibit a distribution with a single peak near $n_y = 1$.
Characterization of the p.d.f. of the axial component of the normal vector  ${n}_y$ conditioned on the flame surface of the super-critical flame (under laminar conditions) shown in (a), with key components of the flame surface shown in (c–e). (a) Flame surface of a supercritical flame under laminar conditions. (b) Probability density function of ${n}_y$. (c) Only crest. (d) No creases. (e) Only troughs.

In figure 10, we show the conditional p.d.f. of  $n_y$ for a super-critical flame under turbulent conditions and contrast it with the corresponding p.d.f.s of a sub-critical flame and an NR interface. Since the tendency of the flame is to propagate into the unburned gas in a direction normal to its surface, a value of ${n}_y < 0$ indicates a scenario in which the flame surface is multi-valued – namely, it has formed folds and/or detached pockets of unburned gas. At low intensities, the p.d.f. of $n_y$ for a passive interface is strictly positive; the peak near one confirms earlier observations that the tendency of the NR interface is to remain nearly planar. Negative values may occur at much higher intensities, due to the intensified turbulence. The p.d.f. of ${n}_y$ for a sub-critical flame shown in figure 10(b) has similar characteristics; despite developing perturbations on its surface due to gas expansion, the flame surface remains nearly planar. As the turbulence intensity increases, the p.d.f. begins to widen and assumes negative values only for intensities larger than $u^{\prime }/S_{L} \approx 1.5$. The situation is markedly different for a super-critical flame, as shown in figure 10(c). For very low intensities, $u^{\prime }/S_{L} = 0.1$ say, the conditional p.d.f. has a bimodal distribution similar to the laminar flame in figure 9(b). As the turbulence intensity increases, multi-valued positions characterized by negative values of $n_y$ become more frequent, which implies that the super-critical flame is more likely to fold and form pockets. This observation is linked directly to the increase in flame surface area and the corresponding increase in propagation speed discussed in the next section. While the current results are limited to $u'/S_L \le 2$, it is anticipated that at higher intensities, the turbulence will overshadow the characteristic structures resulting from the instability, leading to surface topologies that do not differentiate between sub- and super-critical conditions, similar to the one shown in figure 4 for two-dimensional flows.
The distribution of the axial component of the normal vector  ${n}_y$, conditioned on the flame surface, for (a) a passive interface (NR), (b) sub-critical flames, and (c) super-critical flames, at various turbulence intensities $u'/S_L$.

In addition to quantifying the extent of wrinkling, it is useful to examine the nature of the local corrugations using the shape parameter, defined as the ratio of the smallest-to-largest principal curvatures at a given point on the flame surface (Pope Reference Pope1988; Pope, Yeung & Girimaji Reference Pope, Yeung and Girimaji1989). The shape parameter is constrained to values between  $-1$ and $+1$. For values equal to $+1$, both principal curvatures are identical, and the flame surface is curved spherically. When the shape parameter is $0$, one of the principal curvatures is zero, and the flame surface is curved cylindrically. As the shape parameter nears $-1$, the mean curvature of the interface is zero, and the flame surface is represented locally by a saddle point, which can be viewed practically as a transition between two cylindrical structures (Rutland & Trouvé Reference Rutland and Trouvé1993). The distributions of the shape parameter for a passive interface and a sub-critical flame are shown in figures 11(a) and 11(b), respectively. The nearly planar interface in a non-reacting flow, and the sub-critical flame that remains nearly planar despite the sharp density variation across its interface, are both curved cylindrically locally. The impact of thermal expansion is first seen in figure 11(c), where the flame surface for low intensity, $u^{\prime }/S_{L} = 0.1$ say, exhibits a greater tendency to form locally spherical structures. This results from the highly curved regions in the form of cusp and creases that result from the DL instability. The weakening of the bimodal p.d.f. of the super-critical flame and its transition into a distribution similar to the sub-critical flame with a peak near zero, enforces the previous observation that with increasing turbulence intensity, the local fluctuations in the velocity field begin to dominate the inherent instability (at least in terms of surface topology). It is plausible, therefore, that at sufficiently large turbulence intensities, it may no longer be possible to distinguish between the flame topologies of sub- and super-critical flames. The peaking of each p.d.f. at zero at high turbulence intensities emphasizes that despite being three-dimensional in nature, local structures of the flame surface tend to be cylindrical, i.e. practically two-dimensional. Similar observations have been made by Ashurst (Reference Ashurst1990) and Cant, Rutland & Trouvé (Reference Cant, Rutland and Trouvé1990) in their studies on flame–vortex interactions, indicating that two-dimensional unsteady stretched flames can be visualized as local simplifications of three-dimensional turbulent flame surfaces.
Distribution of the shape parameters of (a) a passive interface (NR), (b) sub-critical flames, and (c) super-critical flames, at various turbulence intensities.

4. Turbulent flame speed
The turbulent flame speed is defined as the mean propagation speed of a flame into a homogeneous isotropic turbulent gaseous mixture of zero mean, analogous to the laminar flame speed defined as the propagation speed of a flame into a quiescent (homogeneous) medium. In the present configuration, the turbulent flame speed  $S_T$ is equal to the mean inflow velocity $v_{in}$ that ensures that the flame remains stationary statistically at a specified location by the closed loop controller, as shown in figure 1. The temporal variations of the inflow velocity $v_{in}$, shown in figure 3(c) for a representative simulation, demonstrate the relatively rapid approach to a statistically stationary state; the time average of the asymptote then corresponds to the turbulent flame speed.
An expression for the turbulent flame speed can also be obtained from an overall mass conservation, as suggested by Damköhler (Reference Damköhler1940), but with the consumption, or local flame speed (2.4) replacing the laminar flame speed. Equating the mass flow rate at the inlet,  $\dot {m} = \rho _u S_T A$, with the total mass flowing through the wrinkled fluctuating flame surface, $\dot {m} = \rho _u \overline {S_f A_f}$, yields
 \begin{equation} \frac{S_T }{S_L} = \frac{\overline{S_f A_f }}{S_LA}, \end{equation}
where  $A$ is the cross-sectional area of the domain, $A_f$ is the surface area of the corrugated flame, and the overline denotes average in time and transverse directions. When the flame is multiply folded and/or includes detached segments, the averaging procedure must include the contribution of all flame segments associated with an element of the cross-sectional area $A$, as discussed by Fogla et al. (Reference Fogla, Creta and Matalon2015). According to (4.1), the increase in speed of the turbulent flame is not equal to the increase in flame surface area, as per Damköhler's hypothesis, but is affected by the local stretch rate through $S_f$, modulated by the Markstein length $\mathcal {L}$. It therefore depends on the flow characteristics, as well as on the mixture properties. Below, we examine the additional effect of stretching on the turbulent flame speed, with special attention given to the role of the DL instability, extending earlier results of Creta & Matalon (Reference Creta and Matalon2011a) and Fogla et al. (Reference Fogla, Creta and Matalon2015, Reference Fogla, Creta and Matalon2017) that were limited to two-dimensional flows.
Figure 12(a) shows the turbulent flame speed as a function of turbulence intensity for various Markstein numbers, ranging from a sub-critical flame with  ${\mathcal {M}}^{-1} = 22.5$ to super-critical flames of increasing ‘instability strengths’. The growing trend of the propagation speed with increasing turbulence intensity is associated primarily with the increase in flame surface area due to the turbulence, but there is a clear enhancement for given flow conditions as ${\mathcal {M}}^{-1}$ increases, associated with the increase in flame surface area due to the DL instability. The DL enhancement is evident at all values of $u^{\prime }/S_{L}$, and persists in the limit of vanishing turbulence intensity. When $u'/S_L \to 0$, the (stable) cusp-like conformation of a super-critical flame propagates at a speed $U_L$ that is significantly larger than the laminar flame speed $S_L$, namely the speed of a sub-critical flame in this limit. For the values of ${\mathcal {M}}^{-1}$ considered, $U_L \approx 1.3$– $1.4 \,S_L$, consistent with the results of Patyal & Matalon (Reference Patyal and Matalon2018). In figure 12(b), the flame speed has been normalized with $U_L$ to ensure that $S_T/U_L \to 1$ when $u'/S_L \to 0$. The increment in the normalized speed is proportional to the turbulence intensity, i.e.
 \begin{equation} S_T/U_L - 1 \sim u'/S_L , \end{equation}
for all values of  ${\mathcal {M}}$, as per Damköhler's proposition for large-scale flames. The increase in DL enhancement observed when increasing the turbulence intensity is due to the more frequent manifestation of cusps and ridges, folded surfaces and detached flame segments under super-critical conditions, as discussed earlier.
The dependence of the turbulent flame speed  $S_T$, normalized with respect to (a) the laminar flame speed $S_L$, and (b) the propagation speed of the DL cusp-like structure $U_L$, on turbulence intensity $u^{\prime }/S_L$, for a range of Markstein numbers spanning sub- to super-critical conditions.

Figure 13 shows the relation between the turbulent flame speed and the mean relative increase in flame surface area. For all turbulence intensities,  $S_T/S_L < \overline {A_f}/A$, which indicates that the rise of the turbulent flame speed over its laminar counterpart is less than the increase in flame surface area. This is due to a lower consumption rate, which, for the positive Markstein numbers considered here, is due to stretching. The difference appears to diminish when ${\mathcal {M}}^{-1}$ increases, possibly due to the net increase in overall flame surface area that results when the instability strengthens. This behaviour is consistent with the computational results of Fogla et al. (Reference Fogla, Creta and Matalon2017) for two-dimensional flows. The variance of the normalized turbulent flame speed $S_T/S_L$ from the associated area ratio $\overline {A_f}/A$ was also observed in a number of experimental studies. Bagdanavicius et al. (Reference Bagdanavicius, Bowen, Bradley, Lawes and Mansour2015) used two different set-ups – a spherical bomb and a high speed burner – to determine the turbulent flame speed for a range of fuels with positive Markstein numbers, and noted when elevating the turbulence intensity that the area ratio $\overline {A_f}/A$ increased faster than the turbulent flame speed. Using a spherically expanding flame configuration, Weiß, Zarzalis & Suntz (Reference Weiß, Zarzalis and Suntz2008) examined the behaviour of six different mixtures with varying Markstein numbers, and found that $S_T/S_L$ is less/greater than $\overline {A_f}/A$ for positive/negative Markstein numbers, respectively. The measurements carried out in a cylindrical combustion chamber by Daniele et al. (Reference Daniele, Mantzaras, Jansohn, Denisov and Boulouchos2013) for mixtures ranging from pure methane to syngas blends, corresponding to negative Markstein numbers, showed the opposite trend of $S_T/S_L$ always greater than the corresponding area ratio.
The normalized turbulent flame speed  $S_T/S_L$ versus the mean flame surface area $\overline {A_f}/A$, for a range of Markstein numbers spanning sub- to super-critical conditions.

To investigate the effect of stretching on the turbulent flame, the dependence of the (time-averaged) mean stretch rate  $L \overline{\mathbb {K}}/S_L$ on the turbulence intensity was evaluated and displayed in figure 14(a) for several values of the Markstein number. On average, the fluctuating flame experiences positive stretch that increases with increasing turbulence level. The larger stretch rates of the super-critical flames ( $\mathcal {M}^{-1} \ge 37.5$) is due to the large corrugations and frequent development of cusps and creases along the flame surface. In figure 14(b), we show the dependence of the mean local flame speed $\overline {S_f}/S_L$ on the turbulence intensity, determined from the relation $\overline {S_f}/S_L = 1 - \mathcal {M} (L\overline{\mathbb {K}} /S_L)$. For the positive Markstein numbers considered in this study, $\overline {S_f}$ decreases with increasing turbulence intensity. For sub-critical conditions ( $\mathcal {M}^{-1} = 22.5$), the flame tends towards a planar conformation when $u'/S_L \to 0$, and $\overline {S_f} \to S_L$. For super-critical conditions, the flame in the same limit takes on a cusp-like appearance that, on average, is stretched positively such that $\overline {S_f}$ is significantly smaller than $S_L$ when $u'/S_L \to 0$. For low intensity values, the local flame speed remains less than the speed of the sub-critical flame, owing to the resilience of the cusp-like structure to turbulence. This resilience diminishes when $u'/S_L$ increases, and at higher turbulence levels the local flame speed decreases at a slower rate with increasing ${\mathcal {M}}^{-1}$. A reduction in the mean flame speed with turbulence intensity, as reported in the simulations of Chen & Im (Reference Chen and Im1998, Reference Chen and Im2000), and in the two-dimensional simulations of Fogla et al. (Reference Fogla, Creta and Matalon2015), is to be expected at higher intensities.
The dependence of (a) the mean local stretch rate  $L \overline{\mathbb {K}}/S_L$ and (b) the flame speed $\overline {S_f}/S_L$ on the turbulence intensity $u^{\prime }/S_L$, for various values of the Markstein number, spanning sub- to super-critical conditions.

In figure 15(a), we show a comparison of the two constituents of flame stretch, curvature and strain, for representative sub- and super-critical flames at various turbulence intensities. Irrespective of the presence/absence of the DL instability, the mean stretch rate experienced by the flame is primarily a result of hydrodynamic straining. This behaviour is consistent with the experimental measurements of Bunsen flames by Filatyev et al. (Reference Filatyev, Driscoll, Carter and Donbar2005) and with the two-dimensional DNS results of H $_2$–air flames by Im & Chen (Reference Im and Chen2002). The results in figure 15(b), which show the dependence of the mean strain rate on turbulence intensity for increasing values of ${\mathcal {M}}^{-1}$, indicate that the enhancement of the mean stretch rate observed as a result of the DL instability is due to an increase in the mean strain rate $\overline {K_S}$.
(a) Comparison of the relative contributions of the mean flame surface curvature  $L\bar {\kappa }$ and strain rate $L \overline{K_S}/S_L$ experienced by the flame at different turbulence intensities, for sub-critical ( ${\mathcal {M}}^{-1} = 22.5$) and super-critical ( ${\mathcal {M}}^{-1} = 75$) flames. (b) Dependence of the mean strain rate on turbulence intensity for various values of the Markstein number.

5. Effect of the flame on the turbulent flow
The large density variations across the flame that result from the heat released by the chemical reactions modify the incoming turbulent flow significantly. In this section, we examine the flow variations and how these changes are affected by the turbulence level. To segregate the impact of the DL instability, the results will be presented separately for a passive interface in a constant density flow and for sub- and super-critical flames.
5.1. Vorticity creation/destruction
The modifications of a turbulent flow are best illustrated by examining the vorticity transport equation, which, in dimensionless form, is
 \begin{equation} \dfrac{{\rm D} \boldsymbol{\omega}}{{\rm D} t} = \left(\boldsymbol{\omega} \boldsymbol{\cdot} \boldsymbol{\nabla} \boldsymbol{v} \right) - \boldsymbol{\omega} \left(\boldsymbol{\nabla} \boldsymbol{\cdot} \boldsymbol{v} \right) + \dfrac{1}{\rho^{2}} \left(\boldsymbol{\nabla} \rho \times \boldsymbol{\nabla} p \right) + \dfrac{1}{\rho \, Re} {\nabla}^{2} \boldsymbol{\omega}, \end{equation}
where  $\boldsymbol {\omega }$ is the vorticity vector. The four terms on the right-hand side of (5.1) are the different mechanisms responsible for the creation/destruction of vorticity. The first term corresponds to vortex stretching, or vorticity enhancement produced by velocity gradients parallel to the vorticity vector. The second term represents the effects of gas expansion, which brings about the redistribution of vorticity in the burned gas across a greater region. The third term, referred to as the baroclinic torque, corresponds to the generation of vorticity that arises from the misalignment of pressure and density gradients. The last term represents the diffusion of vorticity by molecularity (viscous effects), which in the present model is assumed relatively small. To quantify these various contributions, it is convenient to introduce the transport equation for the enstrophy, obtained by taking the inner product of (5.1) and the vorticity vector $\boldsymbol {\omega }$:
 \begin{align} \dfrac{\rm D}{{\rm D} t}\left(\frac{\omega^{2} }{2} \right) &= \boldsymbol{\omega} \boldsymbol{\cdot} \boldsymbol{\nabla} \boldsymbol{v} \boldsymbol{\cdot} \boldsymbol{\omega} - \left(\boldsymbol{\nabla} \boldsymbol{\cdot} \boldsymbol{v} \right)\omega^{2} + \frac{\boldsymbol{\nabla} \rho \times \boldsymbol{\nabla} p }{ \rho^{2}} \boldsymbol{\cdot} \boldsymbol{\omega}\nonumber\\ &\quad - \dfrac{1}{\rho \, Re} \left[ \boldsymbol{\nabla} \boldsymbol{\cdot} (\boldsymbol{\omega} \times \boldsymbol{\nabla} \times \boldsymbol{\omega} ) + (\boldsymbol{\nabla} \times \boldsymbol{\omega})^{2} \right], \end{align}
where  $\omega ^{2} \equiv \boldsymbol {\omega } \boldsymbol {\cdot } \boldsymbol {\omega }$, and $\omega ^{2}/2$ is the enstrophy. The three contributions (excluding viscous diffusion) on the right-hand side, normalized by the vorticity magnitude, are
 \begin{equation} \left. \begin{aligned} \text{vortex stretching:} \quad & \boldsymbol{\omega} \boldsymbol{\cdot} \boldsymbol{\nabla} \boldsymbol{v} \boldsymbol{\cdot} \hat{\boldsymbol \omega} = \boldsymbol{\omega} \boldsymbol{\cdot} \boldsymbol{S} \boldsymbol{\cdot} \hat{\boldsymbol \omega},\\ \text{dilatation:} \quad & - \left(\boldsymbol{\nabla} \boldsymbol{\cdot} \boldsymbol{v} \right) \omega,\\ \text{baroclinic torque:} \quad & \left[(\boldsymbol{\nabla} \rho \times \boldsymbol{\nabla} p) \boldsymbol{\cdot} \hat{\boldsymbol \omega}\right] / \rho^{2}, \end{aligned} \right\} \end{equation}
where  $\hat {\boldsymbol \omega } = \boldsymbol {\omega }/ \omega$ is a unit vector aligned with the vorticity vector, and $\boldsymbol {S}$ is the strain-rate tensor; they correspond to the rate of creation/destruction of the total vorticity by each mechanism. Figures 16 and 17 show the variations of these quantities in the vicinity of the flame brush along the axial direction ( $1 \lessapprox y \lessapprox 2.5$), averaged along the $x$–
$x$– $z$ plane, for increasing values of turbulence intensity and for representative sub- and super-critical flames, respectively. Each curve has been computed from a large number of realizations obtained once statistical steady state has been reached. The dashed vertical line marks the mean flame position enforced by the PID controller. The passive NR interface in a constant-density turbulent flow of intensity $u'/S_L = 1.0$ has been added in both figures as a reference. Evidently, the contributions from dilatation and baroclinic torque for this non-reacting case are identically zero, and the contribution of vortex stretching diminishes as the flow gets advected downstream primarily due to the dissipation of strain.
Distribution of vorticity and the magnitude of the three mechanisms responsible for its production/destruction along the axial  $y$-direction, for increasing turbulence intensities. The figure corresponds to a sub-critical flame, with the passive interface (NR) added as reference. The dashed vertical line marks the mean flame position enforced by the PID controller. (a) Vortex stretching. (b) Dilatation. (c) Baroclinic torque. (d) Vorticity magnitude $\omega$.

Distribution of vorticity and the magnitude of the three mechanisms responsible for its production/destruction along the axial  $y$-direction, for increasing turbulence intensities. The figure corresponds to a super-critical flame, with the passive interface (NR) added as reference. The dashed vertical line marks the mean flame position enforced by the PID controller. (a) Vortex stretching. (b) Dilatation. (c) Baroclinic torque. (d) Vorticity magnitude $\omega$.

We consider first the sub-critical case presented in figure 16. Although, similar to the NR interface, the contribution of vortex stretching diminishes ahead/behind the flame, there is an increase in its production near the flame region, which intensifies with increasing turbulence intensity. For the nearly planar structures observed in this regime, the vorticity created in the flame zone is primarily tangential to the mean flame surface (Matalon et al. Reference Matalon, Cui and Bechtold2003) and is therefore aligned with the component of the rate of strain along the surface. Their interaction is responsible for an increase in the stretching and tilting of vorticity, and hence for the overall vorticity enhancement. Dilatation represents the effects of gas expansion and is therefore limited to the flame brush region. Since  $\boldsymbol {\nabla }\boldsymbol {\cdot } \boldsymbol {v} > 0$, its contribution is to reduce the local magnitude of vorticity, redistributing it across a greater region. As the level of turbulence increases, the rise in vorticity is spread faster and over a larger volume. The baroclinic torque is also limited to the flame brush region, but unlike dilatation, it acts to increase the vorticity magnitude. The growing fluctuations at increasing turbulence level intensify the misalignment of the pressure and density gradients, and lead to the vorticity enhancement and its spread over a wider region. The combined effects of these three mechanisms is shown in figure 16(d). Since the NR interface does not interact effectively with the flow field, the vorticity present in the background turbulence diminishes as the flow gets advected downstream due to the reduction in the inherent vortex stretching. The sub-critical flame, on the other hand, is dominated by the balance between destruction of vorticity by gas expansion and its generation due to vortex stretching. For the low-to-moderate turbulence intensities considered here, dilatation has the greatest effect, and the overall magnitude of the vorticity is reduced across the flame region.
In figure 17, we present the equivalent results for a super-critical flame. The enhancement of vorticity due to vortex stretching is spread over a wider region because of the thicker flame brush and the augmented fluctuations arising from the DL instability. The larger spread of vorticity redistribution that results from the gas expansion, as represented by the mean dilatation term, is also a direct consequence of the instability. However, being a direct consequence of the heat release, its contribution to the overall vorticity budget is similar to that for the sub-critical flames. The most remarkable effect results from the baroclinic mechanism, which for a super-critical flame contributes 3–5-fold greater vorticity enhancement than it does for a sub-critical flame under the same turbulence conditions (note the different scales in the two figures). The unique topological changes to the flame surface, and the sharp crests and ridges that develop on its surface as a result of the instability, are manifested by a stronger baroclinic torque, which as noted earlier results from the misalignment of pressure and density gradients, or equivalently when surfaces of constant pressure become oriented differently than the flame surface (recall that the normal to the flame surface is aligned with the density gradient). Overall, the vorticity magnitude, which decreases continuously in the unburned gases, increases slightly beyond the flame region, a behaviour that is in sharp contrast with the flow behind an NR interface or a sub-critical flame. The rise in vorticity magnitude in the burned gas region is expected to intensify further with increasing turbulence level, as noted by Hamlington et al. (Reference Hamlington, Poludnenko and Oran2011), who observed in their H $_2$–air DNS study a relative increase in vorticity magnitude when varying the turbulence intensity $u^{\prime }/S_L$ in the range 2.45–30.6.
5.2. Vorticity restructuring
One of the methods of visualizing a turbulent flow field is using the Q-criterion for vortex identification (Hunt, Wray & Moin Reference Hunt, Wray and Moin1988; Jeong & Hussain Reference Jeong and Hussain1995; Kolár Reference Kolár2007), which accentuates regions of intense swirling motion. It has been used in figure 18 to visualize the turbulent flow throughout the computational domain; the interface/flame surface appears in grey, and the iso-surfaces of vorticity in green. The turbulent flow across a passive NR interface is shown in figure 18(a), using  $Q_{{crit}}=50$. The vortical structures maintain their isotropy when convected by the mean incoming flow and are practically unaffected by the existence of the surface. There is, however, a small degree of dissipation observed towards the end of the domain. The turbulent flow across a supercritical flame is shown in figure 18(b), using $Q_{{crit}}=100$; the higher Q-value is for better visualization. The vortical structures in the burned gas region appear more elongated, preferentially in the axial direction. Since this occurs immediately behind the flame, it implies that the flame is a source of anisotropy. Such tube-like structures have been observed experimentally (Adrian Reference Adrian2007; Wallace Reference Wallace2009) and computationally (Chakraborty, Balachandar & Adrian Reference Chakraborty, Balachandar and Adrian2005) in a wide range of turbulent flows. A number of DNS studies (Tanahashi, Fujimura & Miyauchi Reference Tanahashi, Fujimura and Miyauchi2000; Hamlington et al. Reference Hamlington, Poludnenko and Oran2011) have reported a similar anisotropy at low turbulence intensities, but noted a diminishing effect at higher turbulence levels. At $u^{\prime }/S_{L}=30.6$, Hamlington et al. (Reference Hamlington, Poludnenko and Oran2011) noted that the flow in the burned gas became nearly isotropic.
Representative snapshots of the turbulent flow field across a passive interface and a super-critical flame; the interface is shown in grey, and the vortical motion is illustrated by vorticity iso-surfaces (in green) using the Q-criterion. (a) Passive interface;  $u^{\prime }/S_{L} = 1.0$. (b) Super-critical flame; $u^{\prime }/S_{L} = 1.5$.

Next, we examine the extent of anisotropy by plotting in figure 19 the p.d.f. of the orientation of the vorticity vector for sub- and super-critical flames, contrasting the results with those for an NR interface. Figures 19(a–c) show the magnitude of the components of the unit vector  $\hat {\boldsymbol \omega } = (\hat {\omega }_{x}, \hat {\omega }_{y}, \hat {\omega }_{z})$ conditioned on $y = 0.5$, located in the unburned gas, and figures 19(d–f) show their magnitude conditioned on the flame interface. The vorticity orientation in the unburned gas for all three cases is similar, with an equally probable alignment in all three directions. This serves as a verification that the incoming turbulent flow field is indeed isotropic. However, when conditioned on the interface/flame surface, the p.d.f.s of $|{\hat {\omega }_i}|$ show clearly that unlike the NR interface, the flames act as a source of anisotropy. The p.d.f.s of both $|\hat {\omega }_{x}|$ and $|\hat {\omega }_{z}|$ peak at zero, indicating that the transverse components of the vorticity are filtered out, but the p.d.f. of $|\hat {\omega }_{y}|$ peaks at 1, implying that the vorticity gets restructured and is more likely to be oriented parallel to the flame surface.
Distribution of the orientation of the vorticity vector, represented by the normalized magnitude of its components  $\hat {\omega }_{x}, \hat {\omega }_{y}, \hat {\omega }_{z}$, conditioned in the unburned gas and on the flame surface, for sub-critical $\mathcal {M}^{-1} = 22.5$ and super-critical $\mathcal {M}^{-1} = 75$ flames; the curve in blue corresponds to a passive NR interface. (a–c) Orientation of the vorticity at $y = 0.5$ (unburned gas). (d–f) Orientation of the vorticity conditioned on the flame surface.

Increasing the turbulence intensity has a different effect on sub- and super-critical flames, as shown in figure 20, where the p.d.f. of  $|\hat {\omega }_{y}|$ conditioned on the flame surface is plotted for increasing values of $u^{\prime }/S_{L}$. For sub-critical flames, the extent of anisotropy reduces as the turbulence level increases, with the various curves tending towards the corresponding curve of an NR interface. For super-critical flames, the presence of the instability lends a resiliency to the anisotropy with minimal impact on the vorticity orientation. While the results shown in the figure correspond to $\hat {\omega }_{y}$, similar observations are made for the transverse components $\hat {\omega }_{x}$ and $\hat {\omega }_{z}$.
The dependence of the p.d.f. of the vorticity component  $\hat {\omega }_{y}$ conditioned on the flame surface, for $\sigma =5$: (a) $\mathcal {M}^{-1} = 22.5$, sub-critical flame; (b) $\mathcal {M}^{-1} = 75$, super-critical flame.

5.3. Vorticity and strain statistics
While vorticity demonstrates the rotational nature of turbulence, strain plays an important role in enstrophy generation and in transfer of energy from larger to smaller scales (Tsinober Reference Tsinober2009). Vortex stretching  $\boldsymbol {\omega } \boldsymbol {\cdot } \boldsymbol {S} \boldsymbol {\cdot } \boldsymbol {\hat {\omega }}$, which was seen in figures 16(a) and 17(a) to increase significantly across the flame brush, results from the interaction of vorticity and strain. If $\lambda _i$ are the principle eigenvalues of the strain-rate tensor, ordered as $\lambda _1 \ge \lambda _2 \ge \lambda _3$, and ${\boldsymbol e}_i$ are the corresponding eigenvectors, then the enstrophy production resulting from vortex stretching may be expressed as
 \begin{equation} \omega_{j } S_{ij} \hat{\omega}_{i} = \omega \left(\lambda_1 \lvert {\boldsymbol{e}_1 \boldsymbol{\cdot} \boldsymbol{\hat{\omega}}} \rvert^{2} + \lambda_2 \lvert {\boldsymbol{e}_2 \boldsymbol{\cdot} \boldsymbol{\hat{\omega}}} \rvert^{2} + \lambda_3 \lvert {\boldsymbol{e}_3 \boldsymbol{\cdot} \boldsymbol{\hat{\omega}}} \rvert^{2} \right). \end{equation}
The production rate, therefore, depends on the magnitude of the vorticity, on the principle eigenvalues, and on the alignment between the vorticity vector and the corresponding eigenvectors.
The strain-rate eigenvalues identify the nature of stresses in the flow field; positive eigenvalues represent extensive/tensile stresses, which have a tendency to reduce local velocity gradients, while negative eigenvalues are compressive stresses that promote the production of local velocity gradients. For constant density flows, the continuity equation requires  $\lambda _1 + \lambda _2 + \lambda _3 = 0$, in which case $\lambda _1$ is always positive, corresponding to extensional straining along the $\boldsymbol {e}_1$-direction, and $\lambda _3$ is always negative, corresponding to compressional straining along the $\boldsymbol {e}_3$-direction. The intermediate eigenvalue $\lambda _2$ can be either negative or positive, depending on the magnitudes of $\lambda _1$ and $\lambda _3$. This holds true in the present case in the unburned gas region ahead of the flame brush, where the density is constant. In figure 21, we show, for a representative super-critical flame, the p.d.f.s of the three eigenvalues and the p.d.f.s of the relative alignment between the vorticity vector $\boldsymbol {\omega }$ and the corresponding eigenvectors conditioned on the flame surface, for increasing values of turbulence intensity. (Similar results were observed for sub-critical flames, but have been omitted for conciseness.) There is a bias of $\lambda _2$ towards positive values, implying extensional straining along the $\boldsymbol {e}_2$-direction, but negative values corresponding to compressional straining do occur, although less frequently. We also note the preferential alignment of vorticity with the intermediate eigenvector of the strain-rate tensor, as first reported by Ashurst et al. (Reference Ashurst, Kerstein, Kerr and Gibson1987a) using DNS data of non-reacting isotropic flow and homogeneous shear flow, and found in the experiments of Tsinober, Kit & Dracos (Reference Tsinober, Kit and Dracos1992) using hot-wire measurements. Similar observations were also reported in studies of other turbulent flows (She, Jackson & Orszag Reference She, Jackson and Orszag1991; Jiménez Reference Jiménez1992; Nomura & Post Reference Nomura and Post1998) and turbulent flows of non-premixed flames (Nomura & Elghobashi Reference Nomura and Elghobashi1993; Boratav, Elghobashi & Zhong Reference Boratav, Elghobashi and Zhong1996).
Probability distribution of the principal eigenvalues of the strain-rate tensor and of the alignment of the vorticity with the corresponding eigenvectors conditioned on the flame surface, for a super-critical flame with  $\sigma =5$ and $\mathcal {M}^{-1} = 75$ at various turbulence intensities.

It has been argued that since the fluid elements are subjected to extension in two directions and compression in the third, they would deform locally into sheet-like structures (Betchov Reference Betchov1956; Kerr Reference Kerr1987). The distribution of the principle eigenvalues shown in figure 21 would imply that such structures in the flow field are favourable. This argument, however, is based on the assumption that the strain is constant and uniform over the spatial extent of the structures. In turbulent flows, vortex structures of high intensity occur in scales over which the strain field is not necessarily constant. Moreover, the intensity of vorticity in some fluid elements, which is amplified by the preferential alignment of the vorticity with the extensive eigenvectors, modifies the strain field in the surroundings of the element. The implication of these non-local effects is the formation of tube-like structures in the high-amplitude vortex regions of the flow and sheet-like structures in the less intense vorticity regions, as shown in the DNS studies of Ashurst et al. (Reference Ashurst, Kerstein, Kerr and Gibson1987a) and She et al. (Reference She, Jackson and Orszag1991). Tube-like structures are particularly favoured in reacting flows because, when conditioned on the flame surface, the propensity of negative values of  $\lambda _2$ and the probability of the negative $\lambda _3$ eigenvalues are seen to increase with increasing turbulence intensity. Finally, we note that the distribution of the eigenvalues in the burned gas region exhibits a trend similar to that shown in figure 21, but the range of values that they acquire is significantly reduced due to an overall dissipation along the axial direction.
Figure 21 shows that there is a balance between the enstrophy creation through the alignment of the vorticity with the extensive stresses, which pull or stretch velocity gradients apart, and enstrophy destruction through compressive stresses. Since it is the extensive processes that dominate the balance, vortex stretching becomes a cumulative production mechanism of vorticity. The impact of the flame on vortex stretching for sub- and super-critical flames, contrasted with its effect on a passive NR interface, is shown in figure 22. The figure displays the variations of each of the three contributions  $\lambda _i \lvert {\boldsymbol {e}_i \boldsymbol {\cdot } \boldsymbol {\hat {\omega }}} \rvert ^{2}$ along the axial $y$-direction, averaged in the transverse $x$–
$x$– $z$ plane. The restructuring of the vorticity vector to align with the axial direction when convected through the flame, as discussed earlier, is reflected here in the significant enhancement of extensive stresses, which create a ‘jump’ in vorticity across the flame brush. Since the realignment of the vorticity vector is impacted similarly by the presence of DL instability, apart from increasing the spatial spread of enstrophy production (due to a larger flame brush thickness), it may be concluded that thermal expansion is the primary reason for the observed increase in vortex stretching.
The impact on vortex stretching in each of the three principle directions as functions of the axial  $y$-direction of sub-critical ( $\mathcal {M}^{-1} = 22.5$) and super-critical ( $\mathcal {M}^{-1} = 75$) flames contrasted to a non-reacting passive interface: (a) $\lambda _1 \lvert {\boldsymbol {e}_1 \boldsymbol {\cdot } \boldsymbol {\hat {\omega }}} \rvert ^{2}$, (b) $\lambda _2 \lvert {\boldsymbol {e}_2 \boldsymbol {\cdot } \boldsymbol {\hat {\omega }}} \rvert ^{2}$, (c) $\lambda _3 \lvert {\boldsymbol {e}_3 \boldsymbol {\cdot } \boldsymbol {\hat {\omega }}} \rvert ^{2}$.

5.4. Scalar stretching
The transport equation of the square of a scalar-gradient is similar in form to the transport equation (5.2) for the enstrophy, but the production term has a negative sign, unlike its counterpart in the enstrophy transport (the vortex stretching term), implying that gradient amplification results from compressive straining (Corrsin Reference Corrsin1953). Numerous studies have examined previously the local dynamics of a passive scalar in a turbulent flow field (Batchelor Reference Batchelor1959; Gibson Reference Gibson1968; Kerr Reference Kerr1985; Ruetsch & Maxey Reference Ruetsch and Maxey1991; Nomura & Elghobashi Reference Nomura and Elghobashi1992; Swaminathan, Mahalingam & Kerr Reference Swaminathan, Mahalingam and Kerr1996). The present focus is on the gradient of the density, or temperature field, which in the present study represents the extent of the flame brush. Since in the hydrodynamic model, density variations occur normal to the flame surface, the production term may be expressed as
 \begin{equation} - \boldsymbol\nabla \rho \boldsymbol{\cdot} \boldsymbol{S} \boldsymbol{\cdot} \boldsymbol\nabla \rho ={-} \lvert {\nabla \rho} \rvert^{2} \left(\lambda_1 \lvert {\boldsymbol{e}_1 \boldsymbol{\cdot} \boldsymbol{n}} \rvert^{2} + \lambda_2 \lvert {\boldsymbol{e}_2 \boldsymbol{\cdot} \boldsymbol{n}} \rvert^{2} + \lambda_3 \lvert {\boldsymbol{e}_3 \boldsymbol{\cdot} \boldsymbol{n}} \rvert^{2} \right), \end{equation}
such that the creation/destruction of density gradients by turbulent fluctuations is determined by the alignment between the normal to flame surface  $\boldsymbol {n}$ and the strain-rate eigenvectors. For a passive NR interface, the p.d.f.s. in figures 23(a–c) show a preferential alignment of the normal to the interface (or the scalar gradient) with the compressive eigenvector $\boldsymbol {e}_3$, and misalignment with the extensive eigenvectors $\boldsymbol {e}_1$ and $\boldsymbol {e}_2$. The p.d.f.s of a flame surface, shown in figures 23(d–f), exhibit a completely opposite trend: a favourable alignment with the extensive component $\boldsymbol {e}_1$, and misalignment with the compressive eigenvector $\boldsymbol {e}_3$. Hence in a constant-density flow, the stresses tend to compress scalar gradients and promote mixing, while in a reacting flow due to gas expansion, they tend to pull density or temperature iso-surfaces apart.
Probability distribution of the alignment of the normal to the interface/flame surface with the strain-rate tensor eigenvectors, for (a–c) a passive interface, and (d–f) a super-critical flame ( $\mathcal {M}^{-1} = 75$), at various turbulence intensities.

To highlight this observation, we show in figure 24 the relative contribution of the dynamics of the three terms comprising the production of the square of the density-gradient (5.5), for a passive interface and a representative super-critical flame. For a passive interface, the term  $\lambda _3 \lvert {\boldsymbol {e}_3 \boldsymbol {\cdot } \boldsymbol {n} } \rvert ^{2}$, corresponding to compressive stresses, dominates, but being negative, its overall contribution is to amplify density (or temperature) gradients. In other words, compressive stresses generate local density gradients and promote mixing. The dynamics in a reactive flow (for both sub- and super-critical conditions) shows an opposite trend. The term $\lambda _1 \lvert {\boldsymbol {e}_1 \boldsymbol {\cdot } \boldsymbol {n} } \rvert ^{2}$, corresponding to extensive stresses, dominates, and being positive, its overall contribution is to suppress density (or temperature) gradients. In other words, the extensive stresses in the turbulent flow tend to destroy density gradients. Similar observations have also been made previously in a number of studies concerned with premixed combustion (Swaminathan & Grout Reference Swaminathan and Grout2006; Chakraborty & Swaminathan Reference Chakraborty and Swaminathan2007; Hartung et al. Reference Hartung, Hult, Kaminski, Rogerson and Swaminathan2008). It is therefore plausible that in the absence of chemical reactions, the turbulent flow responsible for compressing scalar gradients tends to promote mixing, while in reacting flows the balance between the creation of gradients by the chemical reactions, and their destruction via extensive stresses due to the turbulence, leads to local mixing or local extinction.
Probability distribution of the three contributions to the scalar gradient production conditioned on the interface/flame surface for (a–c) a passive interface, and (d–f) a super-critical flame ( $\mathcal {M}^{-1} = 75$), at various turbulence intensities.

6. Conclusions
The simulations reported in this paper are the first three-dimensional computations of premixed flames in homogeneous isotropic turbulent flows, carried out within the context of the hydrodynamic theory. In this asymptotic model, the flame is thin compared to all other hydrodynamic scales and is confined to a surface across which the density (and temperature) varies discontinuously. The combustion and fluid dynamic processes are fully coupled; the flame propagation speed depends on the local mixture and flow conditions, whilst the flow field is modified by the gas expansion that results from the increase in temperature caused by the heat release. Although the flame zone is not numerically resolved and turbulent eddies do not interact with the flame structure, the diffusion and reaction properties of the mixture are accounted for through two lump parameters, the unburned-to-burned density ratio and the Markstein length. The primary objective of this study has been to examine the flame–turbulence interactions for various mixture and flow conditions, highlighting in particular the influences of the Darrieus–Landau (DL) instability on the flame propagation and the underlying turbulence. The relative simplicity of the hydrodynamic model enabled examining the evolution of turbulent flames for various mixtures and over a range of turbulent conditions, without invoking any turbulence modelling assumption and/or ad hoc adjustable parameters. Moreover, since the flame front is defined uniquely, quantities related to the flame surface that are needed to determine its speed and morphological changes are determined unambiguously and could be obtained by performing an ensemble average over a large number of eddy turnover times.
The intertwined fluctuations of the flame surface resulting from the turbulence and the flow-induced gas expansion require numerous gauging for identifying the presence and influence of the DL instability. One indicator is the statistical changes in flame position, curvature and orientation. Unlike a passive interface in a constant-density flow, where fluctuations of the surface are due solely to the turbulence itself, the surface of a flame is subjected to perturbations resulting from the flow induced by gas expansion that may intensify or weaken. The first indicator is the critical Markstein length, which can be estimated from the linear stability of a planar flame in a quiescent medium. Under sub-critical conditions, perturbations resulting from gas expansion are damped by thermo-diffusive influences (for positive Markstein lengths) and thus do not affect the overall appearance of the turbulent flame. As a consequence, the flame brush at low turbulence intensities remains nearly planar, and although it thickens when increasing the turbulence intensity, it shows no preference in its overall orientation; the flame remains equally convex towards the burned gas region as it is concave, and remains symmetric relative to a mean position. Under super-critical conditions, the perturbations resulting from gas expansion are amplified, and the flame is forced to respond to the coupled effects of turbulence and instability. At low turbulence intensities, the instability dominates and the flame evolves into a cusp-like conformation pointing towards the burned gas region, similar to its appearance under laminar conditions, and remains resilient to the turbulence. At higher intensities, the turbulence exerts a stronger influence on the flame surface, but the frequent intrusion of elements of the flame surface with negative curvature into the burned gas suggests that the instability continues to play a significant role on its development. Additional markers of the instability include the extent of wrinkling, identified by the frequent alterations of the normal to the flame surface, and the nature of the shape factor, which in the highly curved flame segments is locally spherical-like. At sufficiently large intensities, the turbulent flow appears to overshadow any morphological markers of the instability, and the flame appearance seems to be controlled effectively by the turbulence, losing any resiliency to the incoming turbulent flow. The large fluctuations of the flame surface lead to the broadening of the flame brush and the formation of multi-dimensional conformations; segments of the flame surface eventually fold and pinch off, creating pockets of unburned gas that separate from the main flame surface and get consumed instantaneously. The visibility of the instability is very dependent upon the nature of the topological marker, thus analysing different markers becomes essential.
The turbulent flame speed, which is an important characteristic of premixed flames, is also impacted noticeably by the DL instability and may serve as a marker. The surface area of the corrugated flame under super-critical conditions is notably larger than its area under sub-critical conditions, a difference that keeps increasing as the degree of the instability intensifies. Consequently, super-critical flames propagate significantly faster than sub-critical flames (by nearly 20–50 %) under the same flow conditions; the rise starts at very low turbulence levels and persists to higher intensities even after topological markers of the instability cease to be visible. Despite the correlation between the turbulent flame speed and the flame surface area, the two properties do not scale, and for positive Markstein lengths (as considered here), the increase in flame surface area is always larger. The reason lies in the mean stretch rate experienced by the turbulent flame that tends to reduce the local consumption rate and, consequently, the turbulent flame speed. A direct consequence is the increase in the mean stretch rate, which more than doubles in the presence of the DL instability, due primarily to hydrodynamic straining. Although the super-critical flame shows a bias towards large negative curvatures, the overall contribution of the mean curvature to the stretch rate is minimal and on a par with its contribution to the mean stretch rate experienced by sub-critical flames.
Combustion evidently has a non-trivial effect on the incoming turbulent flow, with the DL instability playing a significant role. Vorticity through the flame is typically dominated by a balance between its generation by vortex stretching and baroclinic effects, and its redistribution by gas expansion. The most important impact of the DL instability is the significant enhancement of vorticity by baroclinic effects, observed in super-critical flames. The recurrent changes in the direction of the density gradients across the highly corrugated flames that result from the instability are frequently misaligned with the pressure gradients, and thus responsible for the vorticity enhancement. Another effect caused by the flame is the anisotropy observed in the turbulent flow of the burned gases. Unlike the vortical flow through a passive interface, which maintains its isotropic structure, the vortical structures beyond a flame (in the burned gas region) appear more elongated. The primary mechanism of the anisotropy is thermal expansion, with the flame acting effectively as a filter, restructuring the vorticity preferentially along the normal to the flame surface. Although the DL instability seems here to have a minimal impact, it nevertheless imparts a resiliency to this mechanism, implying that a much stronger turbulent flow is required to reduce the extent of anisotropy in the burned gas.
Funding
This work was partially supported by the CBET division of the National Science Foundation under grant CBET 19-11530. Thanks are also due to the allocations to the DOD High Performance Computing made possible through subproject AFOSR426652011.
Declaration of interests
The authors report no conflict of interest.


 Open access

