

Introduction
This article provides the first comprehensive, data-led review of gendered employment structures in UK archaeology. The aim is to provide an historical understanding of the female experience in the UK archaeological profession. In the later 20th century, many had experienced an institutional sexism that assumed women were more suited to ‘finds-work’ than to excavation and fieldwork, which were seen as more suitable for men (Everill Reference Everill2009).Footnote 2 As a result, men’s careers typically experienced greater support than that of women, many of whom experienced a lack of opportunity for maternity support and flexible working patterns. Surprisingly, however, this gendered view did not have a particularly long history, being only post-war in origin. Field archaeology in Britain had seen relatively equal participation amongst men and women in the 1930s–40s (Roberts Reference Roberts2005; Prtak Reference Prtak2019, 52; Pope and Davies Reference Pope and Davies2023). The latter was to change after the Second World War, however, amidst a move to professionalize, with lower numbers of women graduates in Britain generally until the final 1960s (Pope Reference Pope2011; Pope and Davies Reference Pope and Davies2025; Dyhouse Reference Dyhouse2006). In archaeology, undergraduate numbers reached equality by the mid-1970s, with equality in postgraduate study by the later 1980s (Rocks-Macqueen Reference Rocks-Macqueen2015).
That initial swell of women with a degree led to archaeology’s first data collection on equality peaking in the early 1990s (Morris Reference Morris1992). Here, we revisit this early data on equality in the archaeological sector to provide an overview of the 1990s workplace and the strategy for change. Subsequently, we discover the process by which this work was dismantled from the late 1990s onwards, with data gathering around equality issues being reduced. The result was a relegation of equality and diversity to the fringes of archaeological practice, which continued unfunded in the 2000s, conducted on a voluntary basis and undertaken almost exclusively by women archaeologists. Despite this, hindsight now reveals it proved critical to producing any data at all on discriminatory employment practices for that period.
The history that unfolds here reveals the pivotal issues that prompted the establishment of British Women Archaeologists (BWA) in late 2008, as a forum and network for those interested in addressing lack of equality in the field. BWA focused on documenting the female experience of archaeology, using a more qualitative approach that allowed women to speak about issues impacting them and their colleagues, that could feed into broader quantitative data collected by the sector. This qualitative approach to data gathering, lost since the mid-1990s, enabled a critical overview of shortcomings within the sector, with an authentic voice. Here, we discuss the foundation of BWA in 2008 and detail the 2008 and 2010 surveys that worked to provide qualitative data on the female experience. At this time, it was understood anecdotally that women were leaving the sector, something assumed to be about children and discrimination, amidst an environment that continued to repeat post-war thinking that women were more suited to artefactual ‘finds-work’ than to a masculine fieldwork (Everill Reference Everill2009).
The final part of the article provides a gender analysis of the first, contemporary Profiling the Profession job statistics reports of 1999, 2003 and 2008 – looking primarily at the issues of access, pay and retention. Ultimately, we found that, had the Morris (Reference Morris1992) recommendations been acted upon by the then Institute of Field Archaeologists, it is likely that further work in this area would have been unnecessary, as more women would have been retained in the sector and not suffered the same kinds of sexual harassment and discrimination that their colleagues had been exposed to a generation before. Furthermore, we suggest that early action to retain women workers in this period may have created an improved economic situation for the profession as a whole. At this point, where sector change now seems imminent, the primary aim of this article is to provide a path through what is fairly complex data and document the historic position of women’s access to the archaeological profession, and efforts by women volunteers to reduce inequalities, between 1990 and 2010.
The term ‘sex’ here refers to the binary data categories of men and women. These are historical data categories, and the authors note with regret the erasing of non-binary and intersex individuals in this data. The term ‘gender’ is sometimes used here in its historical (1990s) sense, when mainstream studies still conflated gender with sex. This common usage evolved linguistically to represent sex-based analyses, i.e., ‘gender analysis’ or the ‘gender pay gap’. In the 1990s, the notion of ‘gender’ had been used as a device to isolate/name sex-based societal structures (for discussion on the historical morphing of the term since the 1950s, see Díaz-Andreu and Pope Reference Díaz-Andreu, Pope, Díaz-Andreu and Coltofean2024). In gender theory, we now understand gender beyond this antiquated binary distinction, where some describe themselves instead on a sliding scale of masculine/feminine/non-binary, with others off this scale completely – allowing for more complex, and fluid, notions of gender identity (Pope Reference Pope2022, 14). In this article, gender is typically used as a verb – ‘to gender’, where tasks have historically been gendered more feminine/masculine – and we discuss gendered access, gendered impact, or the gendering of parenting. For us here, gender is not only a matter of individual identity; indeed, equally important is how an individual’s gender is perceived by the employer. Moving forwards, the term ‘gender’ will increasingly see use within the framework of Crenshaw’s (Reference Crenshaw1989; Reference Crenshaw1991) intersectional theory, whereby a person’s gender comes to include such factors as ethnicity, whiteness, dis/ability, age, class, and sexuality, alongside those of ‘sex’ as determined at birth (Fitzpatrick and Pope Reference Fitzpatrick and Popeforthcoming).
The Morris report and the Institute of Field Archaeologists Equal Opportunities Committee (1990–97)
With advancing numbers of women graduates across the 1990s, we might be excused for assuming that this time should have been a progressive time for women in archaeology. Critical to that era were two pieces of 1970s UK legislation that had sought to improve women’s employment rights, providing them with a legal backstop against discriminatory practices. Under the Equal Pay Act (1970), women were given the right to the same contractual pay and benefits as men in the same employment, where work was the same or equivalent, and the Sex Discrimination Act (1975) protected both men and women from discrimination based on sex or marital status. However, there was slow change in UK employment practices, and both acts were ultimately repealed in favour of the Equality Act (2010) (GEO 2011). Legal acts should prompt change, but real progress is only made through hard work in industries and companies, responding to legislation to avoid legal challenge. For archaeology, the first work that encouraged change emerged only by the 1990s.
Part of the problem was that the 1970s legislation in the UK was out of step with the wider social mood. In Germany, equality legislation was born out of the fallout of the Second World War: The Basic Law of the German Federal Republic (1949) saw men and women as equal in law, a Maternity Protection Act (1952) was passed for the protection of working mothers and the Equal Rights Act was passed in 1958 (López-Fanjul y Díez del Corral Reference López-Fanjul and del Corral2021). Similarly in the USA, equality legislation was born out of the Civil Rights Movement, with protections around race and migrant status in 1961; the Equal Pay Act (1963); and the Civil Rights Act (1964) against employment discrimination, with religion and sex included later, by executive order in 1965 (UCI 2024). Critically, these legislative changes were in step with the wider public mood. This was not the case in the UK, however, where a conservative post-war period saw change as forced by feminist action in the 1970s (Pope and Davies Reference Pope and Davies2025; Pope Reference Pope2011) – something that could be seen as almost inevitably prompting social backlash. In UK archaeology, the first comments on sexual discrimination began in the late 1960s, as social change was failing to find support in wider legislative change.
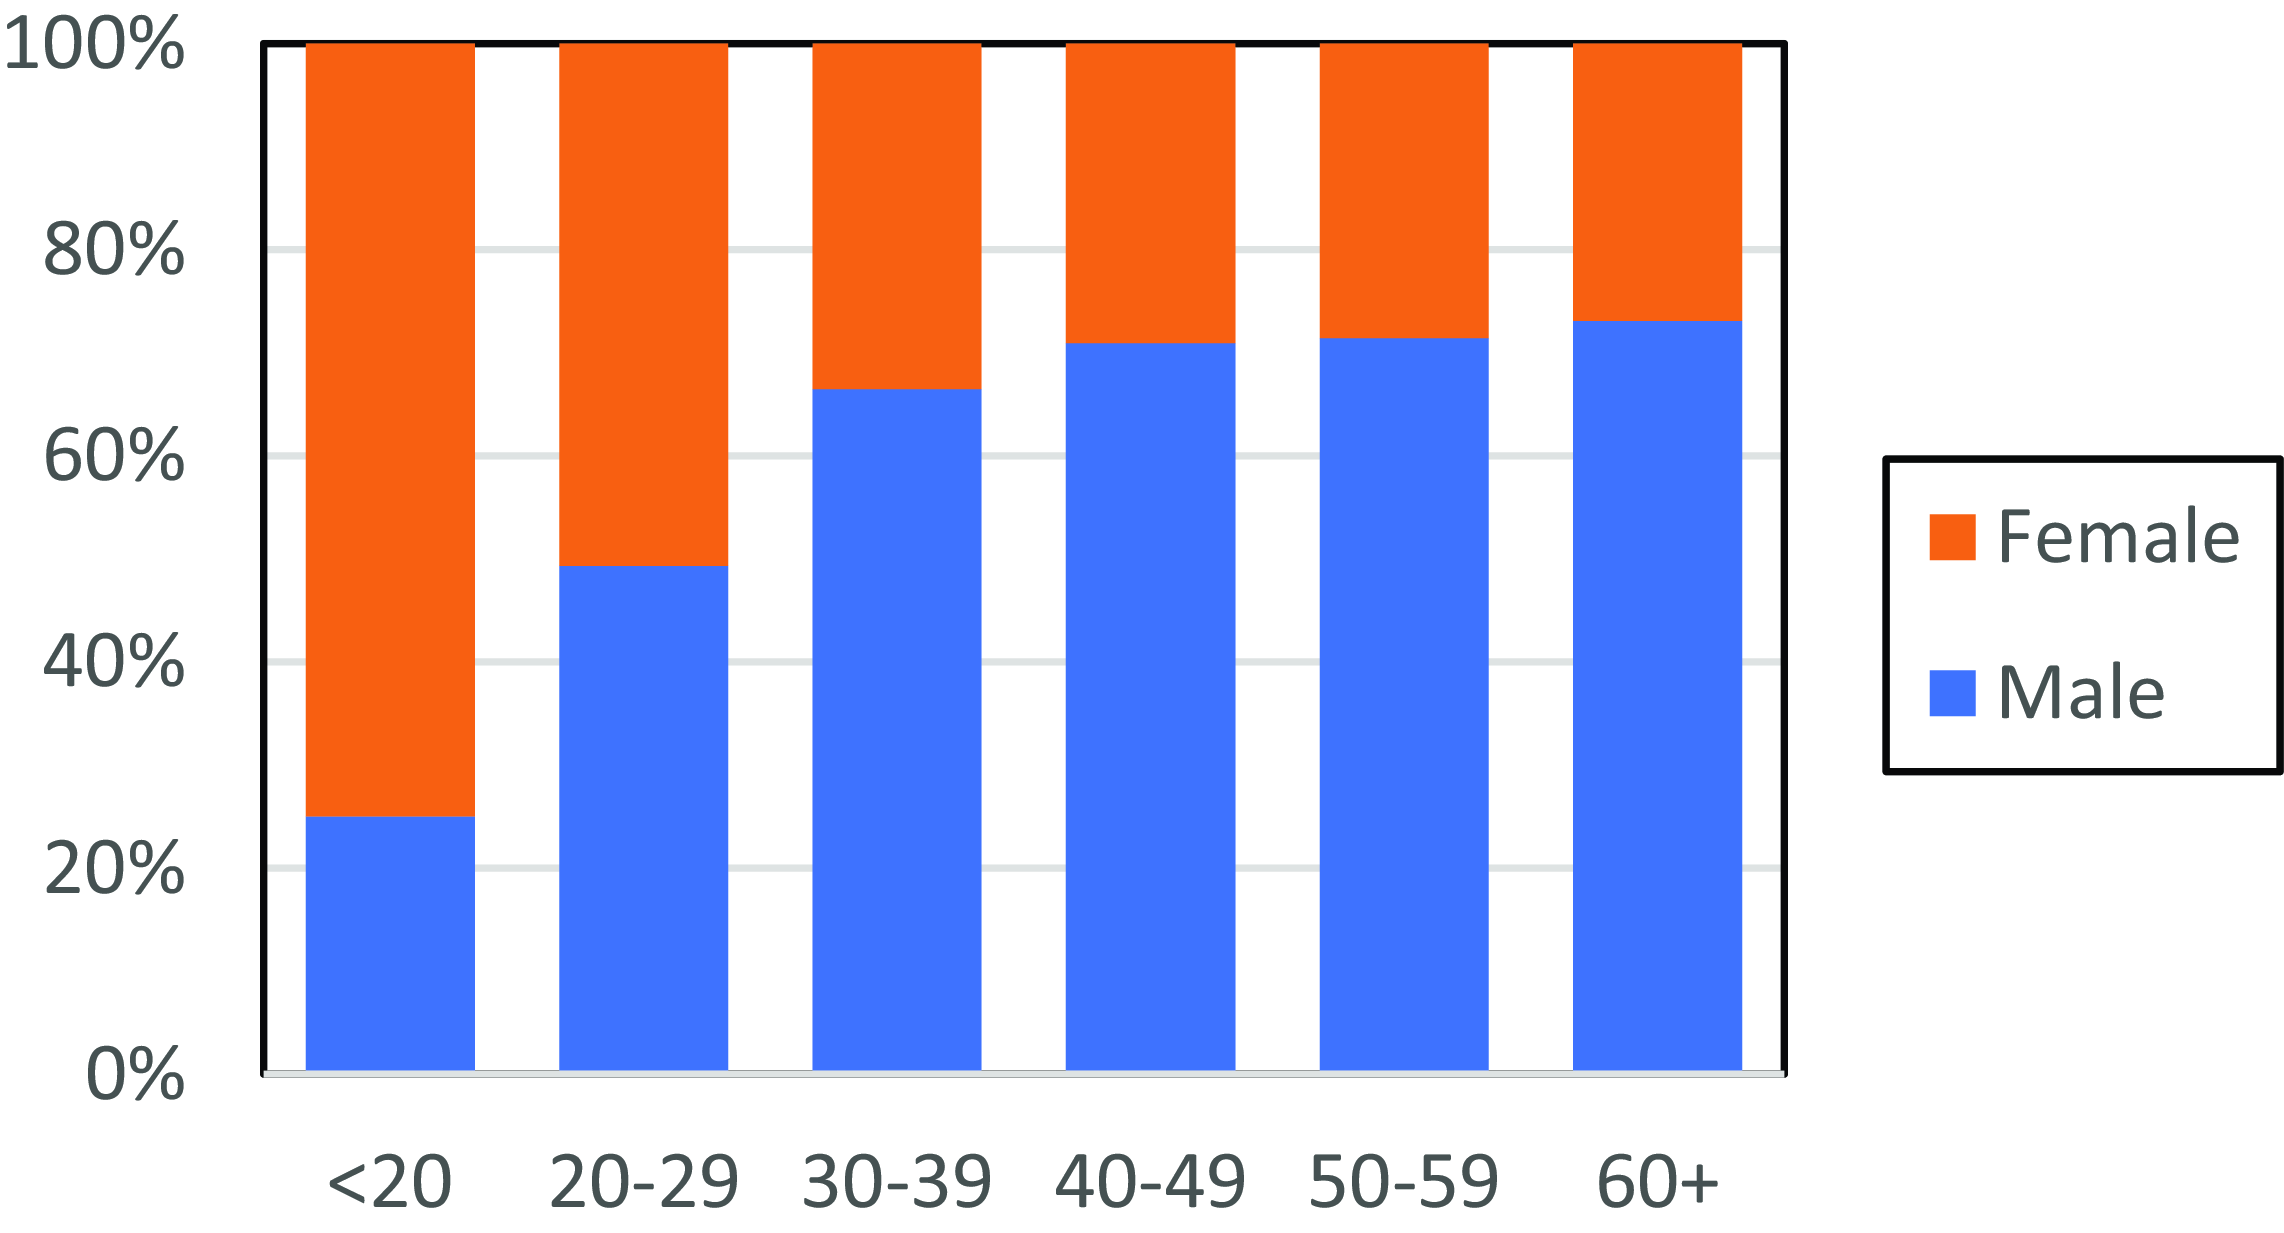
In her 1969 Galton lecture, Kathleen Kenyon (Reference Kenyon1970) first discussed issues around women’s promotion and access to management structures in archaeology, and the confounding nature of early marriage. There followed the first professional surveys conducted by RESCUE News (Dennis Reference Dennis1979; Plouviez Reference Plouviez1988) and a workshop on women in archaeology at the 1990 Institute of Field Archaeologists conference, with results published in the Institute of Field Archaeologists newsletter. Here, Gilchrist (Reference Gilchrist1991) discussed imbalances in employment structures, noting a lack of women in the English Heritage inspectorate, and the relative status and resourcing of female- and male- dominated areas. Deirdre O’Sullivan provided our first data on women’s participation across the profession, recording equal access to postgraduate study, yet only 20% of Society of Antiquaries fellowship and 13% of academic posts being women (O’Sullivan Reference O’Sullivan1991, fig. 1, fig. 5). O’Sullivan also recorded fewer women giving conference papers and women being less likely to be invited for questions by the Chair. Women were present but were only rarely accorded status in academia, learned societies or curatorial environments. With women comprising 50% of archaeology graduates since the mid-1970s (Fig. 1), the findings of the 1990 workshop were considered to be untenable and to require action.
Proportion of male and female archaeology undergraduates and postgraduates, c. 1970–1993.
Source: Macqueen Reference Rocks-Macqueen2015.

The Institute of Field Archaeologists Council established an eight-member Equal Opportunities in Archaeology Working Party in May 1990, with a view to tackling equality issues for women, minority groups, and archaeologists with disabilities. Convened by Elaine Morris, other members were Hal Dalwood, Sally Foster, Roberta Gilchrist, Mike Hall, Claire Halpin, Annie Milles and Deirdre O’Sullivan. The working party’s aim was information gathering. Four surveys were conducted [of employers (local government, archaeological units, archaeological trusts, national bodies, universities, and museums), learned societies, the Institute of Field Archaeologists, and individuals/volunteers] to provide both quantitative and qualitative data on the state of the sector, and 1,682 archaeologists responded (58% response rate). A report on the findings was prepared for the Institute of Field Archaeologists Council and submitted in July 1991, with a view to enabling ‘positive action’ to affect change. The following year saw the publication of a 20-page report on Women in British Archaeology, also known as the Morris Report (1992).
‘all is not well within the profession’
‘many [women] over the age of 30 do not continue in the profession’
‘the Institute of Field Archaeologists itself… appears to be performing in a role which reinforces the unequal condition of women’
(Morris Reference Morris1992)
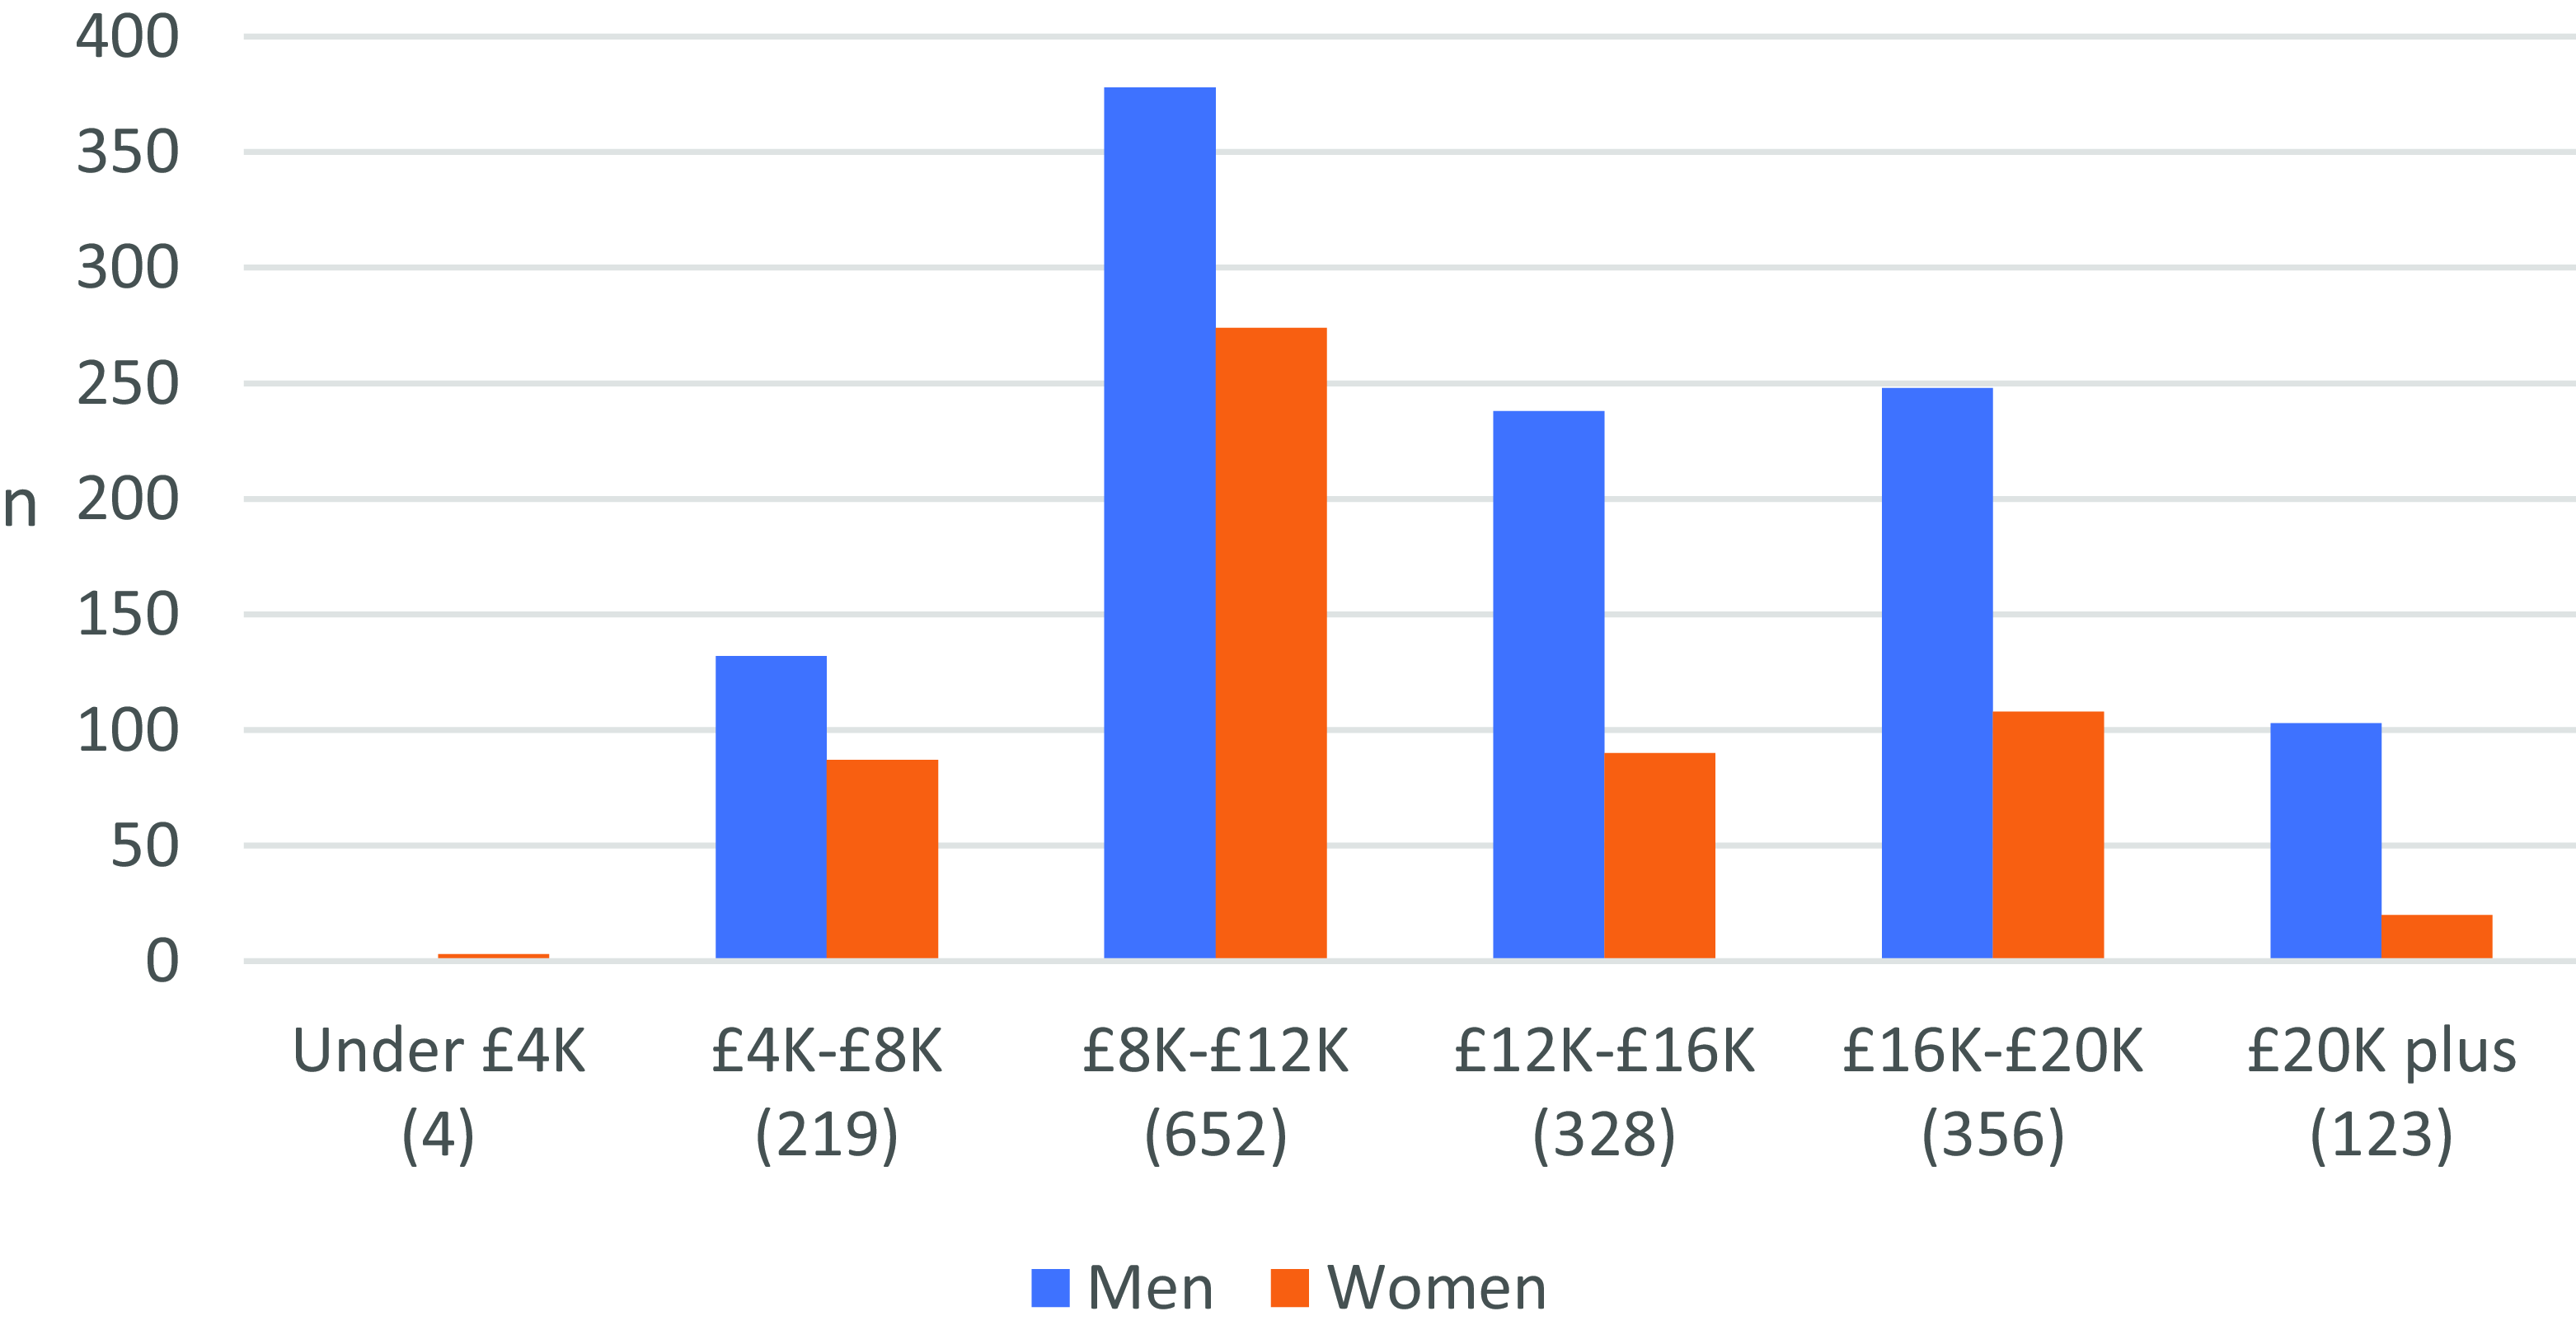
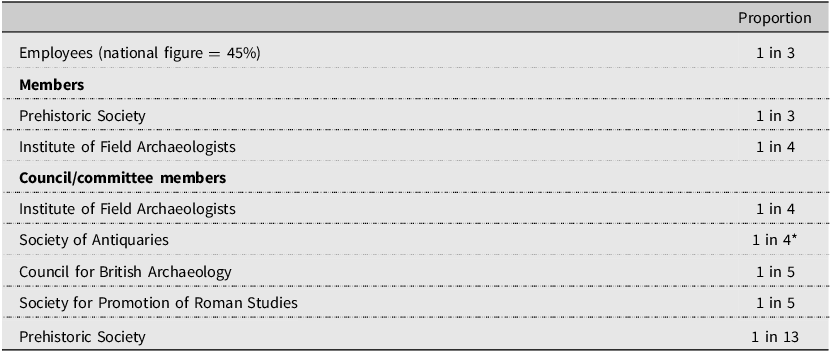
The Morris Report (n = 1,682) found women under-represented in the archaeological workforce (35%) at 10% below the national average (45%). Women received lower pay: Most women earned < £12,000 while most men earned > £12,000 (Fig. 2). Despite a tendency for women to hold higher qualifications (1992, 7) and progress within the Institute of Field Archaeologists, issues remained (Fig. 3a; Table 1). Discriminatory practices, including stereotyped tasks, and a sexist working environment were recorded, with few rights around parenting, and a notable contradiction: While 38% of employers recorded being open to flexible working, only 3% of the 1,090 job adverts in 1990 mentioned it (ibid., 3). Women held fewer senior roles, at 16% of the highest pay bracket (Fig. 2; Fig. 3b). Qualitative data provided by the personal survey (n = 209; 13% response, 59% male) found one in three had caring responsibilities and one in two had experienced sexual discrimination. Responses coalesced around six core concerns (Fig. 4): women’s low confidence in an androcentric workplace, everyday sexism, the low status of finds-work ‘trapping’ women’s route to management, discrimination around promotion, a lack of role models, and short contracts disadvantaging prospective mothers owing to a need for 2 years’ continual employment to qualify for maternity rights, with difficulties too around childcare.
Gendered pay differentials in UK archaeology (1990) – information from 113 employers (n = 1,682; 58% response rate).
Source: Morris Reference Morris1992, Table 1.

(a) Institute of Field Archaeologists and (b) academic archaeology in 1990.
Source: Morris Reference Morris1992, Fig. 12.

Women’s involvement in British archaeology (1990), society-reported (ranked)

* O’Sullivan (1991) found this to be one in five
Source: Morris Reference Morris1992, 4

The relationship of the Institute of Field Archaeologists with women members was complicated. While women were well-represented at higher levels, a data flaw caused the same woman to be counted again if she sat on multiple committees. The Morris Report noted that, where a democratic system was in place, as in election to council, there was almost proportionate representation (26–30% on the Council for 35% participation). Yet, the Institute of Field Archaeologists was not recruiting at membership level, proportionate to women’s involvement (Fig. 3b). It was not established whether this was due to women not applying, or not gaining entry, owing to a gendering of project work, or to an artefact of women’s under-representation in the growth areas of excavation and survey, with them being stereotyped instead into finds-work, which might limit advancement (Morris Reference Morris1992, table 5). The Institute of Field Archaeologists, recognized then as a male-dominated organization, was found itself to be procedurally active in perpetuating the problem. The Morris Report considered this detrimental to the profession and urged the Institute of Field Archaeologists to encourage more women to join, and to take action on the leaky pipeline: ‘the relationship of gender to professional achievement.. must be addressed’ (ibid., 11). The Morris Report was directly asking the Institute of Field Archaeologists to provide leadership around improving equality in the sector.
Critically, the Morris Report recognized equal participation in the 20–34-years age group, with more men by 35–45 years and ‘women over the age of 30’ not continuing in the profession (Morris Reference Morris1992, 10). The report stated, ‘this aspect needs quantifying and detailing to determine why such valuable and well-trained people are leaving the profession and how they can be convinced to stay or return’. The report recognized skilled women under-achieving professionally as a ‘clear waste of resources’ and source of economic loss. This period was critical for the modern sector, with the Planning Policy Guidance 16: Archaeology and Planning (PPG 16; a ‘polluter-pays’ principle for archaeology in the construction industry, that effectively built a privatized structure) having been established in the same year as the Morris Report (Darvill et al. Reference Darvill, Barrass, Constant, Milner and Russell2019). While larger, traditional employers [local authorities (LA), museums, and universities] responded positively to a need for equal opportunities, the newly established trusts and national bodies lacked policy (Morris Reference Morris1992, 3). It noted a common belief that archaeology required ‘brute strength’, with women not being suited to the job – as was often heard by 1990s students. At the start of the PPG 16 era, the Morris Report recognized that ‘women cannot as easily move around the country if family commitments are strong’, but the PPG 16 ‘boom’ was not designing in the needs of women workers (ibid., 11; Howe Reference Howe1995).
What is needed is information about the levels at which women are dropping out or not applying for promotion. Obviously there is a big fall-off immediately after leaving university which needs addressing immediately. But what about the well-qualified women who do exist in the profession – at which stage are they leaving the profession or getting stuck in the promotion ladder? Is there any evidence that women do not move about the country if family restrictions are strong? Do women always defer to the job of their partners? What happens in the cases where both partners are working – whose career comes first and why?
(Morris Reference Morris1992, 11)
In conclusion, at the point of PPG 16, despite 88% of employers self-identifying as ‘equal opportunities employers’, the Morris Report found ‘a lack of equal opportunities for women in the archaeological world’, resulting in economic loss for the sector (Morris Reference Morris1992, iv, 3). The report corroborated women’s experiences on equity issues, regarding gendered access to the profession, differential pay rates, promotion rates, and status attainment – a ‘leaky pipeline’ or ‘hostile obstacle course’ leading to a lack of senior women who might act as role models, linked to a paucity of flexible working/childcare facilities. Furthermore, and importantly, the iteration of what Morris (Reference Morris1992) called the ‘chilly climate’ brought into focus informal practices and implicit policies that disadvantaged women – i.e., stereotyping, devaluation and under-resourcing of women’s work/achievements (e.g. considering finds-work to be lower status), the use of patronizing language, the emphasizing of physical and sexual (rather than professional) attributes, and the exclusion of women via mechanisms of interruption, sexist humour, and in characterizing those who spoke out as ‘hysterical, paranoid, over-reacting, humourless’ (Morris Reference Morris1992, 10). The report concluded that the archaeological profession, while ahead of other fields regarding senior Institute of Field Archaeologists roles, overall remained ‘biased against women due to the lack of equal opportunity conditions encountered in employment’ (ibid.).
The Morris Report’s recommendations to the Institute of Field Archaeologists Council were to form an Equal Opportunities Committee. This comprised the Institute of Field Archaeologists chair/secretary, careers and publicity officers and eight members focused on tackling eight core areas (Appendix) to ‘provide Council with advice about how the Institute can change the imbalance’ by initiating ‘programmes aimed at resolving inequalities’, monitoring their performance and providing advice on good practice. The aims of the committee would be to review, research, and monitor (Morris Reference Morris1992, iv, 1, 11). The Morris Report outlined a 5-year strategic programme, with three core goals: (1) to raise awareness regarding a need for equal opportunities; (2) to encourage women, people with disabilities, and ethnic minorities to ‘offer their skills and abilities to the profession’; and (3) to monitor progress. The 1990 Institute of Field Archaeologists Equal Opportunities Working Party became the Institute of Field Archaeologists Equality Opportunities (EO) Committee, reporting to the Standards Committee. Activity was to focus around the eight recommendations for positive action – one the responsibility of each committee member – expecting this to morph as progress was made. Following establishment of the EO Committee and publication of the Morris Report, an equal opportunities policy and guidelines were adopted by the Institute of Field Archaeologists Council in 1993 and published in 1994 (Institute of Field Archaeologists 1994). Real progress was made between 1990 and 1997. By 1998, however, this was all to change.
A new era. Dismantling the equality and diversity agenda (1998–2006)
In 1995, a much smaller survey, with detailed qualitative data from 70 respondents (10% response rate),Footnote 3 had reaffirmed the imbalance of one woman to every two men; a lower average female salary; and more women in part-time posts (Reeve Reference Reeve1995). In 1997, the 1993/94 policy was attached to Principle 5 of the Institute of Field Archaeologists Code of Conduct. Again, progress was made. That year, led by Rachel Edwards, the EO Committee undertook its planned follow-up survey [667 respondents: 20% individual (n = 436), 31% student (n = 65) and 34% employer (n = 166); Aitchison (Reference Aitchison1999, 103)]. The findings of the 1997 survey, however, remained unpublished.Footnote 4 Instead, that year saw planning for the first Profiling the Profession – the brainchild of Morris (Reference Morris1992, recommendations 7–8). In 1998, the EO Committee’s objectives were to ‘contribute to analysis or profile of archaeologists in Britain’ and to ‘provide advice and guidance to the profession on EO matters’ with a new ‘model policy’, for use by members, requested from the EO Committee by the Standards Committee, submitted to the Council in December 1998 and published in the 1999 yearbook (Institute of Field Archaeologists 1999, 14). Unfortunately, publication of the policy statement seems to have been the only progress that was by then required.
This idea from Morris (Reference Morris1992) (to review, research and monitor) was taken forward but turned into a more passive exercise, with no impetus to analyse nor to address findings. Morris (Reference Morris1992) had seen a thorough capturing of quantitative and qualitative data to aid a professional, industry-standard understanding of gendered experiences in the profession and those areas requiring change-oriented policy. It had seen wide-ranging data capture (e.g. contract type, job title, union membership, pay differentials, pensions, discrimination experiences, and council and committee profiles). In contrast, the new Profiling the Profession saw information on the female experience radically reduced (number/age statistics by job role, contract type, and salary) with a confusing focus on the small Theoretical Archaeology Group (TAG) survey (Reeve Reference Reeve1995; n = 70) rather than the Morris Report’s more comprehensive findings (n = 1,682). The EU funding suggested by Morris (Reference Morris1992) was retained as an aim, finally achieved in 2006, but instead of advancing an agenda for minority groups, women, and people with disabilities, it was ultimately achieved only to fund the Profiling the Profession exercise itself. The Strategic Plan for 2000–2010 of the Institute of Field Archaeologists did not mention equality or diversity, and under ‘Report of the EO Committee’, we found ‘No report required.’ (Institute of Field Archaeologists 2000).
Perhaps unsurprisingly, the Equal Opportunities Committee became less active during this period. In May 2000, the committee voted 3:2 to disband, in favour of an Officer role – with the Chair, Rachel Edwards, having had the deciding vote. The Equalities Officer was to work across all committees, as a point of contact, and could call a working-party to deal with any specific needs that arose. The 1991 vision of a team of eight, with EU funding, at the Institute of Field Archaeologists core, working to achieve sector equality, was replaced with one unresourced role, reporting to the Personnel lead. Kayt Brown (now Hawkins) was formally elected to both roles in 2003; she had been volunteering in an unofficial capacity on equality since 2001, was pregnant on election and was on maternity leave until late 2004, with no cover; no formal handover; no defined brief, despite one suggested by the committee in 2000; no budget; and no assistance, despite the Herculean task ahead. The Equality Officer’s plan was to update EO policy in line with changing legislation, prepare supporting guidelines, and to establish joint projects with other organizations. Without resource, it could not be delivered.
Of the Morris Report’s recommendations, only the first was achieved, with an EO policy statement added to the Code of Conduct in 1997. Investigating equality for people with disabilities and ethnic minorities was not achieved.Footnote 5 No career-based training for women was arranged, nor was manager training, and despite the officer approaching the Council, plans were mothballed. The officer also flagged the issue of maternity rights, but employers showed a lack of willingness to investigate part-time and/or job-shares for site staff. It is regrettable that, even though the Institute of Field Archaeologists had been a paid-up member of the Equal Opportunities Commission (EOC) since 1997, equality seems to have become little more than a tick-box exercise by the early 2000s. The only of Morris’s recommendations taken forward were recommendations 7 and 8 – gaining EU funding for sector surveys: Profiling the Profession. The Equality Officer left in 2005/6 and was not replaced with a new officer in that role. In practice, the role had been an example of what we now call a ‘glass cliff’ – appearing to be a promotion, with responsibility for active leadership, yet lacking the resources to affect change – i.e., designed to fail. In 2006, the Institute of Field Archaeologists became the Institute for Archaeologists, and the EO post was dropped.
It was just 2 years after the Institute of Field Archaeologists equalities role ended that the voluntary group British Women Archaeologists was established – these were younger women organizing outside of formal structures in the absence of professional progress. Having now gained an understanding of the work of the Morris Report on capturing the female experience in the early 1990s, our next section will analyse the employment situation for women in archaeology, as detailed by data from the first three Profiling the Profession surveys (Aitchison Reference Aitchison1999; Aitchison and Edwards Reference Aitchison and Edwards2003; Aitchison and Edwards Reference Aitchison and Edwards2008).
Analysing Profiling the Profession (1999–2008)
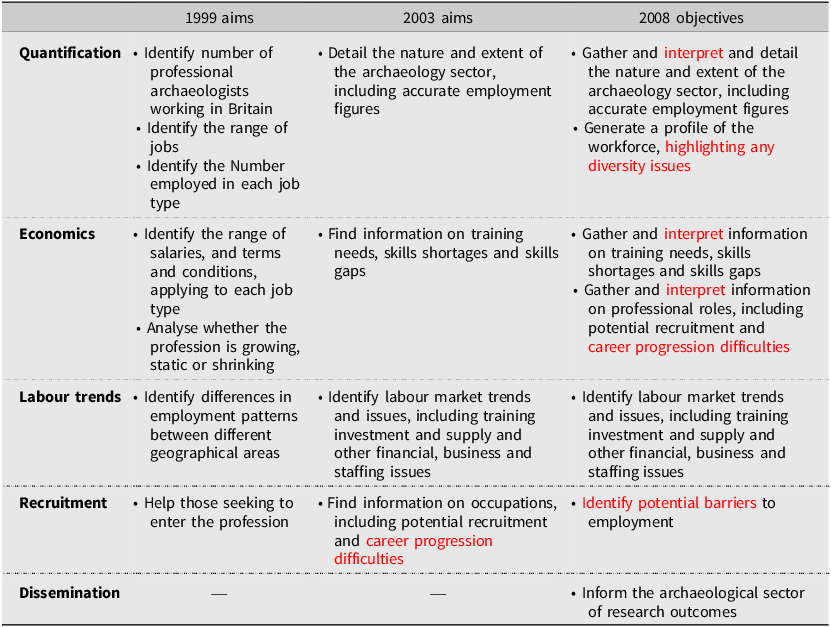
Despite the unfulfilled recommendations of the Morris Report from the Institute of Field Archaeologists, the first two Profiling the Profession exercises (1999; 2003) focused primarily on job types and who was in those jobs, and identifying any skills gaps or shortages (Table 2). Ultimately the Morris Report had gained limited traction in focusing the attention of the Institute of Field Archaeologists on the economic importance of equality and diversity matters, despite the EO Committee’s objectives in 1998 to contribute to the Profiling project. In 2000, following completion of the first Profiling exercise, the EO Committee disbanded. EO Committee Chair Rachel Edwards was brought in for the second report in 2003, which saw the integration of data gathering around career progression. Only by 2008, and apparently as a requirement of the EU funding, was there mention again of diversity (Aitchison and Edwards Reference Aitchison and Edwards2008, 11). In this section, we analyse the data held within Profiling the Profession across 1999–2008 (Aitchison Reference Aitchison1999; Aitchison and Edwards Reference Aitchison and Edwards2003; Aitchison and Edwards Reference Aitchison and Edwards2008) to provide a social assessment of women in archaeology (their recruitment, retention, and progression) and related diversity issues within the sector.
Aims of Profiling the Profession 1999–2008. Note the difference in active and passive research aims revealed in language use in the 1999 and 2003 reports, compared with the 2008 report. Only by 2008 was there a clear objective to interpret results and disseminate findings.

Access to the field
With 2,106 respondents, representing 74% of archaeologists (Aitchison Reference Aitchison1999, 16), the first Profiling survey repeated the results of Morris (Reference Morris1992) on women’s involvement: women held 34% of full-time contracts, 3% lower than the national average, with more working part-time: 9% (almost one in ten in 10) compared with 3% of men. Local government and national heritage agencies saw a gender division in line with the national average (63% male, with women in local government least likely to encounter sex-based discrimination around maternity and promotion, and slightly more likely to hold senior roles). Meanwhile, senior roles in universities, national heritage agencies, national museums, and societies were mostly held by men (Fig. 5). Universities in particular had more men over 40 years than the national average, with only 3% of professors being women as noted nationally in 1990, and just two women archaeology professors by 1998 (Champion Reference Champion, Diaz Andreu and Stig Sørensen1998; Morris Reference Morris1992, Table 10).
Gender/age and the profession in 1999 (blue: men; red: women; n = 2,106).
Source: Aitchison Reference Aitchison1999, Table 25.

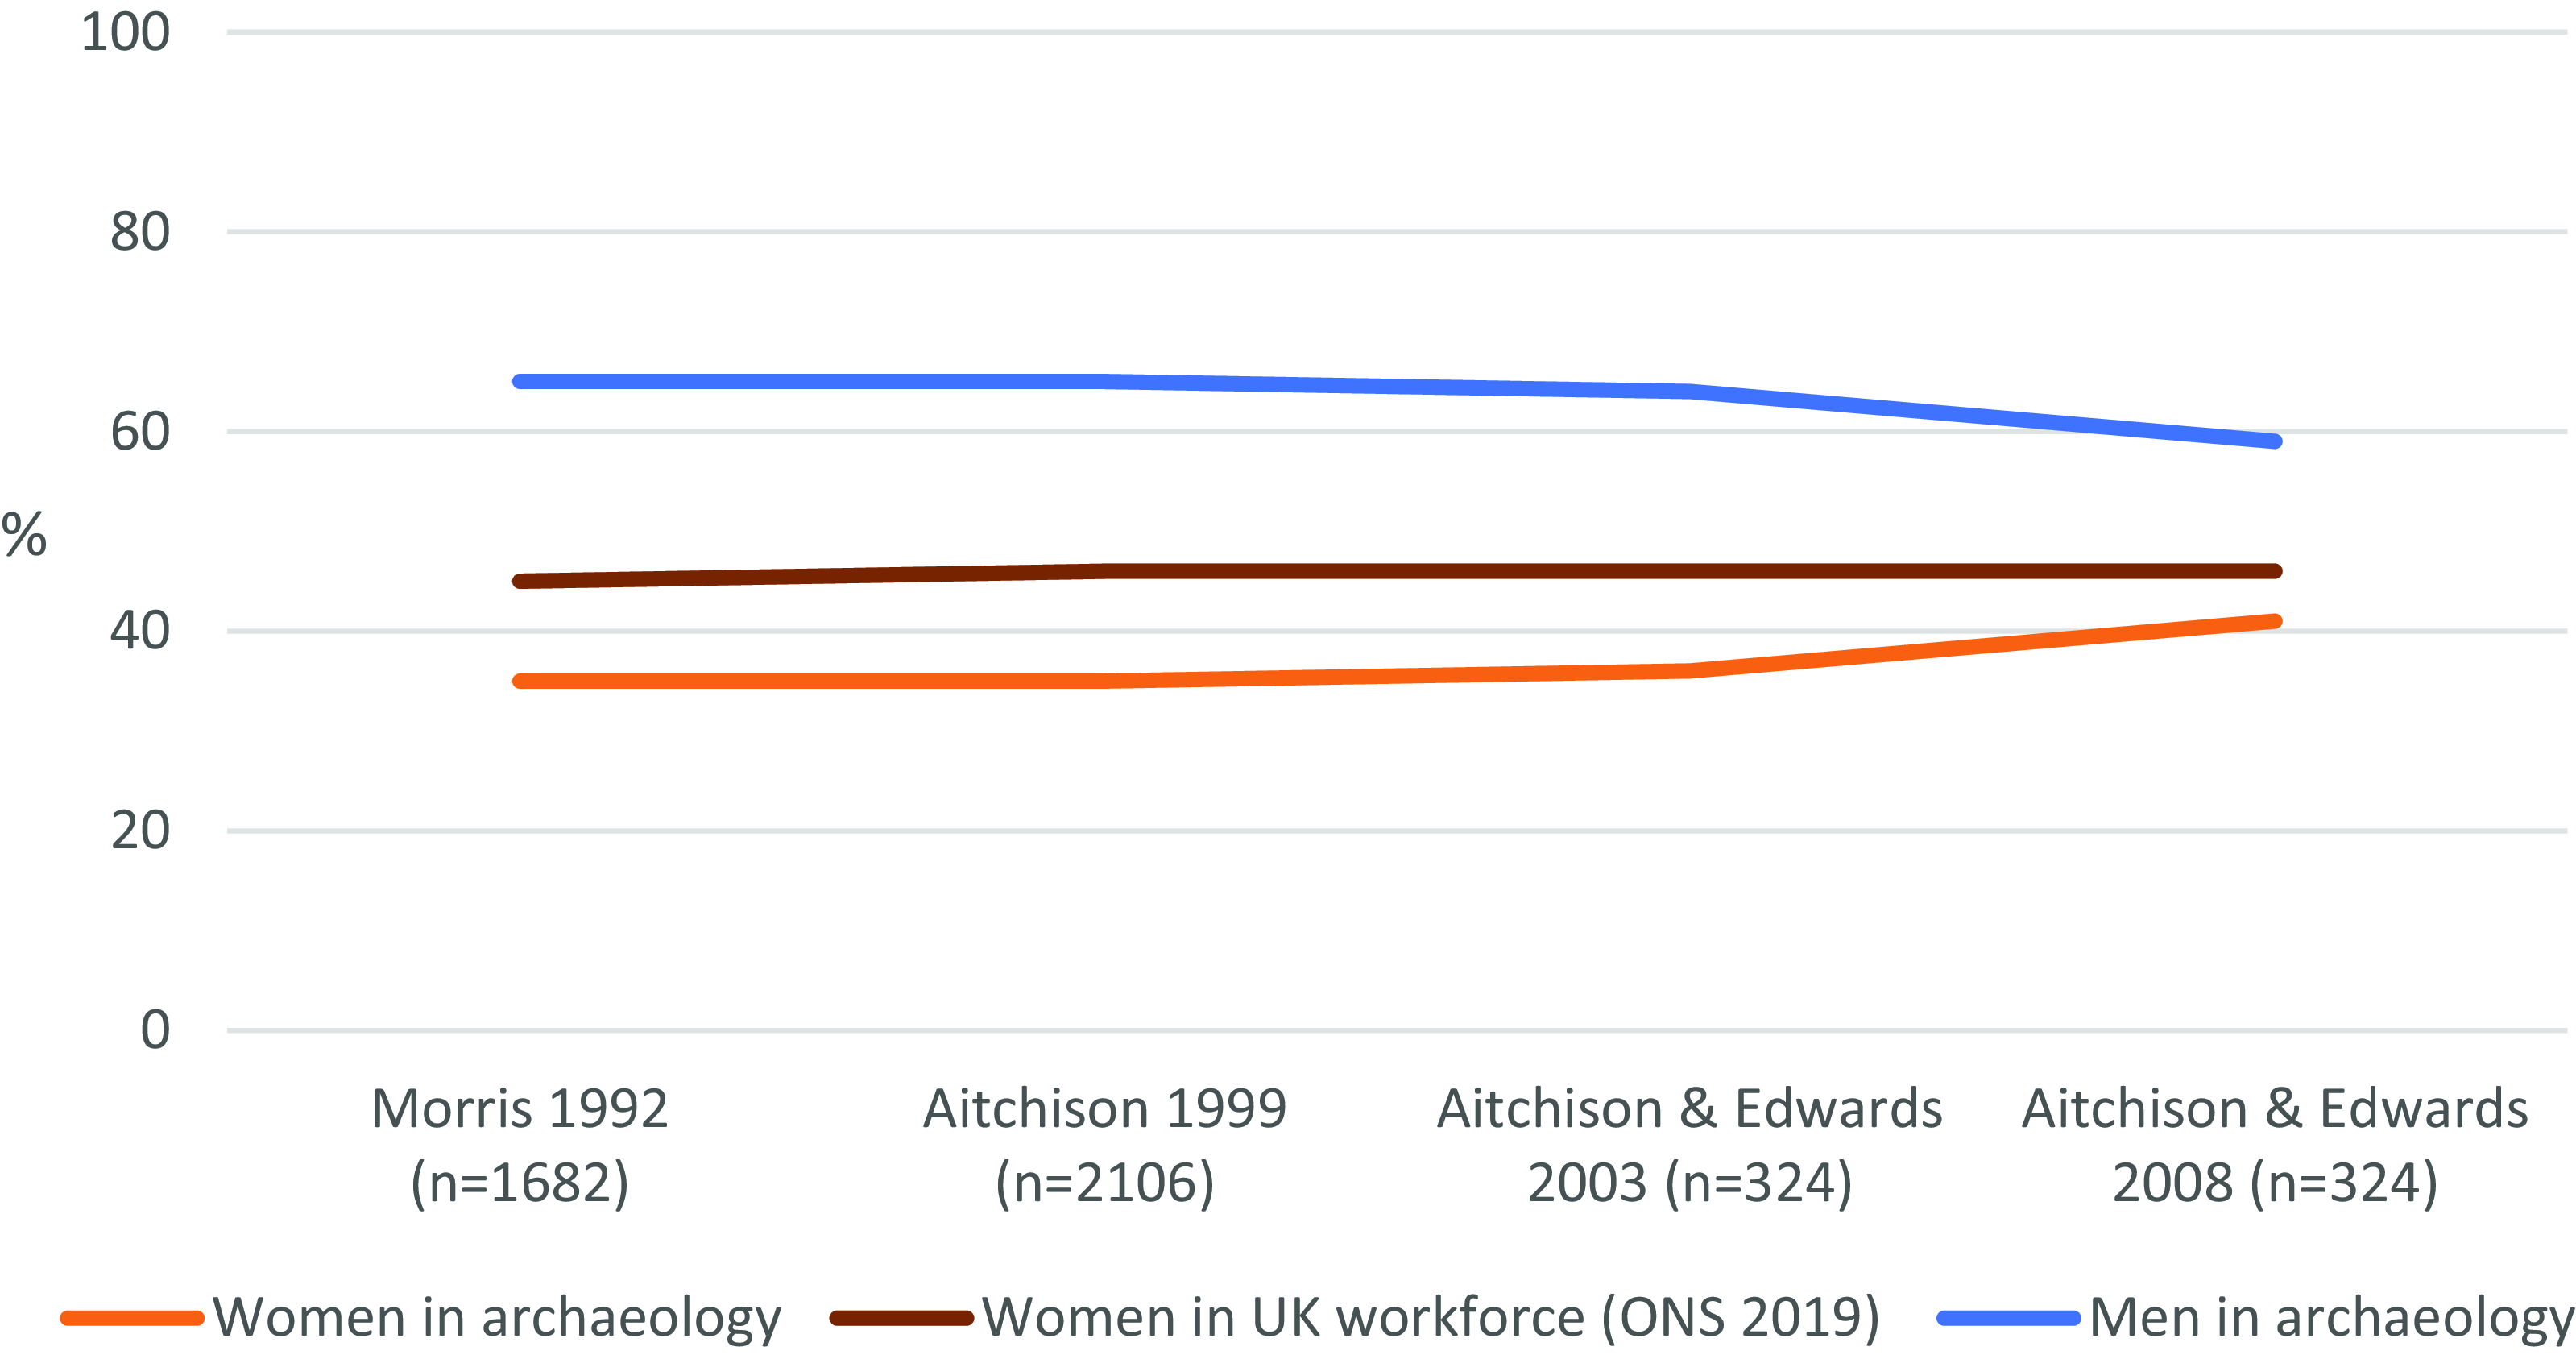
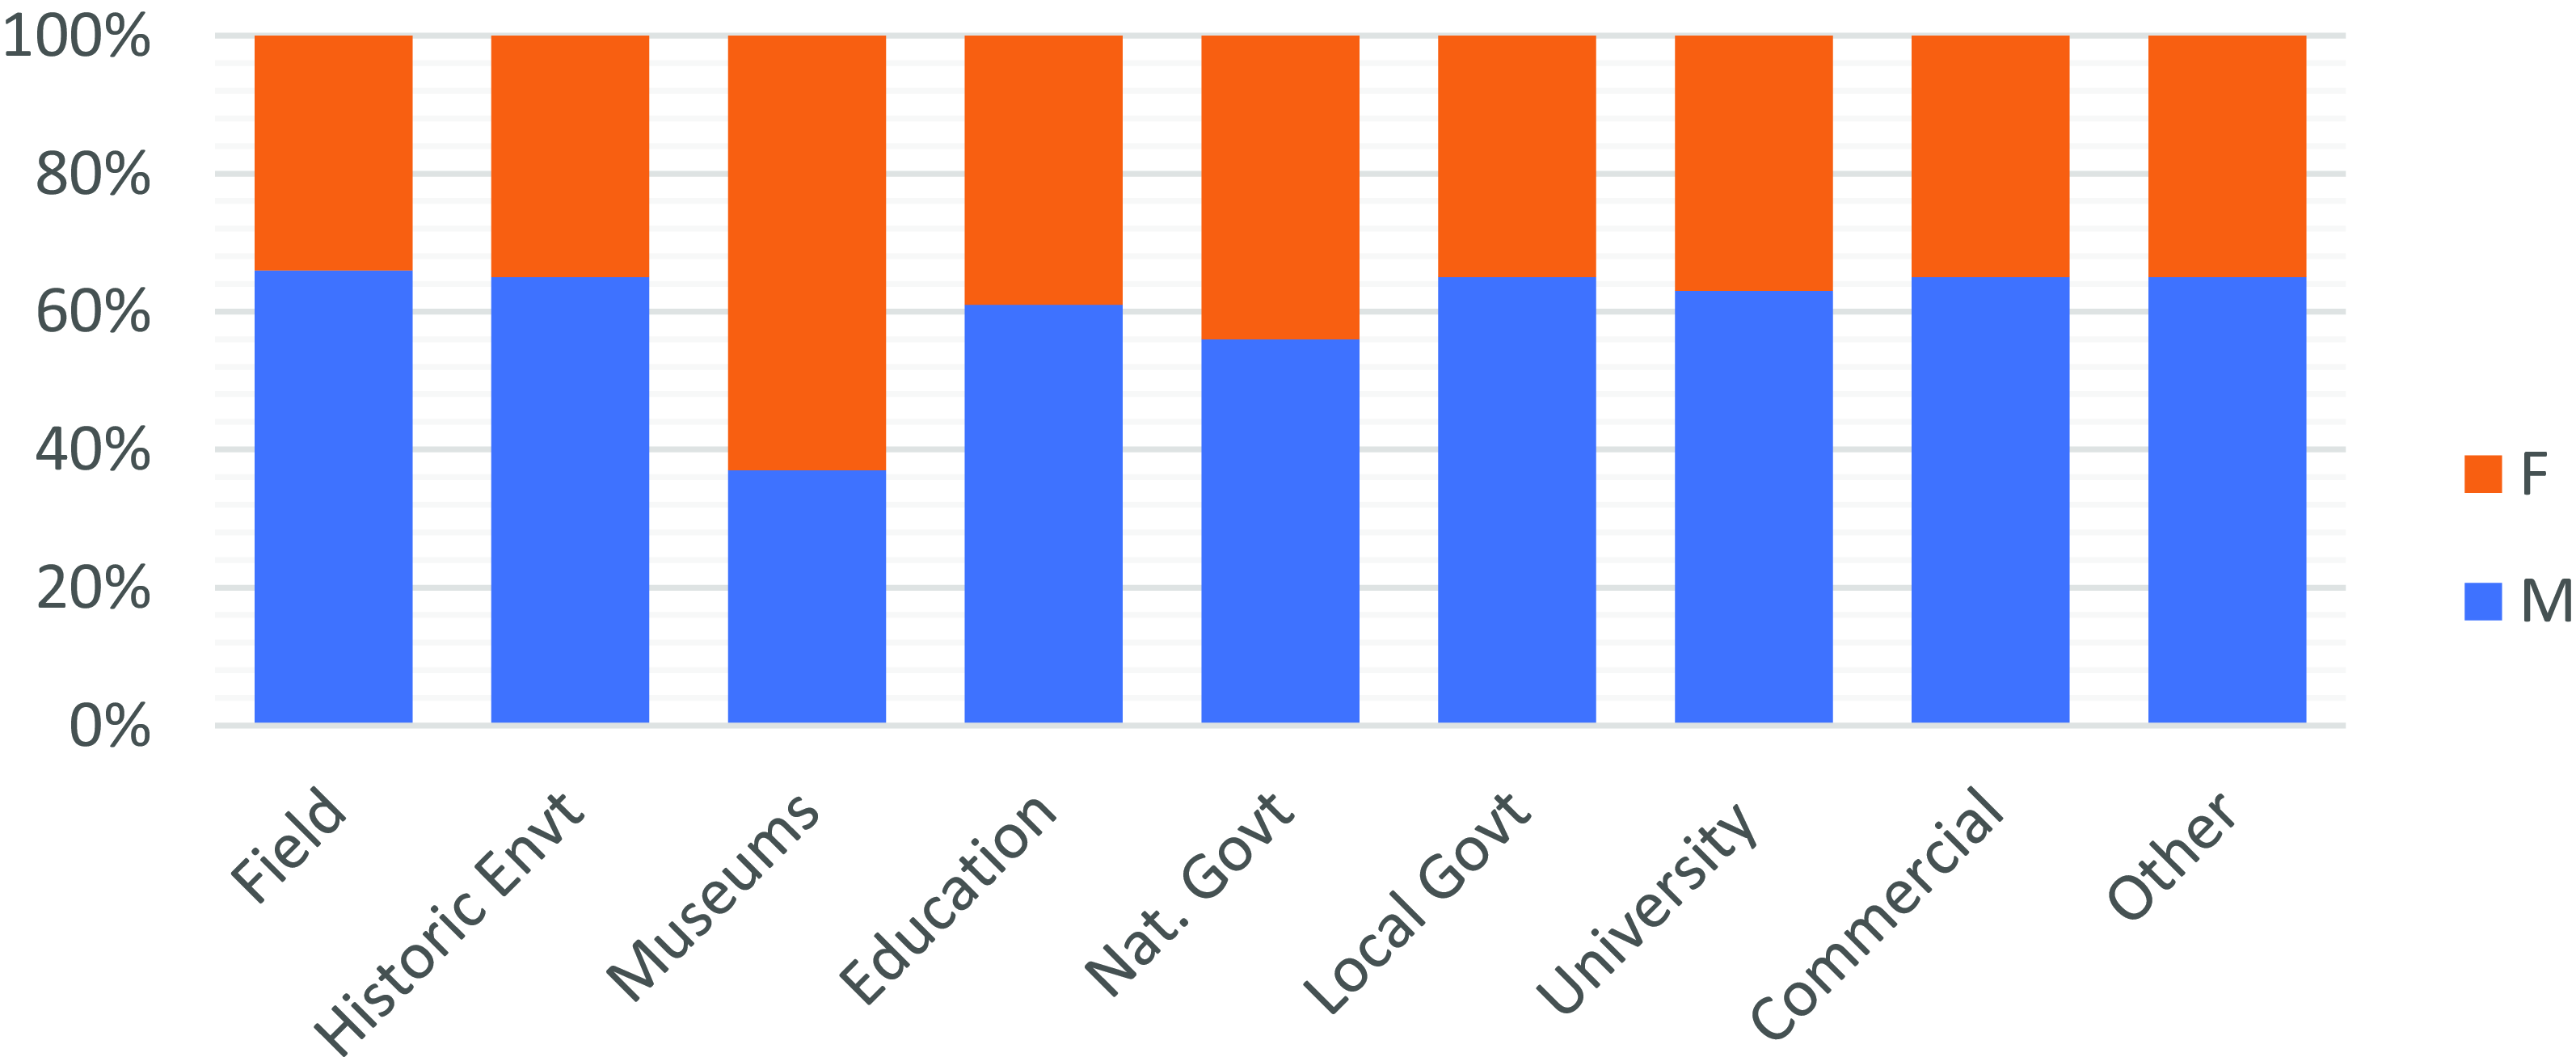
By 2002/3, there had been 1% growth in women’s access to the sector since 1990; it was by then at 36%, reflecting a static 10% below the proportion of women in the UK workforce, suggesting that something was very clearly wrong in archaeology. By the early 2000s, as women’s access remained at 1:2 more generally, women comprised 63% of staff in museums, and remained well-represented in consultancy (finds) work (Fig. 6). By 2008, women’s access to the sector finally improved by 5% (to 41%) (Fig. 7), but it had taken 16 years to do so and was still 5% below the national average – in fact, still 4% lower than the 1992 national average, despite women’s equal access to higher education since the year 2000 (Pope Reference Pope2011, 79). Fieldwide, little had changed since 2003: Slightly more women were in historic environment roles and they were over-represented in museums, as all other areas continued to hover around the 60:40 mark (Fig. 8).Footnote 6
Gender audit of UK heritage sector in 1998 (n = 2,106).
Source: Aitchison Reference Aitchison1999, Table 24.

Women’s access to the profession, flatlining across the 1990s and early 2000s (despite women’s equal access to higher education).

Gender audit of the UK heritage sector in 2003, by role (columns 1–4) and by organization (columns 5–9) (n = 1,985).
Source: Aitchison and Edwards Reference Aitchison and Edwards2003, Tables 21–22.

‘Field versus finds’ and women’s underemployment
In 1999, while most areas reflected the national 1:2 imbalance, the contract sector was displaying a particular issue, with 80% men in ‘other commercial’ and the majority of ‘consultants’ being women (Fig. 6) – code it seems for women needing to self-employ as finds specialists and retention of the task-stereotyping reported by Morris (Reference Morris1992), as present since the 1970s (Hawkins Reference Hawkins2021; L. Brown pers. comm.). Aitchison (Reference Aitchison1999) found the commercial sector more equitable for those in their 20s, after which a clear shift occurred, with more men/women over 30 years in the contract sector and ‘consultancy’, respectively (Fig. 5): a first indication that women archaeologists of the 1990s were tailoring their career to caring responsibilities and/or the ‘chilly climate’. Despite the exciting new era of PPG 16, the commercial sector had not designed in the needs of women employees. The first Profiling the Profession revealed 1990s archaeology to be an era of fewer women, who were paid less, often having to work specific roles to remain, with access to senior posts limited beyond local government. Profiling the Profession had found no growth in women’s access to archaeology across the 1990s, with the one-in-three figure repeating the 1992 Morris Report findings.
An issue in the 2000s was women’s continued under-employment. Support staff, mostly in government and commercial organizations, were markedly gendered at 70% female in 2002/3 (n = 186) and 72% in 2007/8 (n = 122). Half of support staff had degree-level or postgraduate qualifications, yet as a population they earned 20% less than non-support staff (11.5% in 2008). The age profile of support staff inversely reflected the more usual trend (Fig. 9d and 9f) – i.e., this is where older women resided. Support staff in archaeology were older than the national average in the over-50-years category (Aitchison and Edwards Reference Aitchison and Edwards2008, 61), confirming that some of our ‘lost’ women were to be found here, in the lower-paid support roles. Critically, we do see retention of women who entered support roles in their 30s (2002/3 population) and into their 40s and 50s (Fig. 9). In 2002/3, 37% of support staff worked part-time, compared with just 11% of non-support staff (1999). In the 2000s, women over 30 years accepting lower-paid roles, relative to their qualifications and skills, may have been one way to manage the gendering of UK parenting.
Sex/age profiles in UK archaeology 1997–2008.
Source: Aitchison and Edwards Reference Aitchison and Edwards2003, 22, Tables 17–18 and 29; Aitchison and Edwards Reference Aitchison and Edwards2008, Table 33 and 52).

Pay, part-time working and self-employment
In the late 1990s, while the lowest quartile and upper 10% (managers) saw relatively equal pay for men and women; in general, full-time working women saw a pay gap of up to 10% (Aitchison Reference Aitchison1999, 42; n = 1,698; Aitchison and Edwards Reference Aitchison and Edwards2003, 42). At this time, women held only one in three full-time posts, compared with 64% of part-time contracts, with 10% of women archaeologists working part-time, compared with just 3% of men (Fig. 10). The number of men working part-time increased in 2003, towards relative equality with women, but by 2008, most part-time contracts were again with women. The proportion of women archaeologists working part-time increased over 1999–2008 (from 9% to 30%) – with a similar, if less marked, trend for men (increasing from 3% to 10%).
Gender and part-time working 1998–2008.
Source: Aitchison Reference Aitchison1999, Table 41; Aitchison and Edwards Reference Aitchison and Edwards2003, Table 68; Aitchison and Edwards Reference Aitchison and Edwards2008, Tables 93, 156.

This increase in women working part-time seems to have been linked to the 2008-9 recession, as it subsequently levelled off again in later surveys. While the 2010 BWA survey suggested that any gendered impact of the recession was negligible, according to employees themselves, the Profiling the Profession data revealed a clear gendered impact, with more women taking part-time roles. This was despite women in the BWA survey generally revealing greater confidence in their employers than the men, although the minority with least confidence had been markedly gendered female. This general trust in employers betrays a tendency it seems for individuals to take personal responsibility for their employment circumstances, rather than to acknowledge the wider, often gendered, employment trends at play.
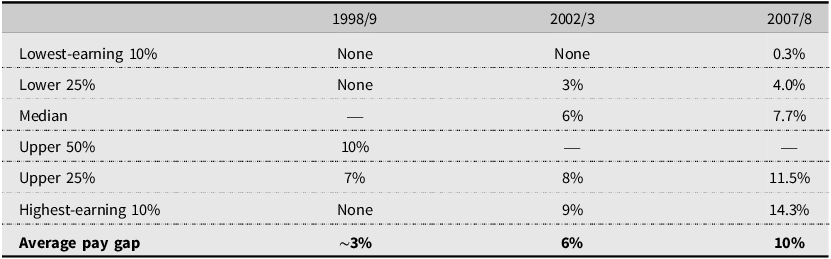
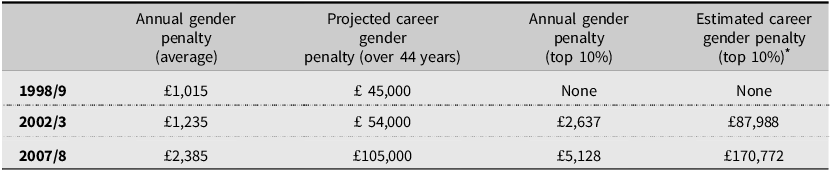
As for self-employment in the 2000s, while this attracted some women over 35 years, it was more common for men in their late 40s to early 50s (Aitchison and Edwards Reference Aitchison and Edwards2008, Figure 9). We might understand this distinction as women in their 30s going freelance to manage caring responsibilities, versus older men moving to better paid consultancy roles. This gendering of higher-paid consultancy roles goes some way towards explaining the gender pay gap (Hawkins Reference Hawkins2021). However, this is only part of the story, as drilling down into the data also reveals pay disparity in like-for-like roles; between 1997 and 1999, both the lowest quartile of earners and the top 10% of salaries were ungendered. By the early 2000s however, male managers had seemingly begun to award themselves more money than their female peers (Table 3). By 2008, the average archaeological full-time salary was £2,385 less for women than for men – an average pay gap of 10% that constitutes an average gender penalty of ∼£105,000 across a 44-year career, and higher for the top earners (Table 4). For those women who managed to see retention in the 2000s profession, they endured not only a pay gap but a savings/leisure gap and, most critically, a pension gap, achieved by a tendency towards under-employment relative to their qualification and skills, coupled with under-promotion.
Growth of the gender pay gap in UK archaeology 1998–2008, from full-time comparative salaries

Sources: Aitchison 1999, 42 (n = 1,698); Aitchison and Edwards 2003, 43 (n = 1,842); Aitchison and Edwards 2008, Table 74 (n = 2,237)
Gender pay gap in UK archaeology 1998–2008, based on full-time, comparative salaries

*Calculated at 20 years of lower wage average + 24 years at higher
Sources: Aitchison 1999, 42 (n = 1,698); Aitchison and Edwards 2003, 43 (n = 1,842); Aitchison and Edwards 2008, table 74 (n = 2,237)
Maternity pay
In the Profiling the Profession 1999 survey, 81 organizations gave information on the amount of paid maternity leave provided (above the statutory fortnight); this averaged 4–5 months but ranged widely from between 6 and 63 weeks (Fig. 11). What this revealed was that, while women archaeologists working in local authorities were more able to wean their baby and provide their body with time to heal from the impact of childbirth and nursing prior to returning to work, this was not the case in other areas of the sector. Some women in the commercial sector were experiencing just 6 weeks of leave, while only 50% of employers were active on providing paternity leave, at an average of 6 days (Aitchison Reference Aitchison1999, 45–46). In 1999, Profiling the Profession recorded women fieldworkers as entitled to 14 weeks maternity leave without being sacked, providing they had been employed for 26 weeks prior to a date 15 weeks before the due date (Aitchison Reference Aitchison1999, 45). After these 14 weeks, they were entitled to Statutory Maternity Pay (£223/month, 15% of the contemporary average salary) for a further 18 weeks, meaning that a new mum required independent means or dependency on a partner’s income.
Average weeks of maternity leave in UK archaeology 1999.
Source: Aitchison Reference Aitchison1999, Table 68.

Local authorities were kinder: After a year as an employee, a new mum was entitled to 6 weeks at 90% pay [including Statutory Maternity Pay (SMP)] and a further 12 weeks at 50% pay (plus SMP), meaning an local authority archaeologist could have 8 weeks leave, prior to pay being docked. In 1999, an EU directive gave everyone the right to 13 weeks unpaid parental leave. By 2003, SMP had increased to a still paltry £300/month (17% of the contemporary average salary). As noted above, in the 2000s, the Department for Business, Enterprise and Regulatory Reform (BERR) advised employers to supplement SMP to help retain female employees, typically manifesting as SMP + 50% salary for 6 months. By 2008, the employers of just 67% of archaeologists said they provided paid maternity leave above this, with one in five employers seemingly inactive around the BERR recommendation.
Retention in the 2000s
Age-profile data for 2002/3 reveal that, while initial access to the profession was relatively equal for (white) female archaeologists in their 20s, those over 30 years (one in three) continued to experience a male-dominated profession (Fig. 12). In 1998/9, while the proportion of women was below the national average, the age distribution was comparable to the national trend, with a peak of women in their 30s (Fig. 9a–b). By 2002/3, however, figures show that only half of those women were retained into their 40s, and instead, we find an increase in younger women entering the field (Fig. 9c). In 2007/8, the pattern repeated, with a high proportion of women now in their late 20s, but with a more rapid fall-off beyond the age of 29 years than in 2003 (Fig. 9e). Compare this with the curve of national age trends in 2013 (Fig. 13). By the early 2000s, only museums and local government were modernizing as workplaces for women (as evidenced in Fig. 14), as part of wider changes in the civil service. Yet, even in museums, the proportion of women fell off sharply after the age of 50 years (Aitchison and Edwards Reference Aitchison and Edwards2003, 24).
Gendered access to the profession, 2003.
Source: Aitchison and Edwards Reference Aitchison and Edwards2003, Table 17.

Women in the UK workforce by age.
Source: Office for National Statistics (ONS), 2013.

Gender/age and the sector in 2003 (blue: men; red: women).
Source: Aitchison and Edwards Reference Aitchison and Edwards2003, Tables 23–24.

In general, rather than improving between 2003 and 2008, retention actually worsened, as young women were recruited and then left. Across the 1990s to early 2000s, as first identified in the Morris Report, archaeology was failing to retain women in their 30s; akin to the fallout from 1950s British society, women were disproportionately leaving (Pope Reference Pope2011, 73). What we find is a decline of women over 40 years in 1990s archaeology, worsening to include those aged over 30 years leaving across the 2000s. With 1998–2007 a period of rapid growth for the sector (Fig. 15), it seems that this was managed by bringing in higher numbers of young women, perhaps partly due to an increased gendering of the subject in higher education. The very high numbers of women entrants in 2002/3 do not appear to have been retained being replaced instead by further entrants, with the inverse position being that some junior men potentially benefitted from this situation by gaining more senior positions as a result of less peer competition (Fig. 16).
Economic decline in the sector across 2008–2012.
Source: Aitchison et al. Reference Aitchison, German and Rocks-Macqueen2021.

Gender and age employment trends in UK archaeology across the late 1990s to 2000s showing gendered retention; aggregated data from Profiling the Profession surveys (1997 and 2002 data shown as ‘2000’; 2008 and 2013 data shown as ‘2010’).

Summary of Profiling the Profession data
Archaeology in the 2000s then saw women’s professional involvement continue below the UK national average. Although more young women were gaining access to introductory level employment, owing to an increasingly gendered uptake of archaeology degrees, many had left by their 30s. While linked to the sector’s general retention issues around poor pay and conditions, we see that this was disproportionately affecting women relative to their male peers. The data suggest some women worked around the edges of the professional environment, finding ways to stay through part-time and support roles, which were lower-paid options relative to their qualifications and skills. This can be viewed as a serious economic problem in archaeology, as driven by a 1970s/1980s sexist ideology, presenting as the under-employment of skilled women, who often opted instead for museum roles and freelance finds specialisms, alongside a lack of sector modernization. These issues served to reinforce the gender pay gap, with women tending to be held out of senior roles, especially in universities and the private sector, as some (white) men continued to see the benefits of positive discrimination and increasingly, at the top end, inflated wages.
Establishing British Women Archaeologists (2008)
Despite the data gathered by the Institute of Field Archaeologists and the Morris recommendations, a funded programme to address inequalities for people with disabilities, ethnic minorities and women in archaeology was not forthcoming. Later Institute of Field Archaeologists/Institute for Archaeologists surveys (Profiling the Profession) aimed instead at surveying employment practices and gathering market intelligence, rather than the worker experience. As a result, the British Women Archaeologists (BWA) started at a time when the Institute for Archaeologist’s focus had shifted away from understanding employment practices to simply documenting them. Despite the Morris Report, no sustained action had been taken to change the culture for young women entering the profession in the mid-2000s. While the Institute of Field Archaeologists had begun to consider sexual harassment as early as 1991, the section is missing from the published report. The belief at the time was that sexual harassment was a personal matter, even at work, and its discussion essentially taboo.
With no action taken, students continued to experience a sector that seemed to embrace problematic behaviour. BWA heard, repeatedly, of sexual pressure and sexual assault on excavations, and discrimination in the workplace, but with anecdote over quantification it seemed difficult for us to move forward. In academia, great women were reduced to fringe biographies in disciplinary histories. In 2006, an all-male Personal Histories panel on post-war archaeology (Smith Reference Smith2007) had talked about how Colin Renfrew and his contemporaries had ‘democratised the field’ – something that seemed patently absurd, and wildly at odds with the female experience. Overall, what was needed was a more scientific approach to the problem: to think globally and act locally.
BWA worked on two fronts: to compile a survey of women archaeologists and to build a narrative framework for women’s involvement in the field, including a snapshot of women in academic archaeology (Pope Reference Pope2011; Fig. 17). The survey was specifically designed to gather wider opinion and to begin to quantify some of the issues discussed, while also testing the broader willingness for a women’s group. In fact, this survey (unbeknownst at the time) was the first to ask women archaeologists about discrimination and promotion in the workplace for over 15 years, following Morris (Reference Morris1992). We now see from analysis of Profiling the Profession data generated across this period (1999; 2003; 2008 surveys) that the sense of discontentment amongst young women archaeologists was linked to entering a sector that had stubbornly refused to modernize around worker needs – women often having to opt for specific roles, lower pay relative to their skills, and freelance or part-time working to stay in their profession of choice – or else to leave.
Gendered promotion in UK academic archaeology (2007).

BWA outreach. Parenting and UK archaeology
In 1991, the Morris Report had found that one in three archaeologists had caring responsibilities: a significant chunk of the workforce. Yet, at the 2008 BWA launch, one finds specialist relayed that she had had to take 2 weeks of unpaid leave to give birth in the 1990s. One of the first concerns for BWA was consciousness-raising around maternity rights, as one clear divergence in a woman’s career. How long might a nursing worker be absent, and what was the level of pay? Few knew that a new mum only had the right to a statutory fortnight of leave, after which the employer could decide, on the basis of central guidance. In April 2009, the BWA website published information for would-be parents on their rights: employers paid 90% salary for 6 weeks of maternity leave, after which a new mum might only receive SMP (£492/month, by then 23% of the average salary) for a further 33 weeks. With the 2009 poverty line at £1133/month, the UK asked the mother of a 6-week-old baby to live two-thirds below the poverty line, unless supported by other means. This was recognized more widely, and the Department for Business, Enterprise and Regulatory Reform (BERR) had advised employers to supplement SMP to help retain female employees, typically manifesting as SMP + 50% salary for 6 months. Unregulated, this was at employer discretion. By 2008, employers of 67% of archaeologists said they provided paid maternity leave above this, however one in five employers were seemingly inactive regarding the BERR recommendations on improving paid maternity leave (Aitchison and Edwards Reference Aitchison and Edwards2008, 45).
With away-working and low pay, the economics of parenting was also found to be critical to retention within the sector. In 2008, BWA frequently heard from women archaeologists that, with the cost of childcare then at £8,000 per annum, the partner with the lower income inside a relationship was often expected to sacrifice their job. In other words, had salaries been higher, away-working could have been mitigated with childcare options that were unavailable to those on a low income. The low economic turnover of the sector was often then a double-bind for parents, especially for the often lower-paid women archaeologists. They could not afford to stay in the sector and pay for childcare. Furthermore, as they had a baby with little support on leave, it may not have seemed very attractive to return to a sector with a socially ‘chilly climate’ towards women in the workplace, discrimination, and poor facilities. Across 2003–2008, a static one in five employers in UK archaeology did not provide paid maternity leave, meaning that a woman’s pay was docked to statutory maternity pay (£492 per calendar month) within 6 weeks of giving birth, presumably one reason why women over 30 years were leaving the sector across the 2000s.
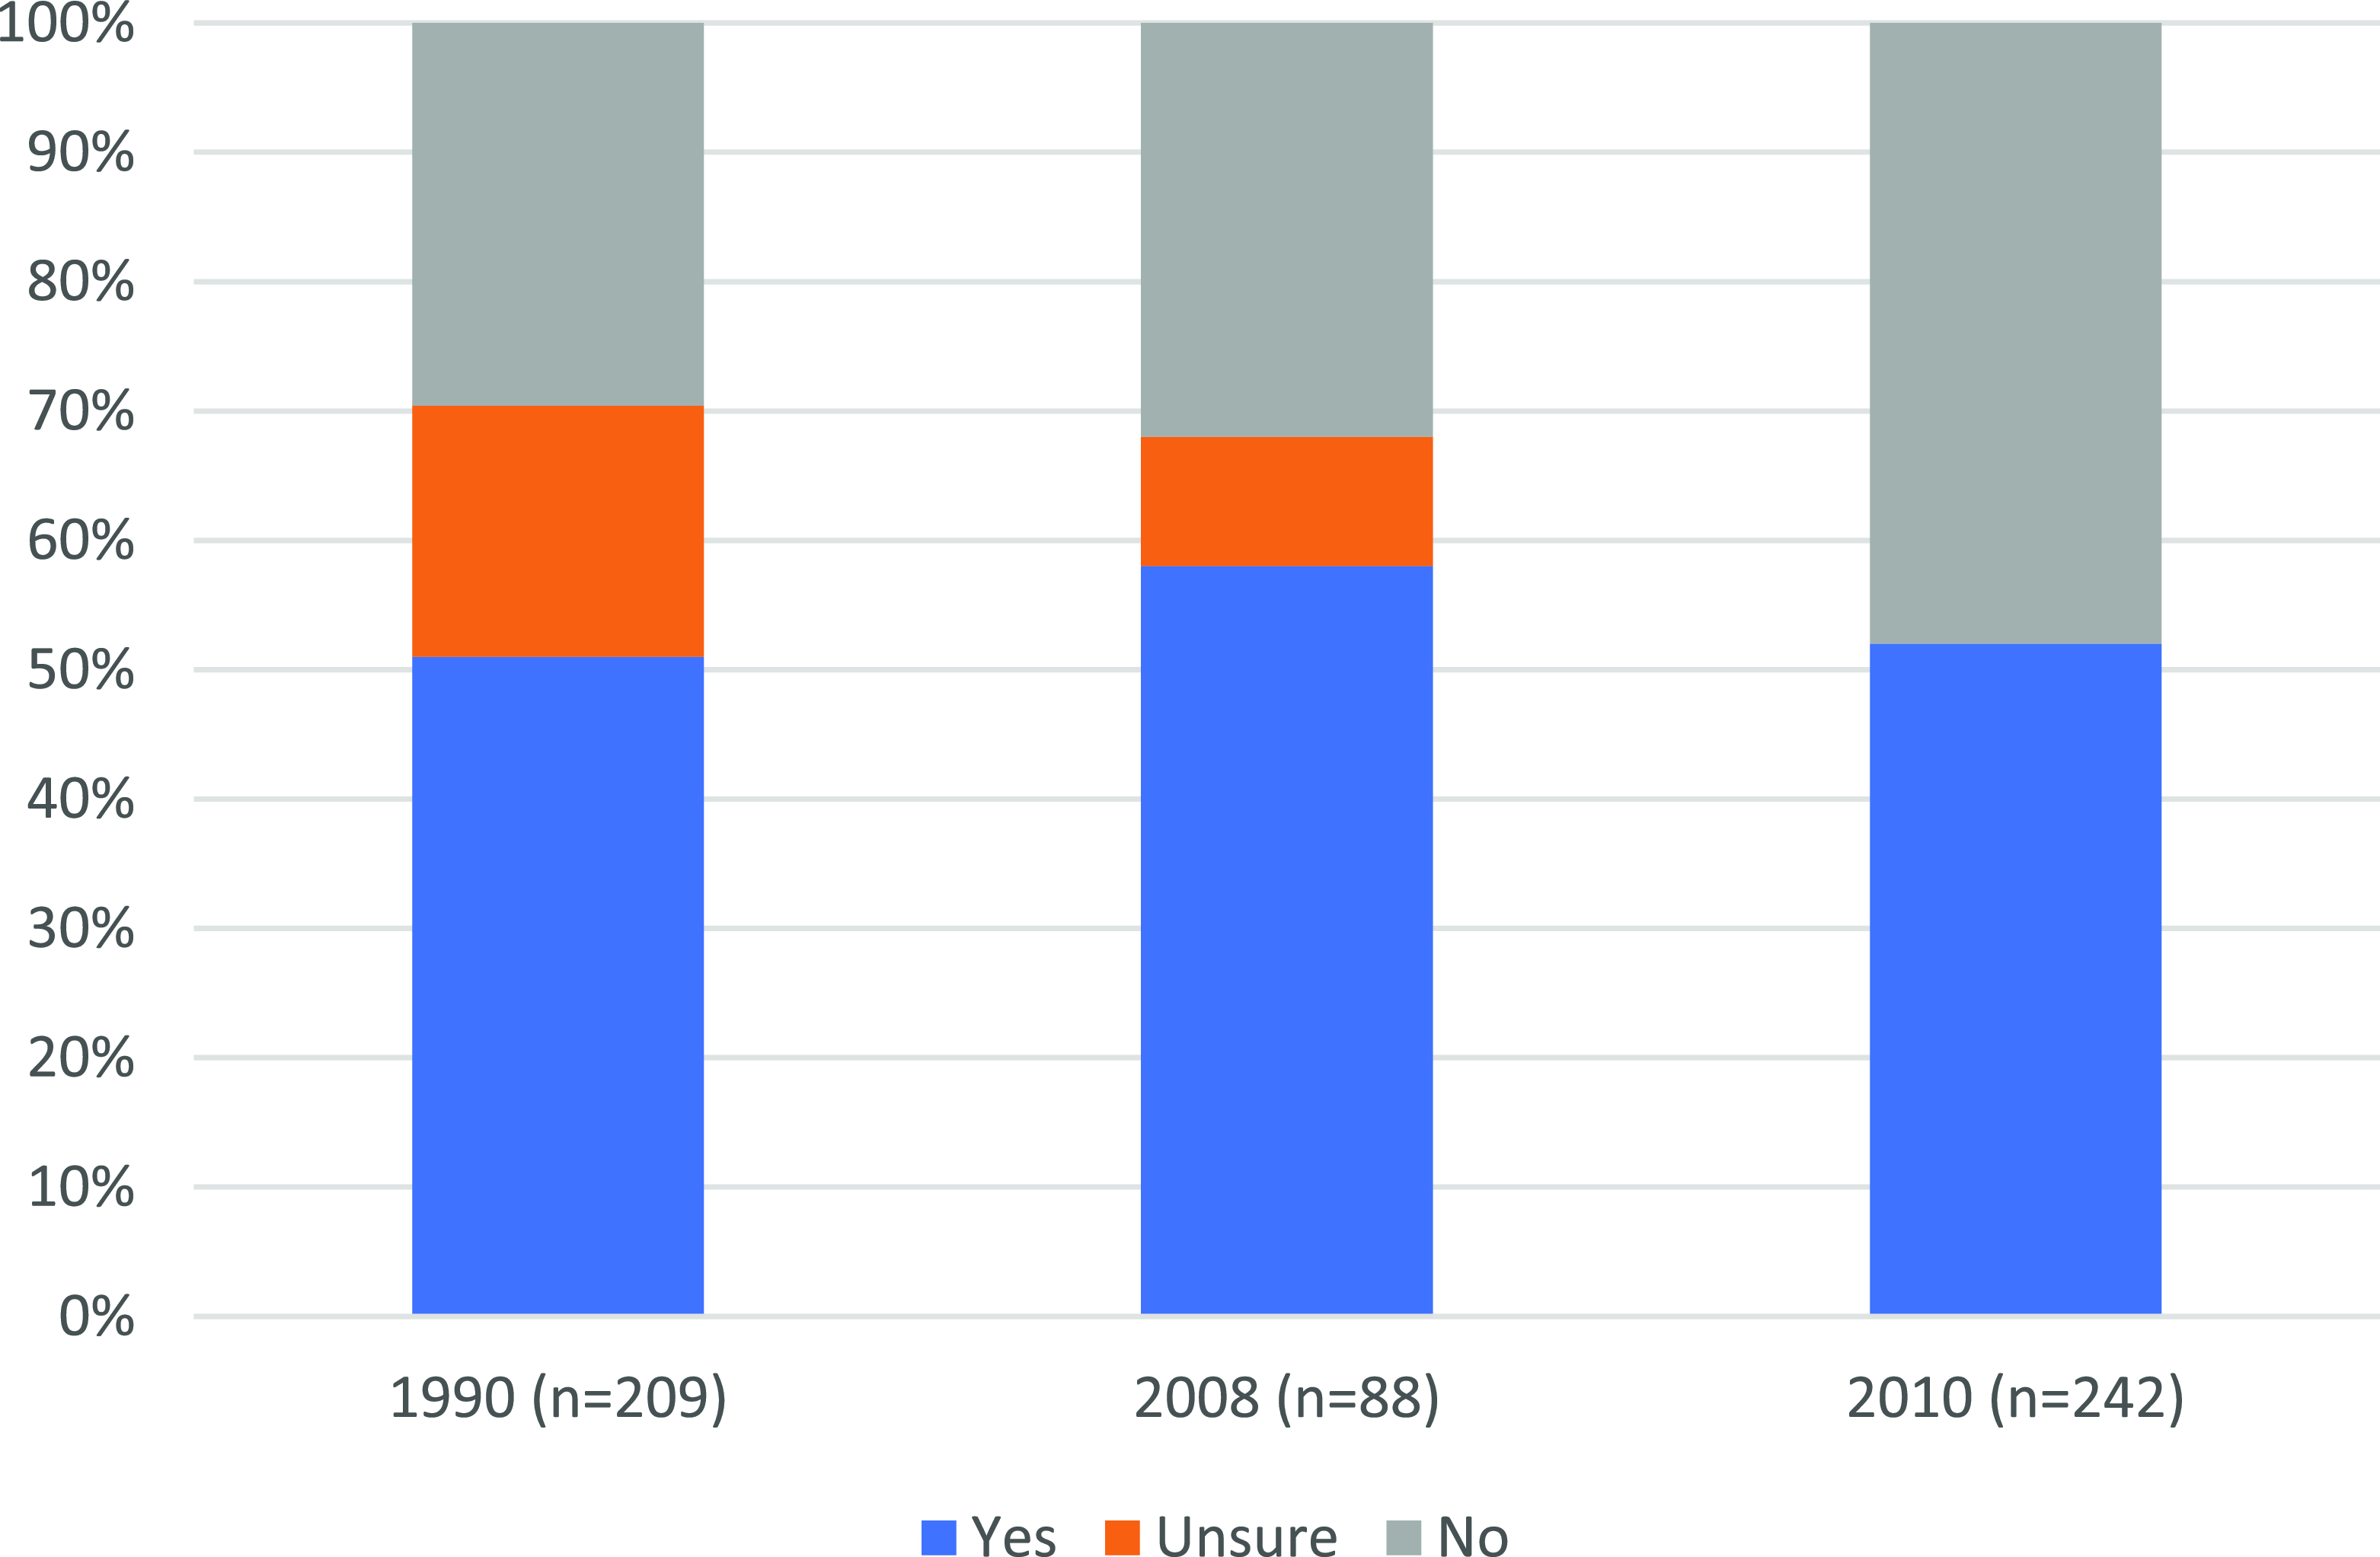
What is important for us to recognize here is that, after the efforts of the Morris Report, the late-1990s Institute of Field Archaeologists decision not to modernize its employment structures for women meant that, by the time we established British Women Archaeologists, almost 20 years had passed with apparently little change in attitudes (Fig. 18). Following a decade of rapid sector growth (1998–2007), the late 2000s finally saw more young women joining the profession, but without modernization, they were not retained. The result was a sector still 5% below the UK national average for women workers as late as 2008.
Workplace sexism in British archaeology (1990–2010).

Discussion
An increase in the number of women students from the 1970s led to the first work on challenging inequalities by the early 1990s. At the time of PPG 16, the start of a growth period for UK archaeology, an industry-standard equalities agenda was established by the Institute of Field Archaeologists, across 1990–1994, and attached to their Code of Conduct in 1997. This equalities agenda was backed by good data and had clear aims, good strategy and a plan for sustainability. It recognized the need, in the early 1990s, for high initial investment to achieve substantial, rapid change around issues of access, pay and promotion for women and ethnic minorities in the sector, and planned to discover the needs of archaeologists with disabilities. However, solutions were not implemented by sector leadership; the 1997 survey went unpublished, and the equality and diversity agenda was slowly dismantled. The aim of gaining EU funding for a rolling data-collection exercise, a recommendation of the Institute of Field Archaeologists Equal Opportunities in Archaeology Working Party Report (Morris Reference Morris1992) was assumed instead by Profiling the Profession. Rather than the eight funded members working to resolve sector equality issues, the EO Committee disbanded in 2000, was replaced by an unfunded Equalities Officer role in 2003, which was dissolved in 2005/6.
Inside a decade, the sector equalities agenda had been systematically dismantled. The Institute of Field Archaeologists (2000) strategic plan for 2000–2010 did not mention equality or diversity, with only the first of the Morris Report’s eight recommendations achieved. Across the 2000s, British Archaeology retained its professional ‘problem’ with women. By 2008, women in the heritage sector remained at 5% below the national average of women in the UK workforce, with women disproportionately leaving the sector in their 30s. It was in this year that BWA was established, clearly recognizing the omission and working to fill the gap left by the Institute of Field Archaeologists in 1998. Questions unasked by Profiling the Profession but asked by BWA worked to provide some continuity in documenting women’s experiences, with the picture remaining very similar between 1990 and 2010. Many educated, skilled women either left their career of choice in their 30s, or moved to part-time or self-employment to continue in the profession (Everill Reference Everill2012). The BWA data showed that almost 50% of women in their 20s could see this ahead of them in the sector, knowing that they could not have a career and a family if they were to stay in archaeology, with almost half of women surveyed hearing that women were unsuited to archaeology. BWA again communicated two clear, solvable issues that would have aided women’s retention: action on parenting and discrimination, which would have directly impacted the working environment in promotion and pay.
Lack of modernization instead meant that, apart from in museums and local authorities, many women were funnelled towards lower-paid roles (part-time, freelance, finds, support roles) leading to a growing sector pay-gap, and a lack of senior women. By contrast, senior men benefited from the traditional environment, seeing positive discrimination, that accorded them higher status/pay, as women leaving in their 30s left the path clear for male promotion. While women’s access to the field had finally begun to increase by 2008, it was retention of skilled women workers that was the main issue facing the sector by that point. While retention has been an issue more generally, as a result of low pay and conditions, this was disproportionately shouldered by women, an error even more obvious as increasing numbers of women joined a growing early-2000s sector. This failure of leadership led to a continuous haemorrhaging of skilled workers. The result was a vicious cycle: skills loss generating low economic turnover leading to suppression of pay and conditions and to further skills loss.
Finally, it is important to note that the BWA data were gathered from those who survived in archaeology and that the Profiling data are opt-in. We see responses from the larger firms in Profiling the Profession: a picture of the better part of the sector. Women archaeologists found it necessary to leave their career of choice, owing to its persistent refusal to modernize to accommodate them. Young women archaeologists in the 2000s did not learn that most would have left the profession by the time they were 40 years old, nor that during their time in archaeology, one in two would have experienced workplace discrimination and/or sexual harassment, with no recourse, or that they would be passed over for promotion – related less to their experience than to structural sexism. Many women left the sector feeling that they did not deserve the opportunity for both a career and a family, without knowing that it was a default female experience. It is women who shouldered the brunt of the short-term nature of archaeological contracts and a lack of investment in retaining skills within the profession. Introduction of the PPG 16 structure and a subsequent lack of action on the part of the Institute of Field Archaeologists regarding equality and diversity, successfully worked in tandem to exclude women and ethnic minorities, expecting individuals to take personal responsibility for what was a professional, structural issue.
Conclusion
In Germany and the USA, equality legislation had been brought in by the 1950s and 1960s, out of the Second World War and the Civil Rights movement, respectively. In comparison, the UK’s Sex Discrimination Act (1975) was painfully behind the times and out of step and ultimately required a new Equality Act (2010) owing to wholesale legislative failure. This was the social context into which the first equality and diversity initiative in the UK archaeological sector was conceived in the 1990s, amidst a wider social backlash against feminism. As gender archaeology out of the USA was flourishing in the universities, the UK sector was struggling to accept women practitioners in the present and even working to write them out of its disciplinary past (Pope and Davies Reference Pope and Davies2023; Díaz Andreu and Pope Reference Díaz-Andreu, Pope, Díaz-Andreu and Coltofean2024; Díaz Andreu Reference Díaz-Andreu, Moen and Pedersen2025).
It is that failure to uphold strategies outlined in the Morris Report that affected policy down the line in UK archaeology. Had the Morris Report objectives been adequately funded, the initiatives engendered would have made a significant difference to the lived experience of women, parents, and marginalized archaeologists in the early 21st century. Data now show that the contemporary position of women in the UK archaeological sector is improving, as we edge towards becoming a modern profession (Pope and Teather Reference Pope and Teatherforthcoming). To that end, this article forms a necessary addition to our historical employment data, helping us to understand the origins of the challenges currently faced by our female workforce, in a bid to retain skilled female staff and so to boost our economic position, enabling the sector to grow.
In recent years, our social understanding of equality and diversity has become increasingly nuanced, allowing us to isolate different types of discrimination within the workforce, not exclusively restricted to women – instead intersectional concerns (particularly around race, gender identity, and the mechanics of parenting). Despite elucidation by Crenshaw in the USA of the late 1980s/early 1990s, this critical social theory has taken time to reach mainstream thinking in the UK. That said, Morris (Reference Morris1992) had included race and disability as parallel concerns, amidst the pressing sexism of late 20th century British society. This is the complex space of the contemporary conversation, one that we must now learn to navigate as we assess the long-term impact of decisions from the 1990s and sector (in)actions of the 2000s.
APPENDIX: 1992 MORRIS REPORT RECOMMENDATIONS
1. Guidelines. Prepare a set of guidelines for equal opportunities in archaeology.
2. Access and accessibility. Investigate equal opportunities in archaeology for people with disabilities and ethnic minorities.
3. Staff training. Explore ways to provide training for women in archaeology in the skills which will raise their self-confidence.
4. University campaign. In close liaison with the Career Development and Training Committee through the Hon. Careers Officer, target students at General Certificate of Secondary Education (GCSE) and A-level, and at second- and third-year university level, with information about archaeology and women in archaeology.
5. Institute of Field Archaeologists membership campaign. Encourage more women to join and participate in the Institute of Field Archaeologists.
6. Manager training. Provide training for managers in the awareness of equal opportunities for all personnel.
7. Data collection. Conduct a set of surveys in 4 years’ time to compare information with the 1990/1 working party data to determine whether there has been an improvement in equal opportunities in archaeology in Britain; make recommendations if necessary for the next 5 years.
8. Funding. Explore sources of external funding, such as through the European Community recommended by the Equal Opportunities Commission, to provide the finance necessary to assist in many of these positive actions.


 Open access