


Introduction
Though our experience of stress seems personally situated and internally regulated, these sensations can originate from the socioemotional states of those around us. Evidence that stress can be transmitted among individuals has been found in rodents who have witnessed the social defeat of a conspecific (Carnevali et al., Reference Carnevali, Montano, Statello, Coudé, Vacondio, Rivara and Sgoifo2017), in adult humans who have observed video-taped adults in high-pressure conditions (Dimitroff et al., Reference Dimitroff, Kardan, Necka, Decety, Berman and Norman2017), and in caregiver–child human pairs following maternal participation in a stress test task (Waters et al., Reference Waters, West and Mendes2014). Given caregiver–infant dynamics are core to early socio-emotional development, it is important to understand how stress might be transmitted from caregiver to infant (Feldman, Reference Feldman2015). However, a virtually unlimited range of human experiences can be subsumed under the umbrella term “stress” (Epel et al., Reference Epel, Crosswell, Mayer, Prather, Slavich, Puterman and Mendes2018). Stress may be quotidian or clinical; it may be biological, affective, or cognitive; its course may be acute or chronic; it may describe circumstance (a “stressor”) or a reaction (a “stress response”). Scientists examining stress among infants are unable to elicit verbal report, and so are forced to concentrate on the biological correlates of stress – concentrating on the autonomic nervous system (ANS), the fast-acting neural substrate of the body’s stress response (Cacioppo et al., Reference Cacioppo, Tassinary and Bernston2007). Elevated levels of arousal within the ANS, characterized by increased activity in the sympathetic (“fight or flight”) nervous system compared to the parasympathetic (“rest or digest”) nervous system (although the two also operate nonadditively; Berntson et al., Reference Berntson, Cacioppo, Binkley, Uchino, Quigley and Fieldstone1994; Lacey, Reference Lacey1967) are accompanied in adults by increased psychological reports of stress (McCall et al., Reference McCall, Al-Hasani, Siuda, Hong, Norris, Ford and Bruchas2015; Ottaviani et al., Reference Ottaviani, Watson, Meeten, Makovac, Garfinkel and Critchley2016). Consequently, we consider physiological indicators of arousal within the ANS as proxies for stress states, such that increased states of arousal index increased states of stress (Wass, Reference Wass2021b).
Physiological synchrony in clinical populations
The sharing of arousal states between parent and infant is thought to aid the socioemotional stability of the developing infant (Fogel, Reference Fogel1993; Lobo & Lunkenheimer, Reference Lobo and Lunkenheimer2020; Sameroff, Reference Sameroff1983). Parent–infant dyads – particularly in the early developmental period – are thus thought to operate to some degree as single regulatory units of arousal (Bridgett et al., Reference Bridgett, Burt, Edwards and Deater-Deckard2015; Kopp, Reference Kopp1982; Tronick, Reference Tronick1982; Wass et al., Reference Wass, Smith, Clackson, Gibb, Eitzenberger and Mirza2019). As such, researchers have queried how shared arousal states within dyads are impacted by parental mental health conditions (Davis et al., Reference Davis, West, Bilms, Morelen and Suveg2018). If infants are sharing their parents’ disrupted arousal states, we might expect to see different patterns of arousal within at-risk and low-risk dyads. One potential risk factor for the dyadic relationship is parental mood disorder. Parental anxiety, in particular, is likely to lead to greater change or increase in arousal states within the dyadic relationship, given that arousal dysregulation is a core feature of many adult anxiety disorders (Craske et al., Reference Craske, Stein, Eley, Milad, Holmes, Rapee and Wittchen2017; Ottaviani et al., Reference Ottaviani, Watson, Meeten, Makovac, Garfinkel and Critchley2016; Thayer et al., Reference Thayer, Friedman and Borkovec1996), and that children of anxious parents show signs of event-related physiological hyperarousal from a very young age (Nikolić, Aktar, et al., Reference Nikolić, Aktar, Bögels, Colonnesi and de Vente2018; Nikolić et al., Reference Nikolić, de Vente, Colonnesi and Bögels2016). If infants share their anxious parents’ dysregulated arousal dynamics, these may become strongly encoded, subsequently precipitating or perpetuating maladaptive emotion regulation strategies in later in life.
A small number of recent studies have looked at physiological synchrony and anxiety-related risk within parent–child dyads (Roman-Juan et al., Reference Roman-Juan, Fiol-Veny, Zuzama, Caimari-Ferragut, Bornas and Balle2020). Physiological synchrony refers to coordination or covariation between two or more partners’ autonomic processes during social contact (Butler, Reference Butler2011; Feldman, Reference Feldman2015). One study investigated parent–child pairs where the child either had posttraumatic stress disorder (PTSD) or resilient characteristics (Motsan et al., Reference Motsan, Bar-Kalifa, Yirmiya and Feldman2021). The study found that the dyads with a parent and a child with PTSD exhibited strongest covariation in respiratory sinus arrhythmia, whereas resilient dyads displayed the weakest. These findings are also consistent with behavioral evidence suggesting that dyadic pairs in which one partner has anxiety display strong covariation in gaze and touch, while healthy dyadic pairs or dyadic pairs with a depressed partner show moderate or weak covariation, respectively (Beebe et al., Reference Beebe, Steele, Jaffe, Buck, Chen, Cohen and Feldstein2011; Granat et al., Reference Granat, Gadassi, Gilboa-Schechtman and Feldman2017). This small evidence base suggests that, through physiological synchrony, anxious parents’ atypical arousal regulation patterns may influence their children’s own arousal dynamics.
While these studies explore physiological synchrony among parent–child dyads with PTSD or anxiety-risk (Motsan et al., Reference Motsan, Bar-Kalifa, Yirmiya and Feldman2021; Roman-Juan et al., Reference Roman-Juan, Fiol-Veny, Zuzama, Caimari-Ferragut, Bornas and Balle2020), they are limited to later-stage development. In addition, they do not explore parental anxiety specifically. This is despite robust evidence showing that anxiety conditions pass from generation to generation (Aktar et al., Reference Aktar, Bockstaele, Pérez-Edgar, Wiers and Bögels2019), and that prodromal anxiety states are observed early in childhood (Möller et al., Reference Möller, Nikolić, Majdandžić and Bögels2016).
Recent research from our group has examined the relationship between parental anxiety and parent–infant physiological reactivity. In a separate analyses of the same sample, we found that covariation between parents and their 11-month-old infants’ arousal (measured as a composite of heart rate [HR], heart rate variability [HRV], and actigraphy) was stronger among dyads where the parents were more anxious (Smith et al., Reference Smith, Jones, Charman, Clackson, Mirza and Wass2021). We also found that less anxious parents showed behaviors akin to “stress buffering,” downregulating their arousal when the overall arousal level of the dyad was high. These behaviors were absent in more anxious parents (Smith et al., Reference Smith, Jones, Charman, Clackson, Mirza and Wass2021; Wass et al., Reference Wass, Smith, Clackson, Gibb, Eitzenberger and Mirza2019). These findings suggest that atypical patterns of physiological synchrony and coregulation between children and parents with elevated psychological distress emerge early in development.
Arousal contagion
Closely related to the concept of physiological synchrony is arousal contagion, defined by the transfer of affective states from one partner to another (highlighting “leader-follower” dynamics; Butler, Reference Butler2011; Engert et al., Reference Engert, Linz and Grant2019). Developmental studies of arousal contagion have typically been conducted in controlled laboratory conditions following an experimental stress induction task, during and after which indices of physiological arousal are measured in both “target” (leader) and “observer” (follower) members of a dyad. Findings include increased skin temperature covariation in parents and preschool-aged children following a stress induction task for the child (Ebisch et al., Reference Ebisch, Aureli, Bafunno, Cardone, Romani and Merla2012; Manini et al., Reference Manini, Cardone, Ebisch, Bafunno, Aureli and Merla2013); increased preejection period and heart rate covariation in parents and infants following a negative evaluation condition for the parent (Waters et al., Reference Waters, West and Mendes2014); and increased interbeat interval reactivity covariation in parent–infant dyads following a maternal stress task (Waters et al., Reference Waters, West, Karnilowicz and Mendes2017). While several studies have examined arousal contagion in adult populations (usually from a neuroendocrinal perspective; see: Buchanan et al., Reference Buchanan, Bagley, Stansfield and Preston2012; Engert et al., Reference Engert, Plessow, Miller, Kirschbaum and Singer2014, Reference Engert, Ragsdale and Singer2018), the subject of arousal contagion is of particular interest to developmental scientists seeking to understand early pathways to both typical and atypical emotion regulation (Feldman, Reference Feldman2012; Waters et al., Reference Waters, Karnilowicz, West and Mendes2020).
Mechanisms of arousal contagion
In recent years, research attention has focused on elucidating the mechanisms through which arousal contagion operates. Arousal contagion, like other neurobiological state-matching phenomena such as neural entrainment, can occur when one partner’s autonomic activity causes a subsequent social behavior, such as a facial expression or vocalization, which is then perceived by the second partner, leading to a change in that partner’s physiology (Feldman et al., Reference Feldman, Magori-Cohen, Galili, Singer and Louzoun2011; Wass et al., Reference Wass, Whitehorn, Marriott Haresign, Phillips and Leong2020). In parent–infant studies of arousal contagion, several behaviors have been explored. For example, following a parental stress test, infants sitting on their parents’ laps were found to show increasing levels of covariation in sympathetic nervous system activity (SNS) over time, compared to infants sat apart from parents, suggesting touch may play a crucial role in arousal contagion (Waters et al., Reference Waters, West, Karnilowicz and Mendes2017). This is consistent with findings from adult literature on arousal contagion between attachment partners, in which the touch condition was isolated from the potentially confounding variables of proximity or motion (Chatel-Goldman et al., Reference Chatel-Goldman, Congedo, Jutten and Schwartz2014). In addition, an experiment in which parents were asked to use maladaptive social cognitive behaviors (e.g., “suppression”; hiding or masking emotion) following a stress test showed that suppression increased SNS covariation between parents and their infants (Waters et al., Reference Waters, Karnilowicz, West and Mendes2020). However, little is known about how social behaviors influence physiological reactivity in parent–infant dyads where the parent has symptoms of an affective disorder.
One behavioral modality that has received less attention in the literature is vocalization. The role of voice is important in the early dyadic relationship as it can be used more widely than other modalities; vocalization requires neither close proximity nor eye contact, as is the case in touch and gaze modalities. It also has a role in situations where greater vigilance might be required (e.g., raising one’s voice to stop a child from stepping into a road with oncoming traffic).
In atypical parent–infant interaction episodes, anxious parents express higher levels of vocal behavior compared to controls, including child-directed speech (Murray et al., Reference Murray, Rosnay, Pearson, Bergeron, Schofield, Royal-Lawson and Cooper2008). Anxious parents also display higher intensity vocal profiles than depressed parents or controls (Feldman, Reference Feldman2007), in accordance with acoustic evidence showing that fear-related emotional states are commonly associated with high vocal intensity (i.e., vocal amplitude, or “loudness”; Juslin & Laukka, Reference Juslin and Laukka2001, Reference Juslin and Laukka2003). While we know that a more intense vocal style is typical of anxious parents, we do not know how this social behavior relates to arousal contagion between parent and child.
Evidence on the rhythm of adult vocalizations also suggests that adaptive interpersonal communication is marked by paced, periodic structure (Abney et al., Reference Abney, Dale, Louwerse and Kello2018; Jaffe et al., Reference Jaffe, Beebe, Feldstein, Crown, Jasnow, Rochat and Stern2001). By contrast, less periodic vocalizations are thought to associate with anxiety states (e.g., speech dysfluency; Laukka et al., Reference Laukka, Linnman, Åhs, Pissiota, Frans, Faria and Furmark2008) or increased information transfer (e.g., “burstiness,” temporally clustered behaviors followed by lulls of inactivity; Abney et al., Reference Abney, Dale, Louwerse and Kello2018), such as that seen in the overstimulating behaviors of anxious parents (Feldman, Reference Feldman2007; Granat et al., Reference Granat, Gadassi, Gilboa-Schechtman and Feldman2017). Empirical studies on the temporal structure and periodicity of vocal behavior in anxious parents in the context of childrearing, are, however, scant, despite aperiodic vocalizations being an atypical behavior that could influence arousal levels within the dyad.
Taken together, results from arousal contagion studies with parent–infant dyads suggest that ostensive cues, such as touch and gaze, can facilitate the transmission of physiological arousal from one partner to another during social interaction (Waters et al., Reference Waters, West, Karnilowicz and Mendes2017). Very little, however, is known about the role of speech in arousal contagion, despite the importance of the auditory modality in communication between parent and infant (Ghazanfar & Zhang, Reference Ghazanfar and Zhang2016; Wass et al., Reference Wass, Phillips, Smith and Goupil2021; Zhang & Ghazanfar, Reference Zhang and Ghazanfar2020). This is particularly true when the infant is out of reach and not directly controllable, a potentially stress-inducing context that becomes increasingly common as the infant develops. In addition, there is little available evidence on arousal contagion within at-risk dyads, even though this is likely to be critical for understanding patterns of dysregulated emotion in very early childhood. The present study therefore examines how parental vocalizations and mood disorder-related distress relate to parent–infant arousal contagion.
The present study
Evidence suggests that vocal behavior is altered in anxious adults and thus could play a role in parent–infant arousal contagion within the context of elevated parent anxiety. Understanding these parent–infant dynamics is a necessary step toward understanding aspects of dyadic coregulation, the foundational stage preceding the infant’s development of their own self-regulation skills.
To address this, we used miniaturized autonomic- and audio-recording devices, worn by parents and infants at home throughout the day, to examine how parental vocalizations relate to arousal contagion among anxious parents and their infants. Specifically, we tested four primary hypotheses. First, on the basis that anxiety-related distress is associated with strong parent–child physiological synchrony (Motsan et al., Reference Motsan, Bar-Kalifa, Yirmiya and Feldman2021), we predicted that infants of anxious parents would show elevated physiological arousal in response to high points in parental physiological arousal. Second, on the basis that anxious parental behavior is associated with a highly stimulating, intense vocal profile (Granat et al., Reference Granat, Gadassi, Gilboa-Schechtman and Feldman2017; Juslin & Laukka, Reference Juslin and Laukka2003; Murray et al., Reference Murray, Rosnay, Pearson, Bergeron, Schofield, Royal-Lawson and Cooper2008), we predicted that greater parental arousal would associate with higher intensity parental vocalizations in anxious parents. Third, given links between aperiodic vocal behavior and overloaded communicational styles of anxious parents (Abney et al., Reference Abney, Dale, Louwerse and Kello2018; Feldman, Reference Feldman2007), we predicted that anxious parents would be more likely to repetitively vocalize in clusters. Finally, since vocal sequences are tightly linked to respiratory patterns modulated by the ANS (Zhang & Ghazanfar, Reference Zhang and Ghazanfar2016), we predicted that high-intensity parental vocalizations in anxious parents would associate with subsequently sustained increases in both parent and child physiological arousal; a pattern consistent with a role in arousal contagion.
Methods
Participant details
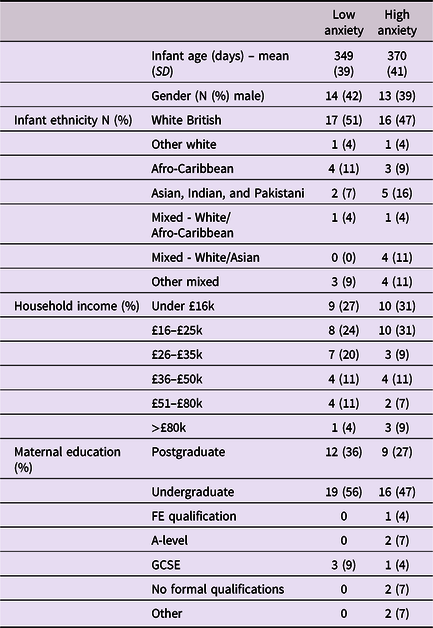
Approval for this project was given by the Research Ethics Committee at the University of East London. Participants were recruited from London, Essex, Hertfordshire, and Cambridge in the UK. Overall, 91 caregiver–infant dyads were recruited to the study, of which usable paired autonomic data was available from 74 dyads, and full caregiver anxiety data were available from 68. Further details, including exclusion criteria, outlier-detection strategy, and detailed demographic details on the sample are given in Table 1 and SM sections 1–2. Of note, we could not include families in which the primary day-time care was performed by a man or nonbinary person, as the numbers were insufficient to deliver an adequately gender-matched sample. Subsequently, all participating caregivers identified as women. We did not explicitly ask participants to identify their genetic relationship to the infant, and all participants identified themselves as mothers. As a token of appreciation for participating, dyads received £30 gift vouchers split over two visits.
Demographic data split by low/high caregiver GAD-7 scores
Caregiver screening
Caregivers were screened for anxiety using the Generalized Anxiety Disorder 7-item (GAD-7) screening tool, which assesses generalized anxiety symptoms of the preceding fortnight (Spitzer et al., Reference Spitzer, Kroenke, Williams and Löwe2006). While acknowledging the multiplicity of individual anxiety disorders, the GAD-7 tool was selected as a global “catch-all” measure of anxiety for the present community sample, in line with transdiagnostic perspectives (Norton & Paulus, Reference Norton and Paulus2017). Studies of both clinical and nonclinical populations have validated this questionnaire, with scores above 6 representing mild to moderate anxiety (Löwe et al., Reference Löwe, Decker, Müller, Brähler, Schellberg, Herzog and Herzberg2008). Caregivers were asked to rate the frequencies of particular thoughts and behaviors on a 4-point scale ranging from 0 (not at all) to 3 (nearly every day). Cronbach’s alpha for the internal consistency of the scale was .89. The GAD-7 scores ranged between 0 and 17 (M = 3.4, SD = 3.9). Where possible we have analyzed GAD-7 scores as a continuous variable. Where necessary for presenting time series analyses we have dichotomized our group using a median split to differentiate high and low anxiety groups, and performed follow-up analyses based on a quartile split to explore the associations’ consistency (see SM, section 6). For the median split, the low anxiety group’s GAD-7 scores ranged between 0 and 2 (M = 0.76, SD = 0.85); the high anxiety group’s scores ranged between 3 and 17 (M = 6.16, SD = 3.96), indicating mild to moderate anxiety.
Procedure
Participants were invited to choose a day during which they would be spending the whole day with their child but which was, in every other respect, as far as possible, typical for them and their infant. A researcher made a home visit to the participant in the morning (c. 7.30–10 a.m.) to fit the equipment before returning later (c. 4–7 p.m.) to collect it. The mean (SD) recording time per day was 7.3 (1.4) hr.
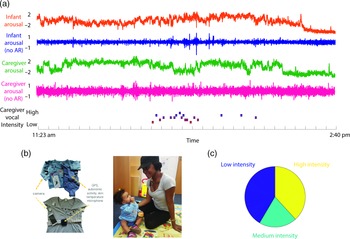
The equipment comprised two wearable layers for both caregiver and infant (see Figure 1). For the infant, a custom designed baby-vest was worn next to the skin, within which was embedded an electrocardiogram (ECG) recording device (recording at 250 Hz), accelerometer (30 Hz), global positioning system (1 Hz) and microphone (11.6 kHz). A T-shirt worn over the top of the vest contained a pocket to hold the microphone and a miniaturized, commercially available video camera (Narrative Clip 2). The caregiver wore the same equipment: a custom-built chest strap containing the main recording device as the base layer, and a cardigan containing the microphone and video camera as a secondary layer. The garments were unobtrusive and comfortable to wear and, other than a request to keep the equipment dry, participants were encouraged to behave as they would on a typical day. To optimize recording quality, the ECG device was attached using standard AgCl electrodes placed in a modified lead II position.
(a) Illustration of raw data showing a caregiver and child wearing the equipment. From top to bottom: infant arousal composite (see SM sections 3.1–3.3 for details of how this was calculated); infant arousal (no AR) – after removal of autocorrelation from the arousal data (see SM section 3.4); caregiver arousal composite; caregiver arousal (no AR); caregiver vocal intensity; (b) illustration of the equipment used for home monitoring; (c) pie chart showing the distribution of caregiver vocal intensity codes after splitting into low/med/high-intensity values.

Quantification and data analysis plan
Autonomic data parsing and calculation of the autonomic composite measure
A full description of how the autonomic data were parsed is given in the SM sections 3.1–3.2. The accuracy of the ECG recording devices was ensured through a cross-validation procedure by which HR and HRV were recorded using both the devices developed for home use and established, lab-based recording devices (a Biopac MP150 amp recording at 2000 Hz). High reliability was observed both for HR (rho = .57, p < .001) and HRV (rho = .70, p = .01). In the SM we also described the high tonic and phasic correlations we observed between HR, HRV and actigraphy, which were our primary motivation for collapsing the three measures into a single composite measure of autonomic arousal (see SM, section 3.3). Prior to all analyses, the autocorrelation was also removed from the arousal data. The procedure for this is given in SM (section 3.4).
Vocal coding
The microphone recorded a 5-s snapshot of the auditory environment every 60 s. Post hoc, coders identified samples in which the caregiver was vocalizing and coded them for vocal intensity on a scale from 1 (least intense) to 9 (most intense). Coders were blind to the caregivers’ anxiety status. In order to ensure an even distribution, for all analyses presented low- intensity vocalizations were defined as all vocalizations coded ≤4; mid-level intensity vocalizations were coded as 5; high- intensity vocalizations ≥6. In total, 42% of vocalizations were coded as low intensity; 20% as medium intensity; 38% as high intensity. In order to assess inter-rater reliability, 24% of the sample was double-coded; Cohen’s kappa was .60, which is considered acceptable (McHugh, Reference McHugh2012). All coders were blind to intended analyses.
Home/Awake coding
Due to preliminary analyses indicating that infants tended to be strapped into a buggy or car seat for much of the time they were outdoors, which strongly influenced their autonomic data, our analyses only examine segments of the data in which the dyad was at home and the infant was awake. Further details on how home/awake segments were identified are given in the SM (Section 4). Following these exclusions, the mean (SD) total amount of data available per dyad was 3.7 (1.7) hr, corresponding to 221.5 (102.4) 60-s epochs per dyad.
Permutation-based temporal clustering analyses
To estimate the significance of time-series relationships, a permutation-based temporal clustering approach was used for the analyses presented below. Two different analytical approaches were used. One analysis looked at whether “peak” physiological reactions were observed relative to a known “Time=0” moment (such as relative to a particular event). This method was used to test Hypotheses 1–3. The other analysis examined temporally contiguous patterns of physiological change in instances where the center-point of the expected response window was unknown or unimportant (Maris & Oostenveld, Reference Maris and Oostenveld2007). This method was used to test Hypothesis 4. These permutation-based temporal clustering analyses, adapted from neuroimaging (Maris, Reference Maris2012; Maris & Oostenveld, Reference Maris and Oostenveld2007), allow us to estimate the probability of temporally contiguous relationships being observed in our results, a fact that standard approaches to correcting for multiple comparisons fail to account for (Maris & Oostenveld, Reference Maris and Oostenveld2007; Oakes et al., Reference Oakes, Baumgartner, Barrett, Messenger and Luck2013). Of note, this analytical technique is best adapted for use with categorical data. See further details in SM (section 5).
Results
Raw data and descriptives
Before tests of our three main hypotheses, raw data and descriptive analyses are presented. Figure 1 shows the recording equipment worn by participants as well as a raw data sample of the home visit. Demographic data for the sample is shown in Table 1, subdivided by low/high GAD-7 scoring. Independent samples t-tests were conducted for the demographic variables (excepting ethnicity) to assess group differences. None were identified (all ps > .15). In addition, previous subgroup analyses on the present sample found that arousal levels, measured from the raw autonomic data including the arousal composite, did not differ significantly between the groups (Smith et al., Reference Smith, Jones, Charman, Clackson, Mirza and Wass2021). In addition, we examined whether the frequency of caregiver vocalizations, or the mean intensity of the vocalizations, differed contingent on caregiver anxiety. No significant correlations were observed between GAD-7 scores and either caregiver vocalization frequency (rho = −.12, p = .38) or intensity (rho = .19, p = .16).
Hypothesis 1 – elevated physiological arousal in anxious caregivers associates with increased infant arousal
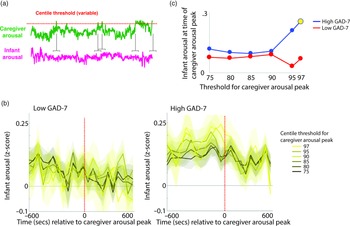
To investigate the moment-by-moment sequelae of caregiver arousal for infant reactivity, we examined infant reactivity to “peak” arousal events from the caregiver. A schematic illustrating this approach is shown in Figure 2a. Initially, we identified instances where the caregiver’s z-scored arousal crossed a centile threshold (e.g., exceeded 97% of samples for the caregiver for that day). For each instance, we averaged the data into 60-s epochs and excerpted the average change in infant arousal from 600 s before to 600 s after the caregiver peak arousal moment. Doing so allowed us to examine how the infant arousal changed, on average, around the top 3% most elevated arousal moments for the caregiver’s arousal in that day. The time interval was selected to fully contextualize profiles of change around the focal point (see Thorson et al., Reference Thorson, West and Mendes2018). Finally, to examine instances where the caregiver’s arousal exceeded incrementally lower centile thresholds of samples for that day, we repeated the analysis using different values for the centile threshold (e.g., 95th centile, 90th centile, and so on, down to the 75th centile; Figure 2b).
(a) Schematic illustrating the analysis shown in (b)–(c). (b) change in infant arousal relative to “peak” arousal moments of the caregiver, defined using variable centile thresholds. (c) summary plot indicating group differences in change of infant reactivity to caregiver arousal peaks, showing infant arousal relative to the time 0 threshold values from b. Where the permutation-based temporal clustering analyses indicated that a significant peak in infant arousal was observed relative to the caregiver “peak” arousal event, the datapoint has been drawn in yellow.

Primarily, we investigated two questions: (i) whether a significant peak in infant arousal was observed relative to the peak arousal moment in the caregiver, and (ii) whether peaks in infant arousal were selective (i.e. only observed for the most extreme instances of elevated caregiver arousal, e.g., the top 3% of samples for the caregiver that day) or whether they were also observable at less extreme yet relatively high arousal instances (e.g., the top 25% of samples for the caregiver that day). Figure 2b shows the changes in peak relative to the 0-horizontal line (which indexes infant average arousal); the further away from this line, the more change in infant arousal. It can be seen that, in the low anxiety group, there are no systematic changes in infant arousal around the peaks in caregiver arousal. But, in the high anxiety group, there appear to be systematic increases in infant arousal around the peaks in caregiver arousal. Figure 2c is a summary figure showing just the Time 0 scores from Figure 2b. To quantify whether the observed changes in infant arousal relative to the peak moment of caregiver arousal differed significantly from chance we performed a permutation-based clustering analysis (see SM section 5, Method 1). Instances where a significant peak in infant arousal was observed are drawn yellow on Figure 2c. The low GAD-7 group showed no significant peaks in infant arousal relative to instances of elevated caregiver arousal. By contrast, the high GAD-7 group showed a significant (p = .019) peak in infant arousal relative to the top 3% most elevated instances. In sum, these results show that, in caregivers with elevated anxiety, peaks in their own autonomic arousal tend to cooccur with peaks in infant autonomic arousal; but that this relationship is only present when the most elevated instances of caregiver arousal are considered. This relationship is not present in caregivers with lower anxiety.
Hypothesis 2 – high arousal associates with high- intensity vocalizations in anxious caregivers
Next, we examined how caregiver vocalizations differed contingent on the presence of elevated caregiver arousal, split by group. As with the above analyses, we began by z-scoring caregiver arousal data on a participant-by-participant basis. Next, we identified instances where the caregiver’s arousal crossed the 97th centile (i.e., exceeded 97% of samples for the caregiver for that day). We then, for each group, calculated the proportion of low/high-intensity vocalizations out of all vocalizations occurring immediately around each arousal peak (defined as the period from 1 min before to 1 min after). To examine whether the proportion of high/low-intensity vocalizations around arousal peaks differed significantly from the overall baseline rate of vocalizations, we also performed a control analysis in which we randomly selected an equal number of timepoints in our data that were not associated with arousal peaks, and used identical analyses to examine the proportion of high/low-intensity vocalizations around these control datapoints. Observed and control data were compared using Mann−Whitney U tests. As with Hypothesis 1, the same analysis was then repeated using different thresholds for identifying caregiver arousal peaks (see SM, Section 5).
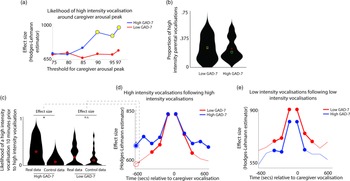
The results, shown in Figure 3a, indicated that, in caregivers with increased anxiety, a significant increase in the likelihood of high-intensity caregiver vocalizations was observed around elevated peaks in caregiver arousal (≥90th centile threshold). That is, in caregivers with increased anxiety, high-intensity caregiver vocalizations were more clustered around arousal peaks than would be expected by chance. The same effect was not observed in the low anxiety group. The same effect was also not observed when the same analysis was repeated to examine low-intensity vocalizations (Figure S4).
(a) Likelihood of high-intensity caregiver vocalizations around caregiver arousal peaks. Y-axis shows the effect size of the difference between the observed and the control data for the high GAD-7 (blue) and the low GAD-7 (red) groups, calculated as described in the Methods. Yellow circles indicate results showing a significant difference between the observed and the control data. (b) Violin plot showing the proportion of high-intensity caregiver vocalizations. No significant difference was observed between groups. (c) Violin plot showing one sample time-window of the analysis iterated across multiple time windows in (d) and (e). The plot shows the likelihood of a high-intensity vocalization in the time window 10 min prior to a high-intensity vocalization. The effect size of the real versus control comparison has been drawn separately for the high and low GAD-7 groups in (d). (d) Line plot showing the same comparison as shown in (c), but iterated across multiple time windows (i.e., examining the likelihood of the high-intensity vocalization in the time window 9 min prior to a high-intensity vocalization, and so on). Where a circle has been drawn, this indicates a timepoint where a significant difference was observed between the real and control data, following the statistical steps described in the Methods. (e) the same plot examining low-intensity vocalizations. For both groups, significant increases are only observed for the time window up to 5 min before and after each vocalization.
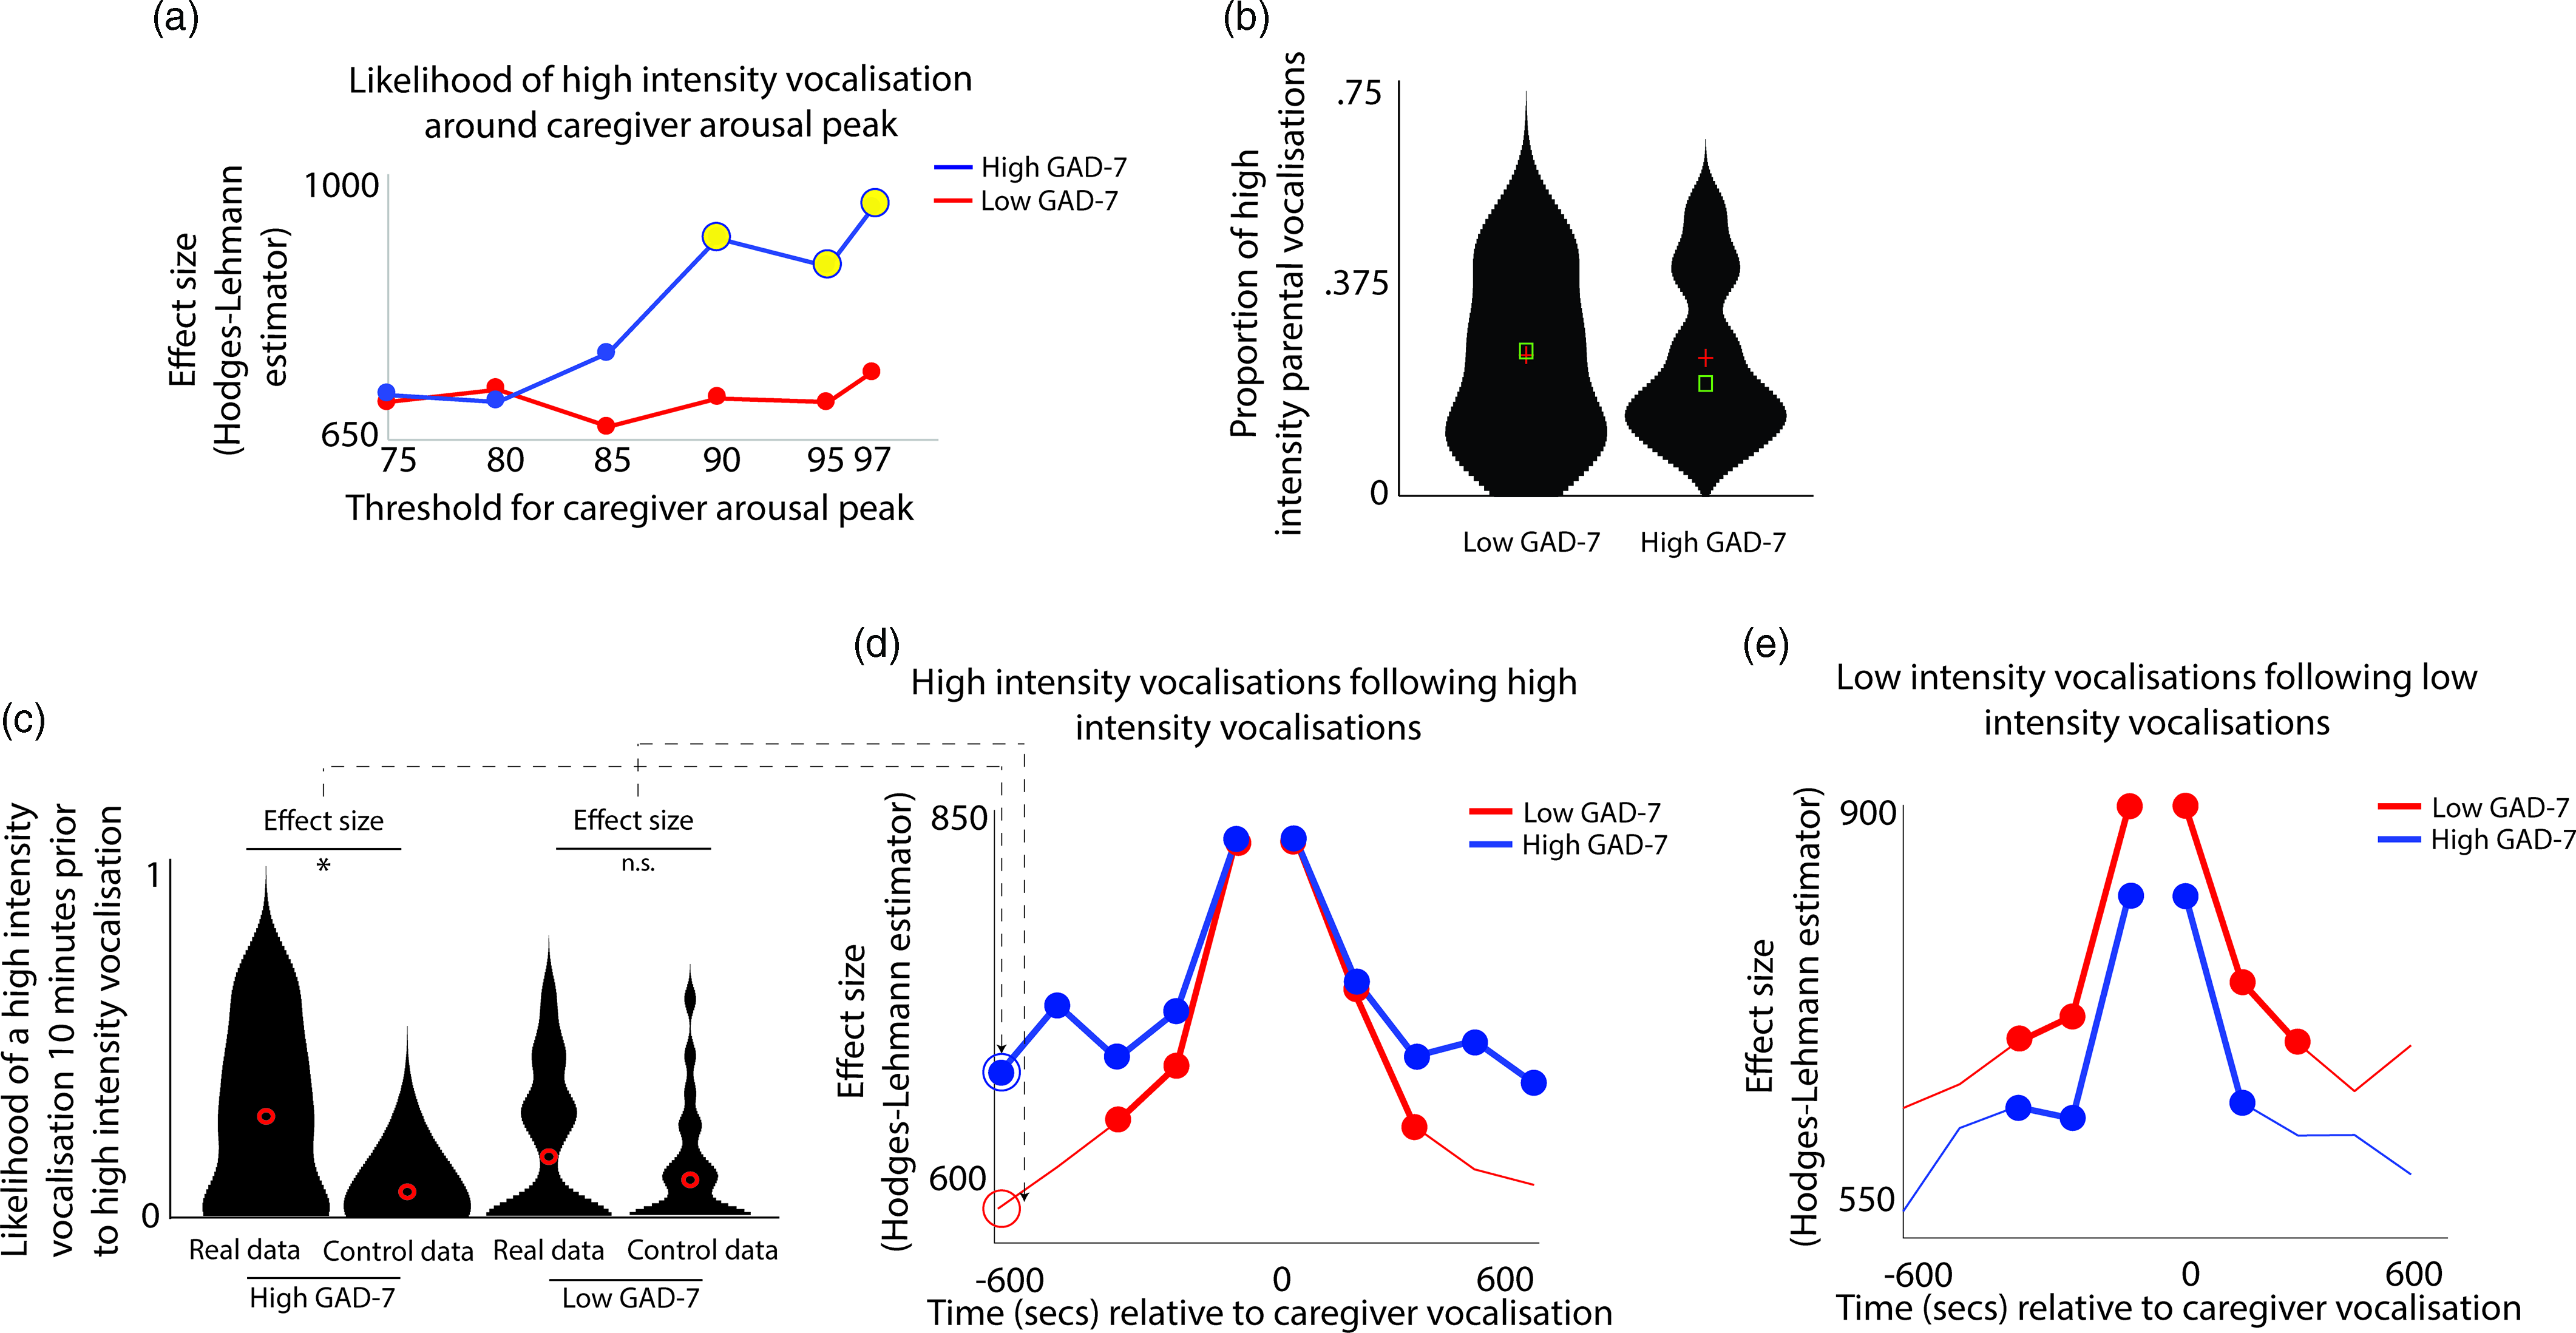
In order to verify whether this pattern was attributable to an increased prevalence of high-intensity caregiver vocalizations (as a proportion of all vocalizations) in the elevated anxiety group overall, we also examined the overall proportion of high-intensity caregiver vocalizations observed, independent of arousal (Figure 3b). No significant difference between the groups was observed. This suggests that our findings are specific to an increase in the proportion of high-intensity caregiver vocalizations around caregiver arousal peaks.
Overall, these results suggest that, in caregivers with elevated anxiety, peaks in caregiver arousal are associated with an increased likelihood of high-intensity caregiver vocalizations. The same effect is not observed in the low anxiety group. These differences are not attributable to an overall increase in the proportion of high-intensity vocalizations in caregivers with elevated anxiety. Hence, high-intensity vocalizations are more common around arousal peaks only in caregivers from the high anxiety group.
Hypothesis 3 – high-intensity vocalizations are more likely to occur in clusters in anxious caregivers
In addition to examining how the rate of caregiver vocalizations varied contingent on fluctuations in arousal, we also wished to examine whether caregiver vocalizations varied contingent on whether a vocalization had occurred previously. In other words, we examined the degree to which vocalizations occurred in clusters.
To examine this, we examined how caregiver vocalizations were clustered in time using the following procedure. First, we examined the likelihood of a high-intensity vocalization in the time window 10 min prior to a high-intensity vocalization. To examine whether the observed rate differed from the overall baseline rate of high-intensity vocalizations we performed a control analysis by randomly inserting an equal number of control “nonvocalisation” timepoints into our data, and using an identical procedure to examine the rate of high-intensity vocalizations around these control datapoints. We then used a Mann−Whitney U test to examine the effect size of the observed versus control comparison for the high and low GAD-7 groups separately. These two effect sizes are then drawn as the first two datapoints onto the line plot in Figure 3d. Then, we repeated the analysis based on the next time window (i.e., examining the likelihood of a high-intensity vocalization in the time window 9 min prior to a high-intensity vocalization, and so on). In this way, we examined how the vocalization rate varied across the time window from 10 min before to 10 min after each vocalization. Figure 3d shows the results for high-intensity vocalizations; Figure 3e shows the same plot for low-intensity vocalizations.
For the elevated anxiety group, a significant increase in the likelihood of a high-intensity vocalization is observed for all time windows up to 10 min before and after each high-intensity vocalization. For the lower anxiety group, a significant increase is also observed, but only up to 5 min before and after each vocalization. For low-intensity vocalizations, an increase in vocalization likelihood is observed for all time windows up to 5 min before and after, for both the elevated and the lower anxiety groups. Overall, these results suggest that high-intensity vocalizations are likely to occur in longer lasting clusters for caregivers with elevated anxiety. The same effect is not observed for low-intensity vocalizations.
Hypothesis 4 – high-intensity caregiver vocalizations predict increased caregiver–child arousal if caregiver has anxiety
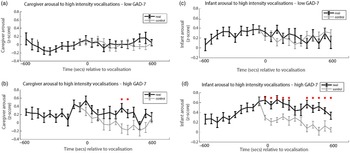
Finally, we wished to examine the rate of change of caregiver and infant physiological arousal relative to high-intensity caregiver vocalizations. First, we examined the low anxiety group (Figure 4a). To start, we identified all instances of high-intensity caregiver vocalizations that occurred during the day. Then, for each vocalization, we averaged the data into 60-s epochs and examined how the caregiver’s arousal level changed across the time interval from 600 s before that moment to 600 s afterward. As a control comparison, for each vocalization we randomly selected a moment during the day when the caregiver was at an equivalent arousal as immediately prior to the vocalization, but did not vocalize. To compare the observed and the control data we conducted Mann−Whitney U tests separately for each individual time bin. We then repeated the same analysis with the elevated anxiety group (Figure 4b). In addition, we also performed an identical analysis to examine the change in infant arousal relative to high-intensity caregiver vocalizations in the lower (Figure 4c) and higher (Figure 4d) anxiety groups.
(a) Caregiver arousal relative to high-intensity caregiver vocalization in the low GAD-7 group; (b) caregiver arousal relative to high-intensity caregiver vocalization in the high GAD-7 group; (c) infant arousal relative to high-intensity caregiver vocalization in the low GAD-7 group; (d) infant arousal relative to high-intensity caregiver vocalization in the high GAD-7 group. High GAD-7 caregivers and their infants show more sustained arousal increases around intense caregiver vocalizations. Lines colored black indicate index data (time series following a high-intensity caregiver vocalization) while gray colored lines indicate control data (time series following a moment where the caregiver was at an equivalent arousal level but did not vocalize intensely). Dots marked red indicate areas of significant (p > .05) event-related change.
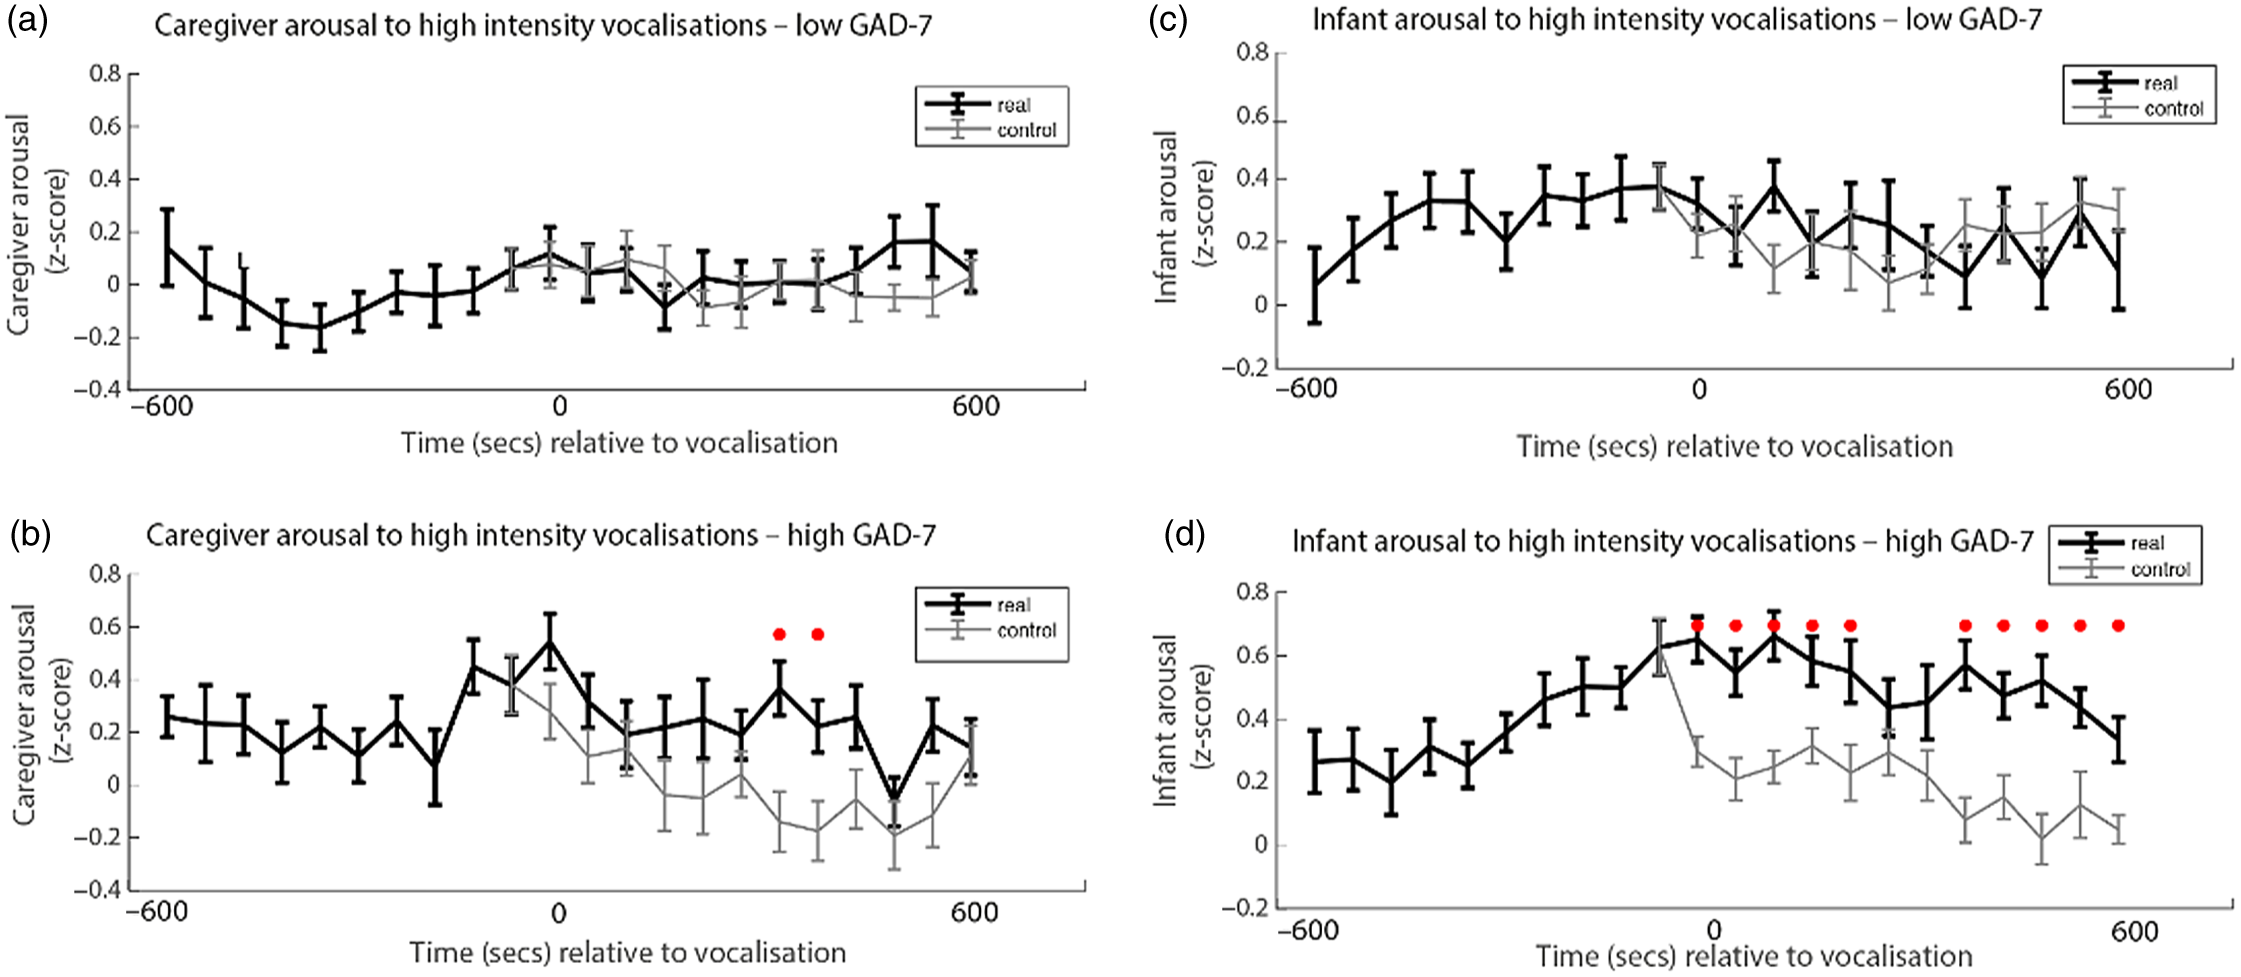
Both caregivers and infants in the high GAD-7 group showed significant sustained increases in physiological arousal in the 600 s window following the high-intensity caregiver vocalization (all ps < .02). This response was absent in the low-GAD-7 group (ps > .12). Overall, our results suggest that, in caregivers with elevated arousal, high-intensity vocalizations are associated with sustained increases in physiological arousal in both the caregiver (Figure 4b), and the infant (Figure 4d). The same pattern was not observed in the low GAD-7 group (Figure 4a, c). This finding was probed for consistency by repeating the analyses of the observed data according to a quartile, rather than median, split. Results indicated that the higher the caregiver anxiety, the higher both caregiver and infant arousal relative to high-intensity caregiver vocalization (see SM 6, Figure S4).
Discussion
In the present study, we examined the relationship between caregiver anxiety, caregiver vocalizations, and physiological arousal in caregivers and their infants. Our results showed that peaks in caregiver arousal were associated with increases in infant autonomic activity in the high but not the low anxiety group (Hypothesis 1, Figure 2). We also found that high arousal was more likely to associate with high-intensity vocalizations in anxious caregivers (Hypothesis 2, Figure 3a) and that anxious caregivers tended to produce high-intensity vocalizations in clusters (Hypothesis 3, Figure 3c, d). Finally, we found that high-intensity caregiver vocalizations were succeeded by sustained increases in physiological arousal in both caregivers and infants in the high (not the low) anxiety group (Hypothesis 4, Figure 4). Taken together, these findings indicate a role for caregiver vocal behavior in sustaining arousal transmission in the context of caregiver anxiety, through altered caregiver–infant interaction dynamics.
Infants of anxious caregivers show hypersensitivity to caregiver arousal
In a previous analysis of the same sample, we found that anxious caregivers show heightened autonomic reactivity to naturally occurring peak infant arousal, along with greater cofluctuation of physiological arousal overall (Smith et al., Reference Smith, Jones, Charman, Clackson, Mirza and Wass2021). In the present article, we extend this by showing that moments of elevated physiological arousal in anxious caregivers were more likely to be accompanied by elevated infant arousal in the high, but not the low, anxiety group. This is consistent with evidence suggesting that infants of caregivers with anxiety conditions are more reactive to external stimuli generally (Möller et al., Reference Möller, Nikolić, Majdandžić and Bögels2016); however, our finding that both infants and caregivers are hyper-reactive to changes in the other partner within the infant–caregiver dyad is novel, to our knowledge. These findings provide new insight into the mechanisms through which atypical patterns of infant arousal can be both dynamic and reciprocal; they develop through interactions with others, rather than purely in response to isolated stimuli (Fogel, Reference Fogel1993; Granat et al., Reference Granat, Gadassi, Gilboa-Schechtman and Feldman2017; Ham & Tronick, Reference Ham and Tronick2009; Murray et al., Reference Murray, Creswell and Cooper2009; Wass, Reference Wass2021a).
High arousal associates with high-intensity vocalizations in anxious caregivers
When we examined how caregiver vocalizations differed contingent on the presence of elevated caregiver arousal, we found that caregivers with elevated anxiety were more likely to produce high-intensity vocalizations around peaks in their own arousal. These associations were not found in less anxious caregivers, and differences were not attributable to an overall increase in the proportion of high-intensity vocalizations in caregivers with elevated anxiety. Our results build on previous studies showing that psychiatric conditions in adults and children are generally associated with vocal loading – that is, higher than typical vocal intensity (Garcia-Real & Díaz-Román, Reference Garcia-Real and Díaz-Román2016; Hamdan et al., Reference Hamdan, Deeb, Sibai, Rameh, Rifai and Fayyad2009; Hunter et al., Reference Hunter, Cantor-Cutiva, van Leer, van Mersbergen, Nanjundeswaran, Bottalico and Whitling2020). This may be due to intense vocal behavior mimicking the function of the infant cry, which laboratory data have shown to exacerbate distress and increase autonomic arousal (Rottenberg et al., Reference Rottenberg, Bylsma and Vingerhoets2008). If intense caregiver vocal behavior is understood as resembling the functionality of infant crying, this could notionally lead to further cycles of arousal in the caregiver.
High-intensity vocalizations are more likely to occur in clusters in anxious caregivers
Our results also suggest that caregivers with elevated anxiety are likely to produce high-intensity vocalizations in longer lasting clusters. In psychiatry more broadly, clustered high-intensity speech is associated with cognitive symptoms such as racing thoughts, characterized by an elevated number of thoughts that are experienced rapidly and without a sense of control (Keizer et al., Reference Keizer, Piguet, Favre, Aubry, Dayer, Gervasoni and Bertschy2014; Piguet et al., Reference Piguet, Dayer, Kosel, Desseilles, Vuilleumier and Bertschy2010). While chiefly associated with mania and depressive symptoms, racing thoughts have also been implicated in state anxiety (Weiner et al., Reference Weiner, Ossola, Causin, Desseilles, Keizer, Metzger and Weibel2019). In cognitive behavioral theory, cognitive disturbances are thought to perpetuate elevated arousal states, and vice versa (Maguth Nezu & Nezu, Reference Maguth Nezu and Nezu2015; Salkovskis et al., Reference Salkovskis, Clark and Gelder1996). For researchers seeking to devise interventions that break cycles of distress within individuals from perinatal populations, it may be useful to empirically investigate whether rapid thought patterns lead to clustered high-intensity speech and how this in turn leads to a chain of physiological and behavioral responses.
An alternative explanation for the finding of clustered, high-intensity vocalizations in anxious caregivers could relate to cognitive load theory and related cognitive deficits observed within anxiety. Cognitive load theory assumes that working memory resources used for processing information are limited; when information inputs are high and working memory resources diminished, this results in heavy cognitive load (Debue & van de Leemput, Reference Debue and van de Leemput2014; Sweller, Reference Sweller1988). Heavy cognitive load has been associated with reduced self-regulatory control (Hofmann et al., Reference Hofmann, Gschwendner, Friese, Wiers and Schmitt2008). In addition, meta-analyses have shown that anxiety restricts the capacity of working memory, raising propensity for heavy cognitive load, potentially due to task-interfering cognitive processes such as uncontrollable worry and active threat monitoring (Gústavsson et al., Reference Gústavsson, Salkovskis and Sigurðsson2021; Moran, Reference Moran2016). In the acoustic literature, heavy cognitive load has been found to affect speech prosody, increasing vocal intensity and “jitter”; an index of vocal aperiodicity (Huttunen et al., Reference Huttunen, Keränen, Väyrynen, Pääkkönen and Leino2011; Mendoza & Carballo, Reference Mendoza and Carballo1998; Murphy, Reference Murphy2000). While direct studies on high-intensity and clustered infant-directed speech have not been conducted, we speculate that young children of caregivers tending toward this vocal behavior might find such communication cognitively taxing, leading to increased arousal lability and distress within interaction.
High-intensity vocalizations in anxious caregivers and autonomic hyperarousal in the dyad
Our results also showed that, in the high anxiety group, both caregivers and infants showed physiological hyperarousal following high-intensity caregiver vocalizations. This may be due to a combination of factors: first, because maternal vocal intensity directly influences infant autonomic reactivity (as has been shown in other populations; Kolacz et al., Reference Kolacz, daSilva, Lewis, Bertenthal and Porges2019); second, because intense vocalizations are more likely to overlap and occur and clusters, as we showed in Hypothesis 3; third because the semantic content of vocalizations from anxious caregivers may differ (as has already been shown in other studies; Nikolić, Brummelman, et al., Reference Nikolić, Brummelman, Colonnesi, de Vente and Bögels2018).
Overall, then, do our results suggest that intense vocalizations among anxious caregivers are a consequence of heightened arousal, or a cause of it? Chains of causation are hard to untangle in naturalistic studies, as the events are overlapping. However, one possibility consistent with our findings is that events take place in dynamic, self-sustaining interactive cascades (Wass, Reference Wass2021a). For example, an increase in child arousal might be more likely to trigger an increase in adult arousal in a caregiver with elevated anxiety; which in turn triggers an intense vocalization, which in turn triggers a further increase in child arousal. Or, an external cause might trigger an increase in adult arousal, which triggers an intense vocalization, which triggers an increase in child arousal, which triggers a further increase in adult arousal; and so on. This bidirectional transfer of arousal states might be understood as a form of “mutual arousal contagion,” a process by which arousal states in partner A cause behaviors that amplify arousal states in partner B, which in turn cause behaviors that further amplify arousal states in partner A, and so on. These interactive dysregulatory cascades are under-researched in developmental psychopathology (Cole et al., Reference Cole, Ramsook and Ram2019; Wass, Reference Wass2021a). In attention deficit hyperactivity disorder (ADHD), for example, there is evidence that caregiver expressed emotions (i.e., hostility, criticism, and low warmth) can operate both as causes, and as consequences, of oppositional child behavior (Christiansen et al., Reference Christiansen, Oades, Psychogiou, Hauffa and Sonuga-Barke2010; Harold et al., Reference Harold, Leve, Barrett, Elam, Neiderhiser, Natsuaki and Thapar2013), but these studies have been conducted at the trait-level (i.e., “do caregivers of children with ADHD tend to show more expressed emotions on average?”) rather than at the state-level (i.e., “how do child/caregiver arousal, caregiving strategies and child oppositional behavior dynamically influence each other during the day?”).
Limitations
There are several limitations to the present study. First, time series analyses only allow for an inference of statistical, granger-causality (whereby changes in time series A forward-predict changes in time series B); as such we are not able to impute a causal chain of events between caregiver reactivity, caregiver vocal behavior, and caregiver–infant reactivity. Future studies incorporating single model approaches, for example, dynamic-causal modeling, would allow for greater investigation of causative pathways between partner variables. Second, caregivers in our sample were not assessed diagnostically for anxiety disorders, but were grouped according to GAD-7 scores; the heterogeneity of different anxiety disorders and high severity levels typically found in clinical samples are therefore underrepresented in the present study. Of note, total GAD-7 scores have been shown to have the same genetic underpinnings as clinically diagnosed anxiety disorders (Purves et al., Reference Purves, Coleman, Meier, Rayner, Davis, Cheesman and Mortensen2020), and the more moderate symptomatology of anxiety represented by the current sample may have broad relevance in terms of effects to the general public. Further research with a clinical population representing multiple different anxiety disorders and a range of severity levels would, however, be needed to investigate more specific effects. Finally, our sample consisted of mothers and thus may not necessarily be representative of caregiver–child relations more generally (though the demographic spread was balanced in other respects, for example, the sample was well-matched with the ethnicity distribution in multicultural cities such as London). We also did not record whether the mothers were genetically related to their infants, limiting a consideration of the potential for genetics to impact the strength of associations. Future studies seeking to investigate stress contagion in the context of perinatal mental health and infant development should incorporate more diverse families in order to shed light on any potential group differences and ensure stronger external validity for the full community of caregivers accessing perinatal services.
Clinical implications and conclusions
These results showing the role of caregiver vocal behavior in caregiver–infant arousal contagion may be clinically useful for understanding and breaking chains of arousal transmission in families where the caregiver is experiencing anxiety. Currently, although there is evidence that caregiver-targeted interventions can improve infant outcomes, these interventions are generally heterogeneous and not informed by an in-depth understanding of how child–caregiver interactions are atypical in caregivers with elevated anxiety (see Smith, Reference Smith2021). For example, a caregiver-mediated, cognitive-behaviour-based intervention might focus on raising awareness that intense vocalizations are more likely to be triggered at times when the caregiver’s arousal is high. It might also raise awareness that intense vocalizations are more likely to occur in clusters, and that intense caregiver vocalizations trigger increases both in child and in caregiver arousal. Consequently, it might focus on diverting arousal-triggering vocalizations. Finally, interventions might also raise awareness that both infants and caregivers are hyperresponsive to one another in dyads where the caregiver has elevated anxiety and discuss mechanisms to cope with this (Smith et al., Reference Smith, Jones, Charman, Clackson, Mirza and Wass2021).
However, future intervention development requires us to consider the extent to which atypical patterns of caregiver–infant coordination fit within a deficit model. Disrupted caregiver–infant coregulation, for instance, may be related to infant development of maladaptive coping as a functional adaptation (Wadsworth, Reference Wadsworth2015). For example, responding to facial or vocal cues of impending caregiver anger or frustration may increase early onset of self-regulatory processes in these infants, as the need for these are potentially higher than offspring of caregivers without mental distress. These complexities of caregiver behavior may lead to unintuitive caregiver–infant patterns of relating; tight coregulation or covariation of regulatory indices may index elevated likelihood of caregiver distress. Those investigating interventions for such dyads may therefore need to take into account the potential threat to the infant’s functional adaptation.
Supplementary material
For supplementary material accompanying this paper visit https://doi.org/10.1017/S095457942100153X
Financial support
This research was funded by ESRC grant number ES/N017560/1 and by ERC grant number ONACSA 853251. The ESRC London Interdisciplinary Social Sciences Doctoral Training Partnership also contributed funding that was necessary to this work.
Conflicts of interest
None.


 Open access