

The transition to Western lifestyles in low- and middle-income countries has resulted in the consumption of more energy-dense foods and obesity, while the problem of undernutrition persists(Reference Varela-Silva, Dickinson and Wilson1, Reference Stifel and Alderman2). This phenomenon is characterized as the nutritional dual burden(Reference Varela-Silva, Dickinson and Wilson1). Latin America is no exception to this emerging manifestation of malnutrition(Reference Varela-Silva, Dickinson and Wilson1, Reference Albala, Vio and Kain3–Reference Duran, Caballero and de Onis6). The dual burden may be manifest at various levels; the population level, the household level and the individual level(Reference Varela-Silva, Dickinson and Wilson1). The present paper focuses on the dual burden at the population level.
This is relevant to Peru, which is undergoing transitions both economically and demographically. The economy grew by 7 % in 2011, ranking fourth in the region and above large economies like Mexico, Chile and Brazil(7). Demographically, the population growth is at 1·1 % annually, the urban growth is at 1·6 %, whereas the rural population is decreasing(8).
Under- and overnutrition are significant public health problems having origins in early childhood. Infant and child stunting are associated with cognitive impairment(Reference Grantham McGregor, Cheung and Cueto9), physical disease and mortality in childhood(Reference Black, Allen and Bhutta10). Stunting in childhood is in turn associated with adult stunting, lower educational attainment and income, and low offspring birth weight(Reference Victora, Adair and Fall11). Overweight and obese children are at heightened risk of a range of physical health problems(Reference Kelishadi12, Reference Daniels13) and infant and childhood overweight increases the risk of subsequent overweight in later childhood, adolescence and adulthood(Reference Baird, Fisher and Lucas14). Overweight in adult age is associated with increased risk of health problems like diabetes and CVD and subsequent death(Reference Daniels13). From a public health perspective, this carry-over nutritional and health effect from infancy and childhood to adulthood points to the urgency of ensuring priority to healthy child nutrition.
While infant and child nutrition is an issue addressed by the research community, there are important limitations in the published analyses. Studies are mostly based on single cross-sectional analyses(Reference El Taguri, Besmar and Abdel Monem15–Reference Garrett and Ruel17). Long-term trends are difficult to ascertain due to the incomparability of data from different time periods and methodological variation. There is a need to establish reliable and valid trend estimates to inform public policy makers about the degree of progress, or lack thereof, in combating malnutrition. Further, very few studies have examined trends covering both stunting and overweight, and those that have tend to examine national and regional trends including several countries, without stratifying by important variables within countries(Reference Albala, Vio and Kain3, Reference Duran, Caballero and de Onis6). As an important example, WHO recommends stratifying anthropometric data by sex and age groups, because children face critical periods in growth development(Reference O'Donnel, Van Doorslaer and Wagstaff18). Furthermore, macro-analyses at national level only may mask important variation in child malnutrition patterns at urban–rural, provincial, maternal education and household wealth levels(Reference Amugsi, Mittelmark and Lartey19).
Moreover and of substantial importance, the research literature is inconsistent in the way malnutrition is operationally defined. Most studies in the literature used now obsolete child growth standards(Reference Duran, Caballero and de Onis6, Reference Fernald and Neufeld20, Reference Rivera, Barquera and González-Cossío21) or used a variety of incomparable cut-off points to define malnutrition(Reference Varela-Silva, Dickinson and Wilson1, Reference Kelishadi12, Reference Mamabolo, Alberts and Steyn22, Reference Martorell, Khan and Hughes23). The currently recommended WHO child growth standards(24) give higher estimates for both stunting and overweight compared with the earlier standards of the US National Center for Health Statistics(Reference Nichols, Nichols and Selwyn25) and the US Centers for Disease Control and Prevention(Reference De Onis, Garza and Onyango26), and this poses serious problems concerning comparison of studies using the various standards. To enable valid comparisons across years, studies are needed that apply the new WHO growth standards to data that pre-date the new standards, as well as newer data. To capture information on subgroup differences within countries, analyses are needed that are stratified by child age, sex and other key sociodemographic variables.
The present study aimed to examine 20-year trends (1991–2011) in stunting and overweight in children aged 0–59 months in Peru, using a study design intended to overcome the limitations described above. The following research question was addressed: what are the national-level sex-specific trends in child stunting and overweight in Peru and in subgroups defined by (i) age, (ii) geographic region, (iii) urban/rural split, (iv) maternal education level and (v) household wealth?
Methods
Study design and sample
The study used cross-sectional data from Demographic and Health Surveys (DHS) in Peru collected at five time points: 1991–92, 1996, 2000, 2007–08 and 2011. The sampling frame for each DHS survey consists of households selected in two stages to be nationally representative(27). The first stage is strata (domains) defined by regional and urban–rural characteristics. Within strata, clusters (census districts) are selected at random. Within clusters, households are selected systematically and all residents are enumerated. One woman from each household aged 15–49 years is selected to complete a detailed questionnaire. Her youngest living child is selected for anthropometry and questions about health(28). The woman response rates were 92·6 % in 1991–92, 92·7 % in 1996, 94·6 % in 2000, 97·7 % in 2007–08 and 97·7 % in 2011(Reference Padilla, Ochoa and Marckwardt29–33). The weighted samples sizes of children aged 0–59 months in the present study were as follows: n 7999 in 1991–92, n 14 877 in 1996, n 11 754 in 2000, n 8232 in 2007–08 and n 8186 in 2011.
Anthropometric measurements
The study applied the currently recommended WHO Child Growth Standards for international use(24, Reference De Onis, Garza and Onyango26). Z-scores and the prevalences of stunting and overweight were computed using a syntax file provided by WHO(34). Stunting is defined as height-for-age less than −2 sd below the median of the reference population (height-for-age Z-score (HAZ) <–2), and overweight is defined as weight-for-height more than +2 sd above the median of the reference population (weight-for-height Z-score (WHZ) >+2). Extreme values beyond +/− 6 sd were excluded according to recommendations by WHO(35). Supine length was measured for children below 24 months and standing height was measured for children over 24 months. Details on anthropometric measurement in DHS can be found elsewhere(36). Personnel with responsibility for anthropometric measures data collection received special training by professionals before each data collection. Data were later verified for consistency(Reference Padilla, Ochoa and Marckwardt29–33).
Sociodemographic variables
Sociodemographic variables used for stratification were sex, age in months (0–5, 6–11, 12–23, 24–35, 36–47, 48–59), urban–rural residence, geographic region, maternal education and household wealth. Data on the latter four variables were obtained through household questionnaires(Reference Padilla, Ochoa and Marckwardt29–33). Wealth was assessed using a standard composite Wealth Index based on household material goods and housing quality(Reference Rutstein and Johnson37). Child age was documented by asking the mother the day, month and year the child was born, as well as how many years old the child was at time of interview(Reference Padilla, Ochoa and Marckwardt29–33).
Ethical approval
Data were collected with informed consent and anonymity of respondents was assured(Reference Padilla, Ochoa and Marckwardt29–32). The questionnaires and protocols were reviewed and approved by the Macro Institutional Review Board and the Peruvian National Institute for Statistics (INEI) Ethics Board.
Data analysis
Data analyses were performed using the statistical software package IBM SPSS Statistics 19·0. Data sets from all five survey rounds were combined through the ‘merge’ function in IBM SPSS Statistics 19·0. Sample weights were used to account for unequal probability of sampling and for non-response. Multilevel analyses accounted for sampling strata and clusters. Logistic regression analyses examined trends over time within subgroups and between subgroups. The regression was performed of stunting and overweight prevalence v. time represented by the five data collection points (Tables 1–6). The Wald F statistic was used to test the significance of trends (P < 0·05). For comparison purposes, the national levels of stunting/overweight are included in the first row of Tables 1–4.
Prevalence estimates for stunting (height-for-age <−2 sd below the median of the reference populationFootnote *) in males (aged 0–59 months) and test for trend over time by sociodemographic factors. Peru Demographic and Health Surveys, 1991–2011

* Using the 2006 WHO Child Growth Standards(24).
† Statistical significance of trends across years within each subgroup (P ≤ 0·05).
Results
Stunting
Across all survey years, 4630 of 56 168 (8·2 %) of children who were eligible for anthropometry measurement were excluded from the present study due to measurement problems including missing measurements and out-of-range values for growth Z-scores (<−6·00 and >+6·00). As shown in Tables 1 and 2, stunting nationally decreased significantly from 37·4 % in 1991–92 to 19·3 % in 2011 (F(1, 5149) = 174·8, P ≤ 0·00). Analyses for sociodemographic subgroups largely showed similar, statistically significant declining trends for both sexes. The results reported below concentrate on the exceptions to the general declining trend and on differences in the steepness of declines in subgroups. The only marked exception to the overall declining trend was observed for males and females in the age groups 0–5 and 6–11 months, in which stunting prevalence remained stable over the period (Tables 1 and 2).
Prevalence estimates for stunting (height-for-age <–2 sd below the median of the reference populationFootnote *) in females (aged 0–59 months) and test for trend over time by sociodemographic factors. Peru Demographic and Health Surveys, 1991–2011
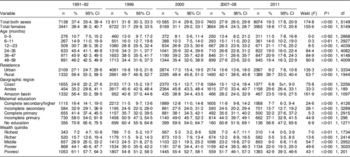
* Using the 2006 WHO Child Growth Standards(24).
† Statistical significance of trends across years within each subgroup (P ≤ 0·05).
Also, as shown in Table 6, there were some instances in which the steepness of declines varied significantly. Stunting in urban areas declined more steeply over the study period compared with rural areas (F(1, 5149) = 16·8, P ≤ 0·00). For geographic region, in comparison with the Andes, the decline in stunting was significantly steeper in the Coastal region (F(1, 4094) = 15·2, P ≤ 0·00) and in the Amazon region (F(1, 2954) = 35·6, P ≤ 0·00). With regard to educational attainment of mothers, the decline in stunting was significantly steeper among children having mothers in the highest education group compared with those in the primary education group (F(1, 4925) = 7·9, P ≤ 0·01). The comparison of the steepness of declines was also undertaken between age groups and Wealth Index quintiles, with no significant differences revealed.
Overweight
For overweight across all survey years, the (unadjusted) number excluded due to anthropometry measurement problems was 4895 of the total sample of 56 168 (8·7 %). The national trend in overweight was stable across the study period (F(1, 5147) = 0·4, P ≤ 0·5) and this was also observed in the sex-specific analyses (Tables 3 and 4). Subgroup analyses, however, revealed exceptions of both worsening and improving trends. The instances of statistically significant worsening trends were for Coastal males (F (1, 2255) = 4·8, P ≤ 0·03) and highest wealth quintile males (F(1, 1730) = 5·5, P ≤ 0·02).
Prevalence estimates for overweight (weight-for-height >+2 sd above the median of the reference populationFootnote *) in males (aged 0–59 months) and test for trend over time by sociodemographic factors. Peru Demographic and Health Surveys, 1991–2011

* Using the 2006 WHO Child Growth Standards(24).
† Statistical significance of trends across years within each subgroup (P ≤ 0·05).
Prevalence estimates for overweight (weight-for-height >+2 sd above the median of the reference populationFootnote *) in females (aged 0–59 months) and test for trend over time by sociodemographic factors. Peru Demographic and Health Surveys, 1991–2011
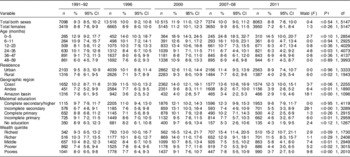
* Using the 2006 WHO Child Growth Standards(24).
† Statistical significance of trends across years within each subgroup (P ≤ 0·05).
Statistically significant declining trends in overweight were observed in the subgroups of females aged 24–35 months (F(1, 4073) = 4·8, P ≤ 0·03), rural males (F(1, 1943) = 8·7, P ≤ 0·00), rural females (F(1, 1943) = 6·0, P ≤ 0·02), Amazon region full sample (F(1, 1096) = 35·3, P ≤ 0·00), Andean region full sample (F(1, 1890) = 12·7, P ≤ 0·00), incomplete secondary education full sample (F(1, 3289) = 24·7, P ≤ 0·00) and incomplete primary education full sample (F(1, 2959) = 12·5, P ≤ 0·00). As shown in Table 5, there was also a significantly steeper decline in the Amazon region compared with the Andes (F(1, 2953) = 8·6, P ≤ 0·00).Footnote *
Prevalence estimates for stunting (height-for-age <–2 sd below the median of the reference populationFootnote *) and overweight (weight-for-height >+2 sd above the median of the reference populationFootnote *) in children (aged 0–59 months) for selectedFootnote † sociodemographic factors. Peru Demographic and Health Surveys, 1991–2011
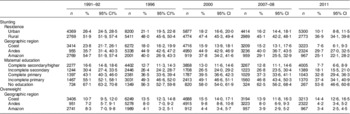
* Using the 2006 WHO Child Growth Standards(24).
† Data are given for selected sociodemographic groups for which statistically significant differences in slopes were observed, e.g. urban v. rural, see Table 6.
Statistically significant differences in the regression β coefficients (slopes of prevalence trends) between sociodemographic groupsFootnote * for stunting (height-for-age <–2 sd below the median of the reference populationFootnote †) and overweight (weight-for-height >+2 sd above the median of the reference populationFootnote †) in children (aged 0–59 months). Peru Demographic and Health Surveys, 1991–2011

* Results are given only for significant differences.
† Using the 2006 WHO Child Growth Standards(24).
‡ Statistical significance of the difference in regression coefficients between groups (P < 0·05).
§ Group 1.
∥ Group 2.
Discussion
Over the 20-year period examined, the present study found a statistically significant decrease in overall child stunting and no overall change in the level of child overweight in Peru. This is the first publication of child malnutrition trends over such an extended period using the same operational definitions of stunting and overweight for all data points. While the overall findings summarized above were reflected to a large degree in analyses that examined trends by sociodemographic subgroups, there were important exceptions (for example, stunting was stable in the two youngest age groups, but decreased in the three eldest). These results suggest that while national-level data are appropriate for international comparative studies, stratified analyses are called for when the public health profile within a particular country is the focus.
Indeed, the observation of some encouraging trends should not cause complacency. Seen from the standpoint of health equity, the national estimate of 19·3 % child stunting in 2011 is almost eight times the level of stunting in the WHO reference group. Examining the subgroups with the highest stunting estimates in Peru in 2011 – children of mothers with no education – males are at twenty times and females are at twenty-three times the level of stunting of the WHO reference group. Knowing that all but a small fraction of children less than 59 months old avoid growth faltering when they develop in a healthy environment, the room for improvement in Peru remains large, and the present findings should serve as a call to renewed effort for child health in the country.
The national improvements in stunting might partly be accounted for by economic growth. Previous research has documented an association between economic development and health in Peru(Reference Pritchett and Summers38). The Amazon region has documented increasing economic development in several domains from 2003–2007, almost on a level with national economic growth(Reference Yamada39). This could be one explanation for the decreasing stunting levels in this region. However, Acosta(Reference Acosta40) argues that the improvements in child nutrition in the past decade are mainly due to the political efforts, particularly in the form of social welfare programmes, implemented to reduce poverty and poor health among vulnerable populations. Yamada et al.(Reference Yamada and Castro41), on the other hand, argue that such programmes have actually failed due to poor quality, design, targeting, low priority in times of recession and low fiscal priority compared with other countries in the region. Further, evaluations of specific programmes(Reference Stifel and Alderman2, Reference Gajate and Inurritegui42, Reference Perova and Vakis43) have failed to observe long-term reductions in child malnutrition. It is therefore difficult to determine the degree to which declining stunting trends observed in the present study are due to social welfare programmes. Besides social welfare programmes, national investments in health infrastructure may affect child malnutrition. Research on the effects of such investments on child stunting in Peru in recent decades shows a positive effect for urban children, with the effect being stronger for children in low-income groups compared with high-income groups, whereas no effect was found for rural children(Reference Valdivia44). In spite of economic growth in recent decades(7, 8), social inequalities in nutritional status persist in Peru, disfavouring rural populations and people living in the Andean region(Reference Urke, Bull and Mittelmark45).
With regard to overweight, which is of mounting concern in the child health literature(Reference Poskitt4), only a few subgroup analyses revealed a significant increase in overweight (male children in the coastal region and households in the richest wealth quintile). Conversely, significant declining trends were observed in many subgroups in the present study. Thus, the overall pattern in Peru is one of a stable trend in overweight. This is somewhat surprising, given the concern for an increase in child overweight in Latin America in recent years(Reference Uauy, Albala and Kain46). An increase in overweight would imply changes in the factors contributing to overweight (e.g. lifestyle changes affecting children) and based on our study findings we hypothesize that, overall, such changes have not been sufficient to result in a national upward trend of child overweight. However, this does not presume that no such changes have taken place. The upward overweight trends for some subgroups in the present study are consistent with other research in low- and middle-income countries, which observes that an increase in overweight is most often a phenomenon of the higher social classes(Reference El Taguri, Besmar and Abdel Monem15, Reference Kain, Vio and Albala47, Reference Popkin, Adair and Ng48) and urban areas(Reference Kain, Vio and Albala47, Reference Popkin, Adair and Ng48). Increases in overweight have been attributed to lifestyle changes in specific population groups, for example in urban areas. Sedentary jobs and greater access to cheap, high-fat and processed foods can contribute to the increase in overweight observed in the present study as well as elsewhere(Reference Uauy, Albala and Kain46–Reference Popkin, Adair and Ng48). Previous research observed that energy intake for children increased with household urbanization and increasing socio-economic status(Reference Kelles and Adair49) and that child overweight was positively associated with higher socio-economic status and a ‘snacking dietary pattern’ in urban children(Reference McDonald, Baylin and Arsenault50). In rural areas, on the other hand, processed food is more expensive and the naturally grown foods are cheaper(Reference Uauy, Albala and Kain46), possibly resulting in a slower acceleration of overweight prevalence.
The considerations just mentioned point to the value of subgroup analyses, such as are presented in the current paper. The stratified analyses of stunting and overweight show that Peru, similar to its regional neighbours(Reference Rivera, Barquera and González-Cossío21), may be entering a nutritional transition that includes very young children. Although the findings in the present study do not indicate the typical ‘from underweight to overweight’ transition, the nutritional challenges may take on different forms depending on socio-economic status and type of residence, as is characteristic of the transition as observed in some other low- and middle-income countries(Reference El Taguri, Besmar and Abdel Monem15).
As for all survey research, the DHS in Peru faces methodological challenges. As discussed by Pullum(Reference Pullum51), much of the DHS data are produced by self-reports of mothers about their own situation and experience and their child's health. Only anthropometric measurements are obtained independently and are clearly not affected by self-reporting bias. In addition, DHS analyses of seasonality effects indicate the possibility of seasonal variation in prevalence estimates for various health end points. It is a limitation of the DHS design that such seasonality effects cannot be eliminated or controlled for. There is some evidence that during the 3- to 6-month interval of fieldwork for the typical DHS survey, there is usually variation across months in the prevalence of some health measures. However, this is observed mainly for symptoms such as cough(Reference Pullum51). The extent to which such seasonality effects are evident for child growth measurement has not been addressed as far as we are aware. Regarding anthropometry, important sources of error include incorrect measurement of age, height/length and weight. As an example, DHS reports digit bias in the recording of child height, but concludes that digit bias is not likely to introduce an important level of error in the calculation of child growth variables.
A further limitation is the selection of a mother's youngest child as the index child, with all other children in the household excluded from study. The findings from the present study, therefore, cannot be generalized to the entire population of children aged 0–59 months.
The operational definitions of stunting and overweight deserve critical consideration. The standards used to determine stunting and overweight in the present study are those established by the WHO in 2006(24) based on the results of the Multicentre Growth Reference Study. The intention of the WHO was to establish a new international standard, replacing the previous standard in which the reference population was restricted to children in the USA(Reference Waterlow, Buzina and Keller52). Because of this shift, the proportions of children who are classified as stunted and as overweight are higher under the new WHO standard than under the previous standard. The problem of two standards has been exacerbated in the literature, with some newer studies using the old standard and others using the new standard. The decision in the present study to use the new standard, and not present comparative analyses using the old standard, obscures the differences in stunting and overweight that result from the change in growth standards dating from 2006.
Aside from these general considerations, from DHS survey to survey, in country to country, local conditions have affected data collection. As an example from Peru, in 1991–92, sixty-six districts of the non-metropolitan domain had to be excluded due to inadequate conditions for data collection. The excluded districts were mainly small rural villages and some areas experiencing social violence at the time(Reference Padilla, Ochoa and Marckwardt29). Rural residence and violent conditions are related to higher food insecurity and poorer medical care(Reference Krug, Dahlberg and Mercy53) that might result in increased stunting prevalence. Hence, a possible consequence of the area exclusion is conservative stunting estimates for the 1991–92 (or following) data point.
It is also important to note that prior to 2003, DHS surveys were discrete activities. The continuous survey methodology was introduced from 2003, without the breaks between surveys that characterized the previous survey rounds. To preserve distinct cycles between surveys and due to practical issues such as the timing of the collection of anthropometric data, the second-to-last round of data was restricted to that collected in 2007–08 and the last round of data – collected in 2011 – was the latest available in time for inclusion in the present analysis. As a result, the interval between survey rounds used in the present study ranged from 3 to 7 years.
The regression analyses used to study trends assume linearity. An examination of the point prevalence estimates of stunting and of overweight call this assumption into question for some subgroups. In preliminary analyses not reported here due to space limitations, χ 2 tests for homogeneity revealed some prevalence patterns that departed from the assumption of homogeneity. The decision to use a linear test of trend and not a non-linear test followed from concern that few data points were available, just five in all. Nevertheless, the overall pattern of results seems to reasonably support our main conclusions.
Notwithstanding these limitations, the present study provides unique data about the trends in child growth in Peru, using the current recommended growth standards and operational definitions of stunting and overweight, and providing estimates of malnutrition for important demographic subgroups. It provides evidence that stunting is declining in almost all subgroups examined. However, particular subgroups continue to suffer from elevated levels of stunting, while other subgroups may be transitioning to join the global pandemic of overweight.
Acknowledgements
Sources of funding: This research received no specific grant from any funding agency in the public, commercial or not-for-profit sectors. Conflicts of interest: The authors declare no conflict of interest. Ethics: Ethical approval was not required. Authors’ contributions: H.B.U. did preliminary and final statistical analyses and wrote the first draft of this paper. She interpreted the results and contributed to later drafts, including the present manuscript. M.B.M. conceived of the study. He interpreted the results and contributed to later drafts, including the present manuscript. M.V. interpreted the results and contributed to later drafts, including the present manuscript. All authors were involved in data interpretation and critical revisions of the paper. All three authors read and approved the final revised draft for publication. Acknowledgements: The Demographic and Health Surveys of Peru for 1991, 1996, 2000, 2007–08 and 2011 were collected in collaboration with the Peruvian National Institute for Statistics (INEI), Asociación Benéfica PRISMA, the United Nations Development Programme (UNDP), UNICEF, the United Nations Population Fund (UNFPA), the US Agency for International Development (USAID) and the Peruvian Ministry of Economy and Finance. The authors would like to acknowledge the contributions made by collaborating partners, staff, field workers and participants of the Peru DHS.


 Open access