

Introduction
With the rapid growth of the global older adult population, the health issues of older adults have attracted significant attention from scholars (Hallerod and Gustafsson Reference Hallerod and Gustafsson2011; Kingston et al. Reference Kingston, Davies, Collerton, Robinson, Duncan, Kirkwood and Jagger2015). Socio-economic status (SES) is one of the key factors influencing the health of older adults (Payne and Xu Reference Payne and Xu2022). Several studies have identified both childhood and adulthood SES as important predictors of health in later life (Faul et al. Reference Faul, Ware, Kabeto, Fisher and Langa2021; Fan and Chen Reference Fan and Chen2023). Childhood SES shapes the initial conditions for individual development, such as access to education and health care, thereby affecting subsequent life experiences. Consequently, older adults with disadvantaged childhood SES may face poorer health outcomes in later life (Luo and Waite Reference Luo and Waite2005). However, the impact of childhood SES on the health of older adults can be moderated by adulthood SES, as favourable adulthood SES can mitigate the adverse effects of disadvantaged childhood SES (Huoyun et al. Reference Huoyun, Shilong, Zhaoqi and Huiqin2023). Overall, the health effects of SES exhibit a cumulative nature. This highlights the need to examine SES from a lifecourse perspective, with particular attention to the impact of lifelong SES changes on the health of older adults (Gugushvili et al. Reference Gugushvili, Zhao and Bukodi2019).
Although some studies have focused on the impact of SES on the health of older adults, most have only examined static health outcomes and failed to reflect how SES influences the patterns and dynamics of health changes among older adults. For instance, older adults with favourable childhood SES tend to have better mental health (Morrissey and Kinderman Reference Morrissey and Kinderman2020), better activities of daily living (ADLs; Haas Reference Haas2008) and a lower risk of mortality (Ferrie and Rolf Reference Ferrie and Rolf2011). Additionally, adulthood SES also exerts an influence on the health of older adults (Kong et al. Reference Kong, Hoshi, Ai, Shi, Nakayama, Wang and Yang2014). Typically, older adults’ health with age may follow certain patterns, and understanding these patterns is a crucial foundation for health interventions targeting this group. Previous research has demonstrated significant heterogeneity in older adults’ health status with age: in terms of physical function, for example, some may experience early-onset physical function limitations while others have late-onset ones (Zimmer et al. Reference Zimmer, Martin, Jones and Nagin2014). Similarly, studies on cognitive function have identified heterogeneous trajectories of cognitive impairment among older adults (Hu et al. Reference Hu, Gu, Sun, Gu, Zhen, Li, Huang, Wei and Dong2019; Han et al. Reference Han, An and Chan2022). Compared to static health indicators, dynamic health trajectories are better able to capture more comprehensive information and fully reflect the disability process of older adults (Zimmer et al. Reference Zimmer, Martin, Jones and Nagin2014; Wei et al. Reference Wei, Li and Wang2018).
Existing research on the association between SES and older adults’ health has several limitations. First, most studies focus on either childhood or adulthood SES, with few examining how lifetime SES influences older adults’ health (Luo and Waite Reference Luo and Waite2005; Morrissey and Kinderman Reference Morrissey and Kinderman2020; Fan and Chen Reference Fan and Chen2023). Second, the majority of studies concentrate on static health outcomes among older adults (e.g. depression, diseases, etc.), failing to reflect the trends and patterns of changes in their health status (Ferrie and Rolf Reference Ferrie and Rolf2011; Williams et al. Reference Williams, Cunich and Byles2013; Ko et al. Reference Ko, Oh, Subramanian and Kim2025). Given that the lifecourse of Chinese older adults largely aligns with China’s rapid economic and social development since its founding, characterized by significant changes in SES, and considering the notable health disparities among Chinese older adults, data on Chinese older adults may more clearly illustrate the relationship between lifetime SES and late-life health. Therefore, we aim to explore the associations between lifetime SES and disability trajectories of older adults using Chinese data.
In this article, we attempted to apply the disablement process theory within the lifecourse perspective and utilized longitudinal data to examine the associations between lifetime SES and disability trajectories, thereby making the following possible contributions: (1) identifying distinct subgroups of disability (both physical function and cognitive function) trajectories among older adults; (2) exploring the associations between childhood/adulthood SES and disability trajectories; and (3) examining the associations between social mobility from childhood to adulthood and disability trajectories among older adults.
Literature review
The disablement process theory and disability trajectories
The disablement process theory provides a framework for investigating inter-individual variability in the development of disability, which states that disability is a dynamic and time-dependent process and that the trajectory of disability can capture long-term information about the direction, pace and patterns of physical and cognitive decline over time. The disability process in older adults may progress through a sequence of ‘pathology → impairments → functional limitations → disability’ (Verbrugge and Jette Reference Verbrugge and Jette1994). This sequence clarifies a clear progression: pathology first causes impairments (organ-level dysfunctions), which may lead to functional limitations (restrictions in basic personal actions), and ultimately culminate in disability and difficulty performing daily activities.
The disablement process theory provides a general description of disability in older adults, but this does not mean that all older adults follow the same disability trajectory. For instance, in terms of cognitive function, the rate of cognitive decline among older adults may fall into four categories: slow, moderate, progressive and rapid (Hu et al. Reference Hu, Gu, Sun, Gu, Zhen, Li, Huang, Wei and Dong2019). Regarding physical function, limitations in this domain among older adults can be classified into three types: early-onset, middle-onset and late-onset (Zimmer et al. Reference Zimmer, Martin, Jones and Nagin2014). While existing studies have not reached consensus on the exact number of subgroups of disability trajectories among older adults, they all confirm that the disability process in this population exhibits significant heterogeneity (Kingston et al. Reference Kingston, Davies, Collerton, Robinson, Duncan, Kirkwood and Jagger2015; Xiao et al. Reference Xiao, Shi and Fang2021; Han et al. Reference Han, An and Chan2022).
Multidimensional and dynamic measurement of SES
Socio-economic status is a quintessentially multidimensional construct, and no consensus has been reached across studies regarding its measurement (Oakes and Rossi Reference Oakes and Rossi2003). According to existing research, SES measurement typically centers on three core dimensions: first, objective material resources, which can be specifically operationalized through indicators such as income level and asset accumulation (Ellegård et al. Reference Ellegård, Kjellsson, Kovacs and Zhao2025); second, objective social status, commonly measured using variables like occupational prestige and educational attainment (Huoyun et al. Reference Huoyun, Shilong, Zhaoqi and Huiqin2023); and third, the subjective evaluation dimension, primarily captured through respondents’ self-assessments of their own socio-economic circumstances (Coustaury et al. Reference Coustaury, Jeannot, Moreau, Nietge, Maharani, Richards and Präg2023). Compared with single indicators (e.g. income alone or education alone) that only reflect one aspect of SES, using composite indicators which integrate key SES dimensions like occupation, education and economic status allows for a more accurate and comprehensive capture of the construct’s rich connotations (Payne and Xu Reference Payne and Xu2022). In this study, we will also use a composite indicator approach to measure SES.
Additionally, SES measured at a single point in time cannot capture its dynamic changes throughout the lifespan and its cumulative impact on health. From a lifecourse perspective, SES is a dynamic construct capturing social circumstances and changes over time, typically conceptualized as lifetime SES measured at different life stages (Islam and Jaffee Reference Islam and Jaffee2024). Therefore, this study adopts a lifecourse perspective, viewing SES as a dynamic trajectory throughout life, rather than simply a static attribute (Huoyun et al. Reference Huoyun, Shilong, Zhaoqi and Huiqin2023). This perspective emphasizes that early socio-economic environment (childhood SES) sets an initial health trajectory for individuals, while socio-economic achievements in adulthood (adulthood SES) can modify or reinforce this trajectory. The change between the two, namely social mobility, whether upward, downward or stable, is itself an important health factor. Thus, lifetime SES in the study is measured by childhood SES, adulthood SES and social mobility from childhood to adulthood.
The impact of SES on older adults’ health and its trajectories
Socio-economic status is one of the key factors influencing the health of older adults, as it is associated with living and working conditions, access to health care and healthy lifestyles, which in turn shape older adults’ physical, psychological and cognitive health (Luo and Waite Reference Luo and Waite2005).
Most previous studies have focused on the impact of adulthood SES on health. Consistent evidence shows that favourable adulthood SES is associated with better mental and physical health (Hallerod and Gustafsson Reference Hallerod and Gustafsson2011; Williams et al. Reference Williams, Cunich and Byles2013; Kong et al. Reference Kong, Hoshi, Ai, Shi, Nakayama, Wang and Yang2014). However, a growing body of research has also found that childhood SES exerts a long-term influence on health (Ferrie and Rolf Reference Ferrie and Rolf2011; Wolfe Reference Wolfe2015). For instance, one study has indicated that adverse childhood SES is associated with a high-risk trajectory of functional limitations (Haas Reference Haas2008). Financial hardship in childhood may have a persistent impact on anxiety and depressive symptoms in adulthood (Morrissey and Kinderman Reference Morrissey and Kinderman2020). Thus, the effects of childhood SES may persist into middle and old age (Fan and Chen Reference Fan and Chen2023), a phenomenon also referred to as ‘the long arm of childhood’ (Ferrie and Rolf Reference Ferrie and Rolf2011). Thus, we proposed the following hypotheses:
Hypothesis 1a: The older adults with low childhood SES are more likely to be in the higher-risk physical and cognitive trajectories than those with higher childhood SES.
Hypothesis 1b: The older adults with low adulthood SES are more likely to be in the higher-risk physical and cognitive trajectories than those with higher adulthood SES.
As SES measured at different life stages can contribute independently to future health outcomes, measures of social mobility can capture the joint contributions to health of SES at these distinct points in time (Islam and Jaffee Reference Islam and Jaffee2024). The social mobility hypothesis moderates ‘the long arm of childhood’, suggesting that the health impacts of childhood SES can be modified by adulthood SES, which exerts more independent and direct effects on the health of older adults (Hallerod and Gustafsson Reference Hallerod and Gustafsson2011; Morrissey and Kinderman Reference Morrissey and Kinderman2020). For instance, upward SES mobility can partially mitigate or reverse the impacts of adverse childhood SES, whereas downward mobility may lead to individual psychological distress, trigger chronic stress and result in deteriorating health (Kim and Durden Reference Kim and Durden2007; Gugushvili et al. Reference Gugushvili, Zhao and Bukodi2019). In addition to upward and downward SES mobility, stable low or high SES over the lifecourse can lead to a time-varying dose-response effect, as the cumulative hypothesis proposes that the health (dis)advantages of SES accumulate with age (Darin-Mattsson et al. Reference Darin-Mattsson, Andel, Celeste and Kareholt2018). Therefore, we proposed the following hypotheses:
Hypothesis 2a: The older adults with downward mobility are more likely to be in the higher-risk physical and cognitive trajectories than those remaining stable.
Hypothesis 2b: The older adults with downward mobility are more likely to be in the higher-risk physical and cognitive trajectories than those with upward mobility.
Considering that gender roles and regional differences can closely reflect a country’s cultural and social context (Nagamine et al. Reference Nagamine, Fujiwara, Tani, Murayama, Tabuchi, Kondo and Kawachi2020), and that China’s tremendous socio-economic changes in recent decades have contributed to advances in gender equality and uneven regional development, these factors may lead to gender and regional heterogeneity in the association between social mobility and disability trajectories.
Existing studies suggest that the impact of social mobility on health may exhibit gender differences. For example, SES mobility is negatively correlated with women’s body weight but has no significant effect on men’s (Ball and Crawford Reference Ball and Crawford2005). However, a European study found that SES mobility is positively associated with cognitive function, grip strength and quality of life, with the association between SES and physical function being stronger for men than for women (Ahrenfeldt and Möller Reference Ahrenfeldt and Möller2021). A Japanese study indicated that downward mobility is associated with mortality among men, but not among women (Nagamine et al. Reference Nagamine, Fujiwara, Tani, Murayama, Tabuchi, Kondo and Kawachi2020). These studies have shown that SES exerts a stronger impact on women’s health than on men’s for certain health outcomes.
China divides the country into several regions based on economy and geography: the eastern region mainly consists of more developed coastal provinces, while the central and western regions are predominantly composed of less-developed inland provinces. There are disparities in socio-economic development across different regions. For instance, compared with the central and western regions, the eastern region boasts a higher level of economic development and better health-care services (Liu et al. Reference Liu, Chen, Chi, Wu, Pei, Song, Zhang, Pang, Han and Zheng2010). Consequently, older adults residing in different regions may have unequal opportunities for upward mobility, and such disparities may further widen the health gap among older adults. Therefore, the impact of social mobility on disability trajectories may exhibit regional differences. In the subgroup analysis, we proposed the following hypotheses:
Hypothesis 3a: The impact of social mobility on physical and cognitive trajectories varies by gender.
Hypothesis 3b: The impact of social mobility on physical and cognitive trajectories varies by region.
Methods
Data
We used data from five waves (2011, 2013, 2015, 2018, 2020) of the China Health and Retirement Longitudinal Study (CHARLS) and the CHARLS life history survey (2014). CHARLS is nationally representative of Chinese people aged 45 years and older and follows a multi-stage probability sampling strategy by design that is comparable to the Survey of Health, Ageing and Retirement in Europe (SHARE) and the Health and Retirement Study (HRS): 150 counties within 28 provinces were randomly selected in the first stage, then three villages/urban communities were randomly selected within each county, after which households were randomly selected within each village/urban community (Hu Reference Hu2021; Qin et al. Reference Qin, Kong and Moorman2023). The CHARLS life history survey collected key information from respondents, including their family background, childhood experiences, educational history, health history and wealth-related history (Hu Reference Hu2021).
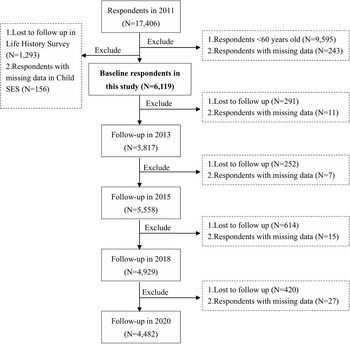
We conducted a rigorous sample inclusion process, and a total of 17,406 respondents were included in the 2011 baseline survey. We first excluded respondents under the age of 60 (9,595 respondents) and those with missing variable data (243 respondents). Building on this, the study further excluded respondents who did not participate in the life history survey (1,293 respondents), as well as those with missing data on childhood SES variables (156 respondents). In total, 6,119 respondents were included in the final sample of this study. During subsequent follow-up waves, additional exclusions were made for respondents with missing data on ADLs and the Mini-Mental State Examination (MMSE). Specifically, 5,817 respondents continued to participate in the 2013 wave, 5,558 respondents participated in the 2015 wave, 4,929 respondents participated in the 2018 wave, and 4,482 respondents participated in the 2020 wave. For additional details, please refer to the flow chart of sample selection in Figure 1.
Flow chart of sample inclusion.

Measures
Dependent variables
Our main outcome is disability trajectories, including physical trajectories and cognitive trajectories. The physical function is measured using ADLs, defined as the number of items for which an older adult is dependent on others or needs assistance with among the six basic items (dressing, eating, bathing, getting in and out of bed, using the toilet, and controlling urination and defecation) (Liu et al. Reference Liu, Li, Rommel and Feng2020). For each item, respondents were asked if they had difficulty performing it independently, and their responses were ‘1 = Yes, I have difficulty and need help/I cannot do it’, ‘0 = No, I do not have any difficulty/I have difficulty but I can still do it’. Adding up the scores, we created a physical function score ranging from 0 to 6, with 0 representing no disability in ADLs. The higher the score, the more severe the physical limitations.
Cognitive function was measured using two indicators similar to those in the HRS: episodic memory and intact mental status (Lei et al. Reference Lei, Smith, Sun and Zhao2014). Episodic memory includes immediate word recall and delayed word recall, ranging from 0 to 10. Intact mental status includes time concept, calculation ability and drawing, ranging from 0 to 11. Therefore, we constructed a total cognitive function score ranging from 0 to 21 by summing scores on episodic memory and intact mental status. In some studies, the higher the score, the better the cognitive function (Lei et al. Reference Lei, Smith, Sun and Zhao2014). To be consistent with the physical function score, we used a reverse scoring method for the cognitive function score, meaning that the higher the score, the more severe the cognitive impairment.
We used the group-based trajectory model (GBTM) to identify distinct physical and cognitive groups of older adults. Therefore, dependent variables were the disability trajectory groups, focusing on both physical and cognitive functions.
Independent variables
The key independent variable was lifetime SES, which reflects the lifecourse pattern of socio-economic conditions, including childhood SES, adulthood SES and social mobility from childhood to adulthood.
To measure SES, we adopted the composite indicator approach and ultimately selected four specific indicators: hukou (China’s dual urban–rural household registration system), education, occupation and household economic status, to operationalize it (Faul et al. Reference Faul, Ware, Kabeto, Fisher and Langa2021; Ko et al. Reference Ko, Oh, Subramanian and Kim2025). Hukou determines eligibility for various welfare benefits and is a strong predictor of socio-economic resources and wellbeing for individuals in China (Huoyun et al. Reference Huoyun, Shilong, Zhaoqi and Huiqin2023; Qin et al. Reference Qin, Kong and Moorman2023).
Accordingly, childhood SES was measured by four binary variable indicators: childhood Hukou (1 = urban Hukou, 0 = otherwise), parental education level (1 = literate, 0 = otherwise), parental work status (1 = stable income job, 0 = otherwise) and perceived family economic status (1 = average or above in the community where they lived, 0 = otherwise). Adulthood SES was measured in a similar way to childhood, including Hukou, respondents’ education level, work status and perceived family economic status.
We used the sum of four binary variable indicators to measure SES in childhood and adulthood, and then normalized the standardized SES scores as follows (Luo and Waite Reference Luo and Waite2005). Specifically, we used linear normalization as follows.
 \begin{equation}\begin{array}{*{20}{c}}
{SES{\text{ }}score{s_i} = \frac{{SES{\text{ }}score{s_i} - \min \left( {SES{\text{ }}score{s_i}} \right)}}{{\max \left( {SES{\text{ }}score{s_i}} \right) - \min \left( {SES{\text{ }}score{s_i}} \right)}}}
\end{array}\end{equation}
\begin{equation}\begin{array}{*{20}{c}}
{SES{\text{ }}score{s_i} = \frac{{SES{\text{ }}score{s_i} - \min \left( {SES{\text{ }}score{s_i}} \right)}}{{\max \left( {SES{\text{ }}score{s_i}} \right) - \min \left( {SES{\text{ }}score{s_i}} \right)}}}
\end{array}\end{equation} We generated SES variables based on the normalized SES scores, including low ( $SES{\text{ }}score{s_i}$≤ 0.33), middle (0.33 < $SES{\text{ }}score{s_i}$ ≤ 0.67) and high (0.67 < $SES{\text{ }}score{s_i}$ ≤ 1) categories. On this basis, we defined the flow of social mobility from childhood to adulthood as upward mobility (low-middle, low-high, middle-high), downward mobility (middle-low, high-middle, high-low) and remaining stable (low-low, middle-middle, high-high).
Control variables
We controlled for confounding factors, including demographic characteristics: gender (1 = man, 0 = woman), birth cohort (< 1936, 1937–1941, 1942–1946, 1947–1951) and marital status (1 = with a spouse, 0 = otherwise); behaviour: smoking behaviour (1 = smoke, 0 = otherwise), drinking behaviour (1 = drink, 0 = otherwise); health: chronic diseases (1 = had one or more chronic diseases, 0 = otherwise) and BMI (underweight: BMI < 18.50; normal: 18.5 ≤ BMI ≤ 23.9; overweight: BMI > 23.9) (Foraker et al. Reference Foraker, Rose, Chang, McNeill, Suchindran, Selvin and Rosamond2011; Liu and Guo Reference Liu and Guo2015; Gugushvili et al. Reference Gugushvili, Zhao and Bukodi2019).
In addition, some characteristics did not change over time but could affect the results, so we controlled the respondents’ living region (1 = eastern region, 0 = midwestern region). During the follow-up, some respondents dropped out of the survey, which could lead to biased estimates. To control for this bias, we created a binary variable ‘dropout’ (1 = dropped out of the follow-up survey, 0 = otherwise) to incorporate into the model.
Methods
First, we used the GBTM to identify distinct disability trajectories (both physical function and cognitive function). The GBTM is a specialized application of finite mixture modelling, which can capture heterogeneous grouping of developmental trajectories for longitudinal data by a maximum likelihood procedure (Nagin and Tremblay Reference Nagin and Tremblay2001; Haviland et al. Reference Haviland, Jones and Nagin2011). Therefore, the GBTM can assign individuals into different groups based on specific indicators. For instance, when studying health-related domains like cognition, morbidity or disability, the GBTM can pinpoint groups with similar developmental trajectories (Zimmer et al. Reference Zimmer, Hanson and Smith2016; Wei et al. Reference Wei, Li and Wang2018). In this study, we used the GBTM to identify older adults with the same patterns of physical and cognitive functions. After the GBTM estimation process, older adults were allocated to a distinct, non-overlapping group. This allocation was determined by the highest statistical likelihood of belonging to that group, which was based on posterior probabilities.
The key to the GBTM lies in determining the optimal number of groups. We used zero-inflated Poisson distributions to calculate physical trajectories because physical function scores of 0 were more common in our study (Pan et al. Reference Pan, Kelifa, Liang and Wang2021). We used a censored normal distribution to calculate cognitive trajectories (Jones and Nagin Reference Jones and Nagin2013). In most studies, the Bayesian information criterion (BIC) is used in model selection to assess model fit (Xiao et al. Reference Xiao, Shi and Fang2021; Han et al. Reference Han, An and Chan2022; Hu et al. Reference Hu, Cartagena-Farias and Brimblecombe2022). Given that the BIC was originally developed as an approximation to the Bayes factor for the exponential class of distributions (Schwarz Reference Schwarz1978), this study comprehensively referenced both the Akaike information criterion (AIC) and the BIC indices to determine the best-fitting model. In addition, the optimal number of groups also needs to take into account the existing literature, and the average posterior probability of each trajectory should be greater than 0.7, and the minimum proportion of each group should be greater than 5 per cent (Pan et al. Reference Pan, Kelifa, Liang and Wang2021).
Second, we examined the associations between lifetime SES and disability trajectories with the multinomial logistic regression. According to existing studies, the disability trajectories of older adults are usually 2 to 4 (Zimmer et al. Reference Zimmer, Martin, Jones and Nagin2014; Hu et al. Reference Hu, Cartagena-Farias and Brimblecombe2022). If there were three or more disability trajectories, we used the multinomial logistic regression and reported the relative risk ratio (RRR) and its 95 per cent confidence interval. If there were two disability trajectories, we used the logistic regression and reported the odds ratio (OR) and its 95 per cent confidence interval. All data analyses were conducted in Stata MP 16.
Results
Baseline characteristics of respondents
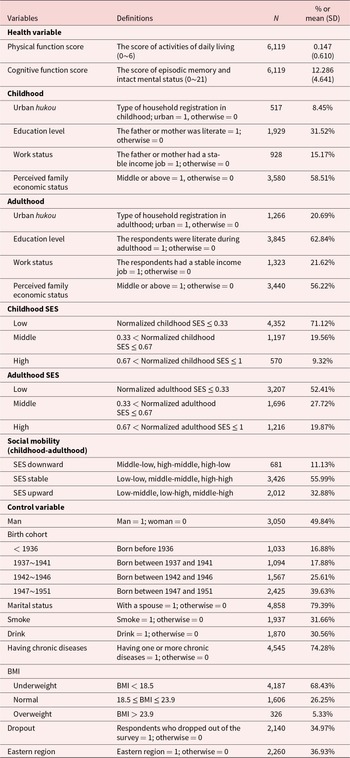
Table 1 reports the baseline characteristics of the respondents. The respondents’ physical function score at baseline was 0.147, and the cognitive function score was 12.286. The proportions of low, middle and high SES in childhood were 71.12 per cent, 19.56 per cent and 9.32 per cent, respectively. The proportions of low, middle and high SES in adulthood were 52.41 per cent, 27.72 per cent and 19.87 per cent, respectively. Therefore, from childhood to adulthood, the proportion of middle and high SES among older adults in China increased, with 11.13 per cent experiencing downward mobility, 55.99 per cent remaining stable and 32.88 per cent experiencing upward mobility.
Descriptive statistics for all respondents in 2011
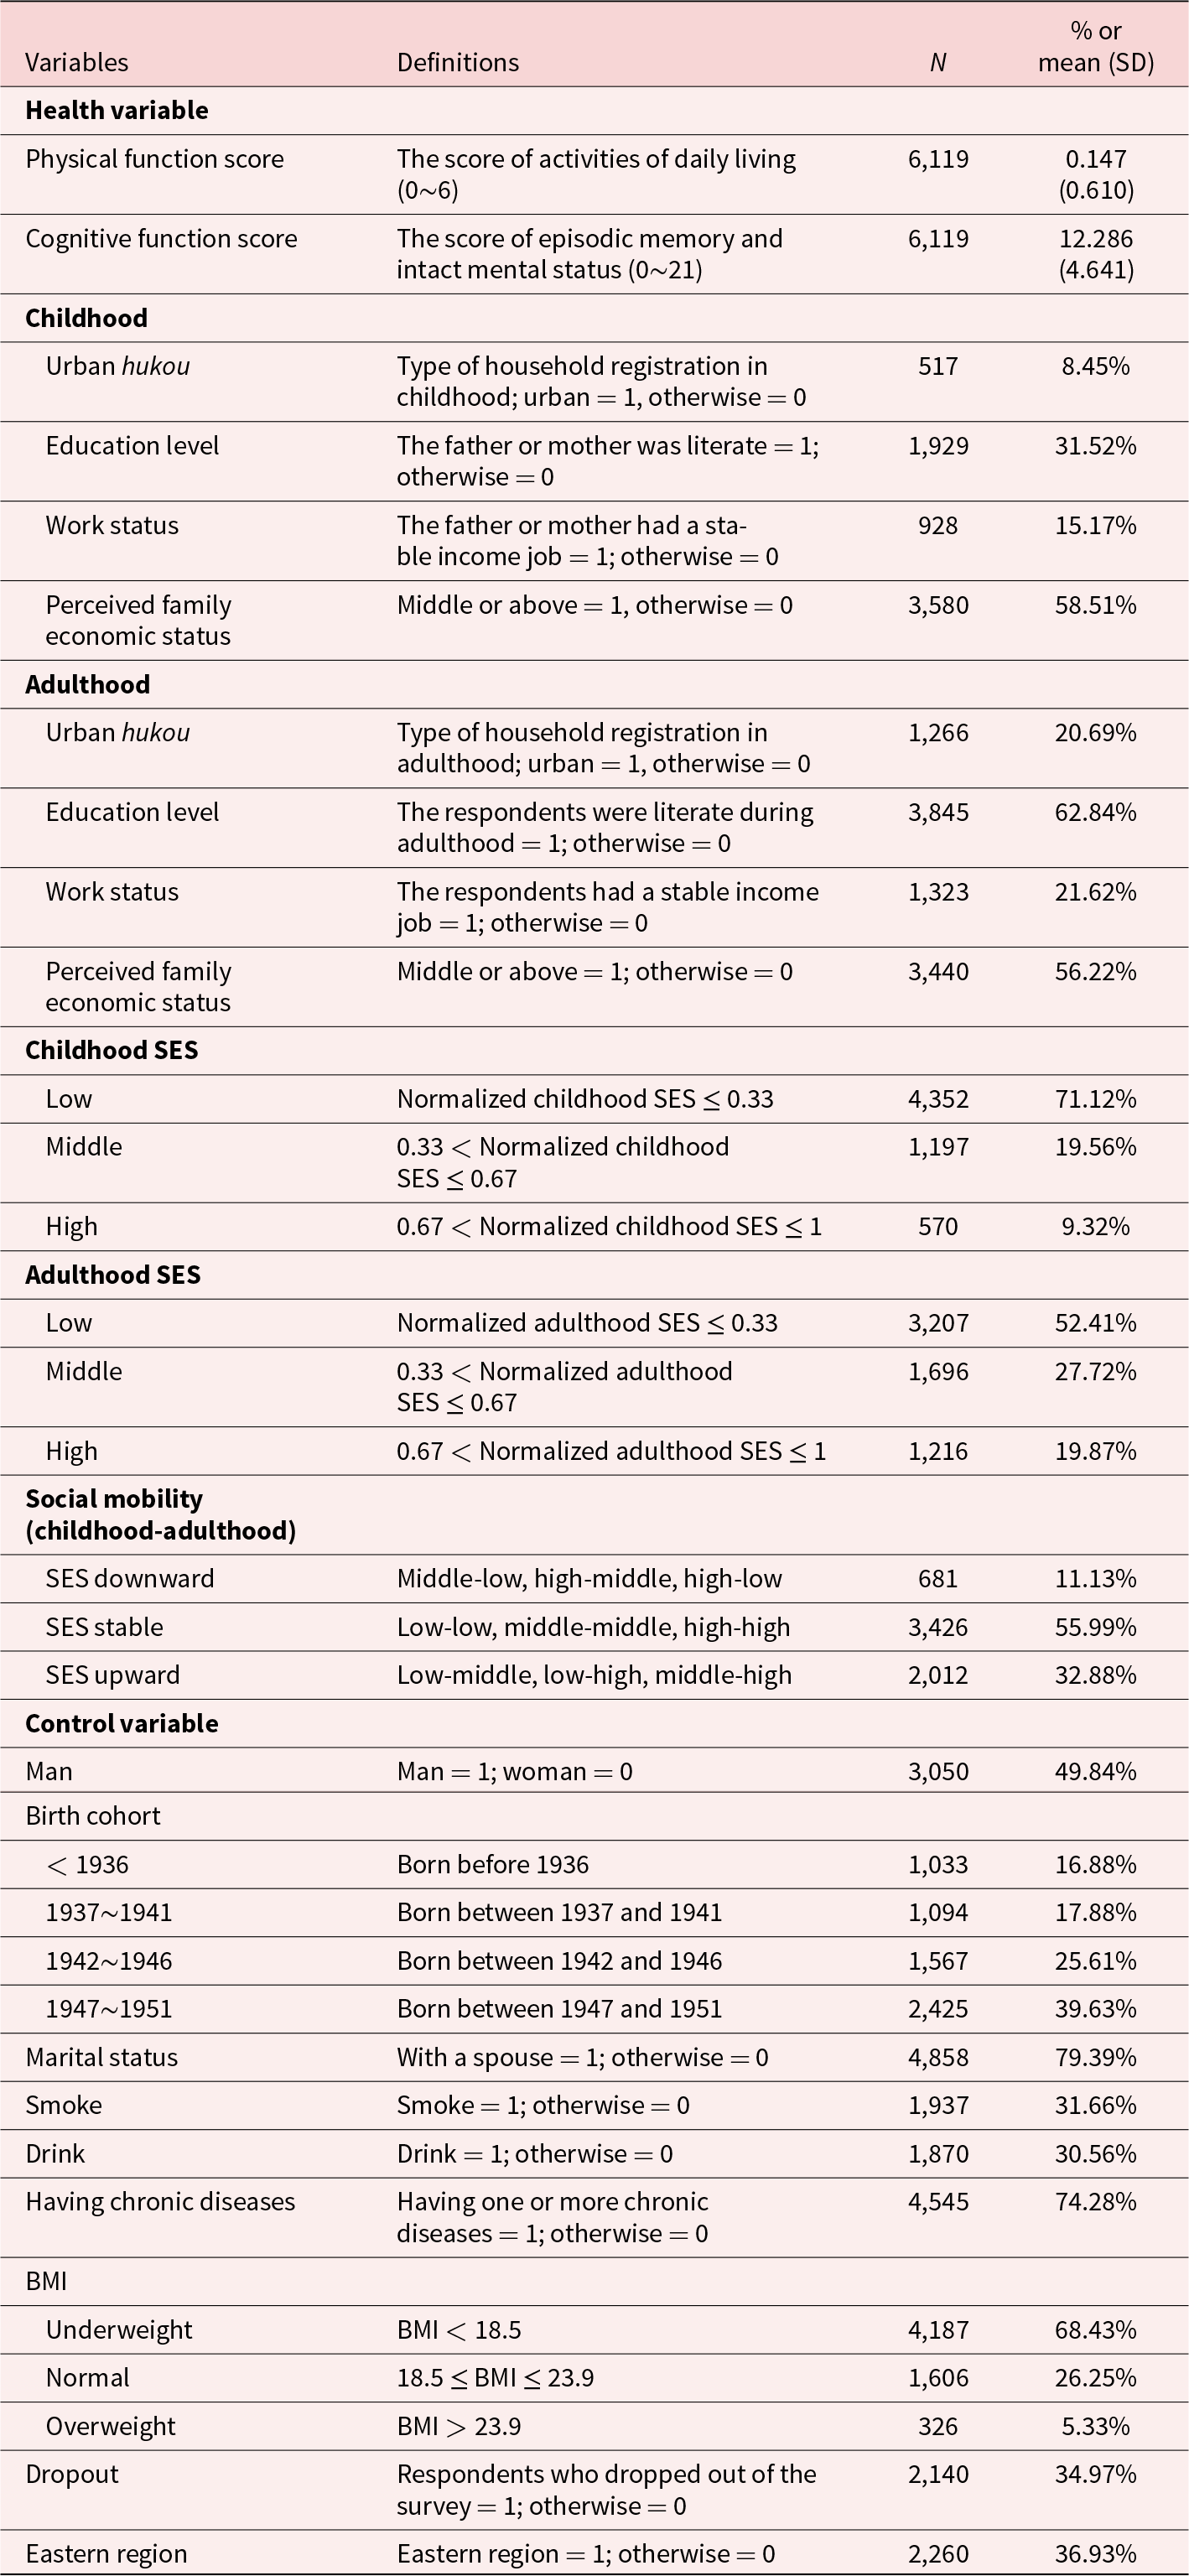
Notes: 6,119 respondents participated in the 2011 wave; SD = standard deviation; SES = socio-economic status; BMI = body mass index.
Identifying disability trajectories
With reference to existing studies (Hu et al. Reference Hu, Cartagena-Farias and Brimblecombe2022; Testa et al. Reference Testa, Mijares and Jackson2025), we considered trajectory groups 1-5 respectively and compared their AIC and BIC values across groups to identify the best-fitting model. The AIC and BIC values are presented in Table S1. For the three physical trajectories and two cognitive trajectories, the AIC values reached their respective minima of 14,917.49 and 76,208.96, while the BIC values reached their respective minima of 14,924.89 and 76,304.04. Additionally, the average posterior probability of all trajectories was greater than 0.7, and the minimum proportion of each group was greater than 5 per cent.
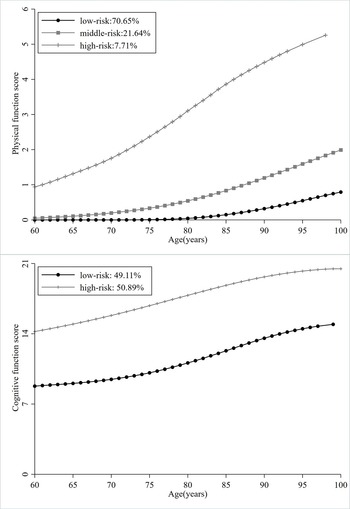
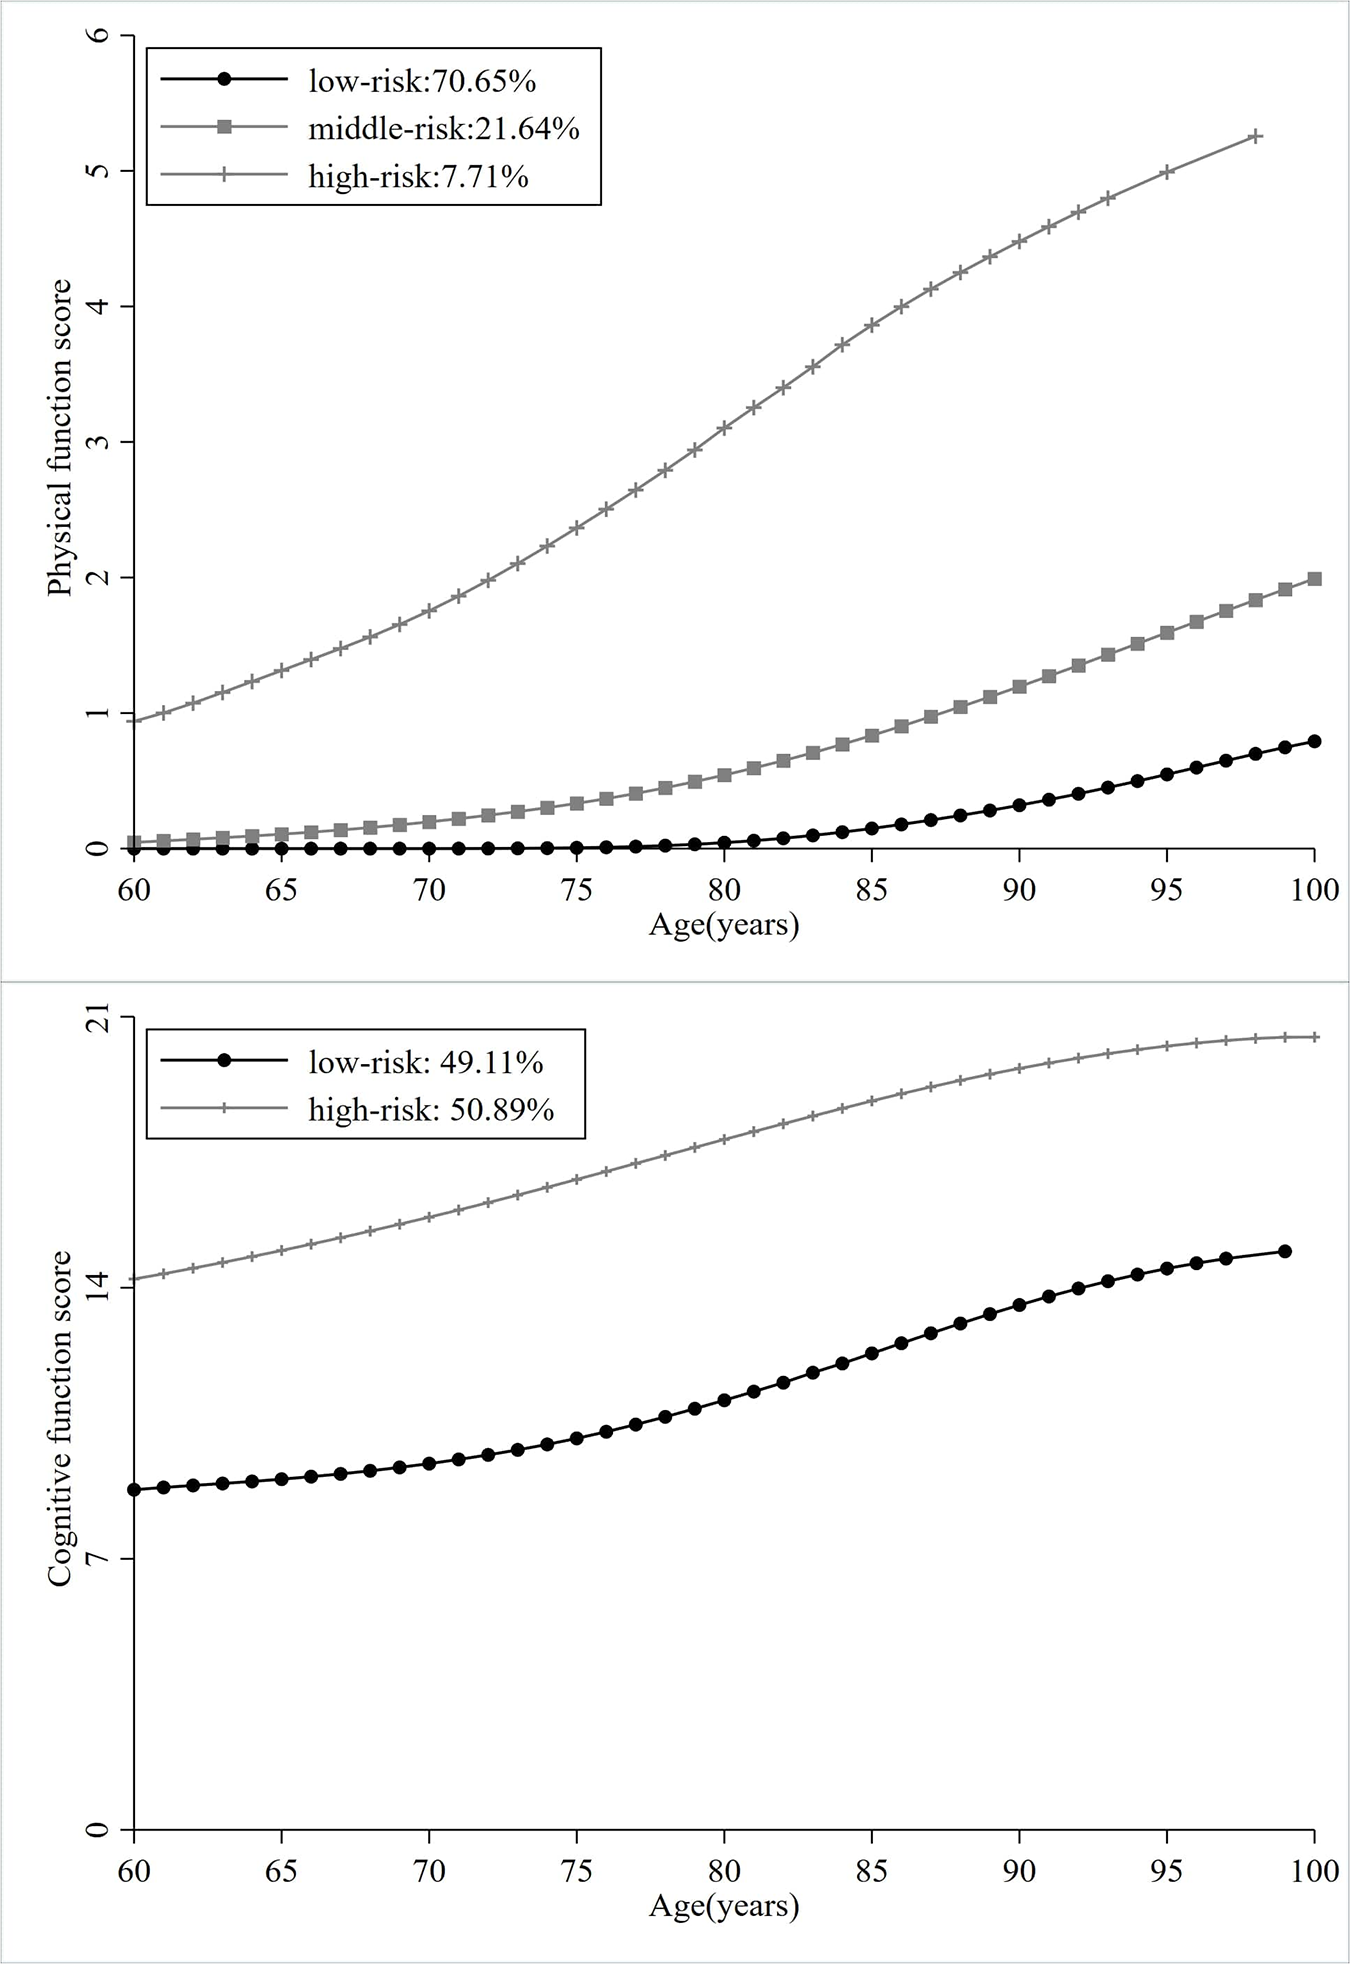
As shown in Figure 2, the low-risk, middle-risk and high-risk physical trajectories accounted for 70.65 per cent, 21.64 per cent and 7.71 per cent, respectively; the low-risk and high-risk cognitive trajectories accounted for 49.11 per cent and 50.89 per cent, respectively. Overall, physical and cognitive function scores gradually increased with age, which means that physical functional limitations and cognitive impairment were more severe in old age, while the risk of physical and cognitive disability varied among different groups of trajectories.
Groups of disability trajectories.
The proportion of upward mobility was higher for both the low-risk physical and the low-risk cognitive trajectories. The Chi-square test showed that the proportion of social mobility varied among different trajectory groups, suggesting the associations between social mobility and disability trajectories (see Table S2 in the supplementary material).
The impact of childhood and adulthood SES on disability trajectories
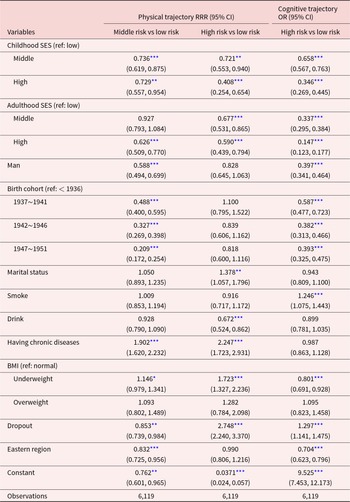
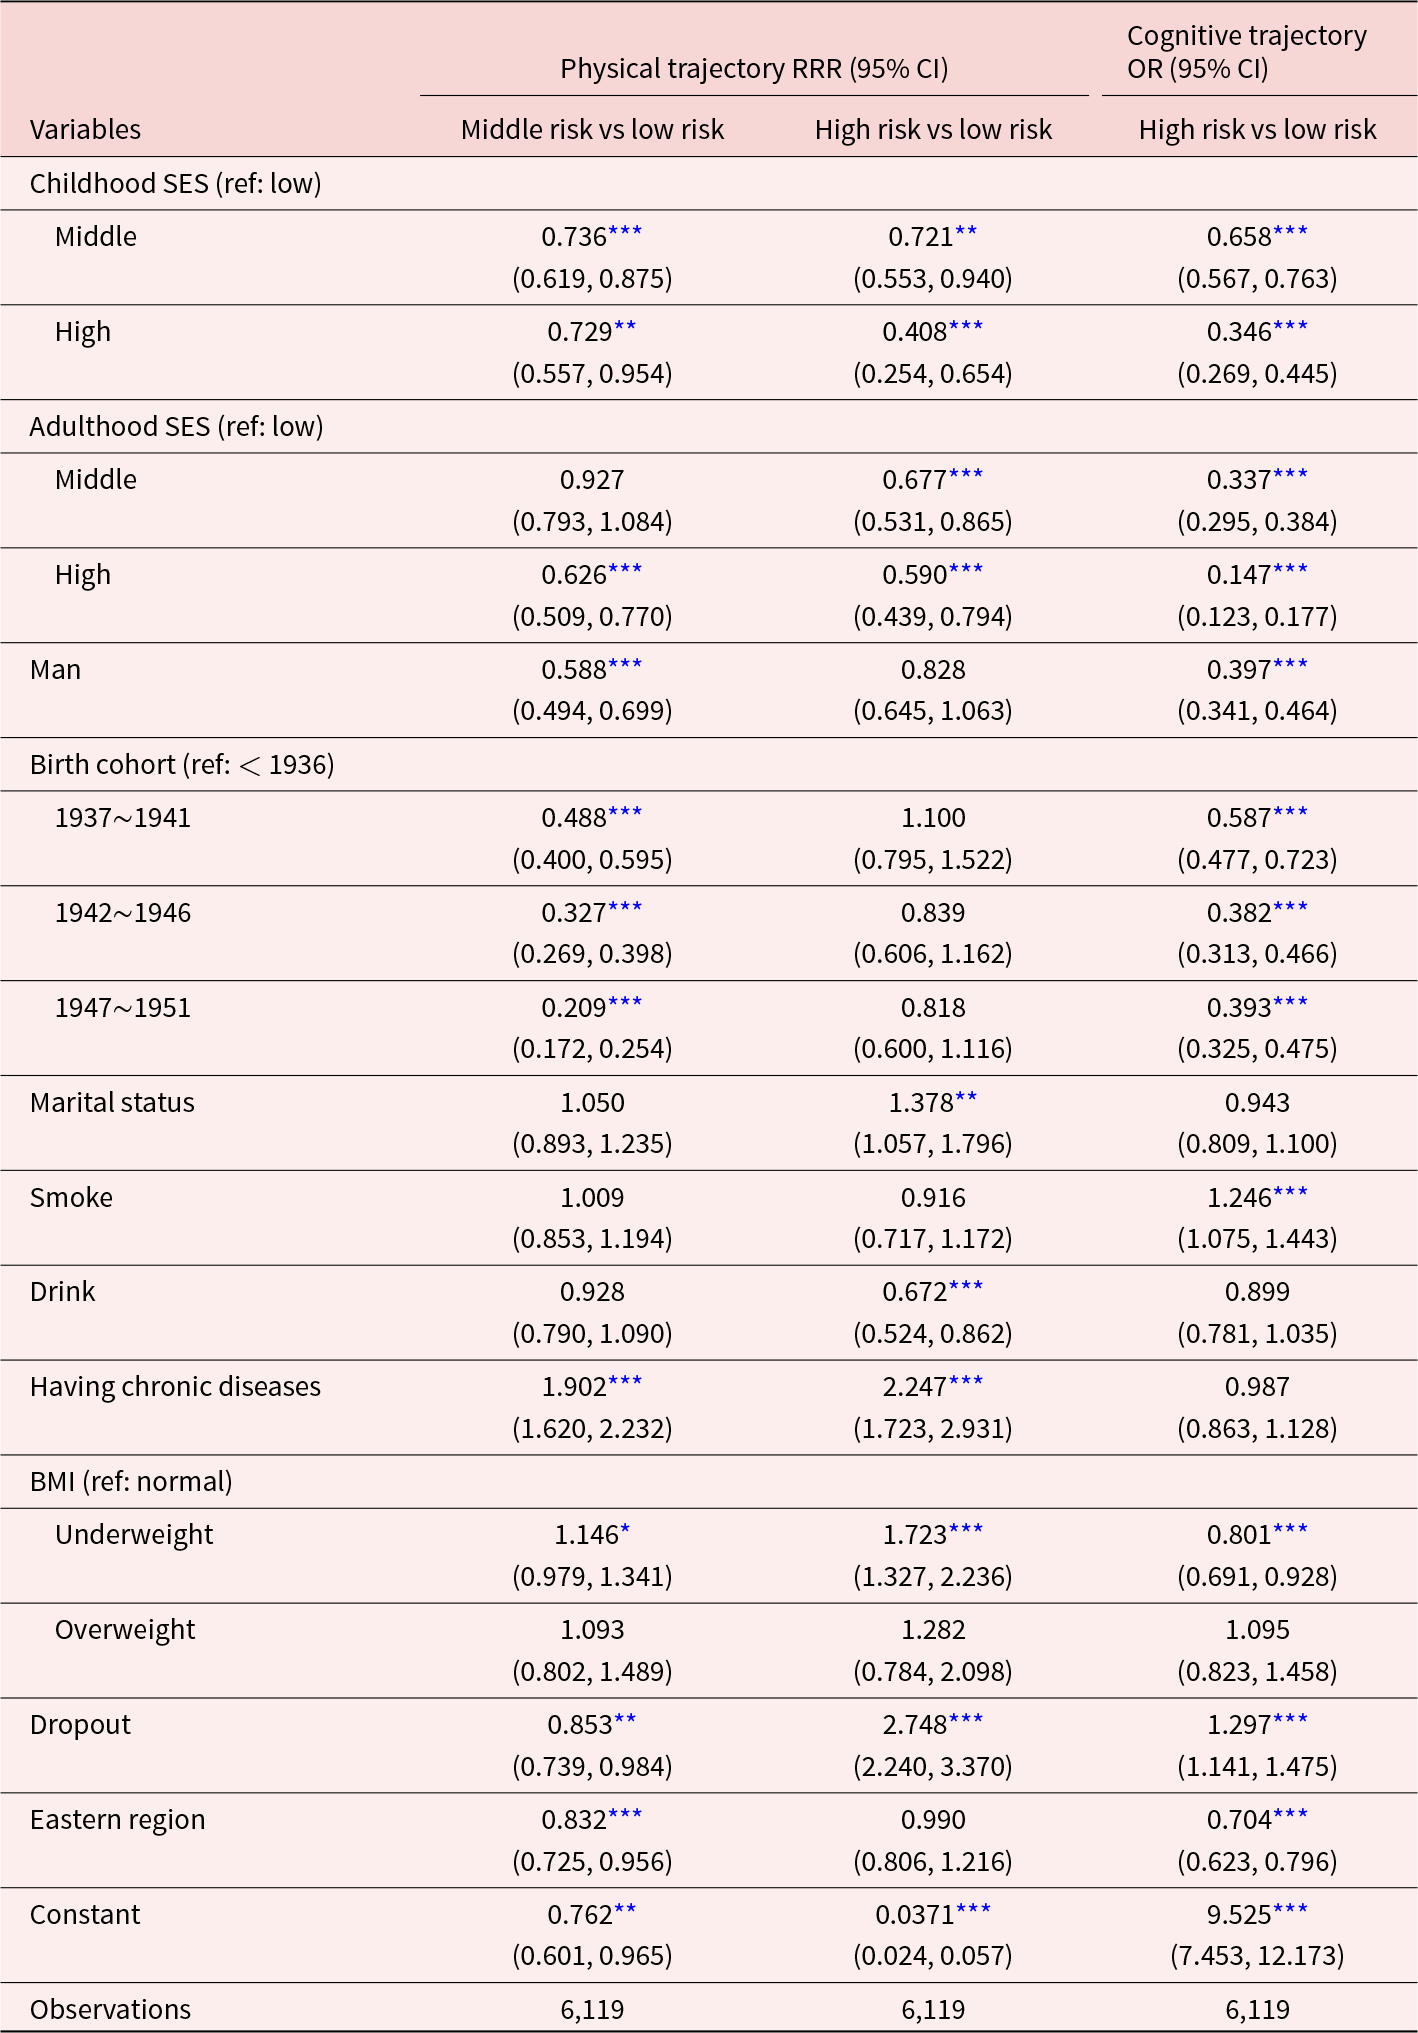
We explored the impact of SES in childhood and adulthood on disability trajectories (see Table 2). Compared to older adults with low childhood SES, those with middle and high childhood SES were less likely to be in the middle-risk physical trajectory (RRR = 0.736, 95% CI: 0.619–0.875; RRR = 0.729, 95% CI: 0.557–0.954), the high-risk physical trajectory (RRR = 0.721, 95% CI: 0.553–0.940; RRR = 0.408, 95% CI: 0.254–0.654) or the high-risk cognitive trajectory (OR = 0.658, 95% CI: 0.567–0.763; OR = 0.346, 95% CI: 0.269–0.445), which supports Hypothesis 1a.
The impact of childhood and adulthood SES on disability trajectories
Notes: SES = socio-economic status; BMI = body mass index. The table reports the relative risk ratio (RRR) or odds ratio (OR) and 95 per cent confidence interval. All the results are adjusted by all control variables.
*** p value < 0.01,** p value < 0.05, * p value < 0.1.
Compared to older adults with low adulthood SES, those with middle adulthood SES were less likely to be in the high-risk physical trajectory (RRR = 0.677, 95% CI: 0.531–0.865) or the high-risk cognitive trajectory (OR = 0.337, 95% CI: 0.295–0.384); those with high adulthood SES were less likely to be in the middle-risk physical trajectory (RRR = 0.626, 95% CI: 0.509–0.770), the high-risk physical trajectory (RRR = 0.590, 95% CI = 0.439–0.794) or the high-risk cognitive trajectory (OR = 0.147, 95% CI = 0.123–0.177), which supports Hypothesis 1b. Overall, both childhood SES and adulthood SES were associated with disability trajectories, and older adults with middle and high childhood or adulthood SES were more likely to be in the low-risk disability trajectories.
The impact of social mobility on disability trajectories
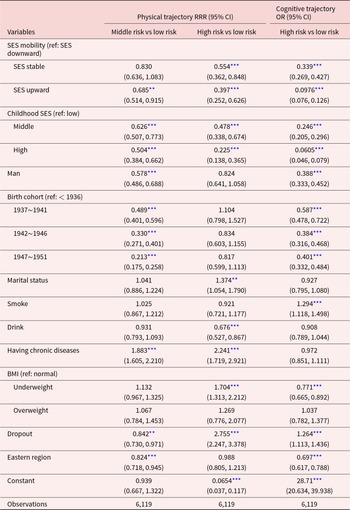
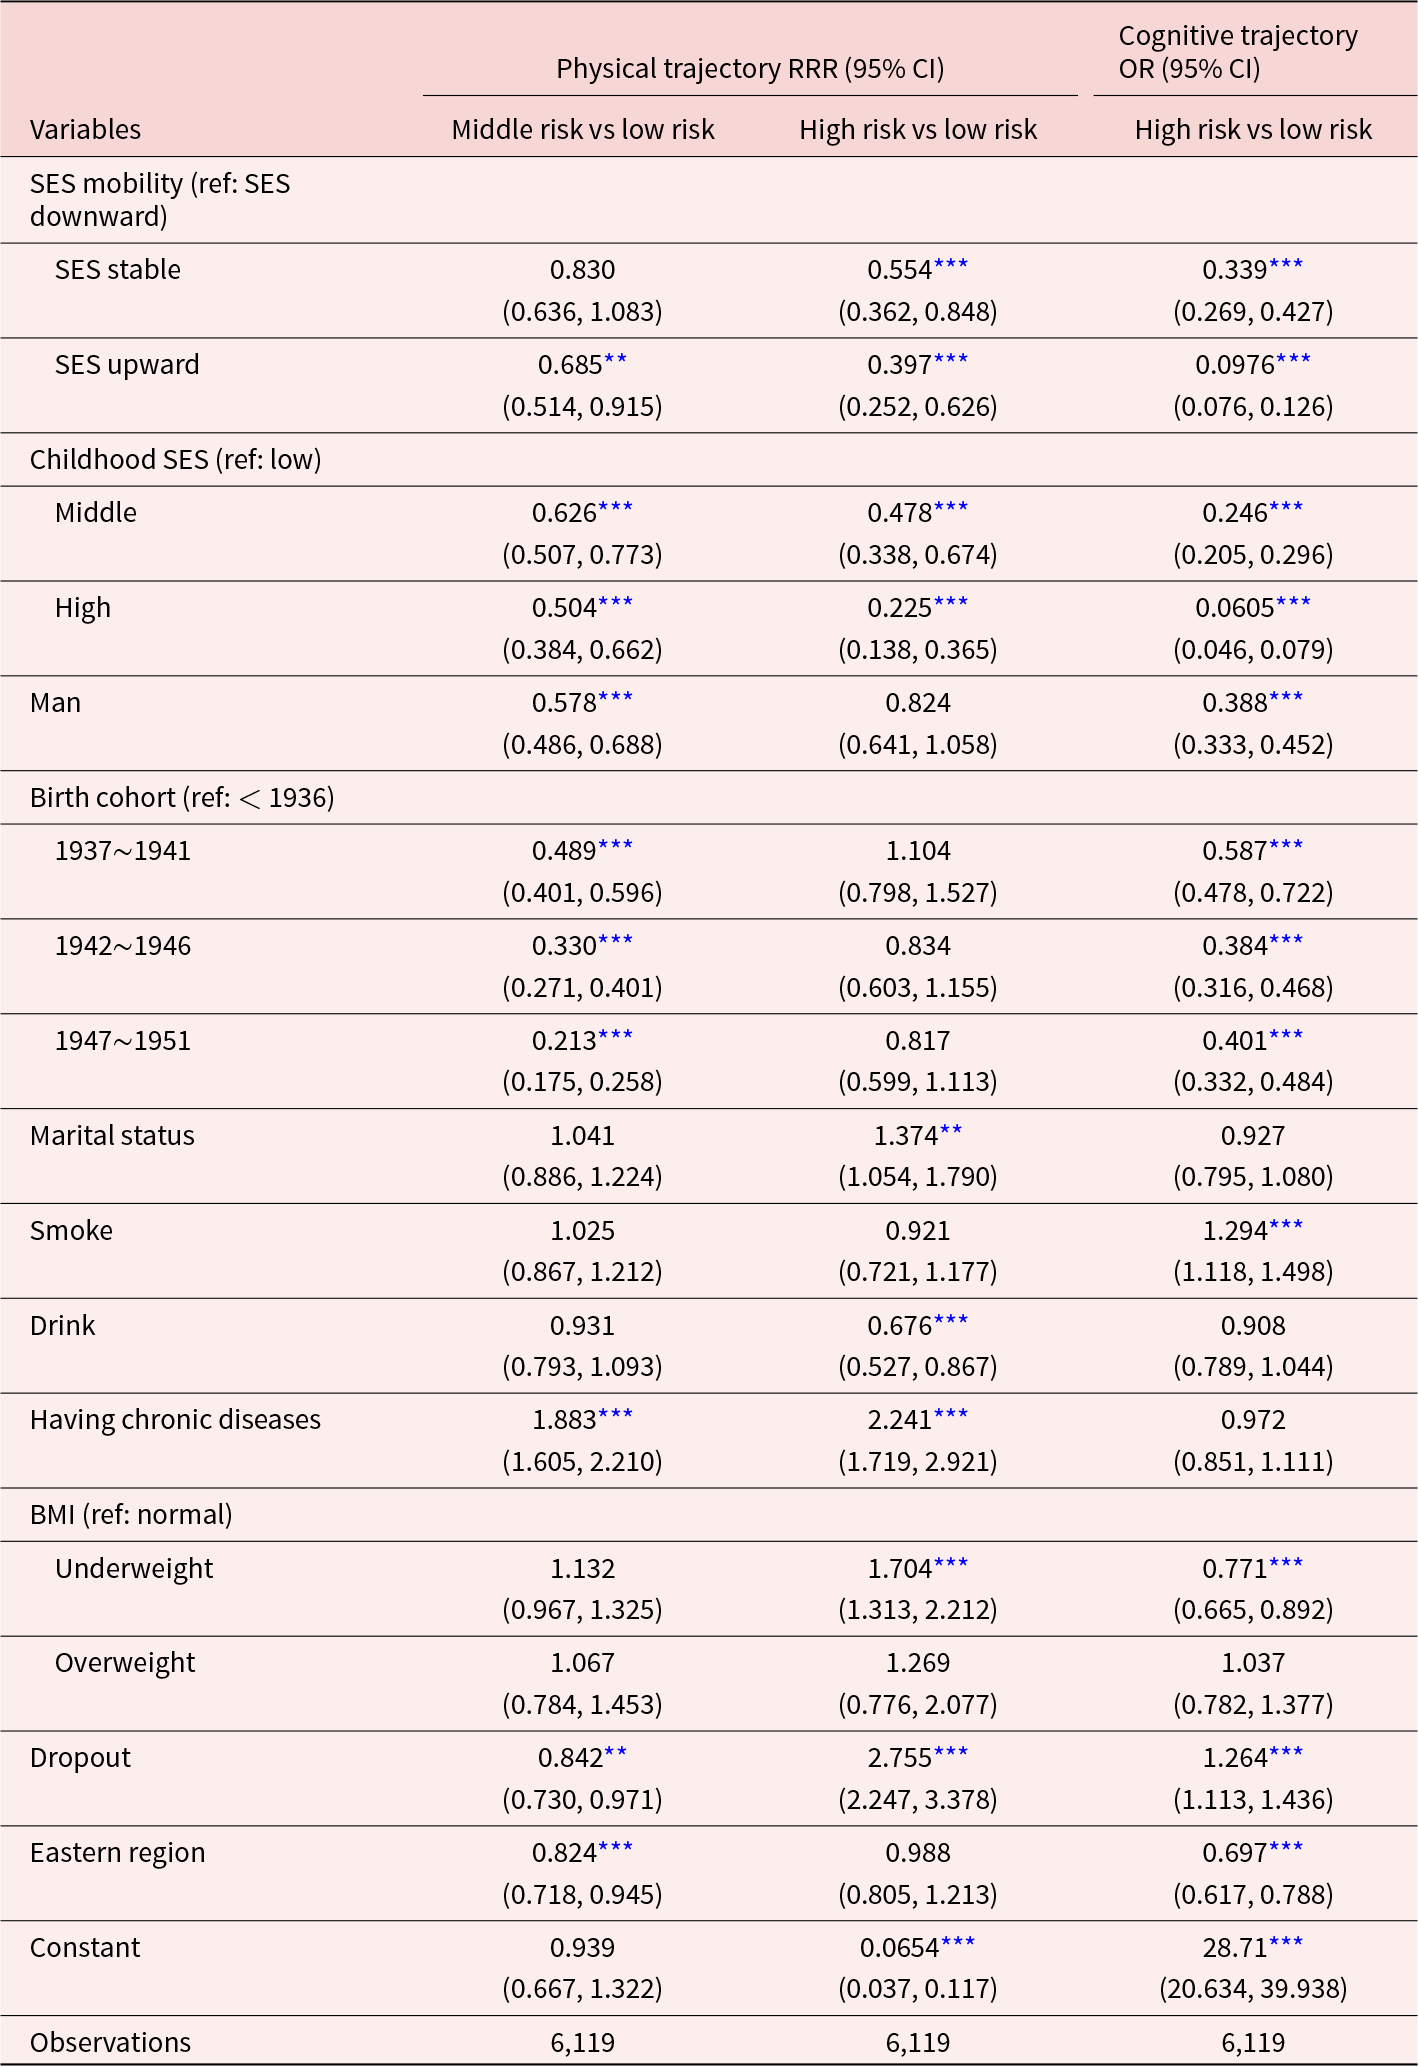
We investigated the impact of social mobility on disability trajectories (see Table 3). Compared to older adults with downward mobility, those who remained stable were less likely to be in the high-risk physical trajectory (RRR = 0.554, 95% CI: 0.362–0.848) or the high-risk cognitive trajectory (OR = 0.339, 95% CI: 0.269–0.427), which supports Hypothesis 2a. Compared to older adults with downward mobility, those with upward mobility were less likely to be in the middle-risk physical trajectory (RRR = 0.685, 95% CI: 0.514–0.915), the high-risk physical trajectory (RRR = 0.397, 95% CI: 0.252–0.626) or the high-risk cognitive trajectory (OR = 0.0976, 95% CI: 0.076–0.126), which supports Hypothesis 2b.
The impact of social mobility on disability trajectories
Notes: SES = socio-economic status; BMI = body mass index. The table reports the relative risk ratio (RRR) or odds ratio (OR) and 95 per cent confidence interval. All the results are adjusted by all control variables.
*** p value < 0.01, ** p value < 0.05, * p value < 0.1.
Subgroup analysis
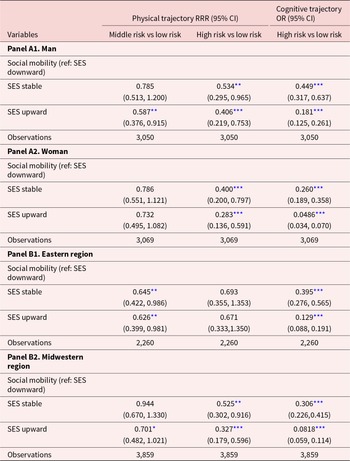
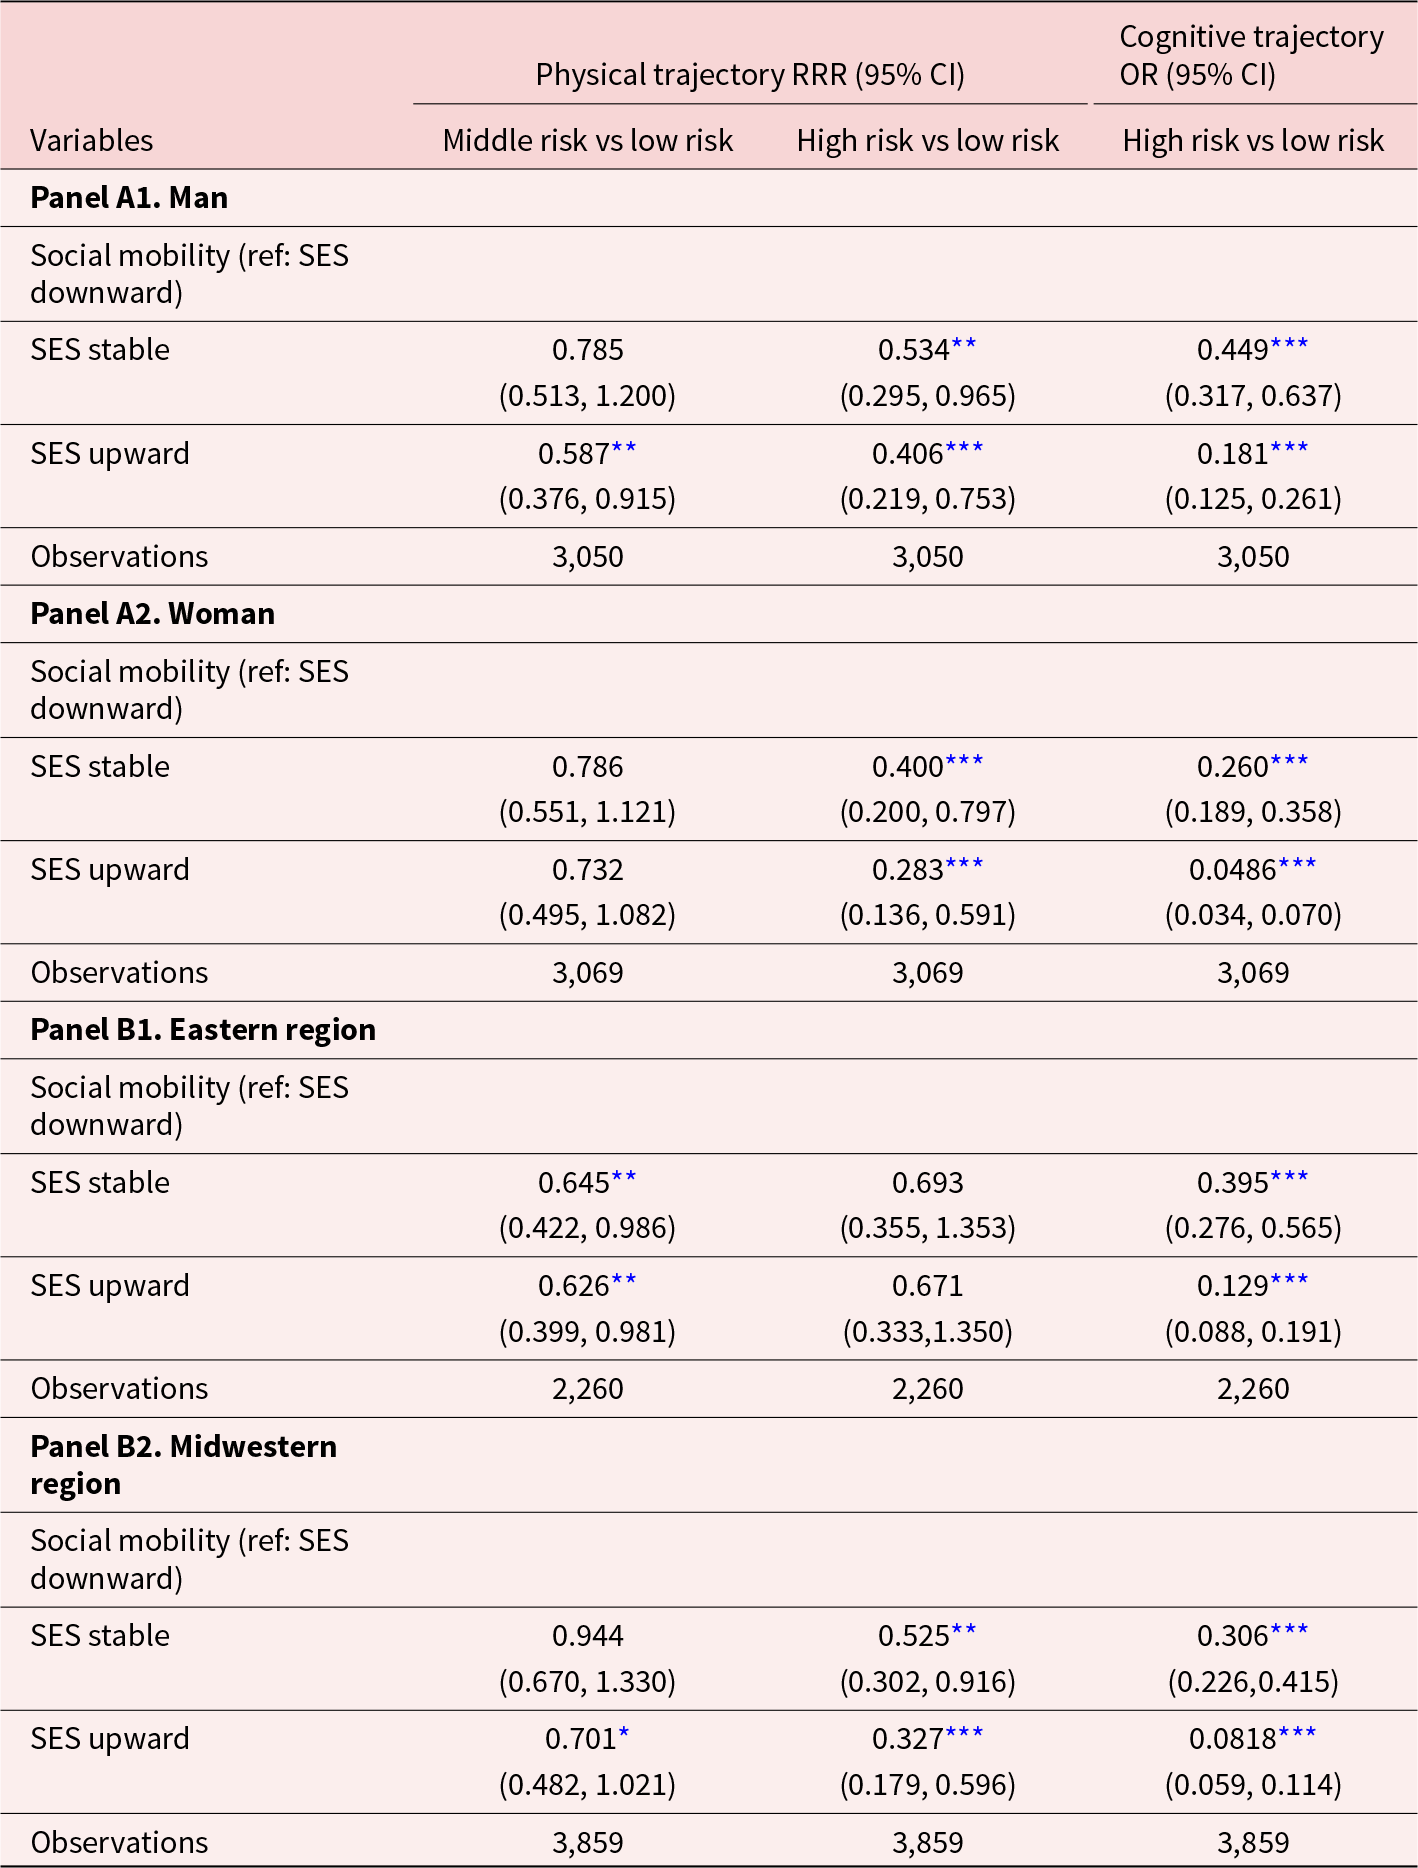
Table 4 presents the results of the subgroup analysis by gender and region. Panel A shows that women were more likely to benefit from upward mobility than men. Compared to men, women with stable or upward mobility were less likely to be in high-risk physical trajectories (RRR = 0.400, 95% CI: 0.200–0.797; RRR = 0.283, 95% CI: 0.136–0.591) and cognitive trajectories (OR = 0.260, 95% CI: 0.189–0.358; OR = 0.0486, 95% CI: 0.034–0.070). This suggested that there were gender differences in the associations between social mobility and disability trajectories, supporting Hypothesis 3a.
Subgroup analysis
Notes: SES = socio-economic status; BMI = body mass index. The table reports the relative risk ratio (RRR) or odds ratio (OR) and 95 per cent confidence interval. All the results are adjusted by all control variables.
*** p value < 0.01, ** p value < 0.05, * p value < 0.1.
Panel B in Table 4 shows that, compared to older adults with downward mobility, those with stable or upward mobility were less likely to be in the middle-risk physical trajectories in the eastern region (RRR = 0.645, 95% CI: 0.422–0.986; RRR = 0.626, 95% CI: 0.399–0.981). However, we did not find that social mobility had a significant impact on the high-risk disability trajectories of older adults in the eastern region. In the midwestern region, compared to older adults with downward mobility, those with stable or upward mobility were less likely to be in high-risk physical trajectories (RRR = 0.525, 95% CI: 0.302–0.916; RRR = 0.327, 95% : 0.179–0.596) or cognitive trajectories (OR = 0.306, 95% CI: 0.226–0.415; OR = 0.0818, 95% CI: 0.059–0.114). Therefore, the disparity in economic development between the eastern and the midwestern regions of China potentially exerted a moderating influence on the associations between social mobility and disability trajectories, supporting Hypothesis 3b.
Discussion
Given the rapid ageing and consequent disability concerns in the world, our study examined whether there are distinctly different disability trajectories among older adults, and whether lifetime SES accounts for the distinctiveness of these trajectories, using the national-level longitudinal survey data from China. We identified three distinct physical trajectories among older adults in China: the low-risk physical trajectory (70.65 per cent), the middle-risk physical trajectory (21.64 per cent) and the high-risk physical trajectory (7.71 per cent), as well as two distinct cognitive trajectories: the low-risk cognitive trajectory (49.11 per cent) and the high-risk cognitive trajectory (50.89 per cent). We further found that both childhood and adulthood SES were associated with disability trajectories, with older adults of middle and high SES (whether in childhood or adulthood) more likely to be classified into the low-risk physical and cognitive trajectories. Compared to those with downward SES mobility (from childhood to adulthood), older adults with stable or upward SES mobility were more likely to be in low-risk physical and cognitive trajectories.
This study contributes to several strands of literature. Firstly, we identified three distinct physical trajectories and two distinct cognitive trajectories among Chinese older adults, which were almost consistent with the existing studies (Xiao et al. Reference Xiao, Shi and Fang2021; Han et al. Reference Han, An and Chan2022; Hu et al. Reference Hu, Cartagena-Farias and Brimblecombe2022). In terms of physical trajectories, older adults classified into the low-risk physical trajectory will experience a low risk of physical disability. Specifically, they exhibit intact physical function between the ages of 60 and 80, and their risk of physical disability only increases slightly after the age of 80. Older adults classified into the middle-risk physical disability trajectory will experience a gradually rising risk of physical disability. Their risk of physical disability starts to increase slowly shortly after the age of 60, with the number of dependent ADL items reaching an average of two by the age of 100. Older adults classified into the high-risk physical trajectory will experience a high risk of physical disability. They exhibit approximately one dependent ADL item when they are 60 years old, with the degree of disability gradually worsening thereafter until complete physical disability occurs.
In terms of cognitive trajectories, older adults in the low-risk cognitive trajectory have a low degree of cognitive impairment at the age of 60. While the severity of cognitive impairment increases gradually with age, their cognitive function remains partially intact even by the age of 100. For older adults in the high-risk cognitive trajectory, the degree of cognitive impairment is relatively severe at the age of 60. As they age, the severity of cognitive impairment deepens progressively, eventually leading to complete loss of cognitive function. These findings indicate that the disability trajectories of physical and cognitive functions among older adults is heterogeneous (Pan et al. Reference Pan, Kelifa, Liang and Wang2021). Additionally, the heterogeneity in physical and cognitive trajectories of older adults is the ultimate manifestation of socio-economic inequalities over the lifecourse (Williams et al. Reference Williams, Cunich and Byles2013; Zimmer et al. Reference Zimmer, Hanson and Smith2016; Huoyun et al. Reference Huoyun, Shilong, Zhaoqi and Huiqin2023).
Secondly, we found that older adults with low childhood and adulthood SES were associated with higher-risk physical and cognitive trajectories than those with middle SES or high SES. These findings strongly indicate that SES is closely associated with health (Kim and Durden Reference Kim and Durden2007; Morrissey and Kinderman Reference Morrissey and Kinderman2020). This may be explained by the fact that higher SES means greater access to resources, which contributes to improving an individual’s health (Luo and Waite Reference Luo and Waite2005; Wolfe Reference Wolfe2015). Specifically, this aligns with the cumulative hypothesis, which proposes that the health (dis)advantages of SES accumulate with age (Darin-Mattsson et al. Reference Darin-Mattsson, Andel, Celeste and Kareholt2018).
Thirdly, we found that social mobility influences the disability trajectories of older adults. The older adults with downward mobility were more likely to be in higher-risk physical and cognitive trajectories than those with upward mobility. This indicates that upward social mobility yields considerable benefits compared to downward mobility, which is consistent with findings from studies in other countries (Gugushvili et al. Reference Gugushvili, Zhao and Bukodi2019; Faul et al. Reference Faul, Ware, Kabeto, Fisher and Langa2021; Huoyun et al. Reference Huoyun, Shilong, Zhaoqi and Huiqin2023). Social mobility from childhood to adulthood reflects changes in an individual’s ability to access resources in early life. Downward mobility often means a decline in this ability, preventing individuals from securing adequate living safeguards and thus leading to adverse health outcomes. In contrast, upward mobility implies a growing ability to access resources, which can even mitigate the impact of adverse childhood SES (Islam and Jaffee Reference Islam and Jaffee2024; Ko et al. Reference Ko, Oh, Subramanian and Kim2025). Consequently, older adults who have experienced upward social mobility are more likely to be categorized into low-risk disability trajectories.
Finally, subgroup analysis revealed gender and regional differences in the impact of social mobility on disability trajectories. Regarding gender, our study found that social mobility exerts a greater effect on women’s health (Ball and Crawford Reference Ball and Crawford2005), with older women experiencing stable or upward mobility being more likely to be in low-risk disability trajectories, contrary to previous research suggesting a stronger health impact on men (Kong et al. Reference Kong, Hoshi, Ai, Shi, Nakayama, Wang and Yang2014; Gugushvili et al. Reference Gugushvili, Zhao and Bukodi2019; Ahrenfeldt and Möller Reference Ahrenfeldt and Möller2021). This discrepancy may stem from the Chinese government’s efforts to enhance women’s social status over recent decades, granting them equal access to education and employment and thereby creating more social mobility opportunities, which amplifies the health impact of social mobility for older Chinese women. In terms of regions, social mobility has a relatively greater effect on older adults in central and western China than in the eastern region, with stable or upward mobility in the former being less likely to be categorized into high-risk disability trajectories. While central and western regions historically have lower economic development (Liu et al. Reference Liu, Chen, Chi, Wu, Pei, Song, Zhang, Pang, Han and Zheng2010), targeted government policies (e.g. subsidies, taxation and investment) over the past few decades have promoted their development and expanded social mobility opportunities for local residents (Liu et al. Reference Liu, Feng, Zhao and Qiu2023), leading to greater health impact of social mobility in these regions.
Conclusion
In this study, we used data from the CHARLS to analyse the impact of lifetime SES on the physical and cognitive trajectories of older adults. We identified three physical trajectories (low, middle and high) and two cognitive trajectories (low and high). Older adults with higher childhood SES or adulthood SES and those who have experienced upward social mobility are more likely to be categorized into low-risk physical and cognitive trajectories. Our study advanced existing research in the following ways. First, we used longitudinal data to measure the lifetime SES at different life stages, capturing the transition from childhood to adulthood. Simultaneously, we accounted for inter-individual variability to identify distinct disability (both physical function and cognitive function) trajectories. Second, our study integrated the disablement process theory with the lifecourse perspective to examine the critical period, social mobility and accumulation hypotheses. More importantly, it provided new empirical evidence that verifies the validity and applicability of the disablement process theory in the Chinese context.
This study offers some important policy implications for reducing inequalities and improving health outcomes in later life. First, increase human capital investment in children to mitigate the long-term impact of adverse childhood SES. Given that childhood SES exerts a lasting influence on later-life health, future policies should prioritize interrupting the intergenerational transmission of adverse factors, expand investment in children’s human capital (e.g. education and medical care) and create a more equitable starting point for all children. Second, provide a social safety net for socio-economically disadvantaged people and those experiencing downward mobility. The heterogeneity in older adults’ disability trajectories is the ultimate manifestation of socio-economic inequalities over the lifecourse. This underscores the need to prioritize socio-economic equity and address older adults’ health from a lifecourse perspective. For instance, a more inclusive social security system can be established to mitigate the potential harms of low SES and downward social mobility. Third, create more opportunities for upward social mobility. During societal development efforts, the government can ensure equal access for vulnerable groups to social mobility by expanding public education, vocational training and job opportunities, thereby promoting improvements in people’s SES.
There are also some limitations in this study. First, due to data limitations, we were unable to capture the continuous trajectory of SES from childhood to adulthood. Instead, measures of social mobility were based on two discrete time points (childhood and adulthood), which may overlook potential sudden or unusual effects of other lifecourse stages. Second, given the diversity of academic perspectives, the disablement process theory cannot fully examine and verify the causal relationship between lifetime SES and disability trajectories, and the underlying mechanisms of this relationship have not been explored in depth in this study. Future research could further investigate the relationship between SES trajectories and disability trajectories if continuous tracking of both SES and disability status can be implemented, thereby providing theoretical and empirical support for effective policy interventions.
Supplementary material
The supplementary material for this article can be found at https://doi.org/10.1017/S0144686X26100683.
Author contributions
Hongwei Hu: conceptualization, project administration, supervision and writing – review and editing; Hongwang Guo: conceptualization, formal analysis, methodology and writing – original draft; Xinyi Hu: conceptualization and writing – original draft.
Financial support
This research was supported by the Interdisciplinary Innovation Project of the School of Public Administration and Policy, Renmin University of China: ‘Optimization Research on China’s Long Term Care System for Older Adults: Demand, Financing and Services’ (grant number: 2024KXK001).
Competing interests
The authors declare no competing interests.
Ethical standards
This study used the CHARLS data and the ethical approval for all the CHARLS waves was granted from the Institutional Review Board at Peking University. The IRB approval number for the main household survey, including anthropometrics, is IRB00001052-11,015; the IRB approval number for the biomarker collection is IRB00001052-11,014.