

With the rapid growth of the national economy during the past several decades, the nutritional status of the Chinese people has improved greatly(Reference Zhai, He, Wang, Yu, Hu and Yang1). However, there are huge differences between urban and rural areas and the development of western areas has lagged behind that of eastern areas for several decades(Reference Min and Yun2, Reference Yang3). The average annual income per capita was $US 249 in western areas, much lower than the national average annual income per rural resident in 2005, which was $US 407(4). Disparities also exist in the nutritional status of children. One survey stated the prevalence of underweight among children <5 years of age to be 1·8 % in urban areas and 8·6 % in rural areas, with corresponding stunting prevalence of 2·5 % and 13·1 %(Reference Chang, He and Chen5). In another study the prevalence of stunting and underweight among children <3 years of age living in western areas was found to be 24·0 % and 22·4 %, respectively(Reference Zeng, Yan, Guo, Dang and Xie6). This indicates that malnutrition in poor rural areas is still a serious problem.
To improve child nutrition in western areas, the Chinese Ministry of Health and UNICEF are implementing a ‘Mother and Baby Package Project’ in the fifty counties of thirteen mid-western provinces in China during 2006 to 2010. In preparing for the evaluation of the interventions, a baseline survey focusing on child growth and development was conducted in the project area during a 2-month period from August to October 2006.
For nearly three decades, the international growth reference of the National Center for Health Statistics/WHO (‘the NCHS reference’) has been widely used to assess malnutrition(Reference Dibley, Goldsby, Staehling and Trowbridge7), as recommended by WHO. The limitations of the NCHS reference have been documented by many researchers(Reference de Onis and Yip8–10). Recognizing the shortcomings of the NCHS reference as an international growth reference, in 1994 the WHO began planning for new references that reflect child growth in all countries and do not simply describe children’s growth at a particular time and place(11, Reference de Onis, Garza and Habicht12). In 2006, the WHO Child Growth Standards (‘the WHO standards’) were developed by the WHO Multicentre Growth Reference Study (MGRS)(13). Until now there have been few reports about child nutrition related to the new standards but such work is important, especially for developing countries and poor areas(Reference Deshmukh, Dongre, Gupta and Garg14, Reference Nuruddin, Lim, Hadden and Azam15).
The aims of the present study were: (i) to assess the nutritional status of children <5 years old in rural China using the WHO standards; and (ii) to compare the results with those obtained using the NCHS reference.
Material and methods
Study area and population
The study was a cross-sectional survey. The ‘Mother and Baby Package Project’ was conducted in fifty counties of thirteen mid-western provinces of China. The project covered a total population of about 20 million inhabitants, including a sample from the almost 1·1 million children aged <5 years. In the present survey we conducted anthropometric measurements for children <5 years of age and conducted face-to-face questionnaire interviews with the children’s caregivers. At the same time, we also collected background information from the fifty counties and all sampled townships and villages. The questionnaire included social, economic and demographic data, especially the number of children aged <5 years in each family.
We used a three-stage stratified, randomized, non-probability (quota allocation of samples) sampling method. We planned to recruit 170 children aged <5 years from each county. Because of the low density of population, it was difficult to reach 170 in seven counties, all located in Tibet. Hence, the raw sample size had to be limited to sixty children in each of these counties. Figure 1 shows the sampling process.
The sampling process

Within each county, all townships were ranked according to their hospital delivery rates; in the next step we divided them into three layers and kept almost the same number of towns in each layer. We then selected one township from each layer at random. In each sampled township, all villages were ranked according to their distance to the town government hall; then they were classified into three layers with the number of villages in each layer being approximately the same. Finally, we randomly selected one village from each layer. In total, fifty sampled counties including 150 sampled townships and 450 villages were included. Within this frame, 7407 children aged <5 years should be investigated (Fig. 1). Actually, a total of 8041 children were investigated and their height and weight were measured.
Anthropometry
Information, including the child’s age, sex and other data, was obtained by interviewing the caregivers. Anthropometric measurements, including height and weight, were used to assess the nutritional status. Recumbent length of all children was assessed using a standard calibrated board accurate to the nearest 0·001 m (model WB-B; Changzhou Wujin Company Measuring Factory, Changzhou, China) and their weights were measured to the nearest 0·1 kg with a standard calibrated balance scale (Bailida electronic scale; Wuxi Measurement Factory, Wuxi, China). We were especially concerned about getting instruments that were highly accurate and precise, yet portable and sturdy enough to enable them to be carried back and forth in the field. All study sites used identical measuring equipment, which was provided by UNICEF.
The data collection team came from the Division of Maternal and Child Health, School of Public Health of Peking University. The team was divided into ten couples, each couple being made up of one teacher and one graduate student. Before the field survey, all members received training according to training manuals so that they would be completely consistent. The training covered filling in the questionnaire, inquiry manner, equipment use and measurement criteria. Measurements were carried out based on the recommended standards for anthropometry described elsewhere(Reference Lohman, Roche and Martorell16).
A pilot survey including sixty children was conducted in Xia County, Shanxi Province and Bishan County of Chongqing Province, separately, through which some problems were revealed in the questionnaires and measurements. An appropriate procedure for the field survey was elaborated based on the pilot study experiences.
Statistical analyses
The WHO standards were used to calculate Z-scores of height-for-age (HAZ), weight-for-age (WAZ), weight-for-height (WHZ) and BMI-for-age (BMIZ)(13). Z-scores were calculated using the WHO Anthro 2005 for Personal Computer Software for Assessing Growth and Development of the World’s Children, version Beta (WHO, Geneva, Switzerland). According to recommendations, stunting was determined as HAZ < −2, underweight as WAZ < −2, wasting as WHZ < −2, possible risk of overweight as BMIZ > 1 and overweight as BMIZ > 2(17, Reference Cole, Bellizzi, Flegal and Dietz18).
The database was established using the Epi Info software package version 6 (Centers for Disease Control and Prevention, Atlanta, GA, USA) and duplication was adopted for data entry. Means, standard deviations and the respective Z-scores were calculated for all anthropometric variables. The prevalence of stunting, underweight, wasting and overweight/obesity was determined in relation to age, sex and area. Malnutrition and overweight/obesity rates were compared between groups using the χ 2 test. The SPSS statistical software package version 13·0 (SPSS Inc., Chicago, IL, USA) was used for all analyses. In all analyses P < 0·05 was considered as statistically significant.
Results
Sex and age of the children
For all 8041 children, we enquired their dates of birth and their sex from caregivers and their weight and height were assessed.
Table 1 shows the children’s sex and age. Boys constituted 55·5 % and girls 44·5 % of the children. The children’s age ranged from 0 to 59 months, and they were divided into ten age groups. The proportion in each age group is shown in Table 1.
Prevalence of underweight, stunting and wasting, determined using the 2006 WHO Child Growth Standards, by sex and age group: children <5 years of age from thirteen rural mid-western provinces, China (n 8041)

Children’s Z-scores
Table 2 gives means and standard deviations of HAZ, WAZ, WHZ and BMIZ for different age groups determined using the WHO standards. Compared with the standards, the distributions of HAZ in all age groups and WAZ in most age groups were shifted to the left significantly, the extent of shifting showing an average for HAZ of −1·33 and for WAZ of −0·70. Being different from HAZ and WAZ, however, the distributions of WHZ and BMIZ were shifted to the opposite direction (average 0·06 and 0·20, respectively). This indicated the length/height of the children dropped far behind the criteria, while in contrast WHZ and BMIZ were above the criteria and it seemed the children were ‘overweight’.
Mean Z-scores of height-for-age (HAZ), weight-for-age (WAZ), weight-for-height (WHZ) and BMI-for-age (BMIZ), determined using the 2006 WHO Child Growth Standards, by age group: children <5 years of age from thirteen rural mid-western provinces, China (n 8041)

Z-scores decreased gradually with increasing age, but there were a few specific changes for each Z-score. HAZ was significantly lower than the mean of the criteria during all ages. The lowest HAZ was at age 36–41 months, and the next lowest was at age 54–59 months. WAZ was close to the criteria in the first 6 months, then fell rapidly and remained at a lower level until 60 months. BMIZ was a new indicator in the new WHO standards, added to the previously available set of indicators in the NCHS reference. We found in all age groups, except for 54–59 months, that BMIZ was higher than the WHO standards (Fig. 2).
Z-scores of height-for-age (—⧫—), weight-for-age (—▪—), weight-for-height (– –▴– –) and BMI-for-age (— -×— -), determined using the 2006 WHO Child Growth Standards, by age group: children <5 years of age from thirteen rural mid-western provinces, China

Malnutrition of children under 5 years old
Table 3 depicts the prevalence of underweight, stunting and wasting overall and in the different provinces. The overall prevalence of stunting was 30·2 % (95 % CI 29·22, 31·27 %), with the highest prevalence in Tibet (49·5 %) and the lowest in Shaanxi (7·8 %). The overall prevalence of underweight was 10·2 % (95 % CI 9·54, 10·89 %), with the highest rate in Tibet (28·7 %) and the lowest in Shanxi (1·9 %). The overall wasting prevalence was 2·9 % (95 % CI 2·51, 3·25 %), with the highest rate in Tibet (6·4 %) and the lowest in Chongqing (0·9 %). Table 3 shows that the prevalence of stunting was about three times the prevalence of underweight and more than ten times that of wasting. The rates varied greatly between the different areas (provinces).
Prevalence of underweight, stunting and wasting, determined using the 2006 WHO Child Growth Standards, by province: children <5 years of age from thirteen rural mid-western provinces, China (n 8041)
Table 1 shows the prevalence of stunting, underweight and wasting by age group. Stunting prevalence was higher than that of underweight and wasting over the whole age range of 0–59 months, with a straight rise at age 18–23 months and remaining at a high level until 59 months. The prevalence of wasting was much lower, the lowest value being 0·7 % at age 48–53 months and the highest 4·8 % at age 6–11 months. The increase in the prevalence of underweight was higher than that of wasting, but was lower than that of stunting. Again, all of these observations indicate that stunting was the most important problem for children aged <5 years.
Boys had a higher prevalence of stunting, underweight, wasting and malnutrition than girls, but the differences were not significantly significant except for stunting (Table 1).
Wasting and ‘overweight’
Stunting, underweight and wasting are the three most important indices of malnutrition, but in the present study the prevalence of wasting was very low (2·9 %) and quite different from the two other indices. On the contrary, among the 8401 children, 435 had BMIZ > 2, indicating a prevalence of overweight of 5·4 %. The possible risk of overweight (BMIZ > 1) was as high as 15·2 %. Remarkably, it seemed that more children were ‘overweight’ than ‘wasted’.
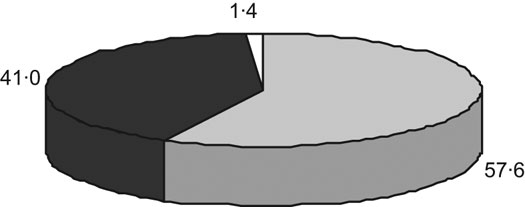
Have the children in poor areas actually become ‘overweight’? We further analysed the relationship between BMI-for-age (BMIZ) and length/height-for-age (HAZ). The results showed that among the 453 children with overweight, the percentage of stunting (HAZ < −2) was 57·6 %, the percentage with −2 ≤ HAZ ≤ 2 was 41·0 %, and the percentage of HAZ > 2 was only 1·4 %. This indicated that more children were ‘stunting overweight’, not really ‘overweight’ (Fig. 3).
Percentage with height-for-age Z-score (HAZ) <−2 (![]() ), with −2 ≤ HAZ ≤ 2 (
), with −2 ≤ HAZ ≤ 2 (![]() ) and with HAZ > 2 (␣), determined using the 2006 WHO Child Growth Standards, among the children with overweight from thirteen rural mid-western provinces, China
) and with HAZ > 2 (␣), determined using the 2006 WHO Child Growth Standards, among the children with overweight from thirteen rural mid-western provinces, China
Comparison of the WHO standards and the NCHS reference
The present study is one of only very few, large-scale surveys so far that have used the WHO standards to estimate malnutrition of children. Table 4 illustrates the differences between the new WHO standards and the old NHCS reference.
Comparison of underweight, stunting and wasting prevalence, determined using the 2006 WHO Child Growth Standards (‘WHO standards’) and the National Center for Health Statistics/WHO international growth reference (‘NCHS reference’), by age group: children <5 years of age from thirteen rural mid-western provinces, China (n 8041)

The overall prevalence of stunting was 21·9 % by the NCHS reference and 30·2 % by the WHO standards (Table 4). The prevalence of underweight by the NCHS reference was higher than that by the WHO standards, except for the group aged 0–5 months. The overall underweight prevalence was 12·7 % by the NCHS reference and 10·2 % by the WHO standards.
Discussion
The causes of stunting
With the WHO standards, we found in the rural communities in our survey that the prevalence of stunting in children <5 years old was as high as 30 %. Stunting highly influences child health, not only decreasing resistance to diseases such as pneumonia and diarrhoea, but also leading to poor recovery, high fatality rate and many other serious consequences(Reference Lutter19–Reference Pelletier23). In addition, stunting is a high risk factor for adult obesity(Reference McCarthy24).
One major cause of stunting is long-term energy–protein deficiency. In our survey, 18·5 % infants aged 0–5 months were stunted. Infants at this early stage depend mainly on breast-feeding; therefore stunting at this age is likely to be due to malnutrition of the mother during pregnancy and the lactation period, indicating that the way to reduce infant stunting is to improve the nutrition of mothers during pregnancy and lactation. From 6 to 59 months stunting rates were very high, especially from 18 months onwards, showing that deficiency of energy and protein intake starts early. Cereals are the principal dietary component in rural areas of mid-western China and are the most important energy source for children. With recent economic development, most rural areas including the mid-western part of China have the capacity to improve infant and child feeding(Reference Chen25), but some misconceptions, such as ‘Being difficult to digest, children should not eat meat and egg’, still widely exist in these areas, which could contribute to low protein intake among the children. In addition, rising prices could limit caregivers’ ability to buy protein-containing foods for their children. We believe that the best way of improving child growth and development is timely, adequate and suitable feeding during the weaning period, especially when it comes to protein and other nutrients such as Zn and Fe(Reference Brown, Peerson, Rivera and Allen26, Reference Lind, Lönnerdal, Stenlund, Ismail, Seswandhana, Ekström and Persson27). In the running project, health education is one of the important components, and various health education methods will be adopted. We suggest that knowledge about nutrition, especially child feeding, should be a major component in this education, especially in the light of our findings.
‘Stunting overweight’ but not ‘overweight’
The results from our survey showed that the prevalence of wasting was comparably low and that of ‘overweight’ was quite high, but further analysis found that the high rate of ‘overweight’ was a false impression. Consequently, there is a need to increase protein and other nutrients in the diet at an early age, which would change ‘stunting’, but not to decrease energy intake to avoid ‘overweight’ alone. We argue that this kind of ‘overweight’ should be called ‘stunting overweight’(Reference Chang, He and Chen5), and is a major and probably growing public health problem that should be given due attention to by the authorities in China.
The WHO standards and NCHS reference
Until 2006, child growth and development was evaluated by the NCHS reference. The WHO standards were completed in 2006. Compared with the NCHS reference, the WHO standards have two prominent characteristics. The first is that they are based on healthy breast-fed children, and the second that they were developed by MGRS, which was a population-based study including children from different countries and areas(13, 17). Therefore it would be more appropriate to assess the nutritional status of children in relation to the new and more universal standards.
Our survey was one of the few studies that so far have used these standards(Reference Nuruddin, Lim, Hadden and Azam15, Reference de Onis, Onyango, Borghi, Garza and Yang28). Hence we also analysed our data in relation to the older and widely used NCHS reference. The results indicate that with the WHO standards the cut-off point of the Z-score for stunting had increased, while the limit for underweight had decreased, which led to a higher prevalence of stunting and a lower prevalence of underweight. This result was similar to the analysis done by WHO(Reference de Onis, Onyango, Borghi, Garza and Yang28). Based on the NCHS reference, the same trends of stunting and underweight prevalence at different months of age were found in the present survey as in the China Nutrition and Health Survey in 2002. The prevalence of stunting and underweight was 21·9 % and 12·7 % respectively in the current survey if the NCHS reference was used; corresponding values in rural areas from the China Nutrition and Health Survey in 2002 were 17·3 % and 9·3 %(Reference Yang, Wang, He, Yu, Hu and Zhai29).
Conclusion
The ‘Mother and Baby Package Project’ intervention covers more than one million children <5 years of age in mid-western China from 2006 to 2010. The baseline survey found that stunting was as high as 30·2 % and was the most serious problem impeding child growth and development. In addition, we found a new phenomenon: the high ‘overweight’ rate in poor areas. On further analysis we definitely indicated this kind of ‘overweight’ was ‘stunting overweight’, and the way to solve it should be to increase protein and other nutrients early, and possibly even to pregnant women, but not to decrease energy intake alone. These results constitute very useful information and should also be taken into account for the ongoing project.
Acknowledgements
Sources of funding: This study was supported/funded by UNICEF and the Chinese Ministry of Health. Conflicts of interest: None declared. Author contributions: X.W. conceived and designed the paper and led the writing; B.H. led the revision of the manuscript and especially edited the paper for language; S.G. designed the study; S.L. designed the study and managed analysis data; W.Z. performed analysis and writing; Y.W. supervised and designed the study. Acknowledgements: We are grateful to Dr Koen Vanormelingen of UNICEF for his support in study concept and design, Messrs Bin Cao and Deying Zhang of the Chinese Ministry of Health for administration of all field process, Mr Bohua Li for statistical advice, and Dr Jingxiong Jiang, Ms Lijuan Li, Ms Huisan Wang, Ms Bo Hao and Ms Gengli Hao for revising the study concept. We also thank Professor Lin An, Professor Jingxu Zhang, Dr Yanqiu Gao, Dr Zhenghong Ren, Ms Ping Duan, Dr Haijun Wang, Dr Chuyun Kang, Professor Xiaolixun Chen, Ms Yuanyuan Wang, Ms Peng Liu, Ms Suizan Zhou, Ms Yuguang Hu, Ms Haihong He, Ms Wenjun Ma, Ms Zhilan Li, Professor Lirong Ju and Professor Li Yang for their help in obtaining data. We extend our gratitude to the thirteen provinces (Gansu, Qinghai, Jiangxi, Xinjiang, Chongqing, Sichuan, Guizhou, Guangxi, Shaanxi, Inner Mongolia, Shanxi, Tibet and Ningxia) and the fifty counties (Jingning, Linzhao, Yongdeng, Linchuan, Anyuan, Huangyuan, Minhe, Huzhu, Guide, Nileke, Xinyuan, Pishan, Shache, Kaixian, Chengkou, Bishan, Cangxi, Pingchang, Muchuan, Xuanhan, Pingguo, Napo, Gongcheng, Lusai, Huguan, Hunyuan, Xiaxian, Mixian, Yuyang, Zhenan, Chayouhouqi, Keerxinzhongqi, Dawaer, Huangping, Congjiang, Panxian, Tongren, Pingtang, Xixiu, Lazi, Jiangzi, Kangma, Chaya, Jiacha, Cuomei, Shenzha, Haiyuan, Xiji, Yuanzhou and Jingyuan) for their support in the field work.


