
The vertebrate body plan underwent profound modifications over 370 million years ago, resulting in a new type of anatomical organisation – the tetrapods or limbed vertebrates (Coates et al. Reference Coates, Ruta and Friedman2008; Clack Reference Clack2009, Reference Clack2012; Clack et al. Reference Clack, Bennett, Carpenter, Davies, Fraser, Kearsey, Marshall, Millward, Otoo, Reeves, Ross, Ruta, Smithson and Smithson2016). The origin of tetrapods and their subsequent colonisation of the land are benchmarks for studies of adaptive radiations as they unlocked ecological opportunities and had lasting effects on the structure and composition of terrestrial communities (Rolfe et al. Reference Rolfe, Clarkson and Panchen1994; Vecoli et al. Reference Vecoli, Clément and Meyer-Berthaud2010; McGhee Reference McGhee2013). Fundamental aspects of vertebrate terrestrialisation, including major changes in locomotory style, feeding strategies and sensory perception, can be examined in increasing detail because of several remarkable fossil discoveries (Daeschler et al. Reference Daeschler, Shubin and Jenkins2006; Smithson et al. Reference Smithson, Wood, Marshall and Clack2012; Smithson & Clack Reference Smithson and Clack2013; Anderson et al. Reference Anderson, Smithson, Mansky, Meyer and Clack2015), new contributions from palaeohistology and biomechanics (Witzmann et al. Reference Witzmann, Scholz, Müller and Kardjilov2010; Janis et al. Reference Janis, Devlin, Warren and Witzmann2012; Pierce et al. Reference Pierce, Clack and Hutchinson2012, Reference Pierce, Ahlberg, Hutchinson, Molnar, Sanchez, Tafforeau and Clack2013; Hohn-Schulte et al. Reference Hohn-Schulte, Preuschoft, Witzel and Distler-Hoffmann2013; Sanchez et al. Reference Sanchez, Tafforeau and Ahlberg2014; Danto et al. Reference Danto, Witzmann and Fröbisch2016), considerable advances in three-dimensional image analysis (Porro et al. Reference Porro, Rayfield and Clack2015a,Reference Porro, Rayfield and Clackb; Clack et al. Reference Clack, Bennett, Carpenter, Davies, Fraser, Kearsey, Marshall, Millward, Otoo, Reeves, Ross, Ruta, Smithson and Smithson2016) and the widespread use of phylogenetic comparative methods (Kimmel et al. Reference Kimmel, Sidlauskas and Clack2009; Anderson et al. Reference Anderson, Friedman and Ruta2013; Neenan et al. Reference Neenan, Ruta, Clack and Rayfield2014). In particular, the appendicular skeleton is an ideal model system for quantifying structural changes underpinning functional and ecological innovations at the water–land transition (Coates et al. Reference Coates, Jeffery and Ruta2002, Reference Coates, Ruta and Friedman2008; Coates & Ruta Reference Coates, Ruta and Hall2007; Clack Reference Clack2009, 2012; Clack et al. Reference Clack, Bennett, Carpenter, Davies, Fraser, Kearsey, Marshall, Millward, Otoo, Reeves, Ross, Ruta, Smithson and Smithson2016). Early in tetrapod evolution, paired appendages and girdles exhibited striking disparity of form (Shubin et al. Reference Shubin, Daeschler and Jenkins2006; Ahlberg et al. Reference Ahlberg, Clack, Luksevics, Blom and Zupins2008; Ahlberg Reference Ahlberg, Barrett and Milner2011; Smithson & Clack Reference Smithson and Clack2013; Anderson et al. Reference Anderson, Smithson, Mansky, Meyer and Clack2015) and showed a mosaic combination of traits (Ahlberg et al. Reference Ahlberg, Clack and Blom2005; Callier et al. Reference Callier, Clack and Ahlberg2009). This implies that these structures had multiple functional adaptations (Pierce et al. Reference Pierce, Clack and Hutchinson2012, Reference Pierce, Ahlberg, Hutchinson, Molnar, Sanchez, Tafforeau and Clack2013; Hohn-Schulte et al. Reference Hohn-Schulte, Preuschoft, Witzel and Distler-Hoffmann2013; Sanchez et al. Reference Sanchez, Tafforeau and Ahlberg2014) and that they evolved rapidly to exploit available ecospace (Clack Reference Clack2007; Coates et al. Reference Coates, Ruta and Friedman2008; Clack Reference Clack2009, Reference Clack2012; Vecoli et al. Reference Vecoli, Clément and Meyer-Berthaud2010; McGhee Reference McGhee2013; Clack et al. Reference Clack, Bennett, Carpenter, Davies, Fraser, Kearsey, Marshall, Millward, Otoo, Reeves, Ross, Ruta, Smithson and Smithson2016). Ruta (Reference Ruta, Barrett and Milner2011) examined the extent to which characters of the fins, limbs and girdles yielded cladograms that were topologically congruent with those built from other suites of osteological traits. Strikingly, appendicular characters implied deep relationships (especially among tetrapodomorph fishes) that are at odds with those inferred from more inclusive skeletal data sets. In more derived branches, by contrast, this conflict was much reduced. Subsequently, Ruta & Wills (Reference Ruta and Wills2016) repurposed appendicular characters for analyses of morphological disparity and morphospace occupation at the fish–tetrapod transition. Their study demonstrated that tetrapodomorph fishes and early tetrapods had comparable levels of appendicular disparity, although fishes tended to be more dispersed within the morphospace than tetrapods. Despite these contributions, however, the tempo and mode of evolutionary transformation in the appendicular skeleton remain poorly understood.
Here, we address this shortcoming by investigating the humeri of early tetrapods and their fish-like forebears. Humeri feature prominently in discussions about tetrapod origins, as they provide a rich source of cladistic characters (Ruta Reference Ruta, Barrett and Milner2011; Ruta & Wills Reference Ruta and Wills2016), underwent substantial remodelling in various stages of tetrapod evolution (e.g., compare aquatic Devonian taxa to Permian and Carboniferous groups with increasing adaptations to terrestriality; Clack Reference Clack2012; Anderson et al. Reference Anderson, Smithson, Mansky, Meyer and Clack2015) and show greater interspecific differences than other appendicular bones (Shubin et al. Reference Shubin, Daeschler and Coates2004; Coates et al. Reference Coates, Ruta and Friedman2008; Clack Reference Clack2009, Reference Clack2012; Ahlberg Reference Ahlberg, Barrett and Milner2011; Ruta Reference Ruta, Barrett and Milner2011; Bishop Reference Bishop2014; Sanchez et al. Reference Sanchez, Tafforeau and Ahlberg2014; Anderson et al. Reference Anderson, Smithson, Mansky, Meyer and Clack2015; Clack et al. Reference Clack, Bennett, Carpenter, Davies, Fraser, Kearsey, Marshall, Millward, Otoo, Reeves, Ross, Ruta, Smithson and Smithson2016; Ruta & Wills Reference Ruta and Wills2016). For these reasons, they inform our understanding of changes in structural complexity (e.g., McShea & Brandon Reference McShea and Brandon2010) during the emergence of an animal clade of great ecological and evolutionary importance (Ruta et al. Reference Ruta, Wagner and Coates2006; Wagner et al. Reference Wagner, Ruta and Coates2006; Sears et al. Reference Sears, Capellini and Diogo2015).
In this paper, we investigate two main hypotheses. (1) Humeral shape disparity (i.e., the variety of humeral morphologies) and evolutionary rates (i.e., the amount of shape change per unit time) were highest in the early stages of tetrapod evolution, particularly at the water–land transition and close to the origin of digit-bearing taxa. (2) The divergence between major groups of early tetrapods was marked by significant shifts in rates of phenotypic evolution (i.e., significant deviations from background rates). Our first hypothesis concerns the scale and timing of morphological change, and dovetails with current debates on the prevalence of disparity-first vs. taxic diversity-first models of clade diversification (Harmon et al. Reference Harmon, Losos, Jonathan, Gillespie, Gittleman, Bryan, Kozak, McPeek, Moreno-Roark, Near, Purvis, Ricklefs, Schluter, Schulte II, Seehausen, Sidlauskas, Torres-Carvajal, Weir and Mooers2010; Venditti et al. Reference Venditti, Meade and Pagel2011; Ruta et al. Reference Ruta, Angielczyk, Fröbisch and Benton2013; Puttick et al. Reference Puttick, Thomas and Benton2014; Xue et al. Reference Xue, Huang, Ruta, Benton, Hao, Xiong, Wang, Cascales-Minana, Wang and Liu2015). Our second hypothesis addresses the question of whether specific branches of the early tetrapod tree are associated with significant rate increases or decreases (Ruta et al. Reference Ruta, Wagner and Coates2006). We are especially interested in branches subtending major groups of early tetrapods and those bracketing the stem- to crown-group transitions (both in tetrapods as a whole and in the two main constituent clades, the amniotes and the lissamphibians). We do not seek to test putative causal relationships between shape changes and either ecological (e.g., habitat transition), anatomical (e.g., appearance of new traits, such as digits), or phylogenetic (e.g., clade origin) innovations, but rather seek to establish whether elevated rates occur at the same time as the appearance of evolutionary novelties (Alfaro et al. Reference Alfaro, Brock, Banbury and Wainwright2009; Anderson et al. Reference Anderson, Friedman and Ruta2013; Brocklehurst et al. Reference Brocklehurst, Ruta, Müller and Fröbisch2015). Nevertheless, such causal relationships almost certainly exist, and mapping elevated rates and the origins of novelties onto the phylogeny is an important prerequisite for testing them.
In order to characterise humeral disparity in early tetrapods and their kin, we quantified differences in humeral shape using outline-based geometric morphometrics, specifically eigenshape (ES) analyses (Lohmann Reference Lohmann1983; MacLeod Reference MacLeod1999, Reference MacLeod2001). An empirical morphospace was generated through a singular value decomposition of the specimens' covariance matrix (see below); the resulting shape variables (i.e., the ES scores, which identify the positions of specimens within that morphospace) formed the basis for all subsequent analyses. From these shape data, we examined changes in humeral morphology across groups and through time. In addition, we compared the fit of different evolutionary models for the shape variables to a time-calibrated phylogeny. Finally, we evaluated the timing, distribution, direction, magnitude and posterior probability of rates of change and their associated shifts across the phylogeny (Eastman et al. Reference Eastman, Alfaro, Joyce, Hipp and Harmon2011; Thomas & Freckleton Reference Thomas and Freckleton2012). Ultimately, we asked whether such shifts coincided temporally with key episodes in tetrapod history (Clack Reference Clack2007, Reference Clack2012; Clack et al. Reference Clack, Bennett, Carpenter, Davies, Fraser, Kearsey, Marshall, Millward, Otoo, Reeves, Ross, Ruta, Smithson and Smithson2016), whether various groups of early tetrapods and tetrapod-like fish differed in the distribution of branch-specific rates (Eastman et al. Reference Eastman, Alfaro, Joyce, Hipp and Harmon2011), and whether changes in humeral shape conformed to particular evolutionary models, such as early bursts (Wang & Lloyd Reference Wang and Lloyd2016), variable trends (Hopkins & Smith Reference Hopkins and Smith2015) or no directionality of transformations (Sookias et al. Reference Sookias, Butler and Benson2012).
As humeri are complex three-dimensional objects, outlines cannot capture all of their subtle structural details, such as the shape, size, distribution and number of foramina, grooves, depressions, processes, crests and ridges, among others (e.g., Coates et al. Reference Coates, Jeffery and Ruta2002; Shubin et al. Reference Shubin, Daeschler and Coates2004; Coates & Ruta Reference Coates, Ruta and Hall2007; Callier et al. Reference Callier, Clack and Ahlberg2009; Ahlberg Reference Ahlberg, Barrett and Milner2011). However, outlines do encapsulate major proportional differences of the overall humeral build, including the degree of shaft elongation and ‘waisting', the profiles of the proximal and distal humeral extremities, the shape of the distal articular condyles, and the position and proportions of crests, flanges and tuberosities. Professor Stephanie Pierce (Museum of Comparative Zoology, Harvard) is currently undertaking a morphometric study of three-dimensionally rendered models of humeri, using a slightly different taxon set than the one employed here. It will be interesting to compare the results of her study with those presented here, in order to establish whether two- and three-dimensional shape data provide comparable results in terms of patterns of morphospace occupation, morphological disparity and evolutionary rates.
1. Materials and methods
Throughout, open source libraries in the ‘R' environment for statistical computing and graphics (http://www.R-project.org/; v. 3.4.3) are reported in italics, specific functions in those libraries appear in quotation marks, and particular settings within those functions are shown in double quotation marks.
1.1. Taxon sample
Our sample consisted of 135 taxa (supplementary Table 1; available at https://doi.org/10.1017/S1755691018000749) assigned to the following seven major grades and clades (for synoptic treatments, see Heatwole & Carroll Reference Heatwole and Carroll2000; Clack Reference Clack2012; Swartz Reference Swartz2012; Benton Reference Benton2014; Schoch Reference Schoch2014): (1) fin-bearing tetrapodomorphs (N=11; hereafter, fish for brevity, e.g., rhizodonts, osteolepiforms, elpistostegalians); (2) limb-bearing tetrapodomorphs phylogenetically preceding the crown-group tetrapod radiation (N=14; hereafter, stem tetrapods, e.g., Acanthostega, Ichthyostega, whatcheerids, colosteids, baphetids); (3) stem-group lissamphibians (N=33; herein co-extensive with temnospondyls; hereafter, stem amphibians); (4) crown-group lissamphibians (N=12; i.e., early frogs, salamanders and caecilians; hereafter, crown amphibians); (5) stem-group amniotes (N=15; e.g., anthracosaurs, chroniosuchians, gephyrostegids, seymouriamorphs, diadectomorphs, Casineria; hereafter, stem amniotes); (6) crown-group amniotes (N=27; i.e., early synapsids, diapsids and parareptiles; hereafter, crown amniotes); (7) lepospondyls (N=23; microsaurs, nectrideans, lysorophians; two additional lepospondyl clades, the adelospondyls and the aïstopods, both consisting of limb-less taxa, were excluded).
Taxa were selected on four criteria: (1) satisfactory preservation of humeri and availability of adequate illustrations and/or reconstructions in the published literature; (2) exhaustive coverage of humeral morphologies, including those of highly divergent taxa (such as the humerus of the rhizodont tetrapodomorph Sauripterus taylori; Davis et al. Reference Davis, Shubin and Daeschler2004, fig. 6) as well as humeri differing only in subtle details of their overall build (such as the two humerus morphotypes of the lysorophian lepospondyl Brachydectes elongatus; Wellstead Reference Wellstead1991, fig. 21); (3) inclusion of taxa that bracket main events of interest (e.g., origin of digits; emergence onto land; stem-crown transitions); (4) specimen maturity, whereby humeri of adult or near-adult specimens were used, so far as possible. Concerning point (4) above, we relied for the most part on described accounts in our selection of suitable specimens for the morphometric analyses. However, ascertaining the degree of maturity for many early tetrapods is difficult, especially when ontogenetic data or information from other portions of the skeleton are not available. In some cases, we had to adopt a typological criterion, whereby the available humeri were taken to represent the standard condition for the species. For example, in a handful of cases when only one or very few specimens were known, and only some of those yielded viable morphological data, we selected the best preserved specimen. In a few taxa, such as the chroniosaur stem amniote Chroniosaurus dongusensis (Clack & Klembara Reference Clack and Klembara2009) and the stereospondylomorph stem amphibian Glanochthon latirostre (Schoch & Witzmann Reference Schoch and Witzmann2009), the best preserved humeri sourced from published material may not belong to fully mature individuals, but we opted for including them in order to maximise sample size. Although many other taxa could not be included (e.g., if they did not meet one or more of the criteria above), we believe our sample encompasses a broad cross-section of early tetrapod diversity. In this respect, a practical ‘upper limit' had to be placed on the sampled diversity of crown amphibians and crown amniotes, as these fell outside the scope of the present paper.
1.2. Time-calibrated supertree
We assembled an informal supertree (sensu Butler & Goswami Reference Butler and Goswami2008) by combining the most recent small-scale phylogenies of various groups, each of which was pruned to match the taxon sample utilised here (supplementary Fig. 1). With this approach, however, it was also necessary to provide a suitable ‘backbone' tree topology linking the various groups. We acknowledge that there is still no consensus on the branching sequence of several clades and grades of early tetrapods. Therefore, our preferred supertree should only be regarded as a working hypothesis and subject to revision in the light of recent discoveries and alternative schemes of relationships (e.g., Clack et al. Reference Clack, Bennett, Carpenter, Davies, Fraser, Kearsey, Marshall, Millward, Otoo, Reeves, Ross, Ruta, Smithson and Smithson2016; Pardo et al. Reference Pardo, Small and Huttenlocker2017a,Reference Pardo, Szostakiwskyj, Ahlberg and Andersonb). A review of competing phylogenetic hypotheses is outside the scope of this contribution. We have not carried out sensitivity analyses based on alternative tree shapes or branching sequences within groups, as this is part of ongoing work by the senior author. However, comments on some of the most recently published cladistics analyses are warranted.
Our supertree draws from some of the largest phylogenies published to date (e.g., Ruta & Coates Reference Ruta and Coates2007). Several elements from Ruta & Coates's (Reference Ruta and Coates2007) tree topology have been used to construct the backbone of the present supertree. The phylogeny in Pardo et al. (Reference Pardo, Small and Huttenlocker2017a) consists mostly of temnospondyls, and the major difference between it and the supertree presented here is the placement of crown amphibians at the apical end of a paraphyletic radiation of stereospondyl temnospondyls. Conversely, we placed crown amphibians among dissorophoid temnospondyls (e.g., Ruta & Coates Reference Ruta and Coates2007; Schoch Reference Schoch2014). Pardo et al.'s (Reference Pardo, Small and Huttenlocker2017a) challenging new hypothesis, and the putative caecilian affinities of their new Triassic tetrapod, Chinlestegophis jenkinsi, require further scrutiny and are part of work in progress by the senior author. The phylogeny in Pardo et al. (Reference Pardo, Szostakiwskyj, Ahlberg and Anderson2017b) covers a more diverse range of tetrapod groups than Pardo et al. (Reference Pardo, Small and Huttenlocker2017a) and shows greater similarities to our supertree. However, it differs from the latter in placing microsaur lepospondyls within crown amniotes, and aïstopods on the tetrapod stem, between Acanthostega and whatcheeriids. The novel position for aïstopods does not have a major effect on the conclusions from this paper because of their limblessness, although it may alter branch lengths along the tetrapod stem. As for microsaurs, we await a more detailed treatment of their affinities and those of other lepospondyls (Ahlberg, Beznosov, Clack, and Ruta, in preparation; Clack, Milner, and Ruta, in preparation). Finally, in Clack et al.'s (Reference Clack, Bennett, Carpenter, Davies, Fraser, Kearsey, Marshall, Millward, Otoo, Reeves, Ross, Ruta, Smithson and Smithson2016) parsimony-based and Bayesian phylogenies, various groups usually placed on the tetrapod stem are relocated to the tetrapod crown (e.g., colosteids), depending on optimality criteria for tree searches. However, the branching pattern retrieved by those authors is still largely in agreement with our supertree for several groups. In addition, microsaurs were the only group of lepospondyls included in that study. The placement of several new Tournaisian tetrapods described by Clack et al. (Reference Clack, Bennett, Carpenter, Davies, Fraser, Kearsey, Marshall, Millward, Otoo, Reeves, Ross, Ruta, Smithson and Smithson2016) may imply, once again, changes to temporal estimates of some branching events along the tetrapod stem and, possibly, the base of the crown. Of the named Tournaisian taxa, only Ossirarus kierani shows partially preserved humeri, and these are being prepared further in anticipation of a redescription of that taxon (Smithson, et al., in preparation). Finally, the unnamed humerus NMS G.2016.15.1 (‘probable new taxon 7'; Clack et al. Reference Clack, Bennett, Carpenter, Davies, Fraser, Kearsey, Marshall, Millward, Otoo, Reeves, Ross, Ruta, Smithson and Smithson2016, supplementary Fig. 6) is too heavily damaged at its proximal extremity to permit an accurate characterisation of its complete outline.
1.2.1. Tree topology
The portion of the supertree encompassing tetrapodomorph fish mostly followed Swartz (Reference Swartz2012). The branching patterns for stem tetrapods, stem amphibians and stem amniotes largely conformed to the trees in Ruta & Coates (Reference Ruta and Coates2007) and Schoch (Reference Schoch2013). Ruta & Coates (Reference Ruta and Coates2007) and Maddin et al. (Reference Maddin, Jenkins and Anderson2012) were used chiefly for the lepospondyls. The interrelationships of crown amphibians followed in part Marjanović & Laurin (Reference Marjanović and Laurin2007) and Ascarrunz et al. (Reference Ascarrunz, Rage, Legreneur and Laurin2016). Crown amphibians were grafted at the apical end of dissorophoid temnospondyls (Ruta & Coates Reference Ruta and Coates2007). However, see also Marjanović & Laurin (Reference Marjanović and Laurin2013) and Pardo et al. (Reference Pardo, Small and Huttenlocker2017a) for alternative hypotheses of amphibian ancestry. Finally, we sourced crown amniote phylogenies from the studies by Benson (Reference Benson2012; synapsids), Tsuji & Müller (Reference Tsuji and Müller2009; parareptiles) and Müller & Reisz (Reference Müller and Reisz2006; diapsids).
1.2.2. Branch scaling
We collected stratigraphic first appearance data (FAD; supplementary Table 1) for all taxa using primary literature complemented by searches in the Paleobiology Database (https://paleobiodb.org; for some age estimates, see Anderson et al. Reference Anderson, Friedman and Ruta2013). FADs were used to time-calibrate the supertree (i.e., its branch lengths were scaled in proportion to their duration in millions of years). The calibration was carried out with the ‘timePaleoPhy' function in paleotree (Bapst Reference Bapst2013), and the ‘equal' method of time scaling (Ruta et al. Reference Ruta, Wagner and Coates2006; Brusatte et al. Reference Brusatte, Benton, Ruta and Lloyd2008; Bell & Lloyd Reference Bell and Lloyd2015). With this method, the time elapsed between a node and the earliest occurrence of its oldest descendant was allocated equally to all the branches subtended by that node (see also the following resource for additional explanations: http://graemetlloyd.com/methdpf.html). We favoured this scaling method because it is the most conservative of all available time-calibration protocols. It makes the fewest possible assumptions about divergence times, as it relies exclusively upon the minimum time estimates dictated by the FAD data (but see Bapst Reference Bapst2014 for a lucid exposition of the different methods available). A root of one million years was appended to the supertree. The choice of this root duration was consistent with the estimated time occurring between the most basal node in our supertree and the earliest occurrences of tetrapodomorph's fossil sister groups (see Anderson et al. Reference Anderson, Friedman and Ruta2013). The time-calibrated supertree is available as an object of class ‘phylo' readable in R (Supplementary Material).
1.3. Morphometric analyses
We sourced the literature for high-resolution photographs and/or reliable reconstructions of humeri (Supplementary Material). Photographs and reconstructions were converted to high-resolution (300 pixels/inch) black silhouettes against a white background and saved as TIFF files in Adobe Photoshop CS4. Right humeri in full extensor view were chosen to standardise image orientations, with the greatest proximo-distal extension of each humerus oriented vertically. If extensor views were not available, we used either left humeri in flexor view, reversed images of left humeri in extensor view or reversed images of right humeri in flexor view, depending upon which orientation was available. Each TIFF image was cropped close to the humeral outline along the greatest proximo-distal lengths of the latter. All cropped images were saved in Adobe Photoshop at a height of 20cm. Noise as a result of pixellation was reduced through the application of a smoothing tool in the same software.
Humeral outlines were digitised in tpsDIG2 v. 2.32, available from the Stony Brook Morphometrics website: http://life.bio.sunysb.edu/morph/soft-dataacq.html. For each outline, we saved the total number of landmarks selected by tpsDIG2, that is the number needed to represent with accuracy the digitised specimens (this number ranged from 2541 to 5437). The saved files were assembled into a single file, which was subjected to Coordinate Point Eigenshape analysis (CPES; MacLeod Reference MacLeod2001; see also Figueirido et al. Reference Figueirido, MacLeod, Krieger, De Renzi, Perez-Claros and Palmqvist2011 for another application of this technique to skeletal elements), which is a modified version of Extended Eigenshape analysis (EES; MacLeod Reference MacLeod1999). While EES quantifies angular deviations between adjacent landmarks (i.e., changes in the angle subtended by two adjacent landmark pairs around an outline), CPES employs the raw landmark coordinates and performs a Procrustes superposition to align specimens, which makes it equivalent to a Relative Warps analysis, albeit with more data (i.e., landmarks) than the latter would typically use. In this way, the complete geometry of the humerus outlines was investigated, allowing the CPES to summarise the key aspects of shape variation (i.e., major proportional differences) described above. The various steps of CPES were implemented in Mathematica (Wolfram Inc., v. 9.0.1) using a series of notebooks available via morpho-tools.net (Jonathan Krieger, 2014: CPES Step 1 v. 1.2; CPES Step 2 Alignment v. 1.3; CPES Step 3 SVD Models v. 1.3, CPES Step 4 Plots v. 1.4). Specimen outlines were interpolated to 1500 equally spaced landmarks along a closed curve. This number was sufficiently large to capture subtle twists and turns along the outline of each humerus. Specimens were resized to unit centroid size and subjected to a Procrustes superposition to remove the effects of scale, translation and rotation. A singular value decomposition was then performed on a covariance matrix of the aligned specimens, from which the CPES morphospace was generated.
1.4. Shape variation
We quantified morphological disparity by group (e.g., Wills et al. Reference Wills, Briggs and Fortey1994; Ciampaglio et al. Reference Ciampaglio, Kemp and McShea2001; Ruta et al. Reference Ruta, Angielczyk, Fröbisch and Benton2013) and through time (e.g., Harmon et al. Reference Harmon, Schulte II, Larson and Losos2003, Reference Harmon, Weir, Brock, Glor and Challenger2008; Slater et al. Reference Slater, Price, Santini and Alfaro2010; Cantalapiedra et al. Reference Cantalapiedra, Prado, Fernández Hernández and Alberdi2017), in each case using scores from the first 40 eigenaxes, collectively summarising ∼99.8% of the total variance. For disparity analyses by group, mean disparity values and their associated 95% confidence intervals were calculated for each of the seven major groups using three disparity indices plus one dispersion index. For disparity analyses through time, we quantified the extent to which variation in humeral shape was partitioned among contemporaneous lineages (subclades) throughout the time interval encompassed by the supertree.
1.4.1. Disparity by group
For this set of analyses, we used the following disparity indices: sum of ranges (amount of the total empirical morphospace occupied by a group; Wills et al. Reference Wills, Briggs and Fortey1994; Ciampaglio et al. Reference Ciampaglio, Kemp and McShea2001; Ruta et al. Reference Ruta, Angielczyk, Fröbisch and Benton2013), sum of variances (dispersal of taxa within a group relative to that group's centroid; Wills et al. Reference Wills, Briggs and Fortey1994; Ciampaglio et al. Reference Ciampaglio, Kemp and McShea2001; Ruta et al. Reference Ruta, Angielczyk, Fröbisch and Benton2013), and mean pairwise dissimilarity (mean of within-group inter-taxon Euclidean distances; Benson & Druckenmiller Reference Benson and Druckenmiller2014; Xue et al. Reference Xue, Huang, Ruta, Benton, Hao, Xiong, Wang, Cascales-Minana, Wang and Liu2015). In addition, the distance from founder (mean of Euclidean distances of taxa within a group from a reference taxon outside that group; Gavrilet Reference Gavrilet1999; Ruta et al. Reference Ruta, Angielczyk, Fröbisch and Benton2013) was used as a dispersion index. For the distance from founder and the mean pair-wise dissimilarity, we calculated pair-wise Euclidean distances between taxa from their eigenscores using the ‘dist' function in stats, and subjected them to methods in Gavrilet (Reference Gavrilet1999; distance from founder; see also Ruta et al. Reference Ruta, Angielczyk, Fröbisch and Benton2013) and Benson & Druckenmiller (Reference Benson and Druckenmiller2014; mean pairwise dissimilarity; see also Xue et al. Reference Xue, Huang, Ruta, Benton, Hao, Xiong, Wang, Cascales-Minana, Wang and Liu2015). For each group, and for each of the two sum indices, we also built a plot of rarefied disparity values for the mean and 95% confidence interval. Rarefaction was carried out at a sample size coinciding with that of the least diverse group (fish; N=11), in order to account for unequal taxon numbers in the groups. We used the ‘cor.test' function in stats to carry out Spearman rank-order correlations between diversity and each of the un-rarefied and rarefied sets of values for the two sum indices.
1.4.2. Disparity through time
For this set of analyses, we calculated the mean relative subclade disparity through time (DTT; e.g., Harmon et al. Reference Harmon, Schulte II, Larson and Losos2003, Reference Harmon, Weir, Brock, Glor and Challenger2008; Slater et al. Reference Slater, Price, Santini and Alfaro2010; Cantalapiedra et al. Reference Cantalapiedra, Prado, Fernández Hernández and Alberdi2017), using the mean pair-wise Euclidean distance between taxa as a disparity metric. The observed mean subclade disparity values were compared to the median DTT values obtained from 1000 random simulations of trait (i.e., eigenscores) evolution on the phylogeny under a Brownian motion (hereafter, BM) model. These simulations were used to build a 95% confidence envelope around the median DTT. The DTT calculations were performed with the ‘dtt' function in geiger (Harmon et al. Reference Harmon, Weir, Brock, Glor and Challenger2008), which was also used to calculate a morphological disparity index (MDI; Slater et al. Reference Slater, Price, Santini and Alfaro2010) and its statistical significance. Specifically, the MDI represents the difference between the observed and the median DTT, and indicates whether trait variation within constituent lineages is higher (MDI>0) or lower (MDI<0) than expected. When MDI is positive, lineages tend to occupy large overlapping regions of trait space, i.e., they exhibit higher than expected mean relative subclade disparity. When MDI is negative, lineages tend to occupy small non-overlapping regions of trait space, i.e., they exhibit lower than expected mean relative subclade disparity.
1.5. Characterisation of morphospace occupation
For analyses of morphospace occupation, we used two different approaches. Firstly, we sought to characterise plots of data points (i.e., humeral shapes) in terms of their closeness to, or departure from, a Poisson model of random point distribution. Secondly, we evaluated the statistical significance of differences among groups in morphospace.
1.5.1. Data point distribution
We used Ripley's K function (Ripley Reference Ripley1976) to establish whether the observed distribution of humeri in morphospace departed from complete spatial randomness (CSR). With CSR, all circular (two-dimensional) or spherical (three-dimensional) ‘observation windows' of the same size should contain statistically indistinguishable numbers of points regardless of their location in morphospace. To this end, the observed distribution of humeri in three dimensions was compared to 1000 simulations of CSR (i.e., null Poisson three dimensional distributions of data points equal in number to our taxon sample size). The simulations were used to plot a 95% confidence envelope around a null median Poisson distribution of 135 points. The Ripley's K function and its associated confidence envelopes were built with the ‘K3est' and ‘envelope.pp3' functions in spatstat (Baddeley et al. Reference Baddeley, Rubak and Turner2015). Tests of CSR in three dimensions were applied to all taxa and to the individual groups defined above. To this end, we used the first three eigenaxes, together accounting for nearly 81% of the total shape variance, due to current limitations on the number of variables that can be handled in spatstat.
1.5.2. Differences among groups
We used PAST3 (https://folk.uio.no/ohammer/past/) to carry out a one-way non-parametric multivariate analysis of variance (PERMANOVA; H0: multivariate ES score means are similar in different groups; Anderson Reference Anderson2001) and an analysis of similarity (ANOSIM; H0: rank-converted inter-taxon distances within groups are similar to rank-converted inter-taxon distances between groups; Clarke 1993) (supplementary Table 2). Both analyses tested whether the seven groups were significantly separated in morphospace, and were applied to the eigenscores from the first 40 eigenaxes. The significance of each test statistic was assessed through 10,000 permutations of data structure. For both tests, we reported uncorrected and Bonferroni-corrected P-values for post hoc pairwise comparisons.
In addition to npMANOVA and ANOSIM, we also evaluated differences between all group pairs with kernel density-based (Wand & Jones Reference Wand and Jones1995) global two-sample comparison tests in ks (Duong et al. Reference Duong, Goud and Schauer2012), using ES scores on the first three axes for each pairwise comparison (although up to six univariate variables can be used by ks, the use of the first three eigenaxes was justified on the ground that they offer a visually intuitive characterisation of group separation in three dimensions). Specifically, such tests looked at differences between the density functions associated with the distributions of ES1–ES3 scores for any two groups (H0: the density functions of the two groups are identical).
1.6. Shape evolution
The macroevolutionary dynamics of humeral shape changes were addressed in three ways. Firstly, and as a general approach, we compared the fits of different evolutionary models to the phylogeny. Secondly, we examined variations in evolutionary rates. Thirdly, we explored the allometric relationship between humeral shape and size.
1.6.1. Evolutionary model fitting
Model fits were evaluated with the ‘transformPhylo.ML' function in motmot (Thomas & Freckleton Reference Thomas and Freckleton2012) and with the ‘fitContinuous' function in geiger (supplementary Table 3). Unlike the current version of geiger, motmot can handle several variables at once, but computation time may then become prohibitively long. For this reason, motmot was used with the first three and the first 10 eigenaxes (the latter summarise ∼96.2% of the total variance), and we compared the performance of five models implemented in that package, namely: BM; delta; kappa; lambda; Ornstein–Uhlenbeck (hereafter, OU).
In geiger, the following nine models were tested (four additional models relative to motmot): BM; delta; drift; early burst; kappa; lambda; OU; trend; white noise. The Maximum Likelihood (hereafter, ML) values from each model were used to rank their fits, the best-fitting model being the one with the highest ML value. However, strongly competing models may exhibit close (or even identical) ML values, making it difficult to favour one model over another. For this reason, we also reported additional measures of fit in the form of Akaike Information Criterion (AIC) and a variant thereof for heterogeneous sample sizes (AICc). Both AIC and AICc values were ranked according to their weights (AICw; AICcw), the best-fitting model being the one with the largest AICw or AICcw. Such weights were calculated with the ‘aicw' function in geiger.
1.6.2. Rates and shifts
We examined rates of evolutionary change and their associated shifts in both Bayesian and ML frameworks (supplementary Table 3). In the Bayesian approach to rate detection, we used the reversible-jump Markov Chain Monte Carlo Bayesian protocol implemented in auteur (now also available in geiger; Eastman et al. Reference Eastman, Alfaro, Joyce, Hipp and Harmon2011) to capture complex patterns of change that may vary from a global optimum shift along an internal branch to shifts that differ on every branch. We ran two Markov chains with 106 sampling generations in the ‘rjmcmc' Bayesian sampler function in auteur. In its current implementation, auteur (and equivalent functions in geiger) can only be used with univariate data, and so we applied it to sets of scores from each of the first three eigenaxes. In the same package, and for each of the first three eigenaxes, we tested the significance of differences in posterior rates between groups, which provides a direct way to assess rate variability across the phylogeny (Eastman et al. Reference Eastman, Alfaro, Joyce, Hipp and Harmon2011). To this end, the ‘compare.rates' function was used to carry out randomisation tests of pairwise differences in the probability density distributions of branch-specific, re-scaled posterior rates (i.e., rates that were weighted according to branch lengths), as per protocols in Eastman et al. (Reference Eastman, Alfaro, Joyce, Hipp and Harmon2011). Formally, given any two groups A and B, we tested the propositions that branch-specific rates in group A were greater [P (r.test)$greater] or lesser [P (r.test)$lesser] than branch-specific rates in group B. The probability of the random pair-wise comparisons was quantified under a two-tailed test, given no a priori assumptions about the direction of those comparisons.
In the ML approach to rate detection, we used the ‘tm1' model of trait evolution in motmot, which identifies rate shifts using a ML model fitting procedure and can accommodate multivariate data (Thomas & Freckleton Reference Thomas and Freckleton2012; Puttick et al. Reference Puttick, Thomas and Benton2014). The ‘tm1' model was fitted to individual ES1, ES2 and ES3, combined ES1–ES3 and combined ES1–ES10 scores, allowing a maximum of five rate shifts to be retrieved on the phylogeny given a minimum clade size of three taxa (i.e., only branches with three or more taxa were considered for shift detection) (supplementary Table 3).
1.6.3. Shape and size
For humerus size, we chose the proximo-distal length of humeri in the chosen standard orientation (see above). Sizes were expressed in mm and ln-transformed prior to conducting analyses. We tested for the strength and correlation between size (as a predictor variable) and each of the score sets from the first three eigenaxes (as response variables) using Phylogenetic Generalized Least Square (PGLS) regressions (Mundry Reference Mundry and Garamszegi2014; Symonds & Blomberg Reference Symonds, Blomberg and Garamszegi2014), implemented in caper (Orme et al. Reference Orme, Freckleton, Thomas, Petzoldt, Fritz and Isaac2013), ape (Paradis et al. Reference Paradis, Claude and Strimmer2004), and nlme (Pinheiro et al. Reference Pinheiro, Bates, DebRoy and Sarkar2017). Diagnostic tests were run to check how well the fitted PGLS model conformed to statistical assumptions of phylogenetic regression (e.g., normal distribution of phylogenetic residuals; non-homogeneity in bivariate scatterplots of residual vs. fitted values; Mundry Reference Mundry and Garamszegi2014; Symonds & Blomberg Reference Symonds, Blomberg and Garamszegi2014). The PGLS analyses were conducted with the ‘pgls' function in caper, adjusting branch lengths according to a ML estimate for the lambda parameter.
2. Results
2.1. Major aspects of shape variation
Humeral outlines were modelled from lowest to highest scores at equally spaced points along each of the first three axes (Fig. 1). Humeral shape varied considerably on ES1 (Fig. 1a), ranging from the stout, proximo-distally abbreviated humerus of the rhizodont Sauripterus (high negative ES1 scores) to the gracile, subcylindrical humeri of several crown amphibians (e.g., Czatkobatrachus; Triadobatrachus; Prosalirus; Valdotriton), crown amniotes (e.g., Araeoscelis; Petrolacosaurus) and lepospondyls (e.g., Leiocephalikon; Rhynchonkos) (high positive ES1 scores). Changes on ES1 included: antero-posterior shortening and slight proximo-distal elongation of the entepicondylar flange (in the posterior distal region of the humerus); shaft becoming increasingly slender, elongate and waisted; and antero-posterior shortening of the proximal and distal humeral extremities.
Reconstructed models of humeral outlines at regularly spaced intervals along the first 12 eigenaxes, with percentages of the total variance explained by each axis. See Section 2.1 of the main text for detailed descriptions of the main changes in humeral outlines along the first three eigenaxes.
Shape variation on ES2 (Fig. 1b) was similarly extensive, ranging from the strongly twisted, massive humeri of various crown amniotes (e.g., Cotylorhynchus; Anthodon) and stem amphibians (e.g., Glaukerpeton; Glanochthon) (negative scores) to the slender, sigmoid humeri of certain lepospondyls (e.g., Brachydectes) and stem amphibians (e.g., Micropholis) (positive scores). Changes on ES2 included: reduction in the anterior projection and overall size of the supinator process (in the anterior distal region of the humerus); shaft becoming slightly elongate and narrower; reduction in size of the distal humeral extremity; reduction in size and curvature of the entepicondylar flange; and reduction in the curvature of the anterior and posterior margins of the shaft.
Stem amphibians occupied the extremes of shape variation on ES3 (Fig. 1c), alongside stem and crown amniotes, respectively, on negative (e.g., Eryops; Acheloma; Diadectes; Diasparactus) and positive scores (e.g., Archegosaurus; Broiliellus; Anthodon; Cotylorhynchus). Changes on ES3 included: humerus shaft becoming proportionally wider and more robust, and exhibiting increasingly shallow anterior and more deeply concave posterior margins; distal humeral extremity becoming antero-posteriorly shorter; outline of the entepicondylar flange changing from proximo-distally wide and bluntly square to proximo-distally abbreviated and subtriangular; and proximal humeral extremity expanding antero-posteriorly.
2.2. Distribution in morphospace
Figure 2a–c illustrates the distribution of humeri in two-dimensional regions of morphospace using pairwise combinations of the first three eigenaxes, colour- and symbol coded according to groups. Next to each bivariate scatterplot are reconstructed models of humeral outlines at seven equally spaced points along those axes, and at regular intervals within the two-dimensional plane delimited by them. Ripley's K function in three dimensions (supplementary Fig. 2A) shows that the distribution of all humeri differed significantly from CSR. Specifically, individual humeri and clusters of humeri were closer to their nearest neighbours than expected from a null model at all spatial scales (i.e., from small to large morphospatial distances). In contrast, the distributions of the humeri of most individual groups (within the combined morphospace) conformed to CSR (supplementary Fig. 2B–H), except in the case of stem amphibians (supplementary Fig. 2D) and crown amniotes (supplementary Fig. 2G). In particular, the distribution of stem amniote humeri showed over-clustering along a narrow range of small spatial distances, whereas that of stem amphibians showed over-clustering along two narrow, adjacent ranges of large spatial distances.
The plots in the left column show patterns of morphospace occupation of the humeri examined in the present study; the plots in the right column show reconstructed models of humeral outlines in a grid-like distribution; note that this distribution does not correspond to the actual location of humeri in the left panels, and only aims to illustrate general proportional differences in humeral outlines at regularly spaced intervals; the plots are in the two-dimensional regions of morphospace delimited by pair-wise combinations of the first three eigenaxes: (A) eigenaxes ES1–2; (B) eigenaxes ES1–3; (C) eigenaxes ES2–3; the colour-coded convex hulls in the left panels delimit taxa included in each of the seven major groups described in the text and have also been superimposed on the right panels. Colour and symbol codes are as follows: fish, blue circles; stem tetrapods, green squares; stem amphibians, upward-pointing magenta triangles; crown amphibians, downward-pointing red triangles; stem amniotes, grey-blue rhombs; crown amniotes, brown open circles with crosses; lepospondyls, black open rhombs with crosses.
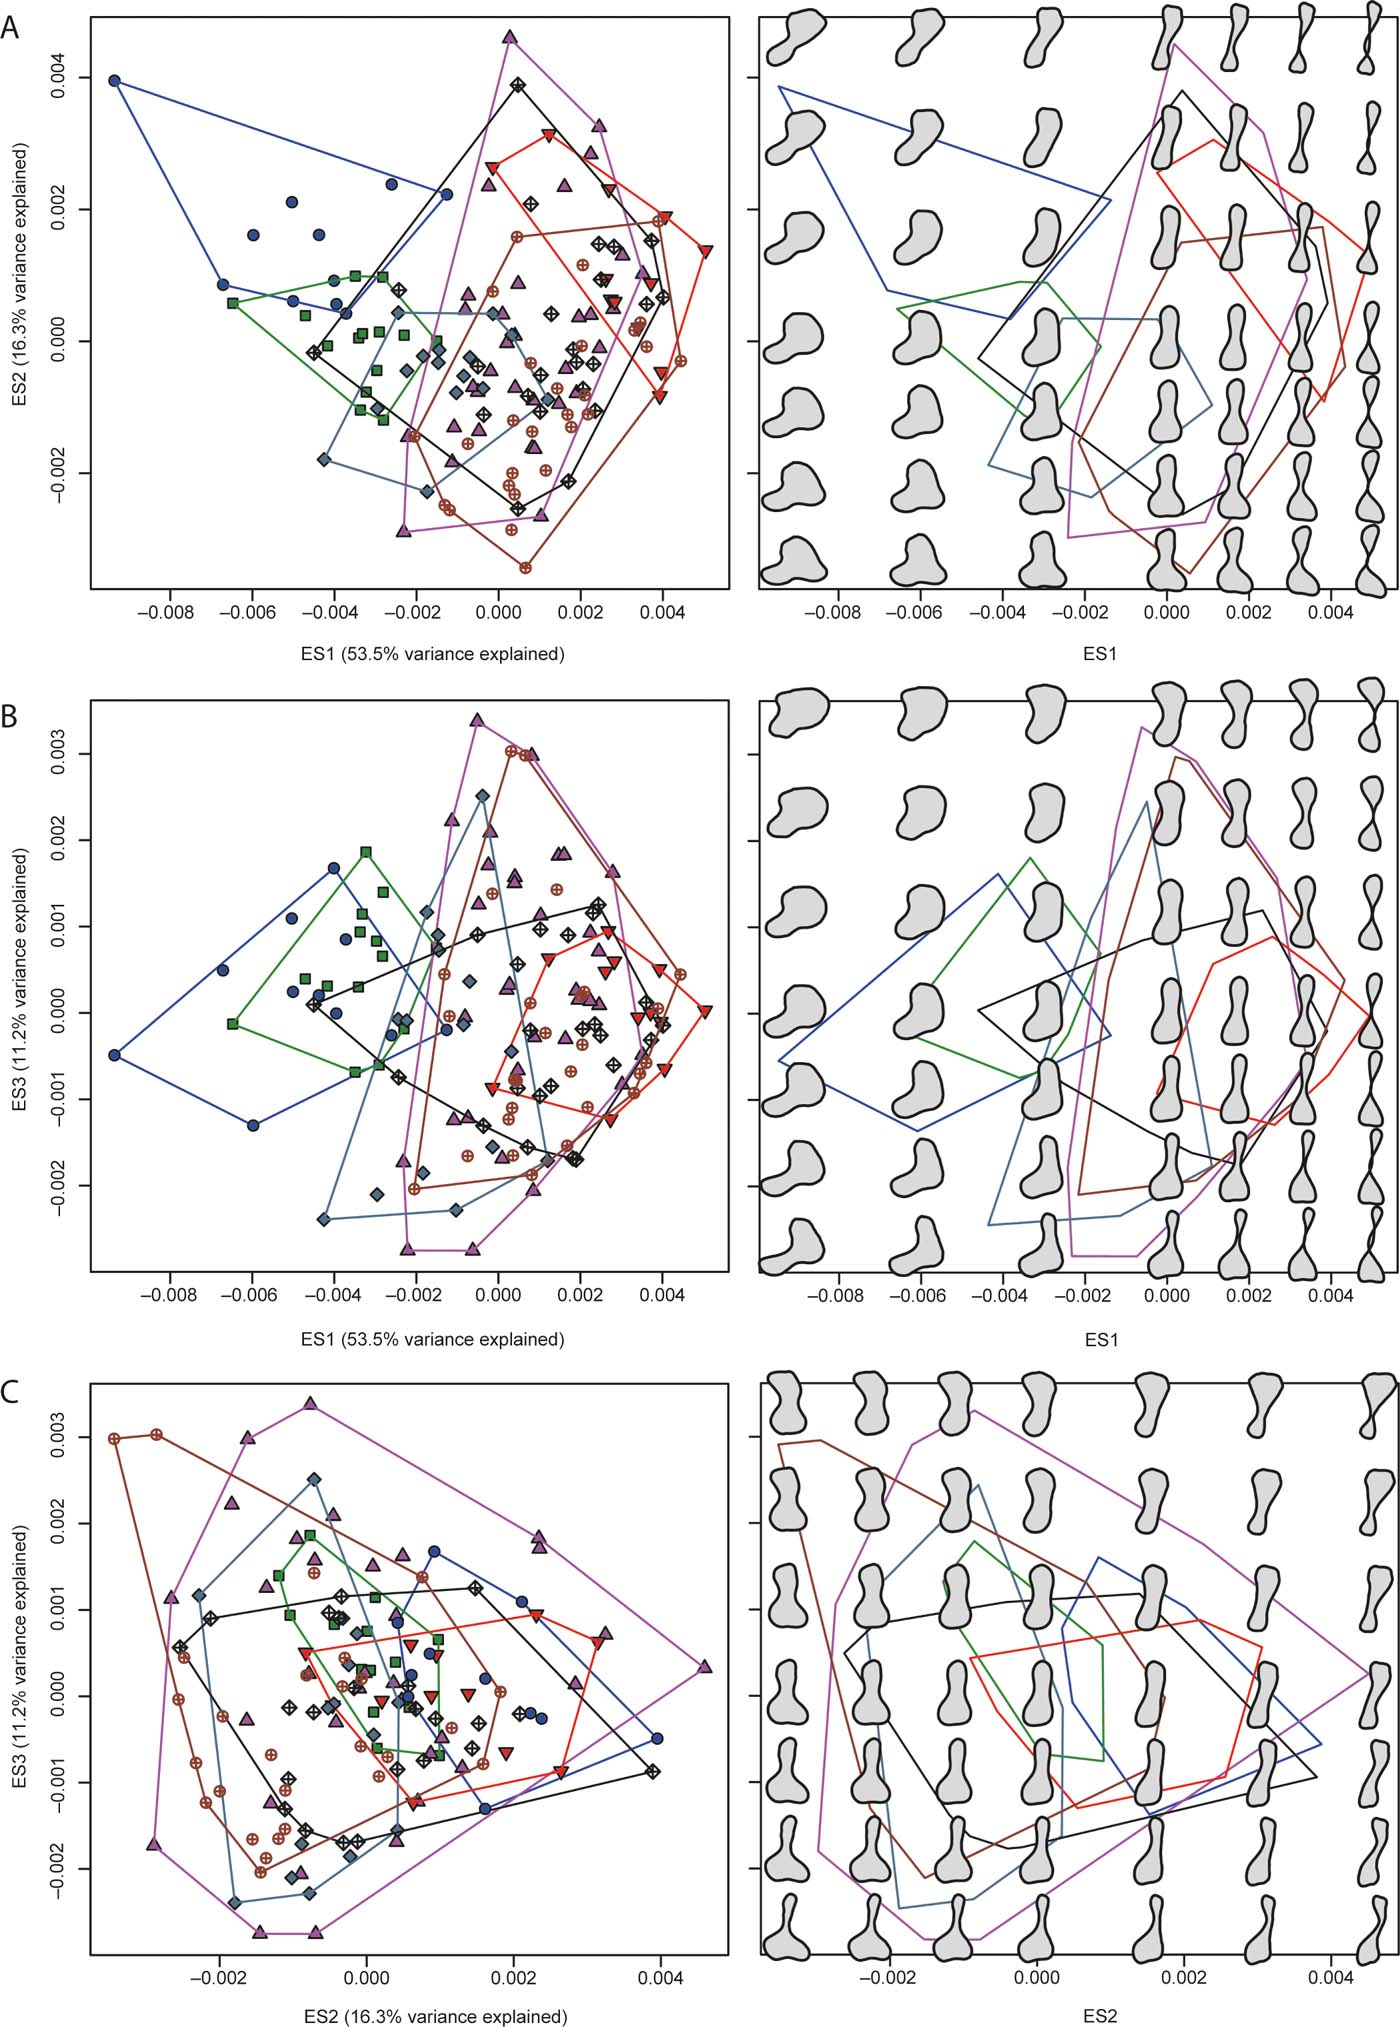
Global tests of group separation in morphospace using scores from all ES axes yielded significant results overall (P=0.0001) in both ANOSIM and PERMANOVA (supplementary Table 2). Most post hoc pairwise comparisons (out of 21) were significant in both of these analyses (respectively, 19 and 14 with uncorrected and Bonferroni-corrected P-values in the case of ANOSIM, and 20 and 18 with uncorrected and Bonferroni-corrected P-values in the case of PERMANOVA). Finally, eight out of 21 kernel density-based global two-sample comparison tests were significant, specifically: fish vs. each of the stem amphibian, crown amniote and lepospondyl groups; stem tetrapods vs. each of the stem amphibian, crown amphibian, crown amniote and lepospondyl groups; and stem amniotes vs. lepospondyls.
2.3. Disparity by group and through time
2.3.1. Disparity by group
In the case of the two sum indices and the pairwise dissimilarity, stem amphibians were more disparate than most other groups (fish showed marginally higher mean values than stem amphibians for the sum of variances and for the pairwise dissimilarity). With the un-rarefied sum indices (Fig. 3a–b), the only significant difference in disparity (based on non-overlapping confidence intervals; Foote Reference Foote1992) occurred between stem tetrapods and stem amphibians and (for the un-rarefied sum of ranges only) also between stem amphibians and crown amphibians, and between stem amphibians and stem amniotes. The rarefied mean values of the two sum indices (Fig. 3e–f) followed similar trends to the un-rarefied values, except that the confidence intervals overlapped, indicating no significant differences in disparity between groups. The mean pairwise dissimilarity values for stem tetrapods and crown amphibians were nearly identical (Fig. 3c), and significantly lower than those of stem amniotes, crown amniotes and lepospondyls. The confidence intervals for the latter three groups also overlapped. The mean pairwise dissimilarity values in fish and stem amphibians were comparable and significantly higher than those of all other groups. Neither the two sum indices (whether rarefied or un-rarefied) nor the pairwise dissimilarity values were significantly correlated with numbers of taxa, based on Spearman-rank correlation tests. The rhizodont tetrapodomorph Sauripterus taylori was chosen as the founder taxon, given its earliest diverging position relative to the tree root. Although Sauripterus appears as a highly autapomorphic taxon in terms of its humeral shape, it is used merely as a ‘reference' taxon (akin to an ‘outgroup' in cladistic analyses) for the purpose of establishing the relative amount of morphological differentiation accrued during the evolutionary history of later groups. The mean value of the distance from the founder (Fig. 3d) increased steadily from fish (other than Sauripterus), through to stem tetrapods, stem amphibians, and all remaining groups (i.e., crown amphibians, stem amniotes, crown amniotes, lepospondyls). These latter groups showed comparable average distances from Sauripterus.
Plots of mean values and associated 95% confidence intervals for the seven major groups described in the text, using three disparity indices (A–B, D–F) and one dispersion index (C): (A, E) unrarefied and rarefied sum of ranges; (B, F) unrarefied and rarefied sum of variances; (C) distance from founder; (D) mean pair-wise dissimilarity. Abbreviations: stem tetr./f = fin-bearing tetrapodomorphs (fish); stem tetr./l = limb-bearing tetrapodomorphs (stem tetrapods); amph. = amphibians; amni. = amniotes; lepos = lepospondyls.
2.3.2. Disparity through time
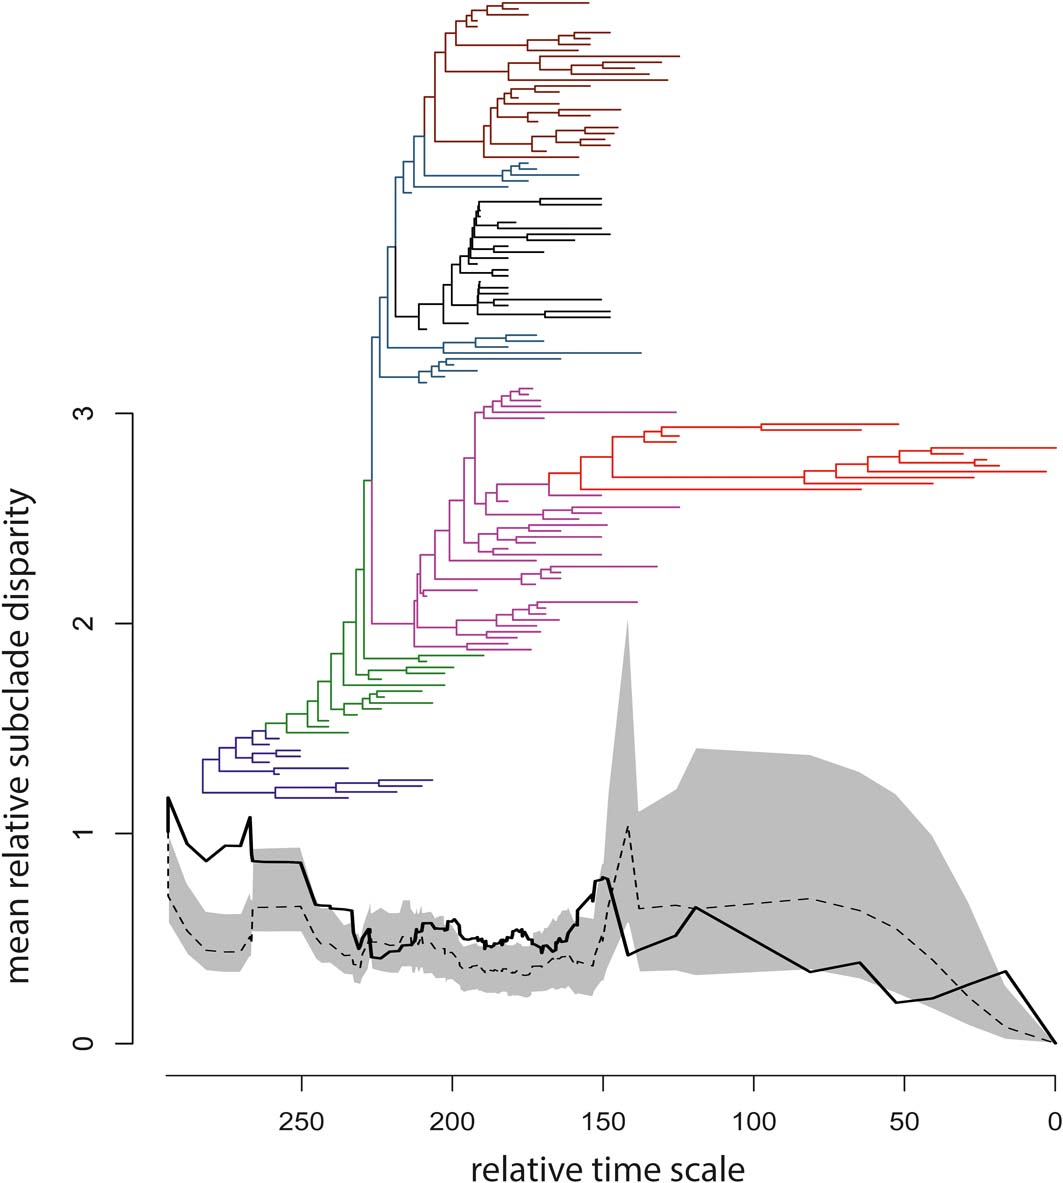
The observed DTT profile fell mostly within the 95% confidence envelope built around the null median DTT, but significant deviations occurred early in the phylogeny, among tetrapodomorph fish (at the base of the tree and up to the origin of limbed stem tetrapods), as well as during some short intervals thereafter (Fig. 4). The MDI index was 0.1967307, but the P-value (0.911) associated with this index implied no significant departure of the empirical DTT from the null model.
Time-calibrated supertree and plot of mean relative subclade disparity through time (DTT); the branches of the supertree are colour-coded according to the scheme in Figure 2; the vertical axis reports values of mean relative subclade disparity; the horizontal axis reports relative times for the temporal span of the supertree (i.e., the duration in millions of years from the youngest taxa at right to the tree root at left); to obtain absolute ages, the smallest first appearance datum in our taxon sample (Valdotriton gracilis: 126.1 million years ago) should be added to the relative times. In the DTT plot, the black solid line is the observed DTT based on the first 40 eigenaxes, the black dashed line is the median DTT value generated from 1000 random simulations of trait evolution, and the grey area is the 95% confidence envelope for the simulated median DTT.
2.4. Models of humeral shape evolution
In geiger, kappa, lambda and OU were retrieved as the best-fitting models for ES1, ES2 and ES3, respectively (supplementary Table 3), and interpreted as follows. Changes in ES1 scores approached punctuated equilibrium (kappa = 0.01561576), with considerably more stasis (i.e., little change) on longer branches. Changes in ES2 scores implied that phylogenetic relatedness was a major determinant of trait evolution (lambda=0.807608). Changes in ES3 scores were consistent with moderate stabilising selection (alpha=0.08235844). In all cases, the best-fitting models were significantly better than the second best-fitting models (lambda, kappa and lambda, respectively, for ES1, ES2 and ES3), based on likelihood-ratio tests.
However, some caveats apply to these interpretations. Thus, the kappa model tends to prevail when phylogenies are not complete or densely sampled, and also depends upon the widespread occurrence of short branches (Thomas & Freckleton Reference Thomas and Freckleton2012). The lambda model is best accounted for in terms of the ability of a phylogeny to predict trait covariance among taxa (Pagel Reference Pagel1999). Finally, stabilising selection is one of several possible interpretations for the prevalence of OU. It is equally possible, certainly given the low value of the alpha parameter for the OU model with ES3 scores, that white noise may account equally well for the distribution of trait values. Indirect evidence in support of this also comes from the low lambda value, implying that the phylogeny is not a good predictor of trait covariance among the taxa (Cooper et al. Reference Cooper, Thomas, Venditti, Meade and Freckleton2016; see https://lofrishkoff.wordpress.com/2016/12/15/the-abuse-of-ou-models/ for a detailed account of this phenomenon).
In motmot, lambda was the best-fitting model for the combined ES1–ES3 (lambda=0.7678373) and ES1–ES10 (lambda = 0.7604745) scores (in both cases, it was significantly better than the second best-fitting model, kappa), suggesting that tree topology was a strong predictor of trait covariance among taxa (supplementary Table 3).
2.5. Evolutionary rates and shifts
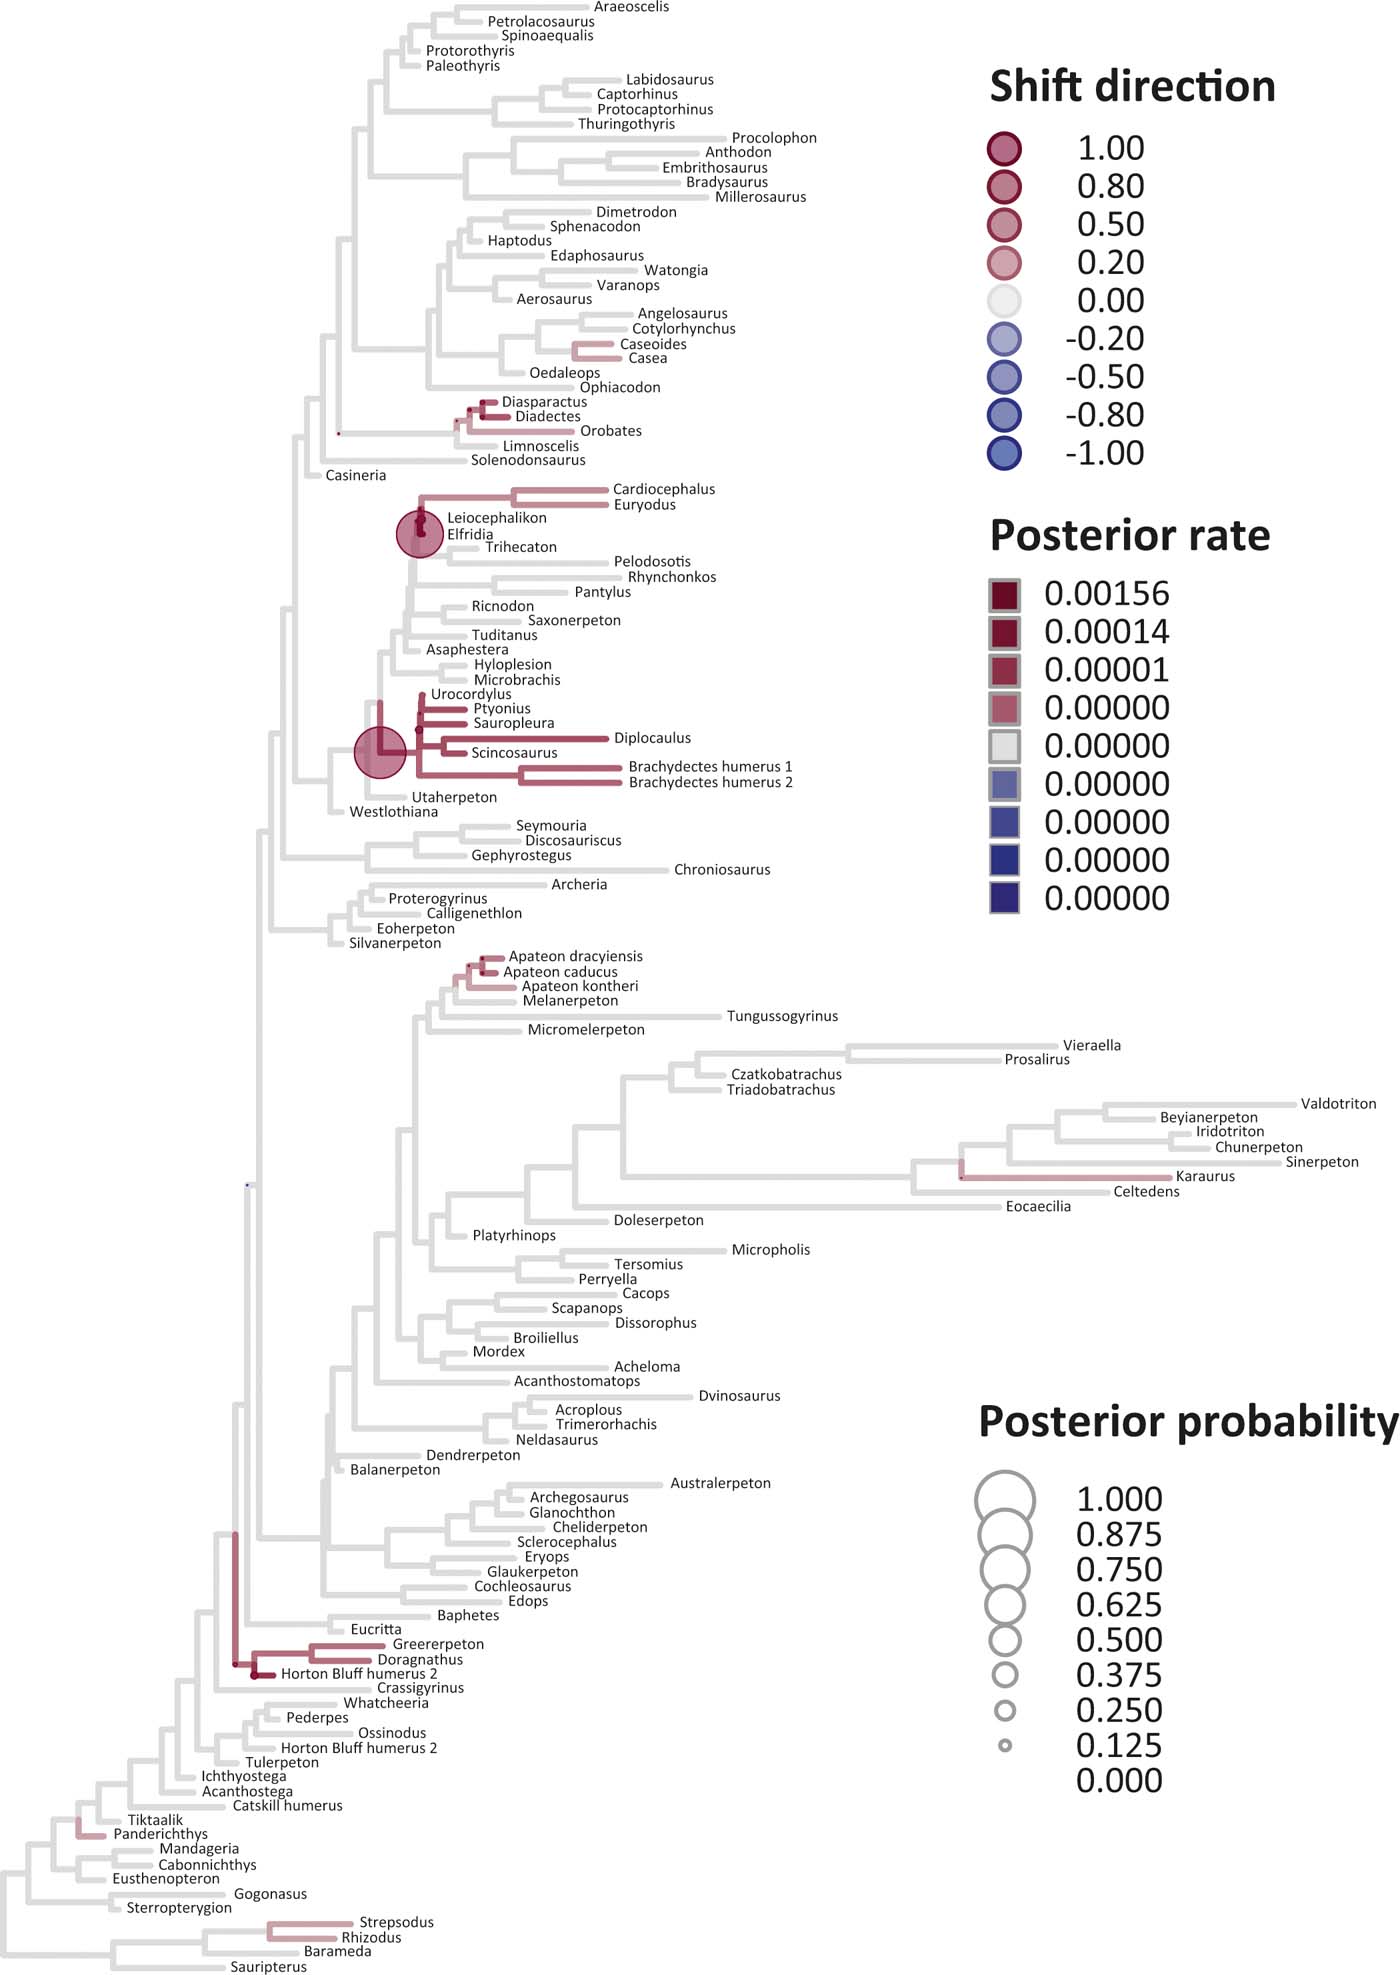
Six key points are evident in the results of rate analyses in auteur for each of the ES1–ES3 sets of scores (Figs 5–7; supplementary Table 3), which we summarise as follows. (1) Rate shifts (detected on 19, 8 and 32 branches, respectively, for ES1, ES2 and ES3 scores) were distributed unevenly on the tree, that is, they occurred on widely separated branches. (2) A small number of branches consistently revealed shifts when different sets of scores were used, and most of these characterised lepospondyls, stem amphibians and stem amniotes. (3) The vast majority of rate shift directions were positive (rate increases or ‘upturns'), with just one instance of a rate decrease (‘downturn') in the case of ES1 scores, at the basal node of the crown tetrapod clade, and four instances in the case of ES3 scores, among stem and crown amphibians. (4) Rate shift posterior probabilities were generally low, except along two branches in the case of ES1 scores and one branch in the case of ES2 scores, all of which concerned lepospondyls. (5) Most shifts were located within, rather than between, major groups. The only major between-group shift detected by auteur was the downturn for ES1 scores on the branch subtending crown-group tetrapods (taxa from Edops to Araeoscelis), but this shift had a low posterior probability of 0.0169. (6) No shifts were temporally concurrent with major ecological transitions (e.g., water-land) or with the origin of morphological novelties (e.g., digits).
Time-calibrated supertree showing posterior Bayesian probabilities of evolutionary shifts and branch-specific rates, based upon scores on eigenaxis ES1; the grey branches are those showing background rates; the red (respectively, blue) branches are those in which rates are higher (respectively, lower) than the background rates; the darker the red tone (respectively, blue tone) of a branch, the higher (respectively, lower) the rate value on that branch relative to the background rates; the circles indicate the location of shifts; the larger the size of a circle, the higher the posterior probability of a shift; the darker the red tone (respectively, blue tone) of a circle, the higher the rate upturn (respectively, downturn), i.e., the higher the shift towards an increase (respectively, decrease) relative to adjacent branches.
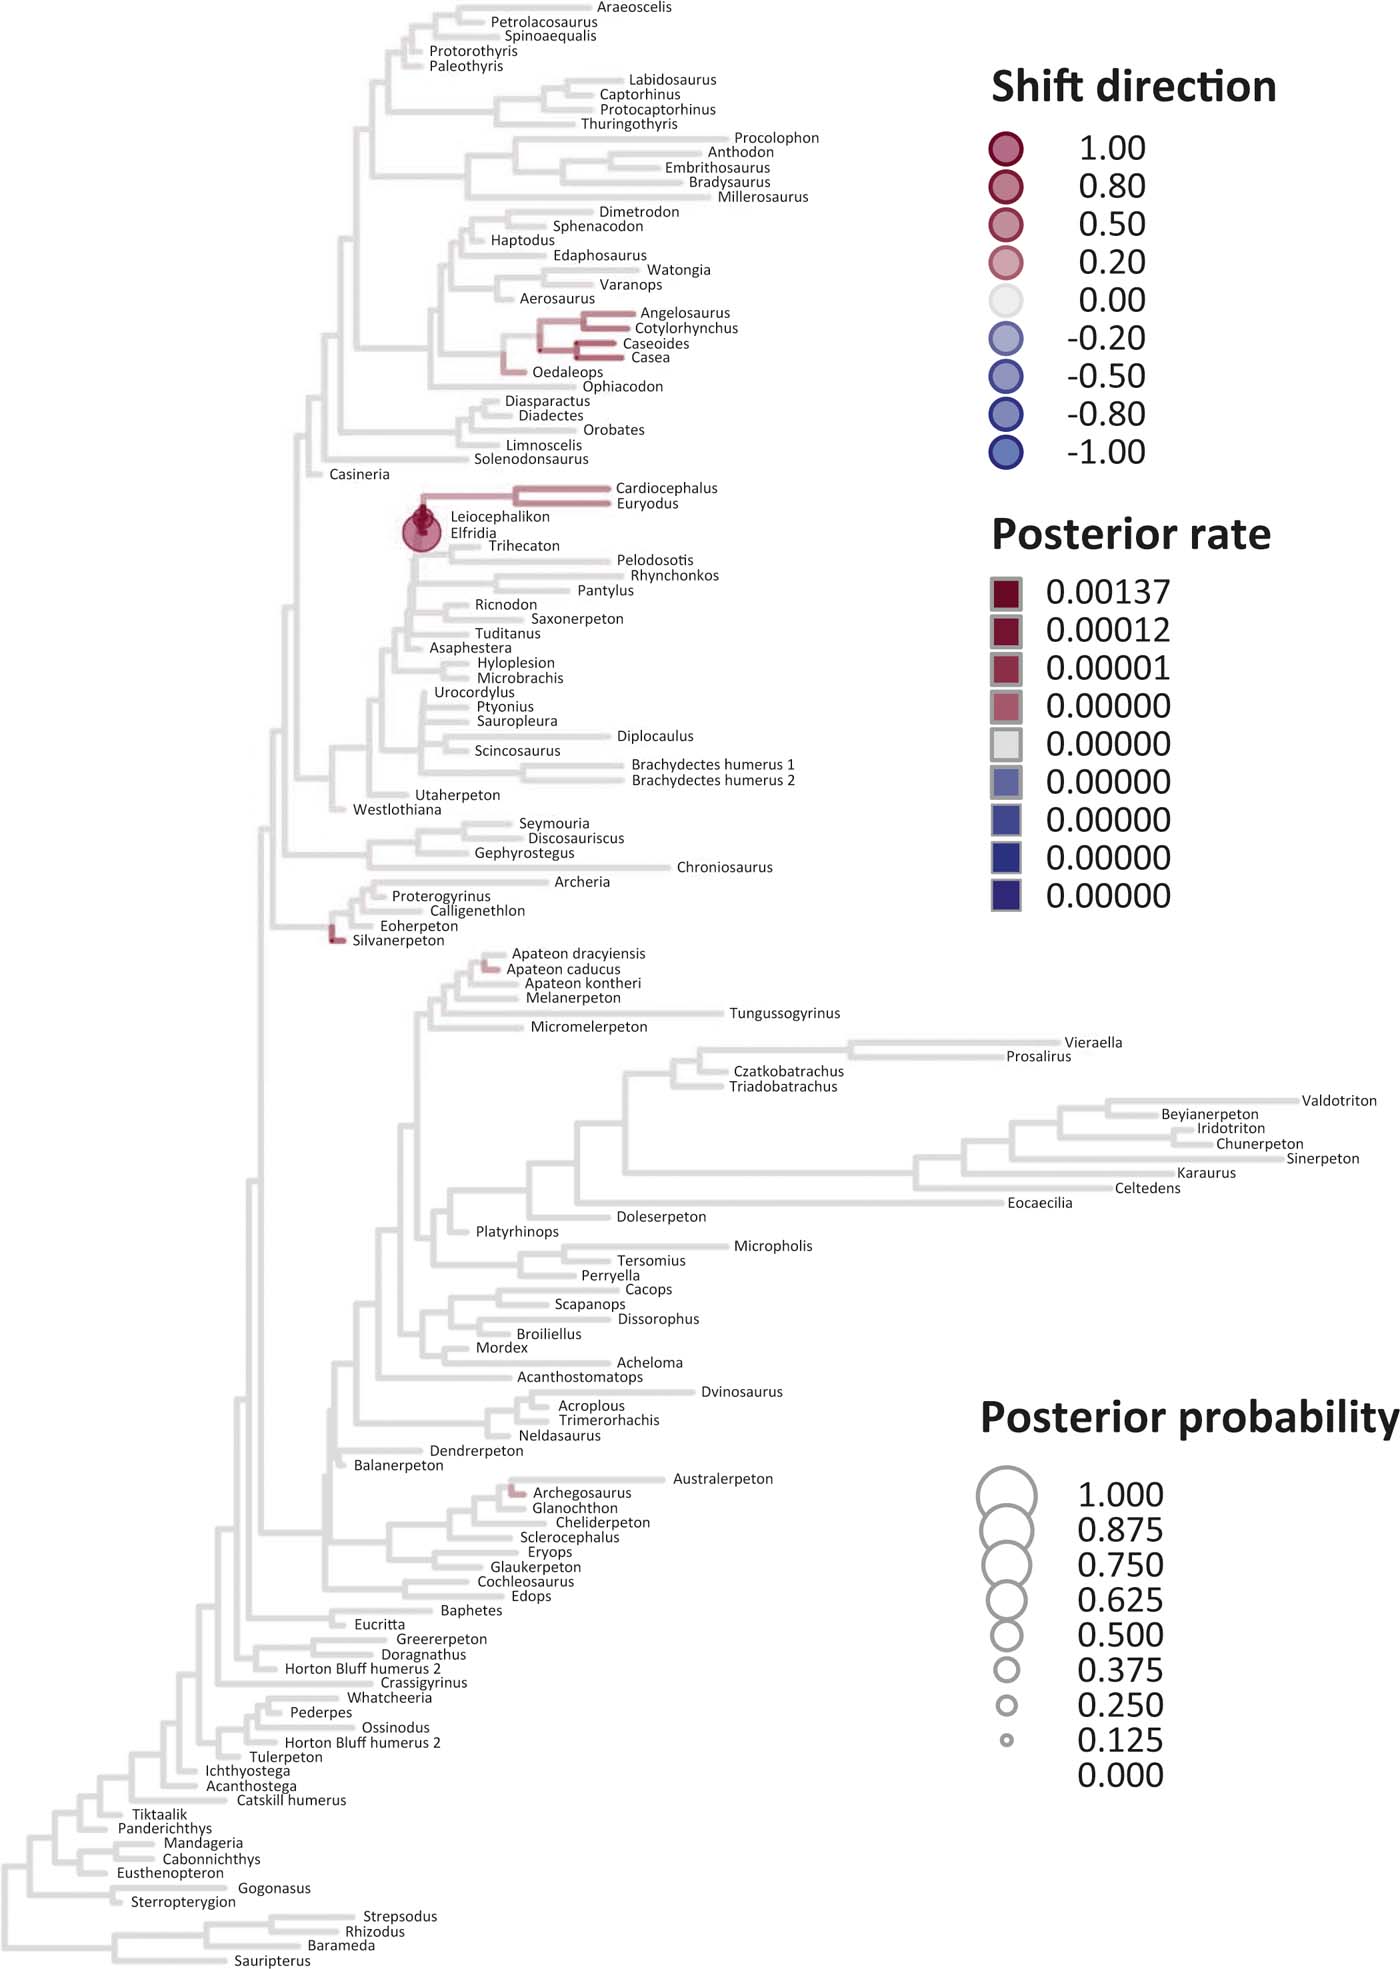
Time-calibrated supertree showing posterior Bayesian probabilities of evolutionary shifts and branch-specific rates, based upon scores on eigenaxis ES2; for explanations of colours and symbols, see caption of Figure 5.
Time-calibrated supertree showing posterior Bayesian probabilities of evolutionary shifts and branch-specific rates, based upon scores on the eigenaxis ES3; for explanations of colours and symbols, see caption of Figure 5.
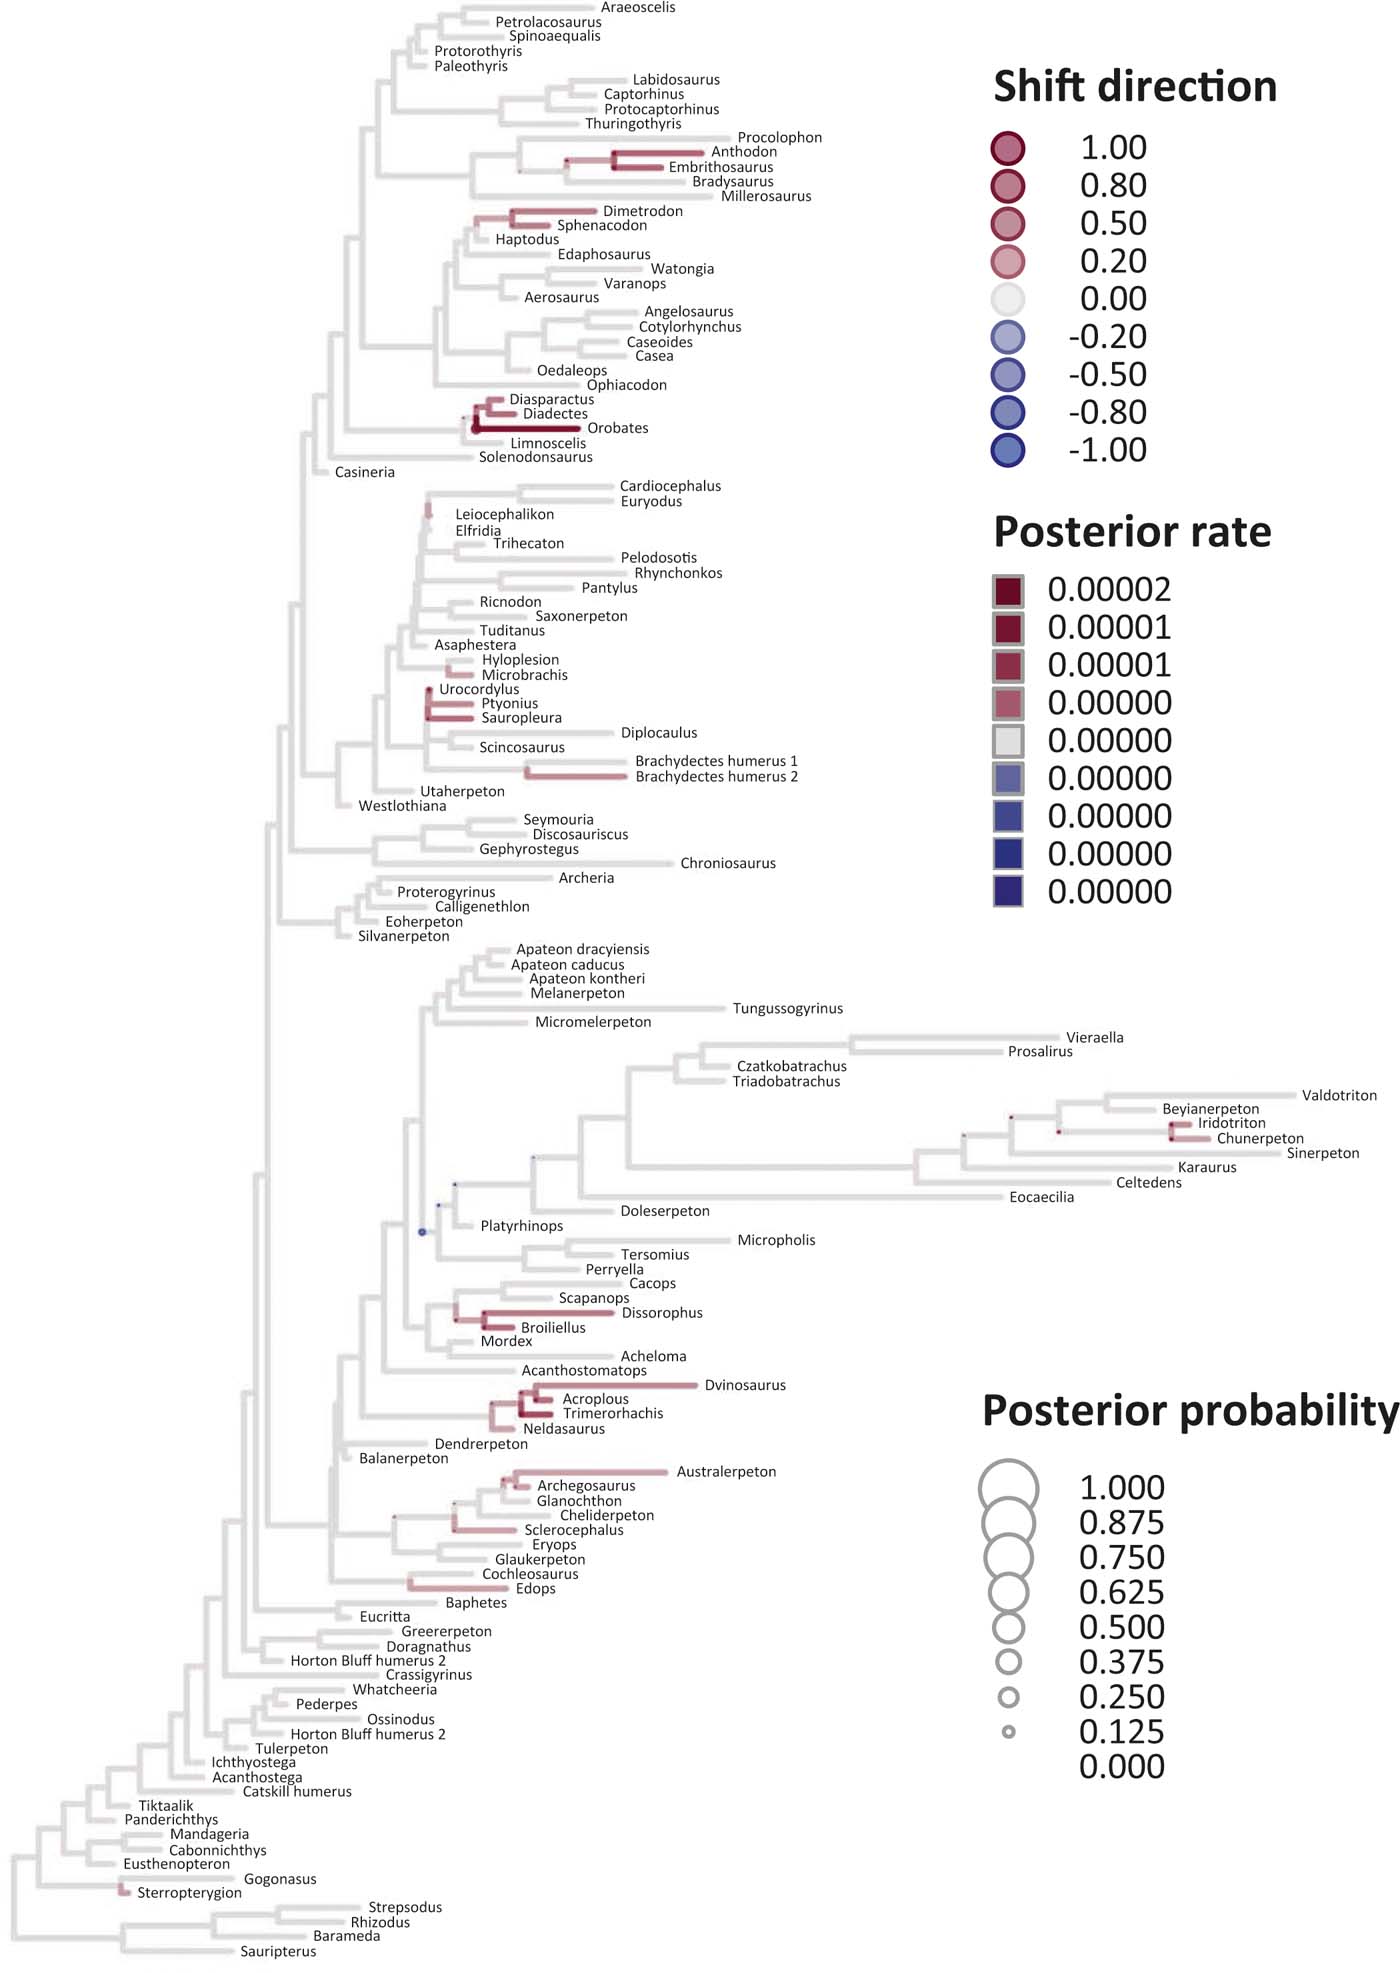
The rate shift posterior probabilities ranged from 0.8593 (branch subtending lepospondyl taxa from Brachydectes to Urocordylus) to 0.0129 (branch leading to the stem salamander Karaurus) for ES1 scores, from 0.62562513 (branch leading to the lepospondyl Elfridia) to 0.0175035 (branch subtending lepospondyl taxa from Leiocephalikon to Cardiocephalus) for ES2 scores, and from 0.15808824 (branch leading to the stem amniote Orobates) to 0.01004902 (branch subtending parareptile taxa from Bradysaurus to Anthodon) for ES3 scores.
As regards differences in the probability density distributions of rates between groups, we considered the following pairwise comparisons: (1) fish plus stem tetrapods vs. crown tetrapods; (2) stem tetrapods vs. crown tetrapods; (3) total-group amphibians vs. total-group amniotes; (4) stem amphibians vs. crown amphibians; (5) stem amniotes vs. crown amniotes plus lepospondyls; (6) stem amniotes vs. crown amniotes excluding lepospondyls; (7) temnospondyls vs. lepospondyls. Although several other comparisons are possible, we emphasised those that bracket key transitions (notably, stem to crown). Some comparisons were designed to evaluate the influence of inclusion/exclusion of specific groups (fish; lepospondyls). Significant differences were only retrieved with ES1 scores in three instances: total-group amphibians vs. total-group amniotes (P=0.0104); stem vs. crown amniotes (P = 0.0026); temnospondyls vs. lepospondyls (P=0.0016) (supplementary Table 3).
motmot identified two, three and four shifts, respectively, with ES1, ES2 and ES3 scores, four shifts with the combined ES1–ES3 scores and five shifts with the combined ES1–ES10 scores (supplementary Table 3; supplementary Figs 3–7). Two branches experienced shifts with three different sets of scores (ES2; ES1–ES3; ES1–ES10), and seven branches experienced shifts with both motmot and auteur, though not necessarily with the same set of scores (supplementary Table 3). With ES1 scores (supplementary Fig. 3), the smallest and largest ML rate values occurred, respectively, on the branch subtending temnospondyl taxa from Neldasaurus to Dvinosaurus (0.0253) and on the branch subtending all lepospondyls (6.417; taxa from Westlothiana to Cardiocephalus). With ES2 (supplementary Fig. 4), ES1–ES3 (supplementary Fig. 6) and ES1–ES10 scores (supplementary Fig. 7), the minimum (0.007; 0.095; 0.199) and maximum (29.313; 46.253; 21.378) values occurred, respectively, on the branch subtending lepospondyl taxa from Leiocephalikon to Cardiocephalus and on the branch subtending lepospondyl taxa from Elfridia to Cardiocephalus. With ES3 scores (supplementary Fig. 5), the minimum and maximum values occurred, respectively, on the branch subtending temnospondyl taxa from Perryella to Micropholis (0.004) and on the branch subtending all crown tetrapods (3.224. taxa from Edops to Araeoscelis).
2.6. Size–shape relationships
Figure 8 shows the results of the PGLS analyses (details in supplementary Table 3). Only in the case of ES2 scores is the size–shape relationship significant (P=0.008855), but the correlation between these variables is very weak (adjusted R 2=0.04326), suggesting that only a little over 4% of the variation in ES2 score values is explained by size. The slope estimate is slightly negative (-0.00031848), indicating that larger humeri tend to show a slightly more developed supinator process, a slightly shorter and wider shaft, a broader distal humeral extremity, a more pronounced entepicondylar flange and more concave anterior and posterior shaft margins.
Phylogenetically controlled regressions of shape vs. size; for each analysis, the four panels on the left report diagnostic tests of the PGLS model fits; such tests include the probability density distribution of the residual values from the regression (top left panel), a Q–Q plot of normalised residuals (i.e., theoretical vs. sample quantiles) (top right panel), a plot of fitted vs. residual values (bottom left panel), and a plot of fitted vs. observed values (bottom right panel); the panels on the right show bivariate scatterplots of size vs. ES1 (A), ES2 (B), and ES3 (C) scores. See Section 2.1 of the main text for a description of the main changes in humeral outlines along the first three eigenaxes.
3. Discussion
Our findings are broadly consilient with those of a more restricted recent study (Ruta & Wills Reference Ruta and Wills2016) that quantified morphospace occupation and disparity changes at the fish–tetrapod transition. The present analyses differ from this previous study in using a larger and more diverse taxonomic sample, morphometric data (digitised outlines rather than discrete cladistic characters), a wider variety of analytical/statistical protocols and a different model system (the humerus rather than the entire appendicular skeleton). Despite these considerable differences, however, both studies demonstrated that fish attained morphological variation comparable to or greater than that attained by early tetrapods (see supplementary Figs 8–10 for labelled versions of the two-dimensional morphospace plots). Importantly, the plurality of data and methods demonstrates that these conclusions are not contingent upon the use of particular approaches to quantifying the macroevolutionary dynamics of appendicular skeletal transitions.
Three major patterns of humeral shape disparity emerged from our study. (1) The disparity of fish humeri exceeds that of most other groups, consistent with a model of sustained morphological innovation in the deepest portions of the tetrapod stem-group. (2) The region of morphospace occupied by fish is distinct from that occupied by other groups, suggesting early partitioning of phenotypic diversity across the fish-tetrapod transition, at a time when basal tetrapods were still fully aquatic. (3) Fish are more dispersed in morphospace than all other groups (i.e., on average they are located farther from their centroid), apparently indicating greater shape divergence than in other groups.
These patterns can only be interpreted biologically in the light of the available taxonomic sampling. In particular, the high dispersal of fish around their centroid is partly a function of the position of the rhizodont Sauripterus, but may also reflect uneven taxon sampling from among tetrapodomorph fish (see also comments in Ruta & Wills Reference Ruta and Wills2016). However, patterns (1) and (2) should be less sensitive to sampling biases. In regard to pattern (1) (the high disparity of fish humeri), the addition of more fish data could only result in partial filling of empty regions of the morphospace and/or the denser occupation of others (Ciampaglio et al. Reference Ciampaglio, Kemp and McShea2001). Neither of these outcomes could cause a decrease in the extent of morphospace occupation (range-based indices), although they could result in smaller variance-based indices. As for pattern (2) (the morphological separation between fishes and tetrapods), our data include both basal (e.g., rhizodonts) and derived (e.g., elpistostegalians) tetrapodomorph fish. Therefore, we can exclude the possibility that this separation is a sampling artefact, such as might occur if plesiomorphic fish groups were overrepresented and/or fish-tetrapod intermediates were excluded altogether from our taxon sample (see also Ruta & Wills Reference Ruta and Wills2016).
With the transition to land, the limbs had to support the body in addition to effecting propulsion along the substrate. Therefore, changes observed in the humeri of semi-aquatic and terrestrial taxa likely reflected biomechanical constraints associated with various degrees of, and solutions to, terrestrialisation. Conversely, the variety of humeral builds in tetrapodomorph fish likely reflected different adaptations for stability, speed, and manoeuvrability in the aquatic medium (e.g., propulsion in shallow waters or along mud banks). Tests of functional hypotheses in the light of bioengineering principles (Hohn-Schulte et al. Reference Hohn-Schulte, Preuschoft, Witzel and Distler-Hoffmann2013), combined with anatomical and physiological analyses of extant lobe-finned fish (King et al. Reference King, Shubin, Coates and Hale2011; Miyake et al. Reference Miyake, Kumamoto, Iwata, Sato, Okabe, Koie, Kumai, Fujii, Matsuzaki, Nakamura, Yamauchi, Yoshida, Yoshimura, Komoda, Uyeno and Abe2016) and studies of new model organisms (e.g., Dickson & Pierce Reference Dickson and Pierce2019), offer promising research avenues, although work in these areas is still in its infancy.
Aside from structural and functional determinants of phenotypic variety, a third factor, namely developmental plasticity – ‘a single genotype's ability to alter its developmental processes and phenotypic outcomes in response to different environmental conditions' (Moczek et al. Reference Moczek, Sultan, Foster, Ledón-Rettig, Dworkin, Nijhout, Abouheif and Pfennig2011, p. 2705) – may have shaped humeral diversity across the fish-tetrapod transition. A recent study (Standen et al. Reference Standen, Du and Larsson2014) examined differences in the shape of the pectoral girdle and locomotory behaviour among control and treatment individuals of the extant freshwater ray-finned fish Polypterus (bichir), which is capable of both swimming and terrestrial locomotion with its pectoral fins. Land-raised treatment individuals responded to the stress induced by the terrestrial medium by dramatically modifying the shape and proportions of their pectoral girdle, altering their body posture, and changing the orientation and movements of their pectoral fins. Crucially, skeletal re-modelling in land-raised Polypterus mirrored in part the sequence of changes in fossil taxa bracketing the fish–tetrapod transition. Phenotypic plasticity has been shown to be a key driver in the evolution of fish swimming (Oufiero & Whitlow Reference Oufiero and Whitlow2016), and it is tempting to speculate that it also had an impact on the evolution of the appendicular skeleton in the fish-like ancestors of tetrapods. For example, it has been proposed as a possible mechanism to explain the morphological variety of the earliest Carboniferous tetrapods (Clack et al. Reference Clack, Bennett, Carpenter, Davies, Fraser, Kearsey, Marshall, Millward, Otoo, Reeves, Ross, Ruta, Smithson and Smithson2016). However, while this plasticity could in theory be detected (and interpreted) using a morphometric approach such as the one employed here, sampling issues prevent us from addressing the potential role of phenotypic plasticity in shaping humeral evolution. There would also be difficulty in interpreting the meaning of high variation in an individual species even if sampling allowed it. For instance, one would not be able to conclude whether plasticity related to different functions or whether it reflected a high level of functionally unrelated variability.
The results from auteur allow us to reject one of our initial hypotheses, specifically that the separation between major groups was underpinned by significant evolutionary rate shifts. Instead, the distribution of shifts demonstrates localised episodes of shape diversification (e.g., at the level of subclades within major groups), but no evidence of significant rate increases or decreases either on the branches subtending those groups or across key ecomorphological transitions. The results from motmot for each of the ES1–ES3 axes concur with those from auteur, in that most recorded shifts occur in subclades within major groups. Taken together, the rate results are consistent with a model where niche partitioning acted as a driver of appendicular skeletal differentiation among clades and grades of early tetrapods following the emergence of structural, functional and/or ecological innovations in deeper parts of the tetrapod tree. As an analogy for this model, a recent study by Brocklehurst et al. (Reference Brocklehurst, Ruta, Müller and Fröbisch2015) posited that episodes of exceptional lineage diversification in early amniotes were linked to large-scale extinction events rather than being triggered by evolutionary innovations (such as herbivory and aquatic habits). According to Brocklehurst et al. (Reference Brocklehurst, Ruta, Müller and Fröbisch2015), novelties ensured selective post-extinction survival of groups that possessed such innovations and which were capable of radiating extensively in the aftermath of major extinctions.
The DTT results suggest that the evolution of the tetrapod humerus followed a model of rapid early diffusion in morphospace. This is certainly true for the first half of the sampled tetrapod history, where the empirical DTT curve is largely above the median curve generated via BM simulations and shows occasional excursions outside the 95% confidence envelope. This pattern indicates higher variation within subclades than expected from BM (i.e., the subclades occupy large proportions of the overall morphospace and tend to overlap). However, a shift in the position of the DTT curve relative to the median value of the simulated BM curves occurs at the mid-point of the tree temporal span. This indicates that variation is more strongly partitioned among subclades in the second half of tetrapod history, such that the subclades occupy small, non-overlapping regions of morphospace. This shift coincides approximately with the estimated time of origin for crown batrachians (frogs and salamanders), but it is also likely to reflect sparse taxon sampling (the inclusion of few and highly divergent groups) in the apical part of the tree (see Methods).
4. Conclusions
1. The humerus has been regarded as a functionally and adaptively pivotal skeletal element in the evolution of tetrapods from fishes, and particularly in the transition of tetrapods from the water to the land. Along with other elements of the limbs and girdles, humeri have provided rich seams of structural and functional data that have been used for phylogenetic inference and biomechanical reconstruction. However, much work is still required to make sense of the extraordinary morphological variety of this element, and especially in response to ecological differentiation within major tetrapod groups.
2. Coordinate point eigenshape analyses of the two-dimensional outlines of early tetrapod and tetrapodomorph fish humeri in extensor view captured both overall and subtle patterns of shape variation, with aspects of morphological differentiation along the eigenshape axes that were amenable to interpretation in terms of humeral proportion and shape.
3. The results from our analyses of humeral shape variation across the fish–tetrapod transition were consilient with our findings from a previous study of disparity for the entire appendicular skeleton in a smaller sample of species than that employed here, and using a discrete character data matrix (Ruta & Wills Reference Ruta and Wills2016). Specifically, both analyses revealed a discontinuity of morphospace occupation between the earliest tetrapods and their nearest non-tetrapod outgroups within tetrapodomorph fishes. Thus, the plurality of methods and approaches in these different studies tends to support the biological reality of observed patterns, indicating that they are not contingent upon the particular structures investigated, the taxon sample, or the manner in which shape variation is quantified.
4. Our study revealed a surprising disparity of humeral morphologies across tetrapodomorph fishes. This variation probably reflected a diversity of ecologies and biomechanical requirements. In tetrapods, by contrast, the biomechanical requirements for terrestrial locomotion may have been more constrained. Indeed, several disparity indices revealed that the fishes in our sample attained or exceeded the levels of disparity represented by various tetrapod groups.
5. We find no evidence for significant changes in the rate of morphological evolution across major ecomorphological transitions, and major rate changes do not attend the origins of major clades. Rather, key shifts in the rates of morphological evolution are localised within subclades, and widely distributed throughout the phylogeny.
6. The evolution of the tetrapod humerus appears to have followed two distinct trajectories, with subclades initially overlapping extensively throughout the morphospace. This overlap was reduced at a later stage in tetrapod evolution, with subclades eventually occupying more restricted regions of morphospace, a pattern that appears consistent with niche partitioning.
5. Acknowledgements
We are indebted to researchers and collection managers in the following institutions for access to specimens in their care: The Natural History Museum, London, UK; University Museum of Zoology, Cambridge, UK; National Museums Scotland, Edinburgh, UK; Museum für Naturkunde, Berlin, Germany; Naturhistorisches Museum, Vienna, Austria; Cleveland Museum of Natural History, Cleveland, Ohio, USA; Field Museum of Natural History, Chicago, Illinois, USA; Museum of Comparative Zoology, Harvard University, Cambridge, Massachusetts, USA; University of Kansas Museum of Natural History, Lawrence, Kansas, USA. We thank Stig Walsh (Chief Editor), Tim Smithson (Handling Editor), and Vicki Hammond and Susie Bloor (Journals and Archive Officers, Royal Society of Edinburgh) for their editorial efforts which made this special issue possible, and two anonymous referees for their constructive comments.
6. Dedication
We dedicate this paper to Jenny Clack in recognition of her transformative contributions to vertebrate palaeontology, and to mark her retirement from University of Cambridge. Jenny's work spans well over three decades, and has radically changed our understanding of the anatomy, function, and evolution of early tetrapods and their relatives. However, her interests extend beyond early tetrapods, and include biomechanics, palaeoecology, palaeoneurology, sedimentology, and biostratigraphy, among others. Jenny has guided and mentored numerous students throughout her career, several of whom have become international figures in various areas of evolutionary biology.
From Kenneth Angielczyk – ‘Thank you, Jenny, for always welcoming me on my visits to use the therapisd collection in Cambridge, and for helping me to access Rex Parrington's Tanzania field notes.'
From Marcello Ruta – ‘I was first introduced to Jenny Clack by Richard Jefferies (my former PhD supervisor at the London Natural History Museum) in 1996. However, it was not until 1999 that I came to know Jenny better. In the chronology of my career development, Jenny was the fourth member of the Panchen School with whom I have had the privilege to interact, after Andrew Milner, Angela Milner, and Mike Coates. Jenny's professionalism and work ethics have a galvanising effect. I learned this while staring for hours at the mode of preservation of East Kirkton tetrapods, trying to make sense of their intricate morphology – challenging at first, then increasingly revealing under Jenny's reassuring smile and good-humoured attitude: ‘Well, we don't have to put a label on each bone; a question mark will do if we are in doubt'. Jenny has supported me in countless ways throughout my career. I am honoured to be able to express my gratitude to her with the present paper, and I look forward to many fruitful collaborations.'
From the authors – The legacy of Jenny's work is boundless and her achievements continue to inspire both young and more experienced investigators worldwide. We predict that her research will reveal further exciting and paradigm-shifting aspects of tetrapod evolution.
7. Supplementary material
Supplementary material is available online at https://doi.org/10.1017/S1755691018000749.


