


1. Introduction
When attached cavitation is formed along a smooth body, cavity detachment is typically associated with laminar boundary layer separation (Arakeri Reference Arakeri1975). This process implies the presence of an adverse pressure gradient upstream of the separation point, such that, in the case of natural vapour cavities, the fluid upstream of the cavity leading edge is in a state of meta-stable tension (Tassin Leger & Ceccio Reference Tassin Leger and Ceccio1998). Should free stream nuclei be available, travelling bubble cavitation does indeed occur well upstream of the cavity leading edge on various geometries, including headforms (Arakeri & Acosta Reference Arakeri and Acosta1973), hydrofoils (Li & Ceccio Reference Li and Ceccio1996) and spheres (Brandner et al. Reference Brandner, Walker, Niekamp and Anderson2010). Recent measurements on a three-dimensional (3-D) stainless-steel hydrofoil have revealed the presence of microbubbles in a narrow, low-momentum region directly ahead of the cavity leading edge (Giosio et al. Reference Giosio, Russell, Pearce and Brandner2016; Russell & Brandner Reference Russell and Brandner2021).
The presence of such microbubbles in the separated laminar boundary layer was first noted by Parkin & Kermeen (Reference Parkin and Kermeen1953) and later supported by the observations of Arakeri & Acosta (Reference Arakeri and Acosta1973). However, the role of these nuclei in the reformation of cavitation has received limited attention, with prior studies focusing instead on the Reynolds number dependence of cavity detachment (Arakeri & Acosta Reference Arakeri and Acosta1973). Building on the preliminary work of Giosio et al. (Reference Giosio, Russell, Pearce and Brandner2016), who suggested these nuclei may contribute to inception, we revisit this phenomenon and demonstrate a related, but previously unarticulated feature of the pressure field: between the leading edge of the cavity and the region of tension upstream, the fluid in the low-momentum region must be at pressures above vapour pressure. This shielding effect creates a zone where nuclei are isolated from pressure minima and may persist over several shedding cycles. The dynamics of this region is central to the mechanism of cavity re-nucleation, particularly in the absence of active free stream or surface nuclei.
Ram, Agarwal & Katz (Reference Ram, Agarwal and Katz2020) demonstrated that, near desinence or just after inception, boundary layer thickening and separation on curved surfaces can sustain cavitation in a way that is largely independent of free stream nuclei. Using a combination of single-phase particle image velocimetry and high-speed imaging, they showed that once cavitation is initiated via travelling bubbles, microbubbles generated from cavity collapse may be transported upstream by recirculation within the separated region, or indeed by pressure gradients for marginally attached flow. They showed that this offers a mechanism by which cavitation may become self-sustaining, with new cavities seeded by the remnants of prior cavity collapse.
In the present study, we extend this concept to more energetic and globally unstable regimes – specifically, periodic shedding of large-scale sheet cavitation on a hydrofoil (Ganesh, Mäkiharju & Ceccio Reference Ganesh, Mäkiharju and Ceccio2016; Venning, Pearce & Brandner Reference Venning, Pearce and Brandner2022). We show that microbubble nuclei, formed during the violent collapse of the sheet cavity and driven by condensation shock waves, can act as intrinsic sources of re-nucleation. These nuclei, sequestered within the separated region and shielded from immediate activation, enable cavity renewal even in the absence of free stream or surface-bound nucleation sites.
We further investigate how this process varies with Reynolds number. At higher Reynolds numbers, these large-scale, approximately two-dimensional (2-D) cavities undergo cyclical shedding that modulates the boundary layer and the surrounding flow field. For microbubbles trapped within the low-momentum fluid, the unsteady motion of the cavity leading edge acts similarly to wall and free stream oscillations, producing significant temporal and spatial variations in the pressure field (Moore Reference Moore1958; Sears & Telionis Reference Sears and Telionis1975). Regardless of Reynolds number, the unsteady flow creates specific spatiotemporal windows within the shedding cycle where re-nucleation is possible, with nuclei exposed to low pressure only during the moments that follow cavity collapse. In some instances, this allows microbubbles to remain ahead of the cavity for multiple shedding cycles.
Finally, we present observations of a rare but disruptive phenomenon where the collapse of shed clouds of cavitation can generate pressure waves of sufficient magnitude to activate trapped nuclei mid-way through the typical shedding cycle. These events can alter or even interrupt the regular shedding cycle, further highlighting the complex interplay between the collapse dynamics, the unsteady evolution of the pressure field and microbubble behaviour.
2. Experimental methods
Cavitation about an acrylic model with a NACA 16-029 profile and a chord of $c=150\,$
mm was captured using a combination of high-speed back-lit shadowgraphy and stroboscopic still photography. The experiments were performed in the variable-pressure water tunnel at the University of Tasmania (Brandner, Venning & Pearce Reference Brandner, Venning and Pearce2022). The hydrofoil was mounted to the ceiling of the test section, in the centre of its
$c=150\,$
mm was captured using a combination of high-speed back-lit shadowgraphy and stroboscopic still photography. The experiments were performed in the variable-pressure water tunnel at the University of Tasmania (Brandner, Venning & Pearce Reference Brandner, Venning and Pearce2022). The hydrofoil was mounted to the ceiling of the test section, in the centre of its $0.6\,\textrm {m} \times 0.6\,\textrm {m} \times 2.6\,\textrm {m}$
long length. Two rods run through the interior of the model and are tensioned to ensure that the acrylic remained in compression. These rods terminate inside a stainless steel end cap with a matched profile. The end cap was rounded to suppress cavitation on the tip. The total parallel span of the model was
$0.6\,\textrm {m} \times 0.6\,\textrm {m} \times 2.6\,\textrm {m}$
long length. Two rods run through the interior of the model and are tensioned to ensure that the acrylic remained in compression. These rods terminate inside a stainless steel end cap with a matched profile. The end cap was rounded to suppress cavitation on the tip. The total parallel span of the model was $s=300\,$
mm, of which
$s=300\,$
mm, of which $290\,$
mm was acrylic.
$290\,$
mm was acrylic.
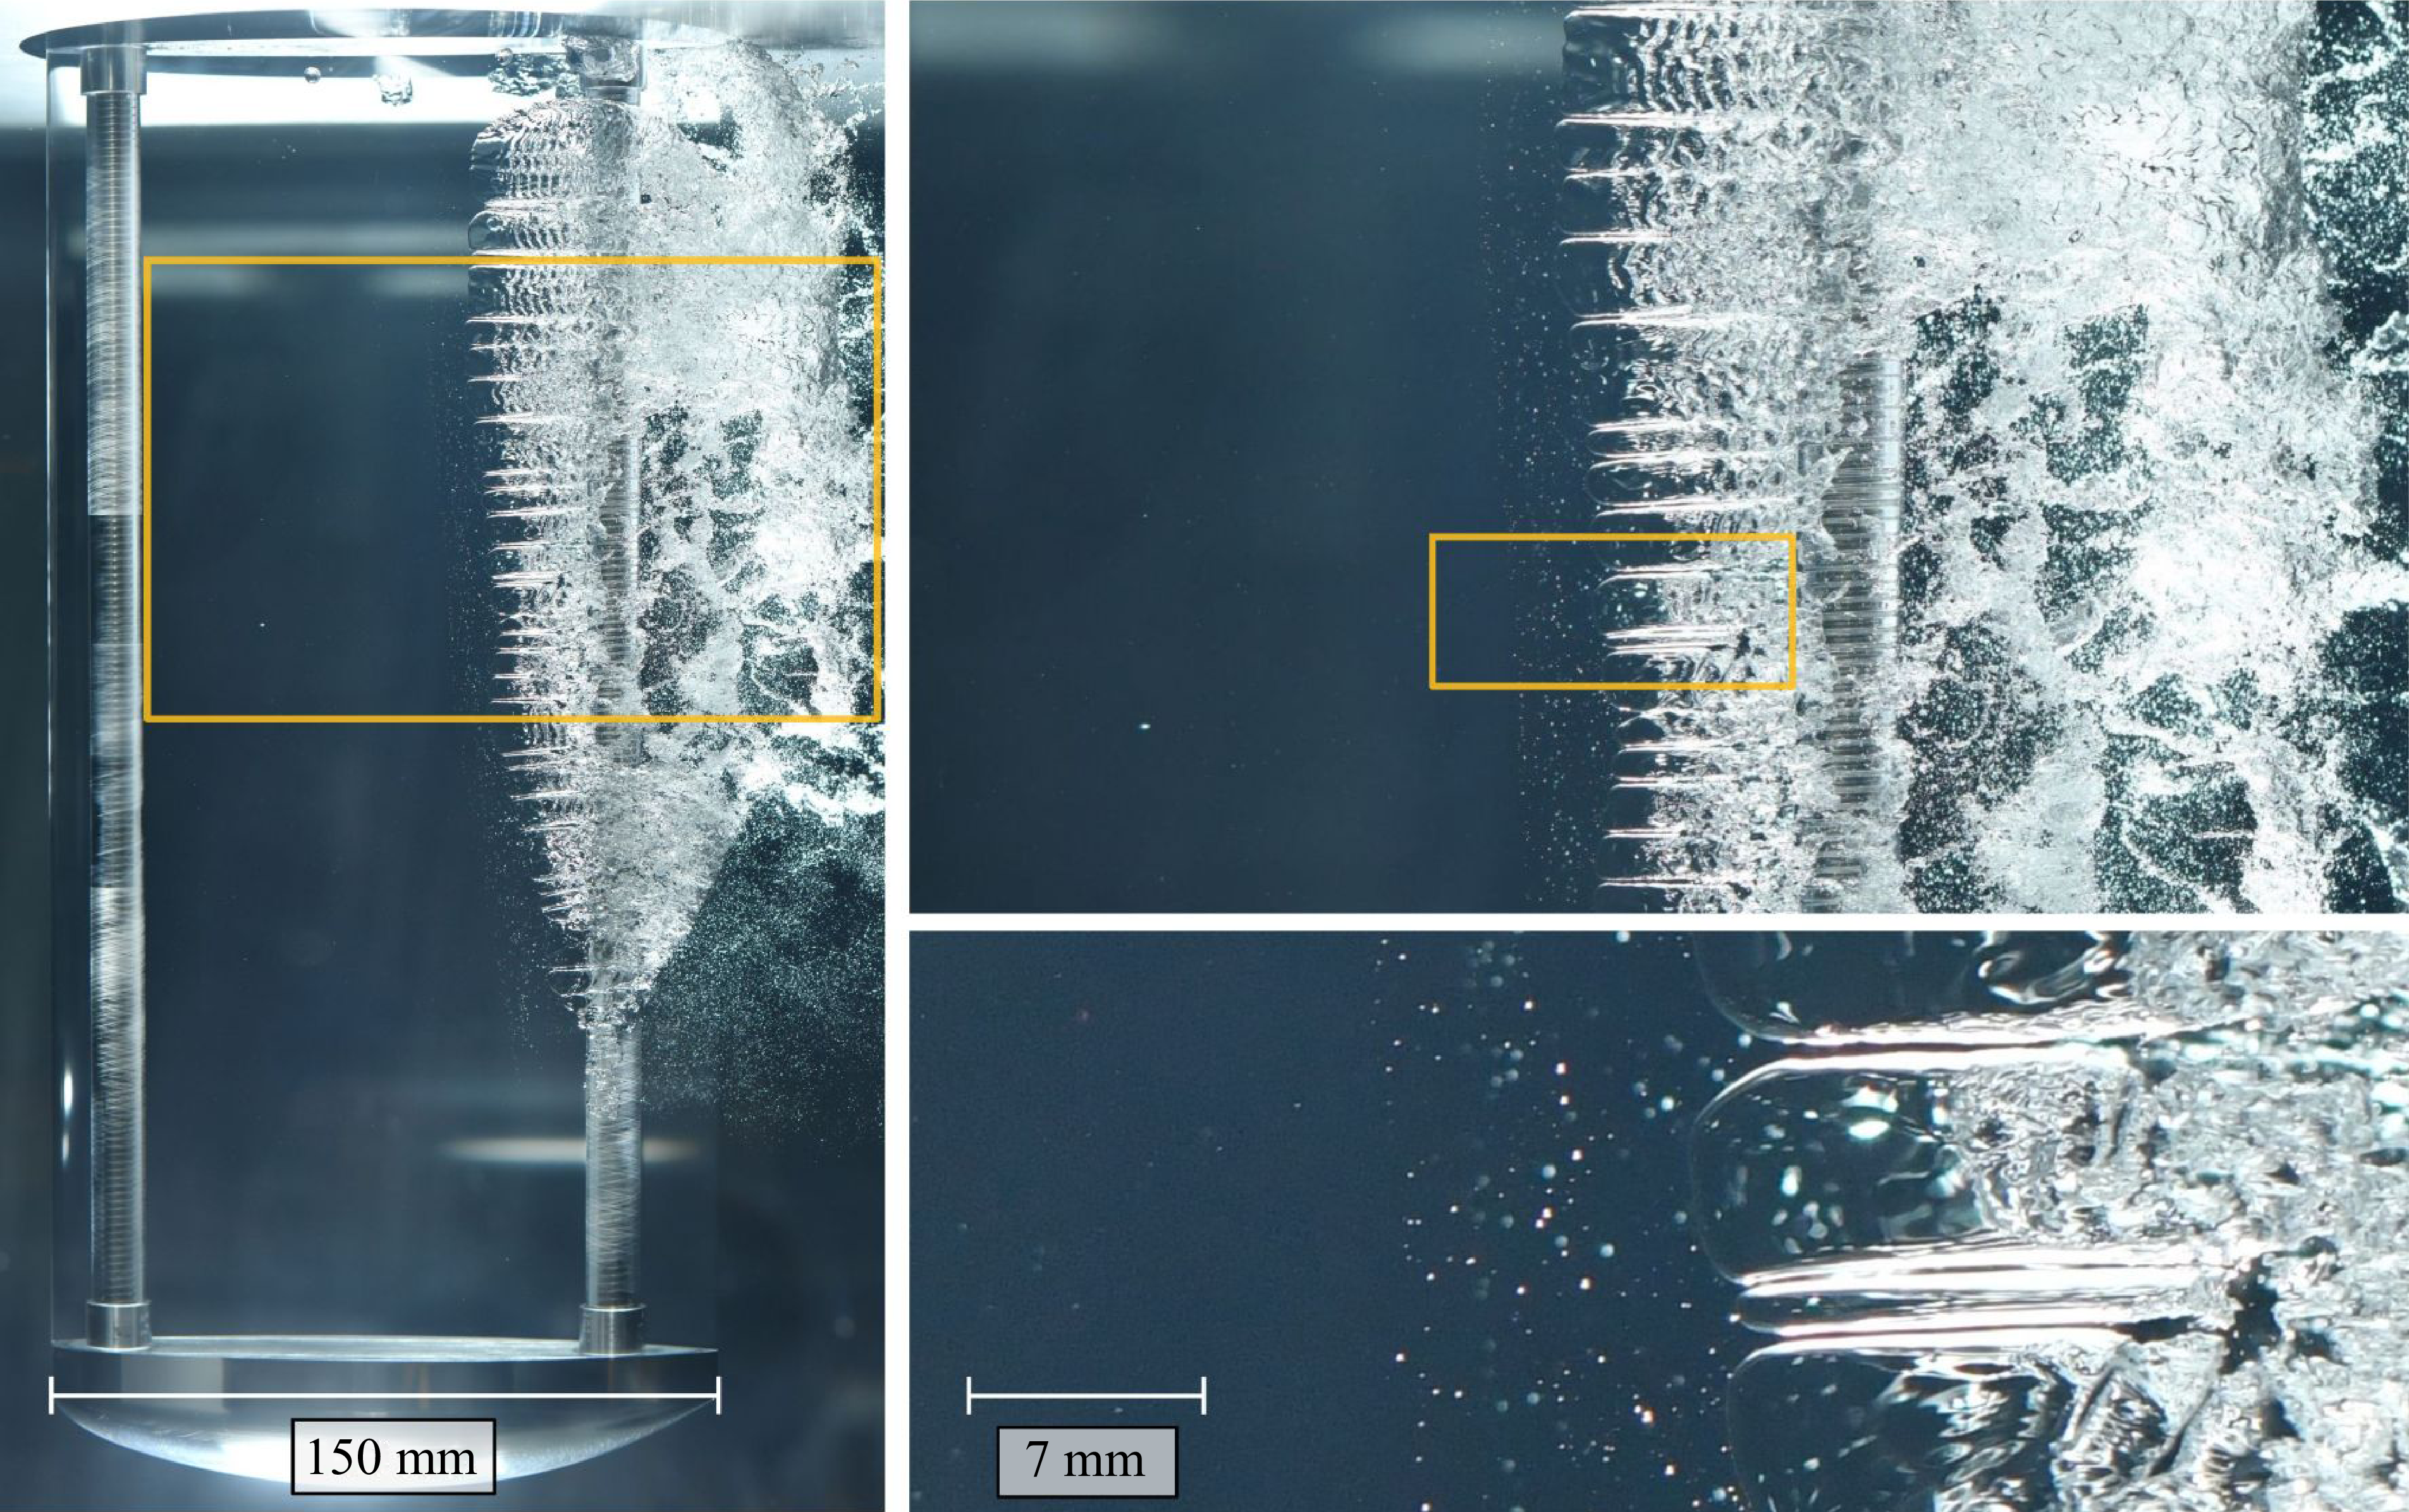
Figure 1 provides an overview of the hydrofoil model and the cavitation about the hydrofoil surface. From the wide field-of-view image, cavitation covers approximately two-thirds of the hydrofoil span for $ \textit{Re} = {U c}/{\nu } = 0.75\times 10^6$
and
$ \textit{Re} = {U c}/{\nu } = 0.75\times 10^6$
and $\sigma = {p_{\infty } - p_{v}}/ {0.5\rho U^2} = 0.55$
. The cavity sheds alternately on each side of the hydrofoil due to a condensation shockwave that occurs as the growing cavity reaches the trailing edge of the model. This condensation process can be seen to be underway at the centre span of the model in this image. An enlarged view of the central portion of the cavity is shown in top right of figure 1. Not only can the condensing cavity be seen in more detail, but so can the leading edge features of the cavity. The glassy appearance of the cavity leading edge identifies the flow in this region as laminar and it is also apparent that there are many micro-bubbles upstream of the cavity.
$\sigma = {p_{\infty } - p_{v}}/ {0.5\rho U^2} = 0.55$
. The cavity sheds alternately on each side of the hydrofoil due to a condensation shockwave that occurs as the growing cavity reaches the trailing edge of the model. This condensation process can be seen to be underway at the centre span of the model in this image. An enlarged view of the central portion of the cavity is shown in top right of figure 1. Not only can the condensing cavity be seen in more detail, but so can the leading edge features of the cavity. The glassy appearance of the cavity leading edge identifies the flow in this region as laminar and it is also apparent that there are many micro-bubbles upstream of the cavity.
Shedding cavitation about an acrylic NACA 16-029 hydrofoil for a Reynolds number of $ \textit{Re} = 0.75\times 10^6$
and cavitation number
$ \textit{Re} = 0.75\times 10^6$
and cavitation number $\sigma = 0.55$
. Microbubble nuclei are observed trapped between the cavity leading edge and the laminar boundary layer separation upstream.
$\sigma = 0.55$
. Microbubble nuclei are observed trapped between the cavity leading edge and the laminar boundary layer separation upstream.

To investigate the dynamics of microbubbles in detail, two Phantom v2640 high-speed video cameras recorded the flow at different levels of magnification simultaneously. The first was equipped with a Nikon AF-S $85\,$
mm lens and captured the overall cavity dynamics by imaging an area of approximately
$85\,$
mm lens and captured the overall cavity dynamics by imaging an area of approximately $115\,$
mm
$115\,$
mm $\,\times 115\,$
mm near the centre-span of the model. This led to a pixel resolution of
$\,\times 115\,$
mm near the centre-span of the model. This led to a pixel resolution of $59\,\unicode{x03BC}$
m px−1. The second camera focused on a smaller region near the leading edge of the cavity. It captured an area of
$59\,\unicode{x03BC}$
m px−1. The second camera focused on a smaller region near the leading edge of the cavity. It captured an area of $13\,$
mm
$13\,$
mm $\times 13\,$
mm through a Questar QM-1 long-range microscope with a resolution of
$\times 13\,$
mm through a Questar QM-1 long-range microscope with a resolution of $6.8\,\unicode{x03BC}$
m px−1. Each camera recorded images at a resolution of
$6.8\,\unicode{x03BC}$
m px−1. Each camera recorded images at a resolution of $2048\times 1954$
pixels and a frame rate of 6600 frames per second.
$2048\times 1954$
pixels and a frame rate of 6600 frames per second.
To maximise image quality, instead of acrylic windows, both cameras viewed the flow through a single $160\,$
mm diameter BK7-glass port. Priority was given to the long-range microscope, which was positioned perpendicular to the glass to optimise the details in this image. The wide field-of-view camera was placed adjacent to it, angled slightly upstream to capture the broader perspective. The depth-of-field in the larger image was sufficient to keep the cavity features in focus. To illuminate the cavity, a Veritas Constellation 120 LED lamp and diffusing screen were positioned directly behind the model. The bright light passing through the acrylic model allowed the capture of shadowgraphy images with an exposure time of
$160\,$
mm diameter BK7-glass port. Priority was given to the long-range microscope, which was positioned perpendicular to the glass to optimise the details in this image. The wide field-of-view camera was placed adjacent to it, angled slightly upstream to capture the broader perspective. The depth-of-field in the larger image was sufficient to keep the cavity features in focus. To illuminate the cavity, a Veritas Constellation 120 LED lamp and diffusing screen were positioned directly behind the model. The bright light passing through the acrylic model allowed the capture of shadowgraphy images with an exposure time of ${\lt}40\,\unicode{x03BC}$
s, freezing the motion of the flow. Calibration of the magnification factor for each image was performed by placing a Lavision DaVis glass shadowgraphy calibration plate on the surface of the model while the water was stationary. The glass plate is painted with calibrated dots ranging in size from 10
${\lt}40\,\unicode{x03BC}$
s, freezing the motion of the flow. Calibration of the magnification factor for each image was performed by placing a Lavision DaVis glass shadowgraphy calibration plate on the surface of the model while the water was stationary. The glass plate is painted with calibrated dots ranging in size from 10 $\unicode{x03BC}$
m to 2 mm.
$\unicode{x03BC}$
m to 2 mm.
Measurements were recorded for chord-based Reynolds numbers of $ \textit{Re} = 0.75\times 10^6$
and
$ \textit{Re} = 0.75\times 10^6$
and $ \textit{Re} = 1.5\times 10^6$
. A coordinate system was defined with the
$ \textit{Re} = 1.5\times 10^6$
. A coordinate system was defined with the $x$
-axis aligned with the flow and the
$x$
-axis aligned with the flow and the $y$
-axis along the span of the model with the origin placed on the ceiling at the leading edge of the model. The model chord was aligned with the flow (
$y$
-axis along the span of the model with the origin placed on the ceiling at the leading edge of the model. The model chord was aligned with the flow ( $\alpha = 0$
), resulting in the formation of a cavity at approximately
$\alpha = 0$
), resulting in the formation of a cavity at approximately $x/c = 0.6$
, alternating on either side of the model for cavitation numbers in the range
$x/c = 0.6$
, alternating on either side of the model for cavitation numbers in the range $0.55 \gt \sigma \gt 0.45$
. Testing was performed over multiple days to allow for still photography and the high-speed data measurements. Cavity topology and associated phenomena were found to be highly repeatable during these tests.
$0.55 \gt \sigma \gt 0.45$
. Testing was performed over multiple days to allow for still photography and the high-speed data measurements. Cavity topology and associated phenomena were found to be highly repeatable during these tests.
The cavitation tunnel at the University of Tasmania features a sophisticated architecture and ancillary systems designed to control and remove free stream nuclei during operation (Brandner et al. Reference Brandner, Lecoffre and Walker2007, Reference Brandner, Venning and Pearce2022). Extensive measurements have been conducted to assess water quality within the tunnel (Venning et al. Reference Venning, Khoo, Pearce and Brandner2018; Khoo et al. Reference Khoo, Venning, Pearce, Takahashi, Mori and Brandner2020). Despite degassing, a natural population of nuclei remain ever-present within the tunnel. The natural nuclei population has been investigated using a Cavitation Susceptibility Meter – a device that mechanically activates nuclei by continuously passing water through a narrow venturi at a known pressure. By varying the throat pressure, the concentration of nuclei susceptible at each pressure/tension can be quantified. The natural nuclei require significant tension to activate, when converted to an equivalent bubble radius, the majority of the population are below $1\,\unicode{x03BC}$
m in diameter. Due to a combination of their strong critical tension and/or low concentration, the natural nuclei remain inactive at these flow conditions. Although the flow eventually becomes susceptible at all tensions (Venning et al. Reference Venning, Khoo, Pearce and Brandner2018), the concentration of these nuclei is typically so low that they are rarely observed during experiments. Finally, it is noted that if susceptible free stream nuclei were present, they would be seen passing by in the high-speed recordings, or as discussed in the introduction and by Li & Ceccio (Reference Li and Ceccio1996), Brandner et al. (Reference Brandner, Walker, Niekamp and Anderson2010), would likely activate within the boundary layer upstream of separation.
$1\,\unicode{x03BC}$
m in diameter. Due to a combination of their strong critical tension and/or low concentration, the natural nuclei remain inactive at these flow conditions. Although the flow eventually becomes susceptible at all tensions (Venning et al. Reference Venning, Khoo, Pearce and Brandner2018), the concentration of these nuclei is typically so low that they are rarely observed during experiments. Finally, it is noted that if susceptible free stream nuclei were present, they would be seen passing by in the high-speed recordings, or as discussed in the introduction and by Li & Ceccio (Reference Li and Ceccio1996), Brandner et al. (Reference Brandner, Walker, Niekamp and Anderson2010), would likely activate within the boundary layer upstream of separation.
3. Results
A video of the cavity dynamics and nuclei motion for $ \textit{Re}=1.5\times 10^6$
is presented in supplementary movie 1 available at https://doi.org/10.1017/jfm.2025.10995. The high-speed data were analysed to identify the origin of microbubbles responsible for re-nucleation and determine the conditions that lead to their formation. A persistent population of microbubbles was observed ahead of the cavity throughout the shedding cycle (see figure 2). Supplementary movie 2 presents data at
$ \textit{Re}=1.5\times 10^6$
is presented in supplementary movie 1 available at https://doi.org/10.1017/jfm.2025.10995. The high-speed data were analysed to identify the origin of microbubbles responsible for re-nucleation and determine the conditions that lead to their formation. A persistent population of microbubbles was observed ahead of the cavity throughout the shedding cycle (see figure 2). Supplementary movie 2 presents data at $ \textit{Re}=0.75\times 10^6$
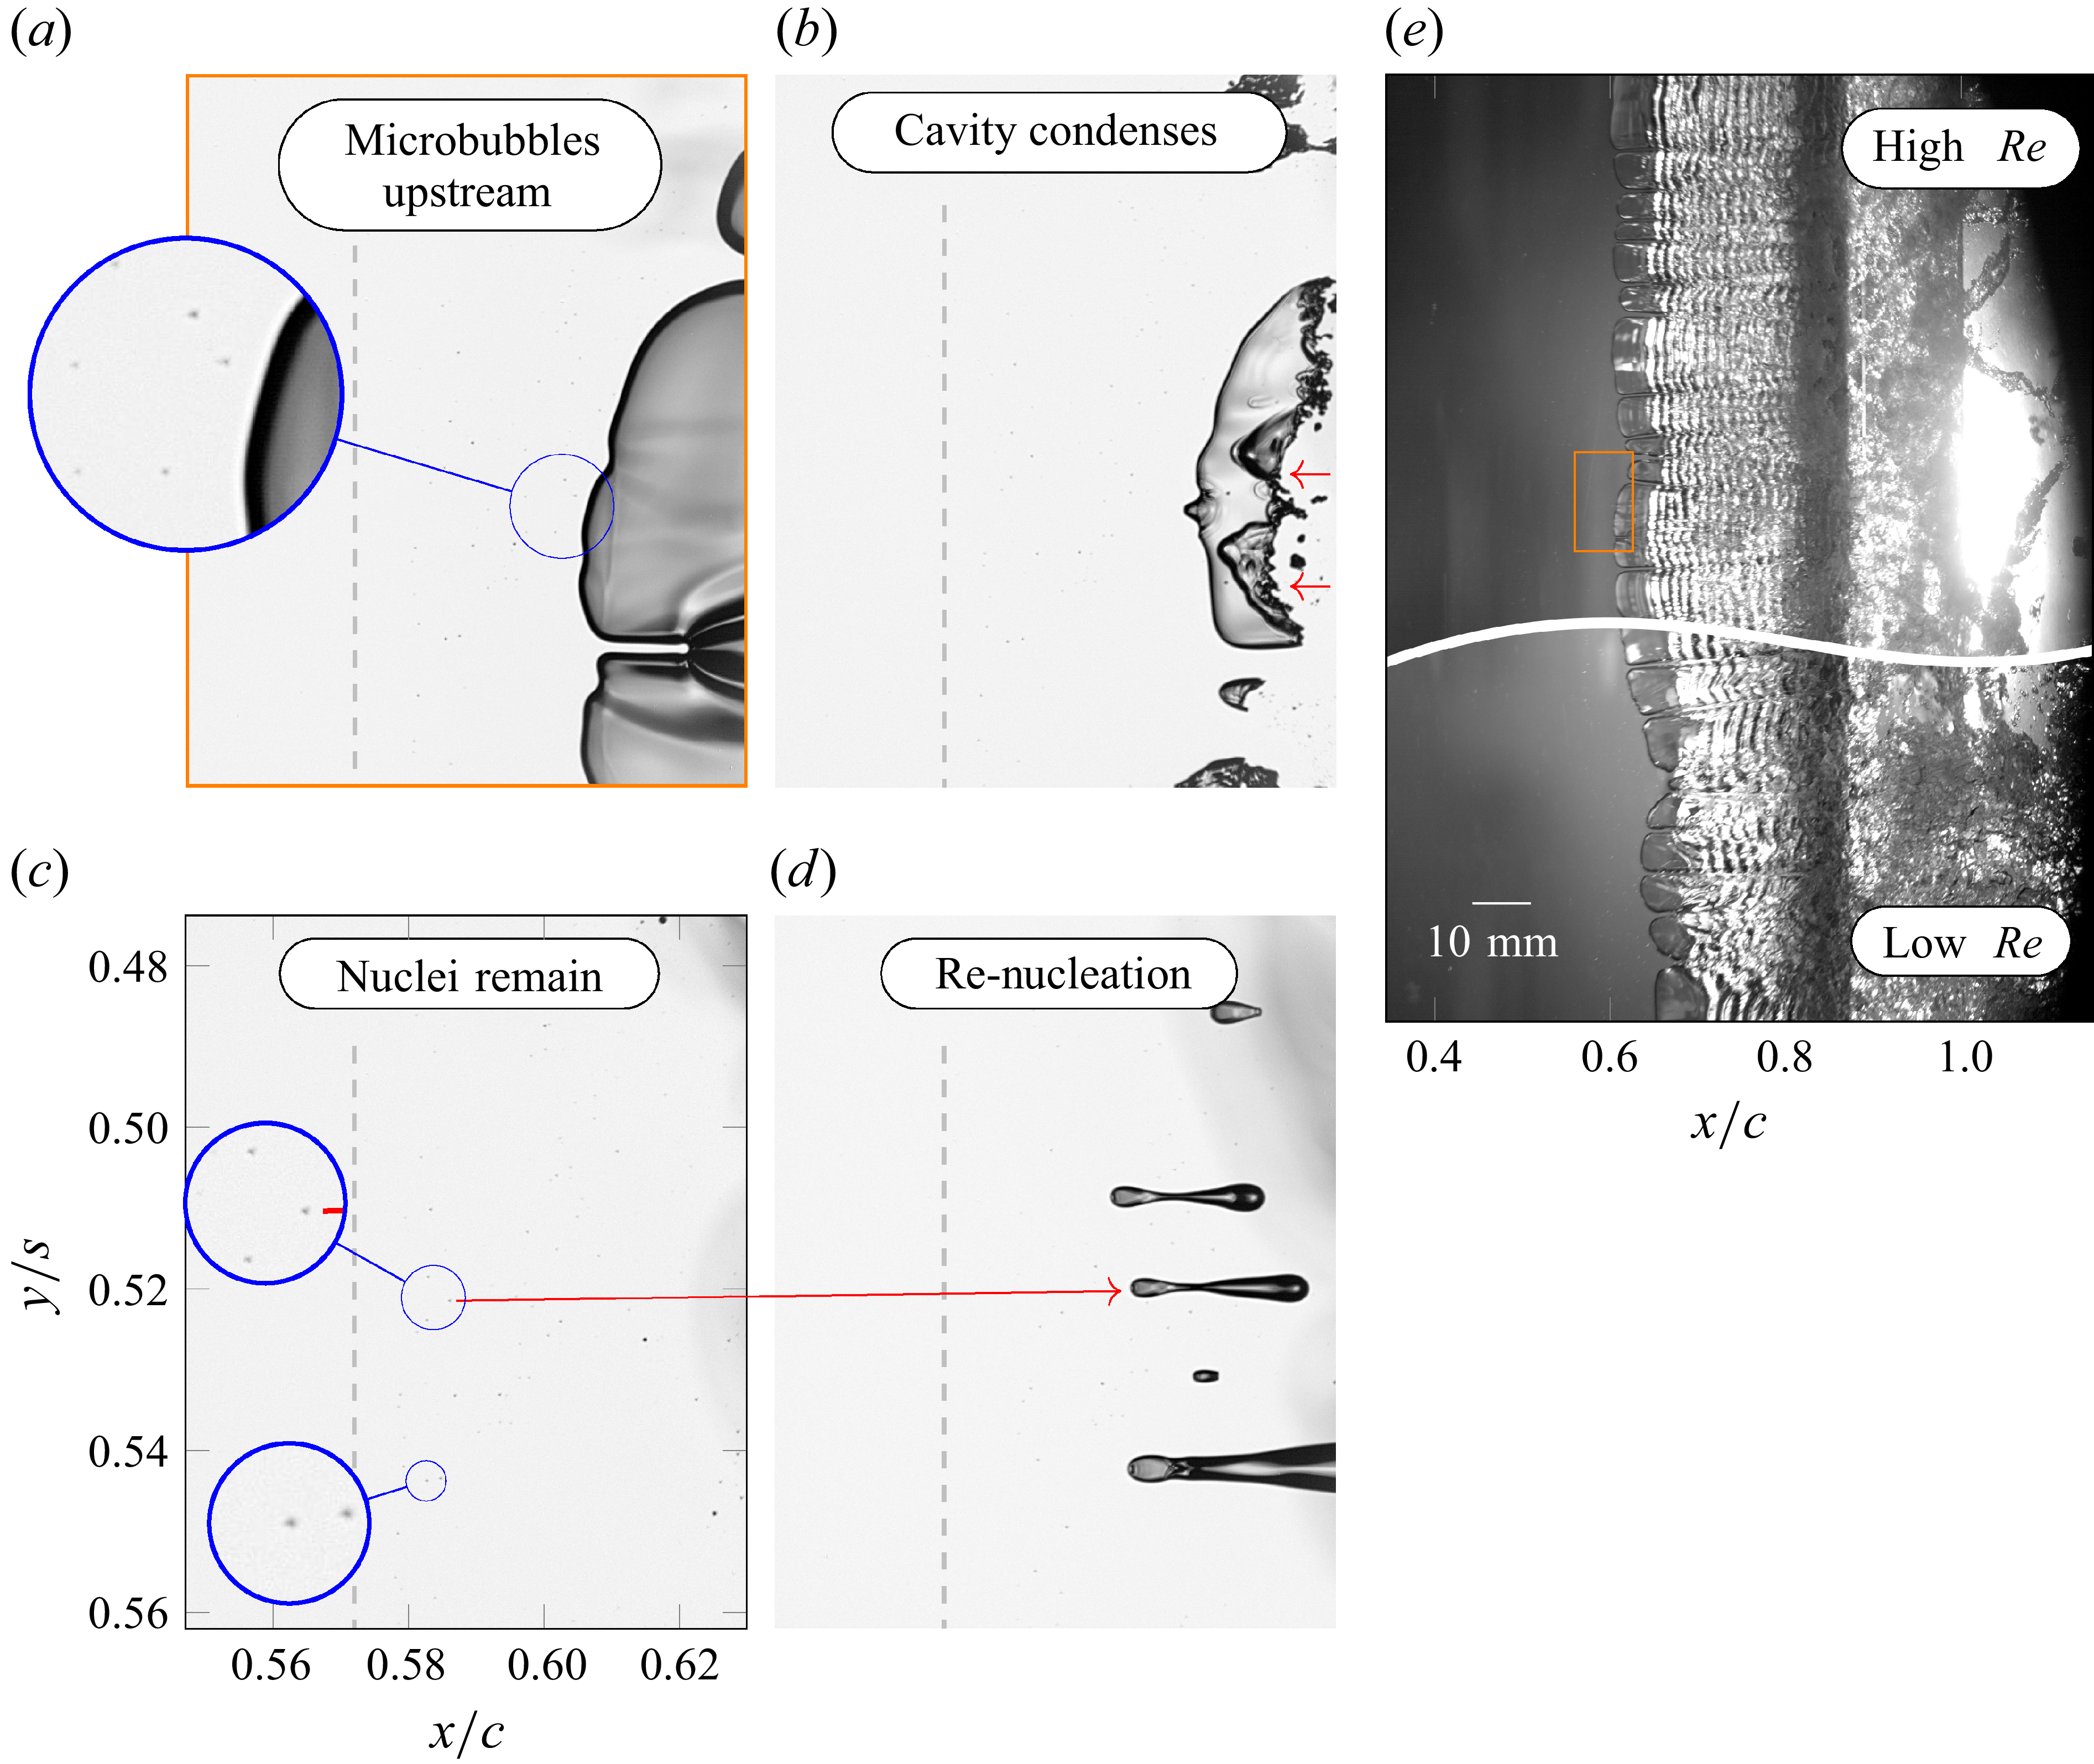
. Regardless of Reynolds number, nuclei approximately 10–100 micron in diameter are consistently observed directly ahead of the cavity during its growth phase. This suggests that the local pressure is above vapour pressure and not under tension. Therefore, a rapid rise in pressure must take place in the stagnant region between the adverse pressure gradient that accompanies the separation of the laminar boundary layer and the cavity itself.
$ \textit{Re}=0.75\times 10^6$
. Regardless of Reynolds number, nuclei approximately 10–100 micron in diameter are consistently observed directly ahead of the cavity during its growth phase. This suggests that the local pressure is above vapour pressure and not under tension. Therefore, a rapid rise in pressure must take place in the stagnant region between the adverse pressure gradient that accompanies the separation of the laminar boundary layer and the cavity itself.
(a–d) Sequence of frames capturing the presence and formation of microbubbles upstream of the cavity leading edge throughout the shedding cycle. These bubbles provide nucleation sites for subsequent vapour formation. The dashed line indicates the most upstream position of nuclei in each frame. (e) Macroscopic cavity concurrent with panel (a). An orange box is super-imposed on panel (e) to show the region imaged in panels (a–d). Additionally, panel (e) has been split into two to demonstrate the differences in topology with Reynolds number.

Attempts to measure pressure directly within the separated region have historically proven difficult. In their seminal study, Parkin & Kermeen (Reference Parkin and Kermeen1953) introduced a small hole and rubber diaphragm to capture the changing pressure ahead of attached cavities on headforms, but found that the membrane either bulged outward or was drawn inward, locally disturbing the flow and suppressing cavitation. This highlights the challenge of obtaining reliable pressure data in such sensitive multi-phase regions without introducing intrusive effects. Instead, this physics was investigated numerically.
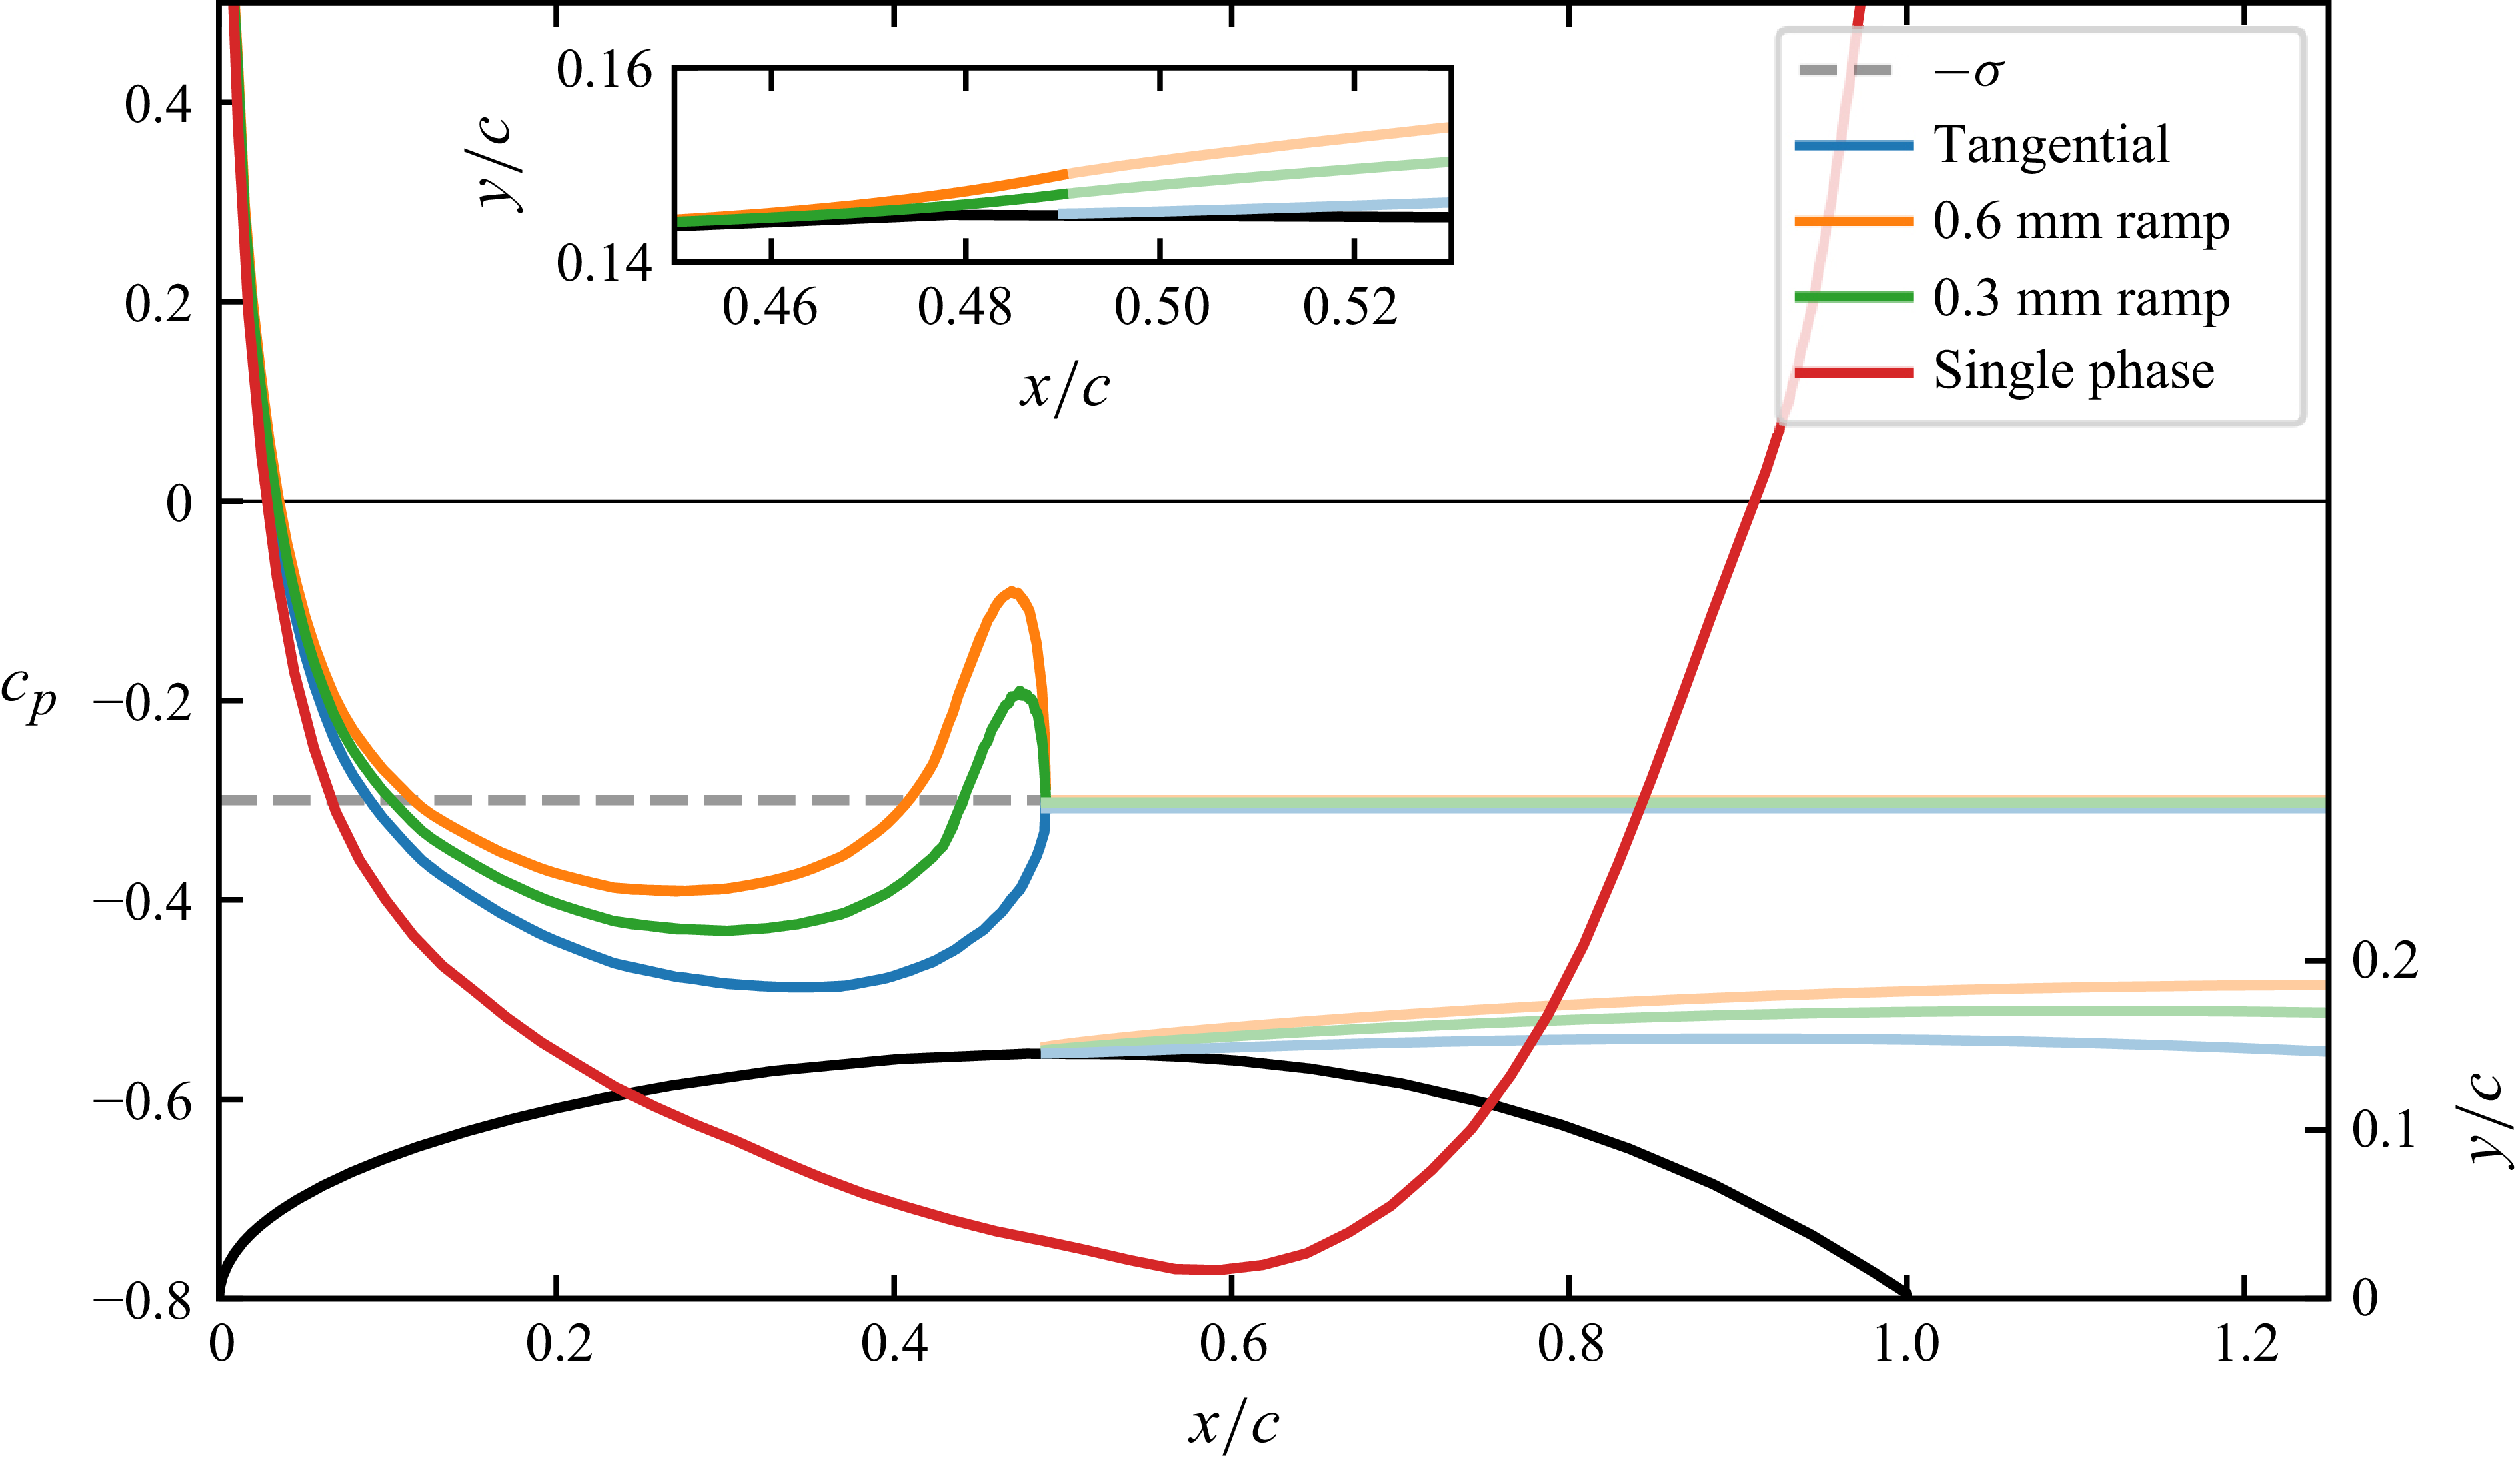
To examine the pressure distribution within the separated region, an inviscid potential flow analysis was conducted for a stable two-dimensional supercavity. Figure 3 presents results for the single-phase flow, along with several steady-state cavitating flow topologies. In contrast to the classical – but physically unrealistic – assumption of tangential cavity detachment, additional calculations have been made where the geometry upstream of the detachment point has been modified to incorporate a ramp that approximates the separation streamline. This approach has previously been employed in studies of flow over wall-mounted fences (Pearce & Brandner Reference Pearce and Brandner2014) and intercepted supercavitating hydrofoil sections (Pearce & Brandner Reference Pearce and Brandner2015). The ramp height, representative of the cavity thickness, is of the order of 1 mm, with calculations performed for two estimates: $h = 0.6\,\textrm{mm}$
and
$h = 0.6\,\textrm{mm}$
and $h = 0.9\,$
mm. The length of the ramp corresponds to the distance between laminar separation and cavity detachment. This was set to be 10 mm, slightly longer than the region where bubbles are observed in figure 1. Based on experimental measurements at a Reynolds number of
$h = 0.9\,$
mm. The length of the ramp corresponds to the distance between laminar separation and cavity detachment. This was set to be 10 mm, slightly longer than the region where bubbles are observed in figure 1. Based on experimental measurements at a Reynolds number of $ \textit{Re}=0.75\times 10^6$
for a cavitation number of
$ \textit{Re}=0.75\times 10^6$
for a cavitation number of $\sigma = 0.3$
, these simulations were performed with a cavity detachment location of
$\sigma = 0.3$
, these simulations were performed with a cavity detachment location of $x/c = 0.49$
. Incorporating the ramp into the potential flow model yields an increase in pressure coefficient along the separation streamline upstream of the cavity. Although the model describes a steady supercavity, it conceptually supports the experimental observation that nuclei entrained within the low-momentum region remain unactivated, implying that the pressure just ahead of the cavity is above vapour pressure.
$x/c = 0.49$
. Incorporating the ramp into the potential flow model yields an increase in pressure coefficient along the separation streamline upstream of the cavity. Although the model describes a steady supercavity, it conceptually supports the experimental observation that nuclei entrained within the low-momentum region remain unactivated, implying that the pressure just ahead of the cavity is above vapour pressure.
Inviscid calculations for a steady supercavity about a NACA 16-029 hydrofoil are presented. The separated region ahead of the cavity is modelled with a small ramp for a cavitation number of $\sigma = 0.3$
. Two estimated ramp heights are simulated and compared with calculations for tangential cavity detachment and single phase flow. The pressure profiles (left axis) indicate a rise in pressure above vapour pressure (grey dashed line) in the region directly ahead of the cavity. The hydrofoil geometry and computed cavity shape are plotted using the right axis and inset, which presents an enlarged view of the geometry near detachment.
$\sigma = 0.3$
. Two estimated ramp heights are simulated and compared with calculations for tangential cavity detachment and single phase flow. The pressure profiles (left axis) indicate a rise in pressure above vapour pressure (grey dashed line) in the region directly ahead of the cavity. The hydrofoil geometry and computed cavity shape are plotted using the right axis and inset, which presents an enlarged view of the geometry near detachment.

These pressure distributions also demonstrate that if large free stream nuclei were present in the flow, they would activate in the region of metastable tension upstream of the cavity. Indeed, the wide field-of-view data confirm the absence of travelling bubble cavitation, indicating that free stream nuclei do not participate in inception; their critical tension is too strong (Khoo et al. Reference Khoo, Venning, Pearce, Takahashi, Mori and Brandner2020). The high-magnification images also indicate that no bubbles grow from a Harvey nucleus (Harvey et al. Reference Harvey, Barnes, Mcelroy, Whiteley, Pease and Cooper1944) or otherwise nucleate from the surface of the model. Instead, bubbles are produced by the shockwave-driven condensation of the cavity. The non-condensable dissolved gas released during vapourisation is redistributed into a spectrum of bubble sizes at collapse. Large bubbles are rapidly advected downstream, while many smaller bubbles are carried forwards by the momentum of the condensation shock front. A number become trapped within the near-wall low-momentum fluid. Eventually, a fraction of the trapped population will act as nuclei for inception in later shedding cycles. Additional measurements, not reported on in this study, were performed for cavitation numbers in the range of $0.6 \gt \sigma \gt 0.2$
. These data confirm that for a stable supercavity, no nuclei are found ahead of the cavity leading edge.
$0.6 \gt \sigma \gt 0.2$
. These data confirm that for a stable supercavity, no nuclei are found ahead of the cavity leading edge.
Beyond their formation, the behaviour of microbubbles within the separated region is governed by the unsteady flow topology ahead of the cavity. Nuclei within the narrow wedge between boundary layer separation and the leading edge of the cavity migrate upstream and downstream throughout the shedding cycle. In time, all bubbles are eventually carried downstream, where they may coalesce with one another or with the cavity. Depending on their spatio-temporal location within the cavity shedding cycle, they may also act as nuclei for inception. Initially, the activated nuclei grow into elongated fingers (figure 2 e). These new cavities then spread laterally to produce each of the individual cells within the contiguous leading edge. With the passage of the next condensation shockwave the cycle then repeats.
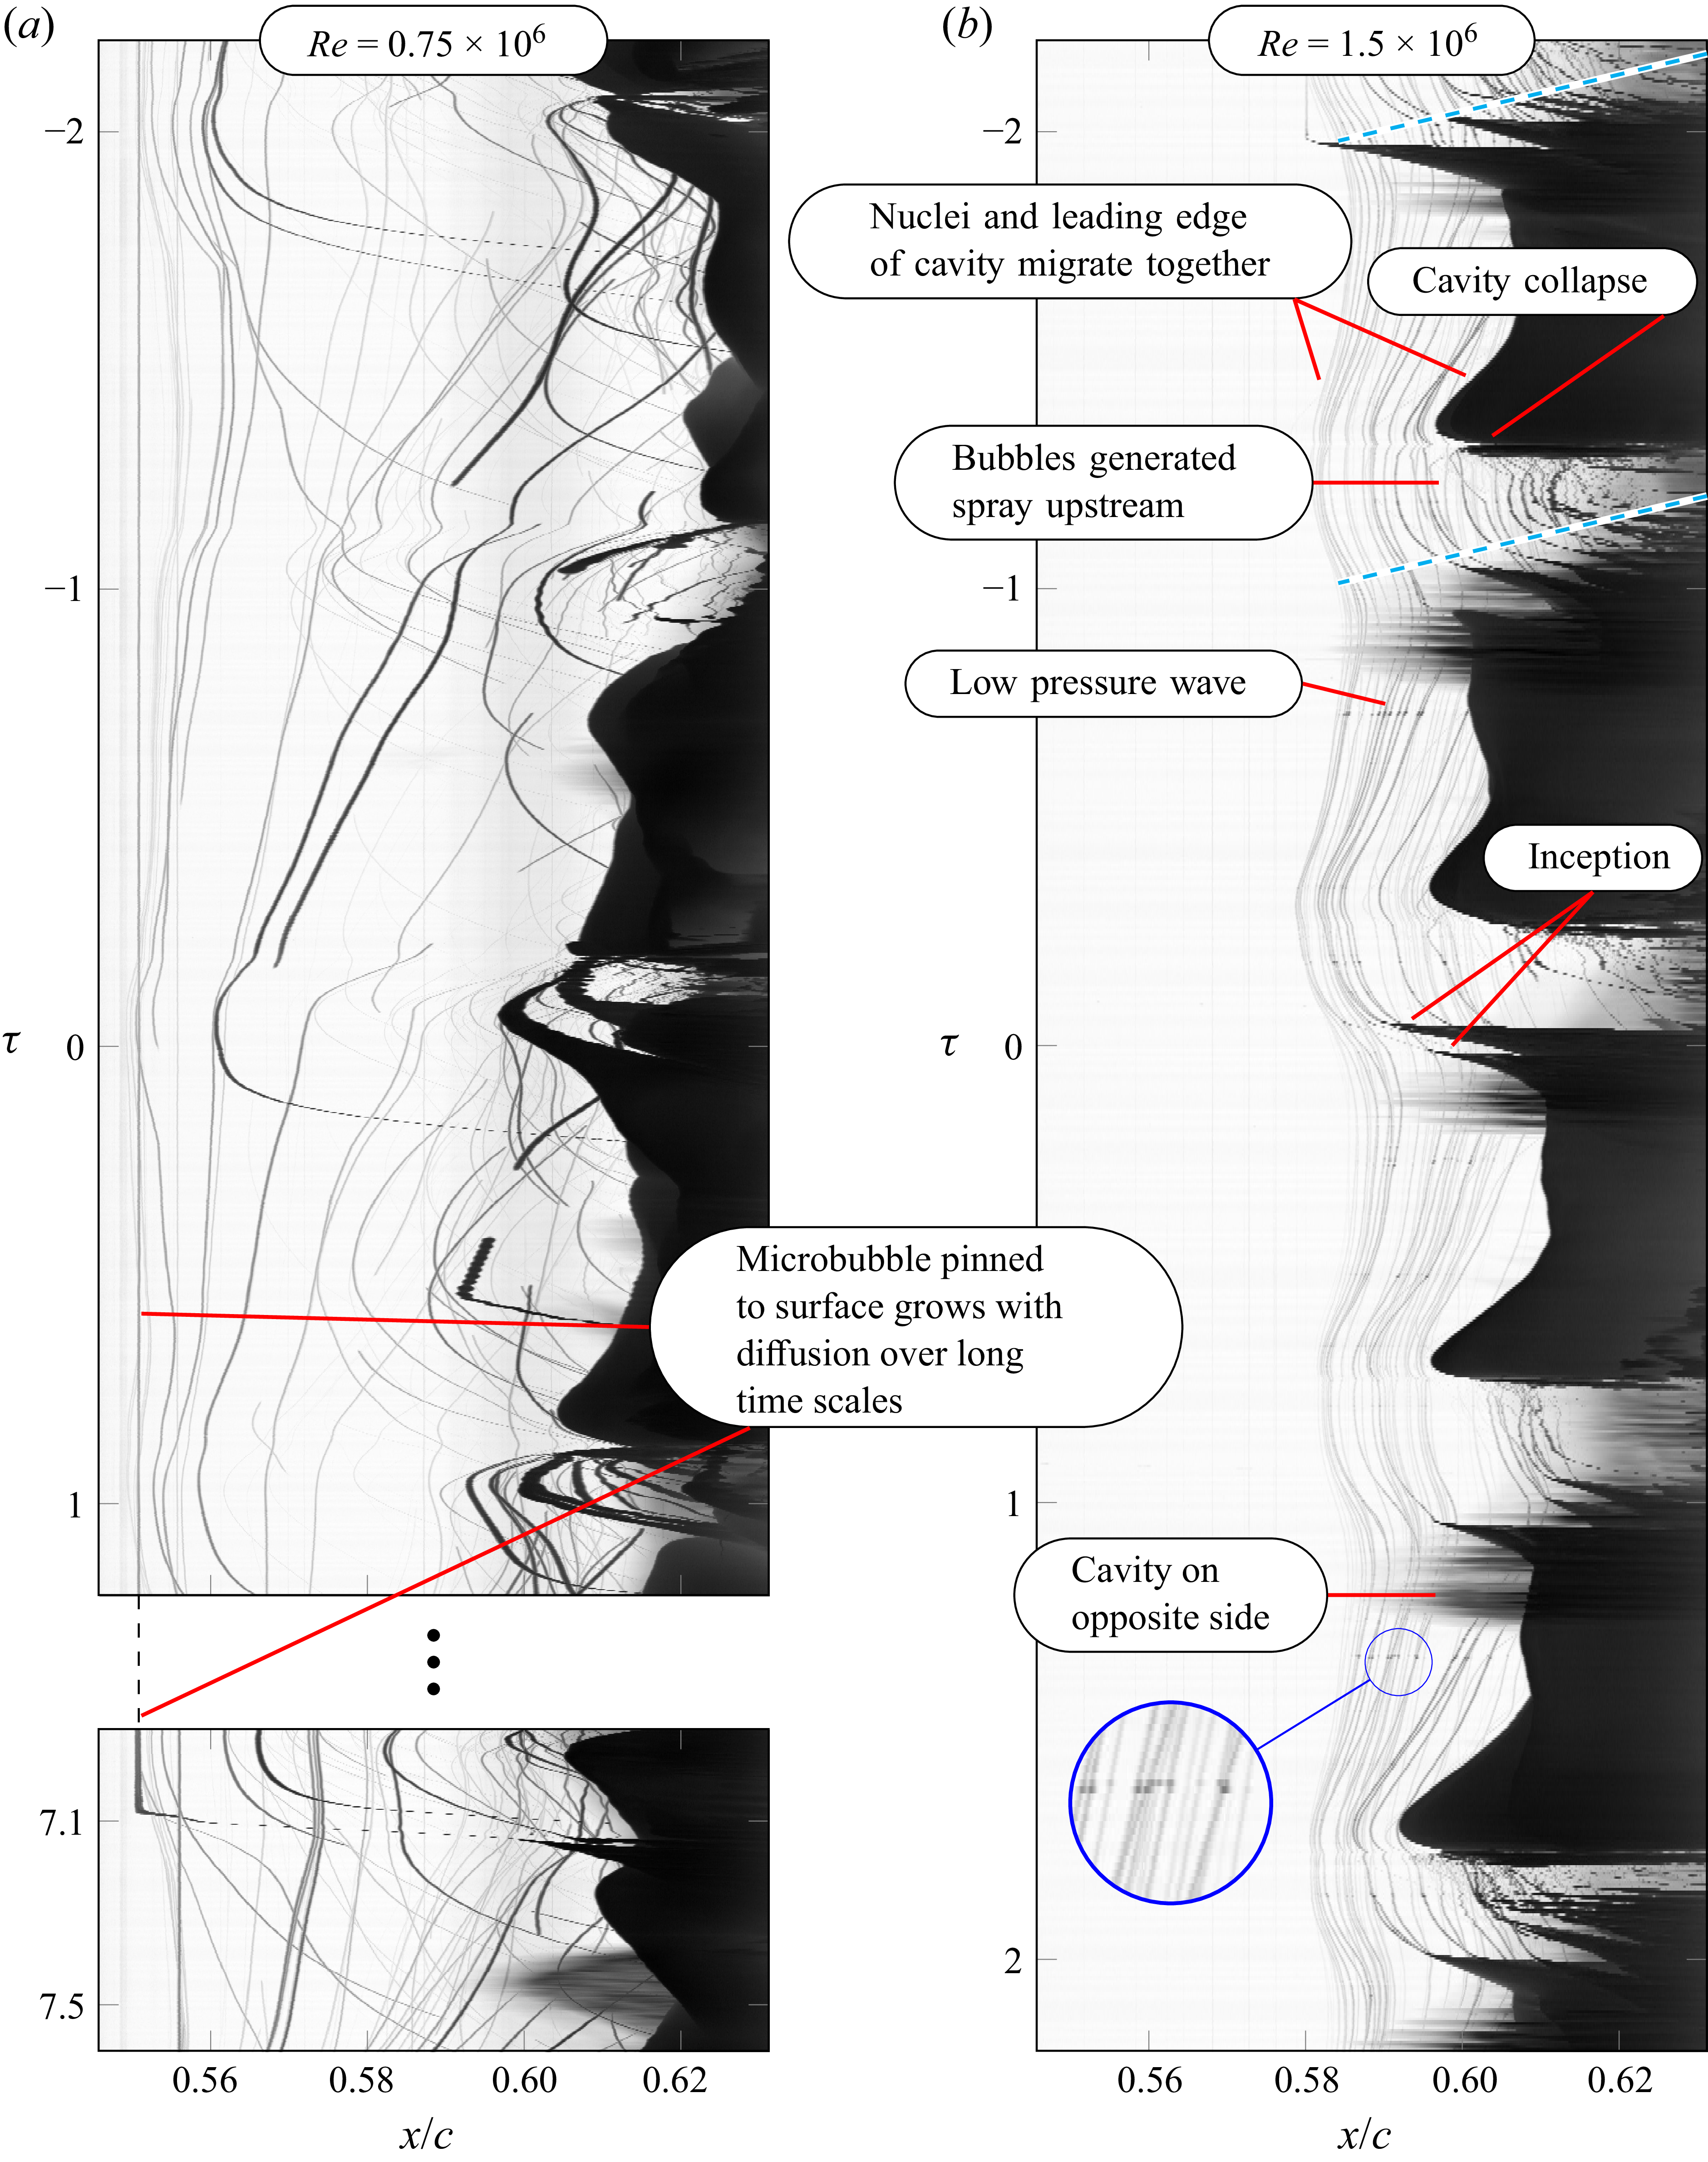
Given the complexity of bubble trajectories throughout the shedding cycle, a space–time diagram offers a clear way to visualise and compare their motion across different flow conditions. We present two such diagrams for different Reynolds numbers in figure 4. Instead of using a single row of pixels to construct the space–time image, each frame of the high-speed video is compressed vertically by retaining the minimum intensity in each column. This highlights the darkest features across the frame, typically the bubbles and the most upstream edge of the cavity. The result is therefore a pseudo-space–time diagram, as bubbles along the span of the model contribute to a one-dimensional (1-D) representation of their location along the chord. However, for readability, we will refer to these as simply space–time diagrams hereafter. To align the data in time, each frame is normalised by its phase angle within the shedding cycle ( $\tau$
). This phase is calculated using complex-wavelet analysis of the spatially averaged wide field-of-view data. The resulting phase angle is then rotated so that integer values align with the time-averaged phase of inception. To help clarify this process visually, a movie showing the construction of a space-time diagram is presented in supplementary movie 3.
$\tau$
). This phase is calculated using complex-wavelet analysis of the spatially averaged wide field-of-view data. The resulting phase angle is then rotated so that integer values align with the time-averaged phase of inception. To help clarify this process visually, a movie showing the construction of a space-time diagram is presented in supplementary movie 3.
Pseudo-space–time plots of the microbubble nuclei ahead of the cavity leading edge. Both the high- and low- $ \textit{Re}$
conditions are presented. Each diagram is normalised to present non-dimensional time
$ \textit{Re}$
conditions are presented. Each diagram is normalised to present non-dimensional time $\tau$
based on the phase within a shedding cycle. The data are phase shifted so that integer
$\tau$
based on the phase within a shedding cycle. The data are phase shifted so that integer $\tau$
is aligned with the time averaged re-nucleation of the cavity. The dashed cyan lines on the high-Reynolds-number plot highlight that when nuclei are present, their activation occurs further upstream as time advances within the shedding cycle.
$\tau$
is aligned with the time averaged re-nucleation of the cavity. The dashed cyan lines on the high-Reynolds-number plot highlight that when nuclei are present, their activation occurs further upstream as time advances within the shedding cycle.

The motion of nuclei is now visible as lines or streaks in figure 4. At low Reynolds numbers, the separated region is larger. Microbubble nuclei appear further upstream and are generally larger in diameter. This is not only due to the increased size and thickness of the separated region, but also to the reduced energy available to break up the cavity during collapse. Their trajectories frequently intersect throughout the shedding cycle. It should be mentioned that these plots are the authors best attempt at encapsulating inherently 3-D features that evolve in time onto the static 2-D page. Nuclei that occur at a streamwise location downstream of the cavity leading edge are obscured in the space–time diagram. Viewing of the supplementary video material is strongly encouraged to fully appreciate some of the arguments made. Indeed, supplementary movie 2 reveals that simultaneous upstream and downstream motion of bubbles occur at similar spanwise locations, indicating the presence of a recirculation within the separated region. A feature that is lost when the video is collapsed in the spanwise direction.
While this behaviour shares conceptual similarities with the self-sustaining mechanism described by Ram et al. (Reference Ram, Agarwal and Katz2020), there are important distinctions. Their work focused on the inception of cavitation generated from the collapse of smaller, intermittent travelling bubble cavitation in zones of low-momentum or marginal separation, where microbubbles were transported upstream by recirculation or pressure gradients. In contrast, the periodic cloud cavity examined here considers a more energetic and globally unstable regime. Here, the collapse of the entire cavity is driven by a condensation shock wave to produce a dense population of microbubbles. Rather than remnants of isolated cavitation events, these nuclei are formed through a fundamentally different mechanism. This distinction is critical, as it demonstrates that self-sustaining cavitation can arise from shock-driven cloud collapse, extending the concept to a new class of flows with greater industrial relevance. Although the earlier work of Giosio et al. (Reference Giosio, Russell, Pearce and Brandner2016) identified the persistence of nuclei ahead of the cavity, Ram et al. (Reference Ram, Agarwal and Katz2020) provided the first rigorous demonstration of this mechanism for incipient attached cavitation. The present results build on both to show how similar nuclei feedback loops can emerge from separate physical processes.
These distinctions are most evident when comparing flow behaviour across Reynolds numbers. At lower Reynolds numbers, the similarities with Ram et al. (Reference Ram, Agarwal and Katz2020) observations are more pronounced – not in the mechanism of bubble generation, but in the relative stability of the separation point and the persistence of nuclei upstream. In this regime, the most upstream microbubbles remain nearly stationary throughout the shedding cycle, suggesting a quasi-steady separation region that facilitates repeated re-nucleation from trapped nuclei.
At higher Reynolds number, the nature of the separated region is quite different. The trajectory of nuclei are predominantly parallel (figure 4
a). The thinner low-momentum region is dominated by viscous effects with little to no recirculation. Nuclei move essentially together, with the advance and retreat of the cavity leading edge, rather than by buoyancy or advection. Figure 4 indicates that at the higher Reynolds number, the flow near the separation becomes increasingly unsteady and, at the most upstream location in which microbubbles are present, begins to oscillate. There is no clear difference in the motion of neighbouring bubbles of dissimilar size suggesting that transport by pressure gradients plays a minor role in this unsteady flow, and most bubbles appear smaller than 100 microns in diameter ( ${\lt}15\,$
pixels).
${\lt}15\,$
pixels).
Although many nuclei are too small to be accurately sized, the velocity of nuclei inside the low-momentum region was extracted using methods similar to those described by Ram et al. (Reference Ram, Agarwal and Katz2020), in combination with the TrackMate plugin in ImageJ (Tinevez et al. Reference Tinevez, Perry, Schindelin, Hoopes, Reynolds, Laplantine, Bednarek, Shorte and Eliceiri2017). Velocities were measured from 50 000 high-speed frames, which equates to approximately 7.5 s or 265 shedding cycles, and binned into intervals of width $0.05\:\tau \,$
. The normalised streamwise velocity (
$0.05\:\tau \,$
. The normalised streamwise velocity ( $U_x/U$
) and the spanwise velocity (
$U_x/U$
) and the spanwise velocity ( $U_y/U$
) are presented in figure 5.
$U_y/U$
) are presented in figure 5.
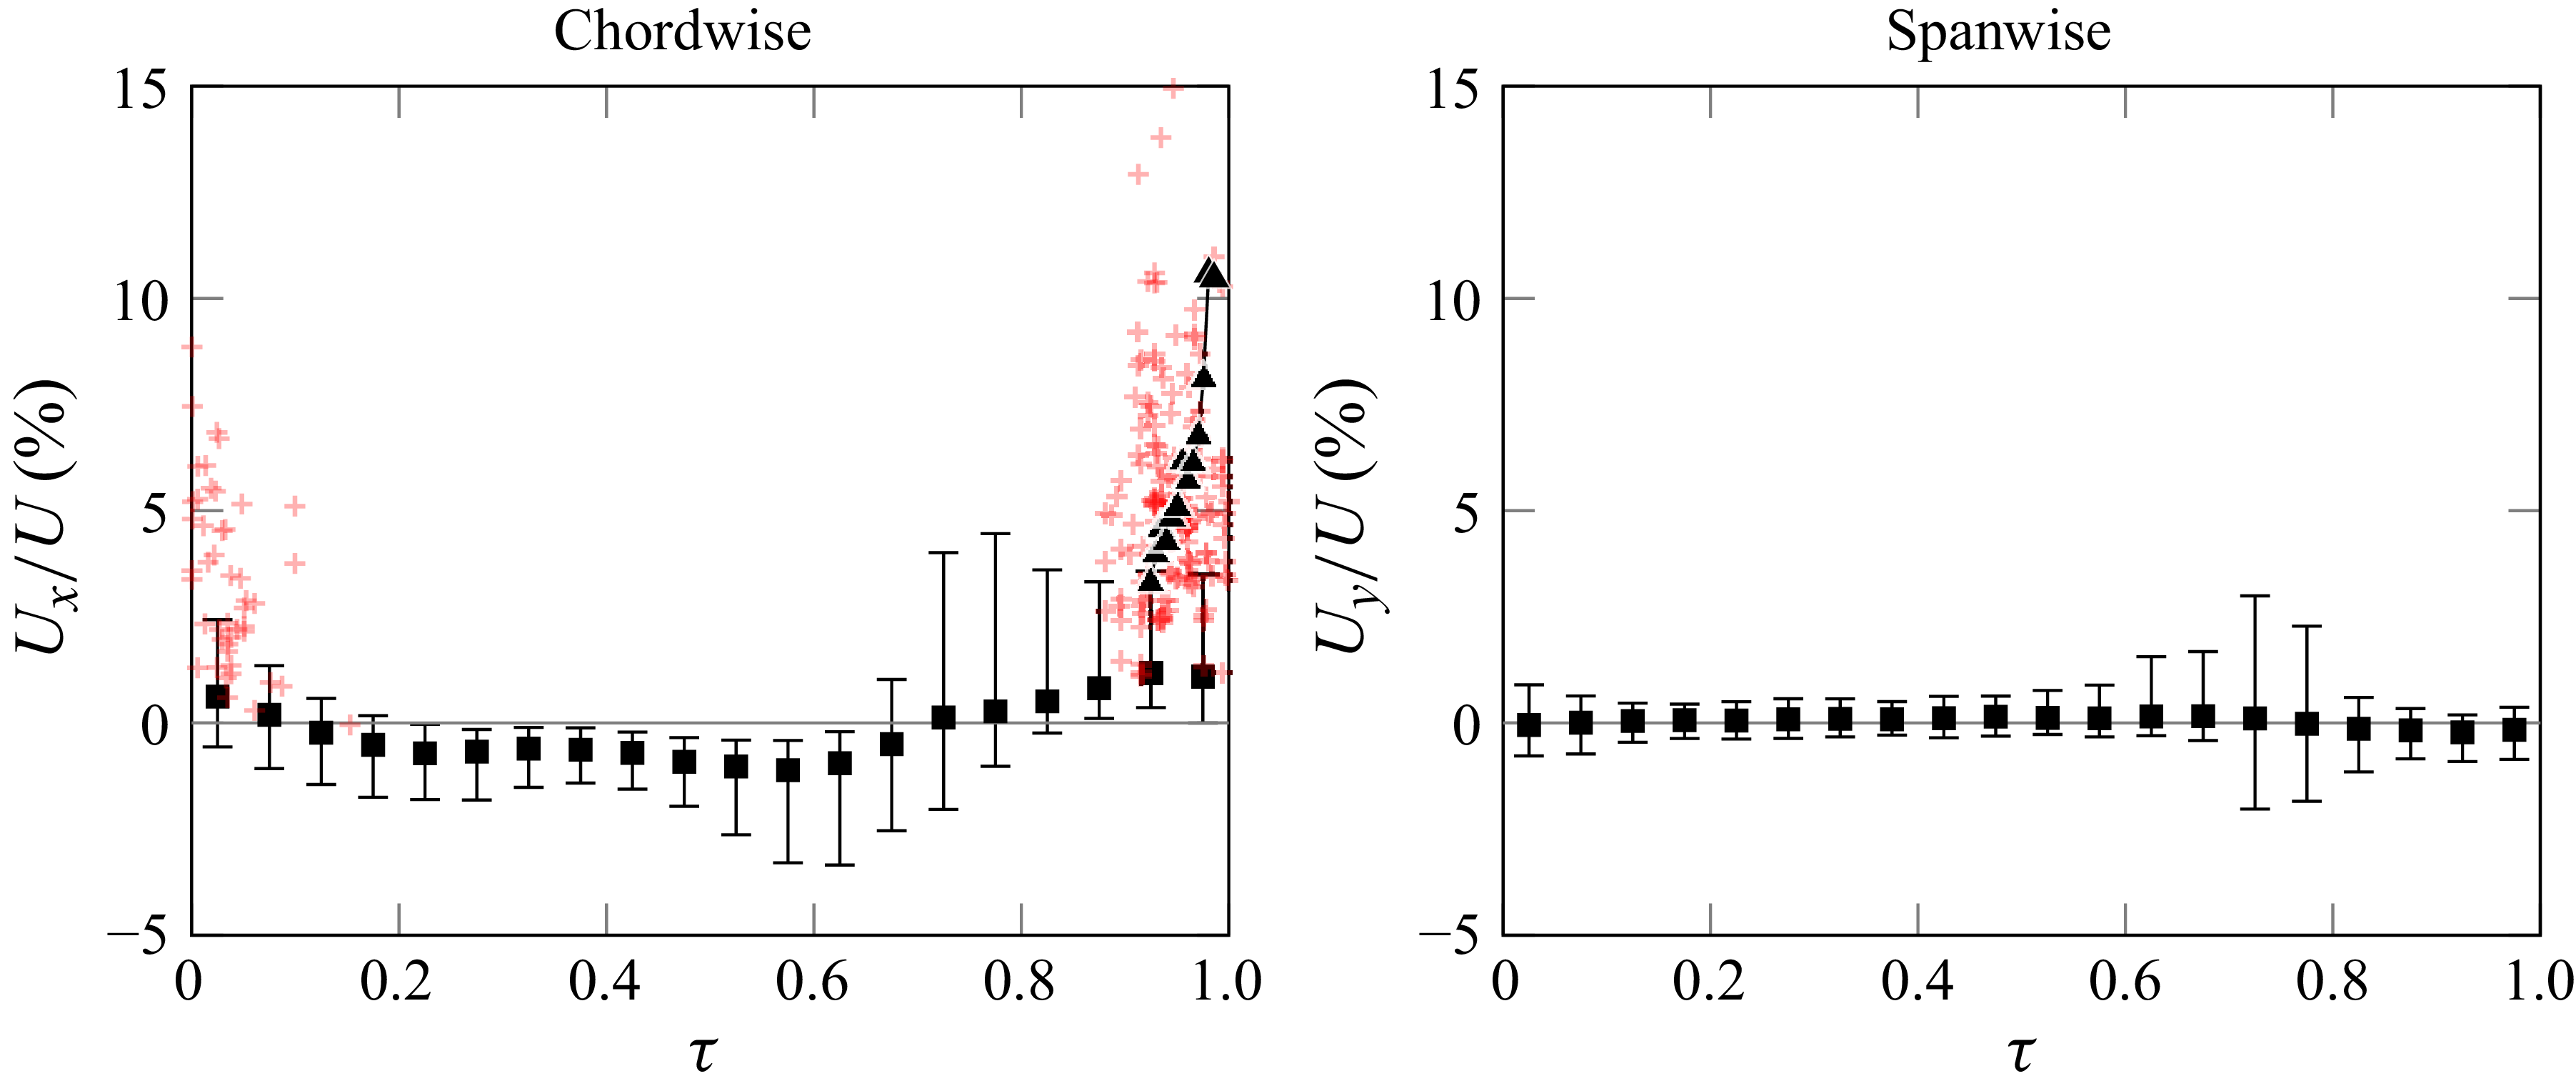
Phase averaged microbubble velocity computed using TrackMate plugin in ImageJ (Tinevez et al. Reference Tinevez, Perry, Schindelin, Hoopes, Reynolds, Laplantine, Bednarek, Shorte and Eliceiri2017) are plotted throughout the non-dimensionalised shedding cycle for $ \textit{Re} = 1.5\times 10^6$
, and
$ \textit{Re} = 1.5\times 10^6$
, and $\sigma = 0.47$
are expressed as a percentage of the free stream velocity. The mean velocity within each bin are plotted with
$\sigma = 0.47$
are expressed as a percentage of the free stream velocity. The mean velocity within each bin are plotted with ![]() , while
, while $2.5{\rm th}$
/
$2.5{\rm th}$
/ $97.5{\rm th}$
percentiles are indicated by error bars. The velocity of 200 incipient nuclei directly prior to activation were measured by hand, and are plotted with
$97.5{\rm th}$
percentiles are indicated by error bars. The velocity of 200 incipient nuclei directly prior to activation were measured by hand, and are plotted with ![]() . The velocity for several frames leading up to inception of an example nuclei are plotted with
. The velocity for several frames leading up to inception of an example nuclei are plotted with ![]() , indicating they accelerate.
, indicating they accelerate.

The phase averaged velocities show that shortly after inception, once the cavity has been established at $\tau \approx 0.2$
, the flow in this region decelerates and all nuclei move upstream (negative
$\tau \approx 0.2$
, the flow in this region decelerates and all nuclei move upstream (negative $U_x/U$
). Towards the middle of the cycle, although the mean velocity remains relatively unchanged, large upstream velocities are observed around
$U_x/U$
). Towards the middle of the cycle, although the mean velocity remains relatively unchanged, large upstream velocities are observed around $0.5\leqslant \,\tau \,\leqslant \,0.7$
. Whereas early in the cycle the chordwise position of the cavity remains relatively stationary, comparison with the supplementary material and the wide field-of-view images indicate that once the cavity reaches its maximum extent and is released, the cavity leading edge migrates upstream during the growth phase prior to the next shockwave. In doing so, nuclei adjacent to the cavity leading edge are pushed forwards, while those farther upstream are less affected. This upstream movement is evident in figure 5(a) at
$0.5\leqslant \,\tau \,\leqslant \,0.7$
. Whereas early in the cycle the chordwise position of the cavity remains relatively stationary, comparison with the supplementary material and the wide field-of-view images indicate that once the cavity reaches its maximum extent and is released, the cavity leading edge migrates upstream during the growth phase prior to the next shockwave. In doing so, nuclei adjacent to the cavity leading edge are pushed forwards, while those farther upstream are less affected. This upstream movement is evident in figure 5(a) at $\tau =0.65$
and appears as a pronounced lump in the space–time diagram of figure 4(a).
$\tau =0.65$
and appears as a pronounced lump in the space–time diagram of figure 4(a).
This upstream motion is followed by nuclei generation, indicated by the large variability of the spanwise velocity at $\tau = 0.7$
. Notably, the mean velocity has already begun to shift downstream as the leading edge retreats at the moment of collapse. Although nuclei are sprayed forwards, the net motion of the surrounding flow is oriented downstream. Consequently, at inception (
$\tau = 0.7$
. Notably, the mean velocity has already begun to shift downstream as the leading edge retreats at the moment of collapse. Although nuclei are sprayed forwards, the net motion of the surrounding flow is oriented downstream. Consequently, at inception ( $\tau = 1$
), nearly all nuclei are moving downstream.
$\tau = 1$
), nearly all nuclei are moving downstream.
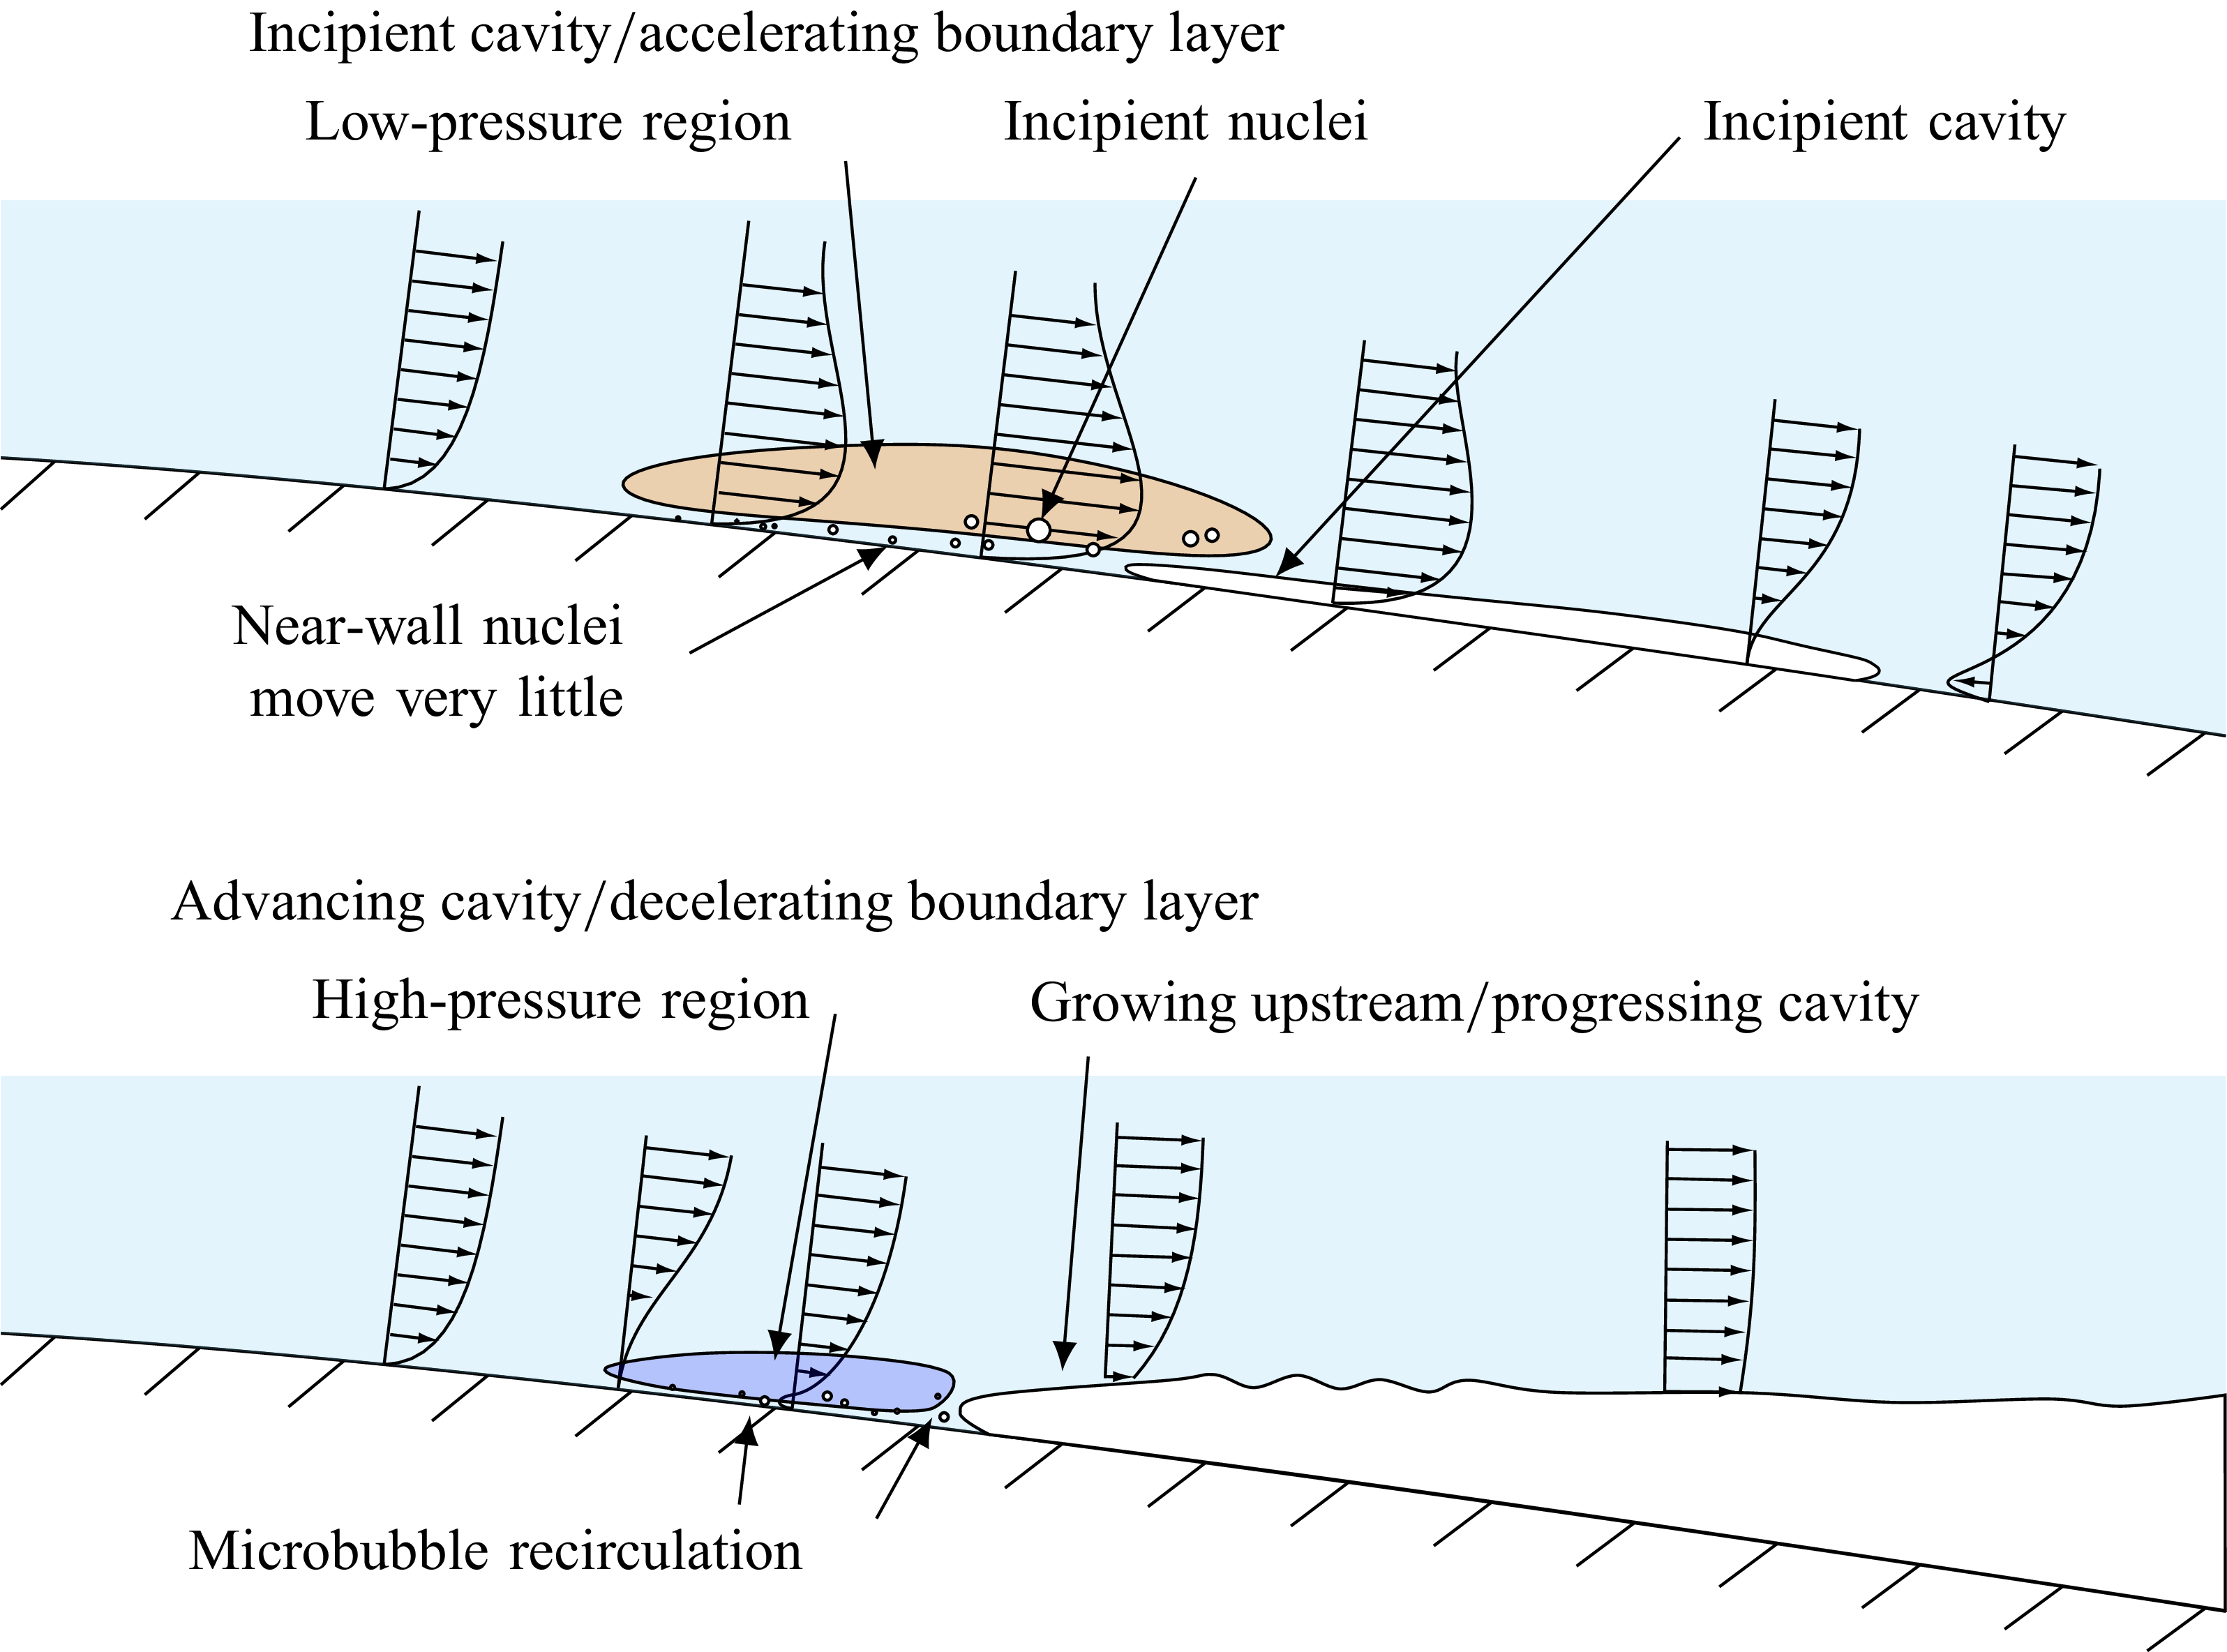
Locally, the advance of the cavity and the movement of the separation location in response to changes in the outer flow resemble the motion of a wall beneath the boundary layer. When combined with supplementary movie 1, this suggests that the separated region thickens as the flow decelerates during the upstream growth of the cavity and thins as the flow accelerates downstream. Although there is limited literature on unsteady boundary layers of this nature, the work of Sears & Telionis (Reference Sears and Telionis1975) provides some insight into the expected behaviour. A schematic diagram illustrating the accelerating boundary layer at inception, and its deceleration as the cavity advances, is presented in figure 6.
Schematic of the flow during incipient and growth phases. For the incipient phase, the flow is virtually single-phase, and the boundary layer is attached and accelerating. Nuclei in the outer part of the boundary layer are accelerated and activated in the favourable pressure gradients. However, nuclei in the near-wall fluid remain unaffected. For the growth phase, all nuclei tend to move in a synchronised way with the cavity leading edge excursions. Both phenomena can be seen in the nuclei trajectories in the space–time plots (figure 4). The location of nuclei within the boundary layer is not to scale, but is meant to highlight their path of acceleration.

Only a small fraction of nuclei initiate each shedding cycle. Supplementary movie 1 indicates that these incipient nuclei tend to separate from their neighbours and migrate downstream shortly before nucleation. After cavity collapse, the low-momentum region appears to thin as part of the accumulated liquid is stripped away. It is within this outer liquid that inception is generally thought to occur.
To quantify this behaviour, the streamwise velocity of 200 incipient nuclei was measured. Nuclei positions were initially estimated manually and then refined to sub-pixel accuracy using a lightweight algorithm. This algorithm applied a mild Gaussian blur prior to bubble binarisation, which was achieved through calculation of the edge gradient. The centroid of the resulting binary region was used as the bubble position. Velocities and phase were determined by tracking each nucleus for 10–14 frames prior to activation. The measurements are superimposed on the binned data in figure 5(a).
Incipient nuclei typically fall within the top 2.5 % in terms of streamwise velocity. A representative velocity–time plot shows that nuclei undergo rapid acceleration just before activation, suggesting that acceleration is accompanied by a localised pressure drop that facilitates nucleation. The acceleration of nuclei is also seen as a curve downstream in the space–time diagrams. At high Reynolds number, nuclei deviate from the trajectories of neighbouring bubbles in the moments preceding activation.
From the space–time diagram (figure 4 b), nucleation appears as a sequence of successive events occurring within a narrow time window during each shedding cycle. Within this window, the location of nucleus activation shifts progressively upstream in time. Two dashed cyan lines have been superimposed on figure 4(b) to guide the eye. This trend is most clearly observed in the wide field-of-view data presented at the beginning of the high-Reynolds-number supplementary movie 1. For comparison with the high-magnification data, see the early shedding cycles shown in supplementary movie 3 demonstrating the construction of the space–time diagram.
Cavities first appear as an oscillatory ‘flapping’ cavity located nearer to the trailing edge, at $x/c \approx 0.625$
, typically just before integer values of
$x/c \approx 0.625$
, typically just before integer values of $\tau$
. The subsequent activation of nuclei that form the cavity’s leading edge occurs later in the cycle and further upstream, towards
$\tau$
. The subsequent activation of nuclei that form the cavity’s leading edge occurs later in the cycle and further upstream, towards $x/c=0.6$
. Nuclei that activate slightly after integer
$x/c=0.6$
. Nuclei that activate slightly after integer $\tau$
often result when the leading edge of the cavity has already begun to form. In such cases, the newly activated nuclei grow downstream, replacing any cavity that had previously been established.
$\tau$
often result when the leading edge of the cavity has already begun to form. In such cases, the newly activated nuclei grow downstream, replacing any cavity that had previously been established.
Therefore, it is the nuclei that activate later in the cycle and further upstream that persist to form the leading edge of the main cavity during the stable growth phase. By tracing the trajectories leading to incipient events in figure 4(b), or by playing the supplementary videos in reverse, it becomes evident that these nuclei typically originate from previous shedding cycles. While these persistent nuclei represent only a small fraction of the total population held in the stagnant region ahead of the cavity – and an even smaller fraction of the microbubbles generated upon cavity collapse – their continued presence across the shedding cycles is clearly visible in the high-speed data and confirmed in the space–time diagram.
There are some unusual occurrences in the overall motion of nuclei that are worth noting. On rare occasions, certain nuclei become pinned to the surface of the model. Two examples are seen in figure 4. For the high-Reynolds-number flow, one bubble becomes pinned prior to the start of the space–time, but nucleates at $\tau =-1.9$
. This appears as a vertical line at the start (top) of the high-Reynolds-number space–time diagram. By becoming fixed to the surface, this bubble is retained further upstream than any other nucleus ahead of the cavity. Eventually, it experiences a sufficiently low pressure to nucleate.
$\tau =-1.9$
. This appears as a vertical line at the start (top) of the high-Reynolds-number space–time diagram. By becoming fixed to the surface, this bubble is retained further upstream than any other nucleus ahead of the cavity. Eventually, it experiences a sufficiently low pressure to nucleate.
A second example of pinning is observed in the low-Reynolds-number flow. The plot for the low-Reynolds-number flow has been split to show that this bubble remains pinned for several shedding cycles. The line traced by the bubble thickens over time, indicating not only that the bubble grows, but also that the local overpressure in the separated region is still supersaturated and is insufficient to suppress diffusive growth. This agrees with similar findings of growth by mass diffusion within the low-momentum/separated region by Ram et al. (Reference Ram, Agarwal and Katz2020), despite the fact that their dissolved gas concentration was much higher $C_\infty = 18.2\,$
mg L
$C_\infty = 18.2\,$
mg L $^{-1}$
. Note that in this experiment, the water was degassed to
$^{-1}$
. Note that in this experiment, the water was degassed to $3\,$
ppm dissolved oxygen or approximately
$3\,$
ppm dissolved oxygen or approximately $30\,\%$
of saturation at atmospheric pressure.
$30\,\%$
of saturation at atmospheric pressure.
Another subtle feature observed in the high-speed video data and supplementary material is an oscillatory motion of bubbles just ahead of the growing cavity, present in both low- and high-Reynolds-number flows. These bubbles appear to ‘bounce’ off the cavity leading edge and oscillate around an invisible line that wraps around the leading-edge cell structures, located slightly upstream of the cavity. This suggests local recirculation within a small-scale, scarf-like vortex. This behaviour highlights a limitation of the space–time diagram representation: the most upstream location of the cavity leading edge does not always contain a nucleus exhibiting this behaviour, making it rare to observe in the space–time diagram. Instead, this behaviour must be seen directly in the supplementary video data. Good examples are found in the low-Reynolds-number case between $\tau = 1.1$
and
$\tau = 1.1$
and $\tau = 1.85$
in the lower half of supplementary movie 2. In the high-Reynolds-number data, the feature is less pronounced but can be discerned between
$\tau = 1.85$
in the lower half of supplementary movie 2. In the high-Reynolds-number data, the feature is less pronounced but can be discerned between $\tau = 2.44$
and
$\tau = 2.44$
and $\tau =2.67$
in supplementary movie 1, or by observing one of the disturbed nuclei at the end of supplementary movie 4, around
$\tau =2.67$
in supplementary movie 1, or by observing one of the disturbed nuclei at the end of supplementary movie 4, around $\tau = 28.32$
, which we discuss next.
$\tau = 28.32$
, which we discuss next.
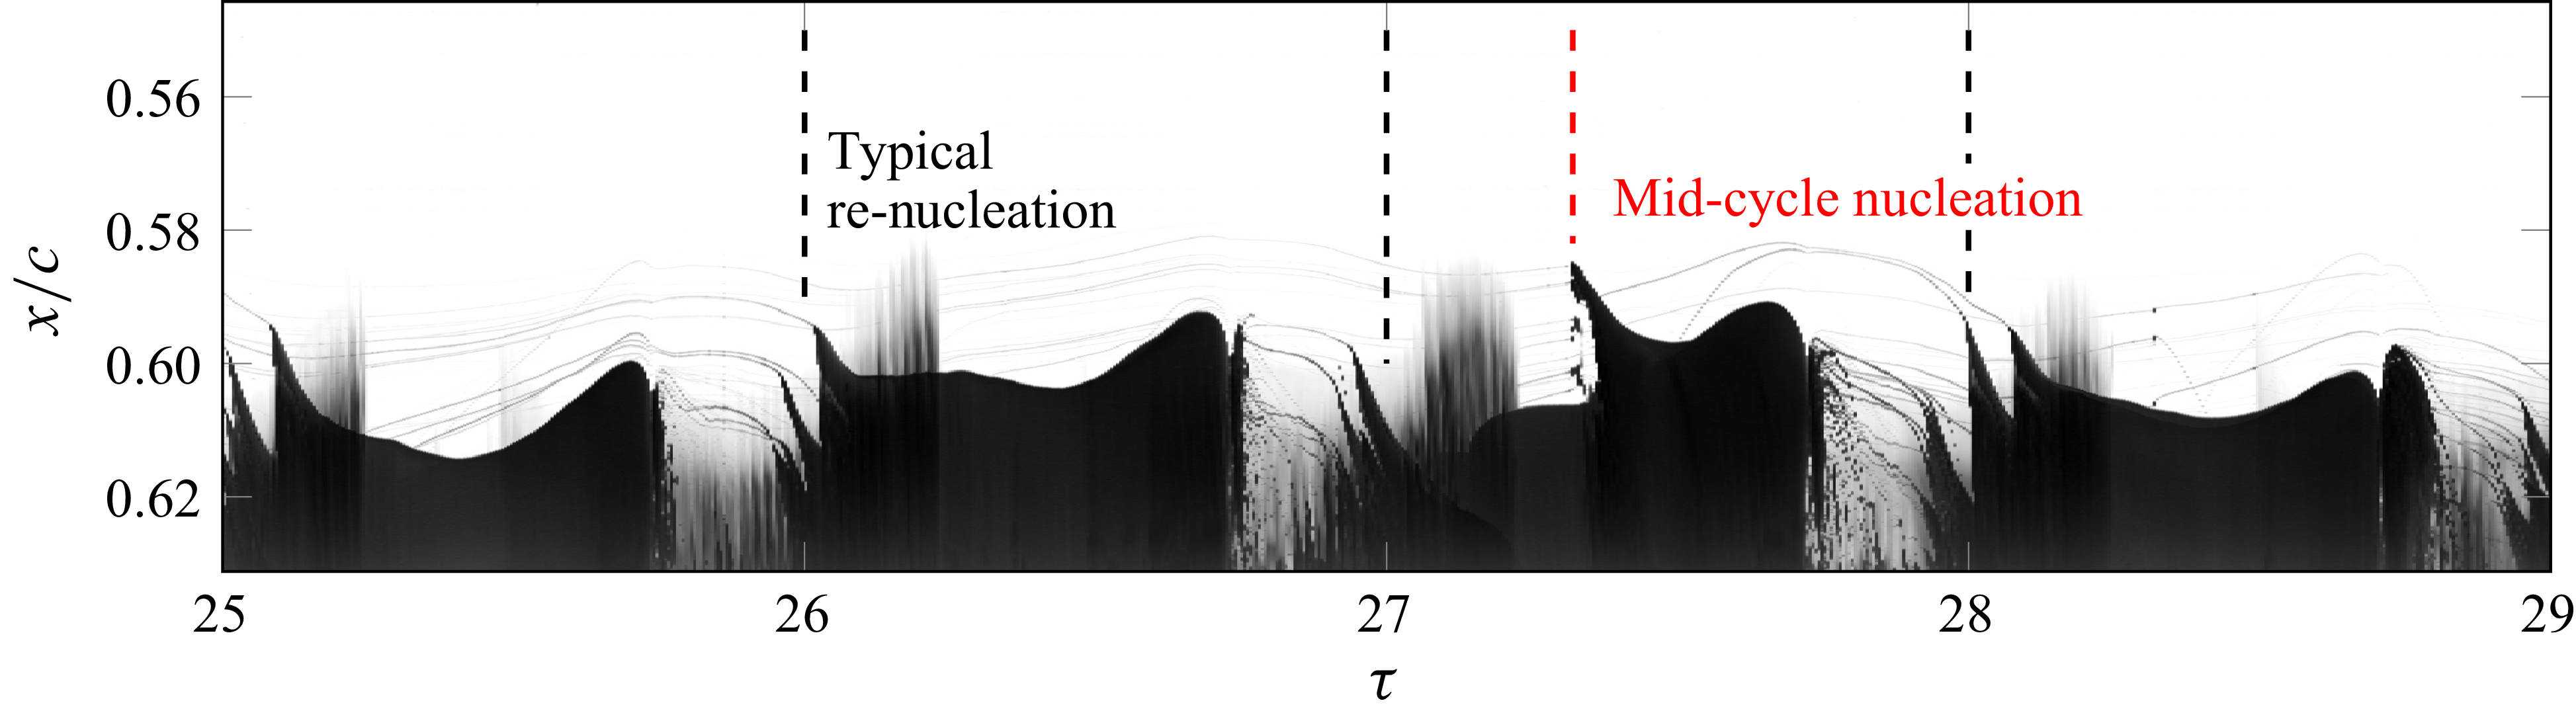
Finally, the high-speed imaging revealed rare instances in which all upstream microbubble nuclei exhibited simultaneous impulsive growth. While most nuclei rapidly returned to a diameter approximately the same as their original size, occasionally, some of these perturbations were strong enough to form a new wave of nucleation. Among the 265 recorded shedding cycles, this transient expansion was sufficiently pronounced in 13 cases to initiate nucleation mid-way through the cycle. This phenomenon is most clearly captured in supplementary movie 4, and is visualised in the space–time diagram presented in figure 7. Less intense disturbances, which did not result in nucleation, appear as dark horizontal lines in the space–time diagram of figure 4, and are shown in greater detail in the blue inset of figure 4(b).
Pseudo-space–time of the magnified footage, which corresponds to supplementary movie 4. During this period, activation of the upstream nuclei occurs in the middle of the macro scale shedding cycle. This low-pressure event causes all the upstream microbubble nuclei to momentarily grow in size, some of which nucleate. The plot has been re-oriented so that the direction of flow is now from top-to-bottom.

Initially, this behaviour was attributed to potential flexing of the acrylic model. Consequently, a limited dataset with a rigid stainless steel model of identical section profile was acquired. Similar mid-cycle nucleation events and transient bubble growth upstream of the cavity were observed, albeit with slightly reduced frequency. However, part of this discrepancy may be due to difficulties in achieving comparable illumination conditions with an opaque geometry. Furthermore, these events occur at mid-chord and above, whereas if due to fluid–structure interactions, a bias towards the tip would be expected where deformations would be greatest.
An alternative hypothesis is that the collapse of shed clouds of cavitation in the wake of the model generate pressure waves that interact directly with the upstream microbubble nuclei. Such impulsive pressure fluctuations and rarefaction waves are known to be produced by the collapse of large cavity volumes shed into the wake, as measured by Reisman, Wang & Brennen (Reference Reisman, Wang and Brennen1998) and described by Schnerr et al. (Reference Schnerr, Schmidt, Sezal and Thalhamer2006, Reference Schnerr, Sezal and Schmidt2008). With each new cycle, the cavity grows just beyond the trailing edge before triggering the condensation shock wave that propagates upstream. At the same time, a cloud or clouds are shed downstream. We believe it is the condensation and collapse of these shed clouds that provide the pressure wave causing the mid-cycle nucleation.
Mid-cycle nucleation or nucleation from pinned nuclei are comparatively rare. More generally, nucleation occurs within a narrow spatio-temporal window within a shedding cycle enabled by the presence of a persistent population of microbubbles upstream. This process is not consistent with random nucleation. Instead, these observations suggest the presence of a coherent, evolving pressure field associated with unsteady laminar boundary layer separation, flow acceleration, local pressure minima and the presence of the cavity. These microbubble nuclei are generated during collapse of the cavity such that in the absence of surface or free stream nuclei, re-nucleation associated with cloud cavitation from an unsteady sheet cavity originates from microbubbles intrinsically generated by condensation shock wave phenomena. Some of these microbubbles may persist for several shedding cycles before eventually serving as cavitation nuclei.
4. Conclusion
Remnant microbubbles are generated from shockwave driven cyclic condensation/cavity extinction. The overall majority are large and immediately advected downstream. A smaller population remain in the near-wall stalled or separated flow upstream of the nominal cavity leading edge, but downstream of the boundary layer separation. At both Reynolds numbers tested, nuclei of order 10–100 microns persist un-activated throughout the cavity shedding cycle, implying this region to be above vapour pressure. This indicates an overpressure associated with the local viscous flow between the laminar separation upstream and the cavity. To explain this observation, a 2-D potential flow calculation of a stable supercavity was employed. The region between boundary layer separation and cavity detachment was modelled with a small ramp, and the pressure coefficient along this streamline increased above vapour pressure on the ramp. This challenges the typical assumption that the flow ahead of the cavity is in metastable tension. While this is often true near the surface upstream of boundary layer separation, between separation and cavity detachment, the separated region is observed to be above vapour pressure.
Within this region, nuclei may be transported upstream and downstream, or rarely become momentarily pinned to the surface, before one of several eventual outcomes. These include transport by pressure gradients, advection downstream and bulk motion within the stalled fluid ahead of the cavity leading edge depending on the Reynolds number. Ultimately, the bubbles are transported downstream where they may coalescence together, or with the cavity, or nucleate depending on phasing with the cavity shedding cycle. The activated nuclei form streaks that grow to become individual cells within the contiguous leading edge before their cyclic breakup with subsequent shockwave passage.
At low Reynolds numbers, simultaneous upstream and downstream motion of bubbles at similar spanwise locations reveals recirculating fluid. At higher Reynolds numbers where the stalled fluid layer is much thinner, these simultaneous motions do not occur. In this case, the sustained bubble population reveal a cyclical near-bulk motion of the stalled fluid upstream of the cavity leading edge. That is, the dynamics of the captured nuclei population is dominated by the advance and retreat of the cavity leading edge as opposed to buoyancy and/or advection.
Nucleation typically occurs in the moments after shockwave passage/cavity condensation in association with the accelerating boundary layer. The extent of condensation depends on Reynolds number and is only partial for the low-Reynolds-number case. Nucleation usually occurs in a cascade of successive events. Events upstream and later within the cycle quickly grow downstream, sweeping away any previously established incipient cavities, and progress to form the new leading edge. The leading edge of new cavities migrate upstream during the growth phase prior to the next shockwave.
Generally, activated nuclei undergo acceleration, relative to other nuclei that remain unaffected, indicating that they are further from the wall or outside the near-wall stalled fluid. Acceleration of the flow and associated thinning of the separated region lead to these nuclei being stripped away and with downstream advection, they progress to nucleation. A large part of the captured population is often present for several cycles and overall, these are modulated with time depending on the balance of production and advection. This also demonstrates that if the nuclei are deep within the near-wall stalled fluid, they can be sustained for several cycles. Taken together, these observations show that the self-sustaining cavitation mechanism is not limited to laminar separation regimes, but can also arise from shock-driven cloud collapse – highlighting its broader relevance across cavitation phenomena.
In addition to the mechanisms associated with the local flow dynamics, random nucleation events can be seen to occur at any phase of the shedding cycle due to pressure wave passage in the liquid phase apparently associated with downstream collapse of shed cavity volumes. This work demonstrates that the sustained production of nuclei is an intrinsic aspect of sheet cavitation with shockwave driven cavity extinction. Re-nucleation of an energetic sheet cavity can be sustained in the absence of external nuclei sources such as from the free stream or any surface mechanisms. The dynamic evolution of the nucleation process leads to the formation of the cellular leading edge prior to passage of the successive shockwaves.
Supplementary movies
Supplementary movies are available at https://doi.org/10.1017/jfm.2025.10995.
Declaration of interests
The authors report no conflict of interest.


 Open access