


1. Introduction
Changes in glacier extents and surface elevations are widely recognized as reliable evidence of global climate change. In the inner tropics, glacier retreat has been documented since their maximum extent of the Little Ice Age (LIA) (Hastenrath, Reference Hastenrath1981), with a marked acceleration beginning in the late 1970s (Rabatel and others, Reference Rabatel2013). However, the rate of retreat has varied from glacier to glacier depending on morphoclimatic factors. For example, the current equilibrium-line altitude (ELA) is estimated at approximately 5100 m a.s.l. in this region (Basantes-Serrano and others, Reference Basantes-Serrano2016), making glaciers residing below 5400 m a.s.l. particularly vulnerable, even if they are close to the moisture streams coming from the Amazon (Basantes-Serrano and others, Reference Basantes-Serrano2022). These low elevation glaciers, as is the case of the Carihuairazo Ice Cap (5000 m a.s.l.), often lack a permanent accumulation zone, which limits the supply of solid precipitation to feed the glacier and cannot compensate for melting in the lower reaches, leading to their rapid decline.
Based on detailed observations of the geomorphological features of the Chimborazo and Carihuairazo massifs, Clapperton (Reference Clapperton1990) identified three main glacial periods in the area: a full-glacial stage (c. 30 000–14 000 yBP), a late-glacial stage (12 000–10 000 yBP) and a neoglacial stage (within the last 5000 years).
Beyond sporadic estimates of glacier surface area of 0.78 km2 in the early 1980s (Jordan and Hastenrath, Reference Jordan and Hastenrath1998) and 0.015 km2 in 2017 (Rosero and others, Reference Rosero2021), to the best of our knowledge, there has been no detailed study of the long-term evolution of the Carihuairazo Ice Cap. In particular, no study has focused on quantifying changes in ice volume.
In addition, mountains in this region have a deep environmental, social and spiritual significance for the indigenous communities who consider the ice caps as sacred and crucial source of water for agriculture, livestock and daily life (Rhoades, Reference Rhoades2009; Yépez, Reference Yépez2017). Glaciers of Carihuairazo volcano were also perceived as sources of perpetual snow by explorers and a source of inspiration for artists in the 18th and 19th century (Francou, Reference Francou, Deler and Mesclier2004).
Based on high resolution geodetic data, this study aims to document and analyze the recent evolution of the Carihuairazo Ice Cap since the mid-1950s. The study also explores the broader cultural implications of this lost glacier for the local communities. This study contributes to the Global Land Ice Measurements from Space initiative, which highlights the importance of tracking extinct glaciers, i.e., those that have disappeared or lost their status as glaciers within the past century (Raup and others, Reference Raup, Andreassen, Boyer, Howe, Pelto and Rabatel2025). Documenting the extinction of Carihuairazo Ice Cap illustrates the irreversible nature of glacier loss and provides information for estimating cascading effects on water security and natural hazards in this region. These objectives align closely with the goals of the International Year of Glacier Preservation led by the United Nations, which seeks to highlight the vulnerability of mountain ecosystems and raise global awareness about the consequences of continued ice loss.
2. Study area
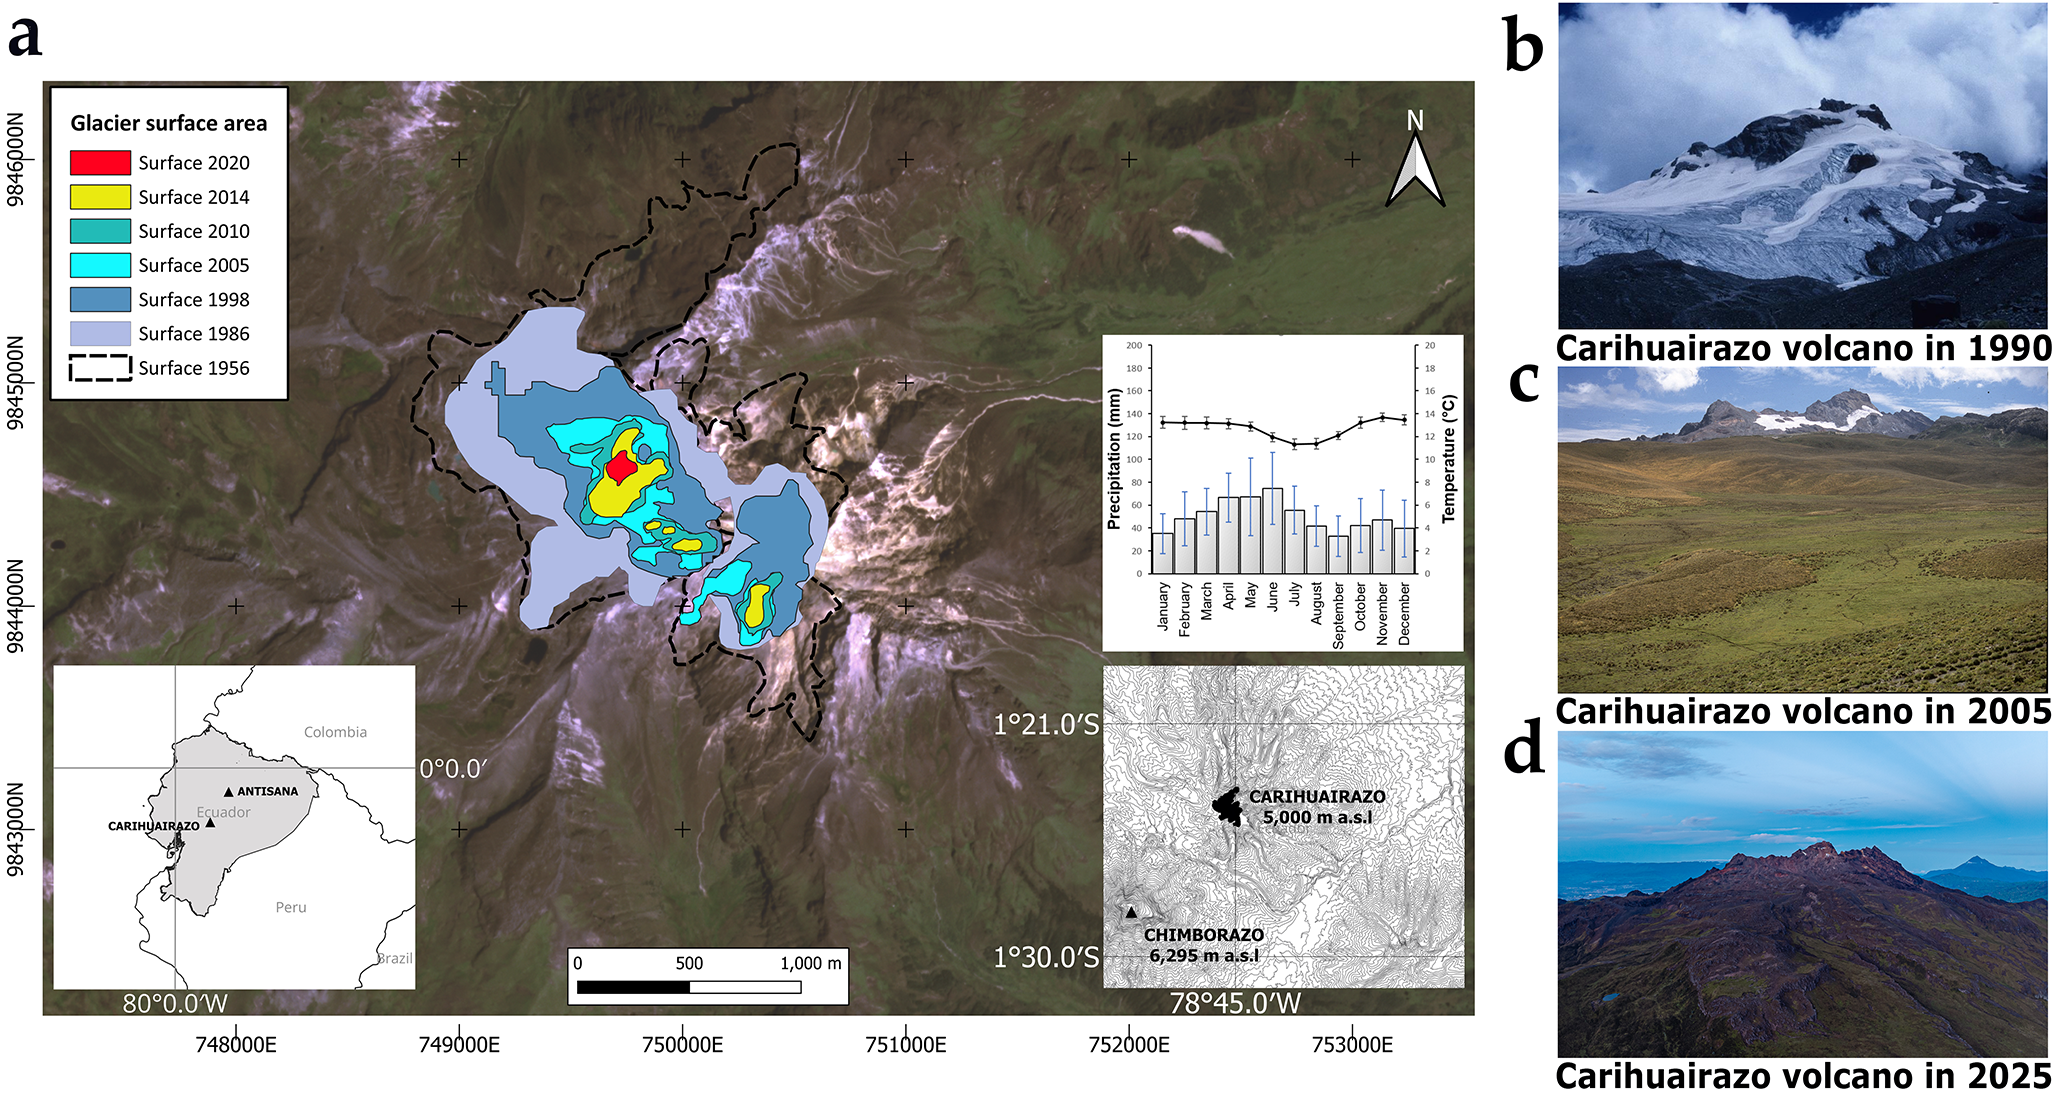
Carihuairazo Ice Cap (1.40°S, 78.75°W; 5000 m a.s.l), known in Quichua as Kari-Huayra-Razu, meaning ‘Lord of the Wind and Snow’, is situated in the Cordillera Occidental of Ecuador. It lies 20 km southwest of the city of Ambato in Tungurahua Province and 30 km northwest of the city of Riobamba in Chimborazo Province. Carihuairazo volcano is adjacent to the ice capped Chimborazo volcano (6295 m). They are part of one of the largest central volcanic complexes in the northern Andes, built predominantly by effusive eruptions of high-silica andesite, later evolving to dacite and rhyolite, with cone collapse and debris avalanches (Clapperton, Reference Clapperton1990). Carihuairazo volcano was formed between 230 000 and 150 000 years ago (Samaniego and others, Reference Samaniego2022). Volcanic activity ceased prior to 11 000 yBP (Clapperton, Reference Clapperton1990). The volcanic cone of Carihuairazo massif covers an area of approximately 150 km2. It has a circular base, with a remnant caldera that gives it an asymmetrical shape, marked by peaks oriented towards the northwest (Figure 1).
(a) Glacier extents of Carihuairazo Ice Cap in the 1956–2020 period. The background image is a RGB true color composite of PlanetScope 3 m ortho-image (Imagery © 2025 Planet Labs PBC). The inset maps show the geographical context of the Carihuairazo and Antisana ice caps. An additional inset map shows the location of the Carihuairazo Ice Cap (black polygon), with contour lines displayed at 40-m intervals. The climatogram presents mean monthly temperature (black dots and line) and precipitation (gray bars) for the period 1988–2018, using data from the Querococha (M258) weather station; vertical bars indicate one standard deviation. Panels on the right show the glacier extent in (b) 1990 (M. Cruz), (c) 2005 (A. Soria) and the (d). Now ice-free bedrock in 2025 (A. Soria), respectively. Photos of the landscape were taken from different locations in the Abraspungo Valley, in the western part of the Carihuayrazo volcano, near a site known as Mechaguasca.

Temperature is relatively stable year-round in this region (La Frenierre and Mark, Reference La Frenierre and Mark2017). Between 1988 and 2018, the average annual temperature was approximately 13°C, and the mean annual precipitation was around 605 mm, based on records from the Querococha weather station (M0258; 2865 m a.s.l.), located 17 km east of the ice cap (Figure 1). In the 1970s, the average altitude of the 0°C isotherm was 4700 m, the eastern side of the massif appeared to be 0-5°C cooler at 3600 m altitude than the western side as a result of more persistent cloud cover. Here, the 0°C isotherm probably lies at 4400 m (Graf, Reference Graf1976). The estimated temperature lapse rate at that time was 0.65°C/100 m up to 3600 m, and 0.75°C/100 m close to the summit. More recently, data from the Glacier Chimborazo weather station (M5151, 4428 m a.s.l.) show a mean annual temperature of 0.7°C between 2016 and 2020 (Figure 1) (Hidalgo and others, Reference Hidalgo2024). Estimating a current lapse rate of 0.75°C/100 m, the elevation at which the annual mean temperature reaches 0°C fluctuates between 4650 m to 4850 m. The two weather stations are managed by the Instituto Nacional de Hidrología y Meteorología (INAMHI, Ecuador).
Two distinct wet seasons can be seen, one from April to June, and a second with maximum precipitation in November, while the dry seasons occurs between July and October (Figure 1). This seasonal cycle is linked to the movement of the Intertropical Convergence Zone and strongly influenced by the local topography. The interannual variability of ice mass balance is expected to be driven by the El Niño–Southern Oscillation, as observed at Glacier Antisana 15α (Francou and others, Reference Francou, Vuille, Favier and Cáceres2004), an extensively monitored glacier that is part of the Antisana Ice Cap, located 115 km northeast of the Carihuairazo Ice Cap. However, it seems that the regional moisture flow from the Amazon basin does not directly affect the Carihuairazo Ice Cap, unlike the Antisana Ice Cap in the Cordillera Real, in which the terminus of the Amazonian glaciers facing east can be seen 200 m lower than the western glaciers (Basantes-Serrano and others, Reference Basantes-Serrano2022).
In the 1980s, Hastenrath (Reference Hastenrath1981) identified nine glacier tongues and Clapperton (Reference Clapperton1990) estimated the ELA of the Carihuairazo Ice Cap to range between 4805 m on the western side, where the glacier limit was at 4650 m and 4740 m on the eastern side, where the glacier limit was at 4,550 m.
3. Data
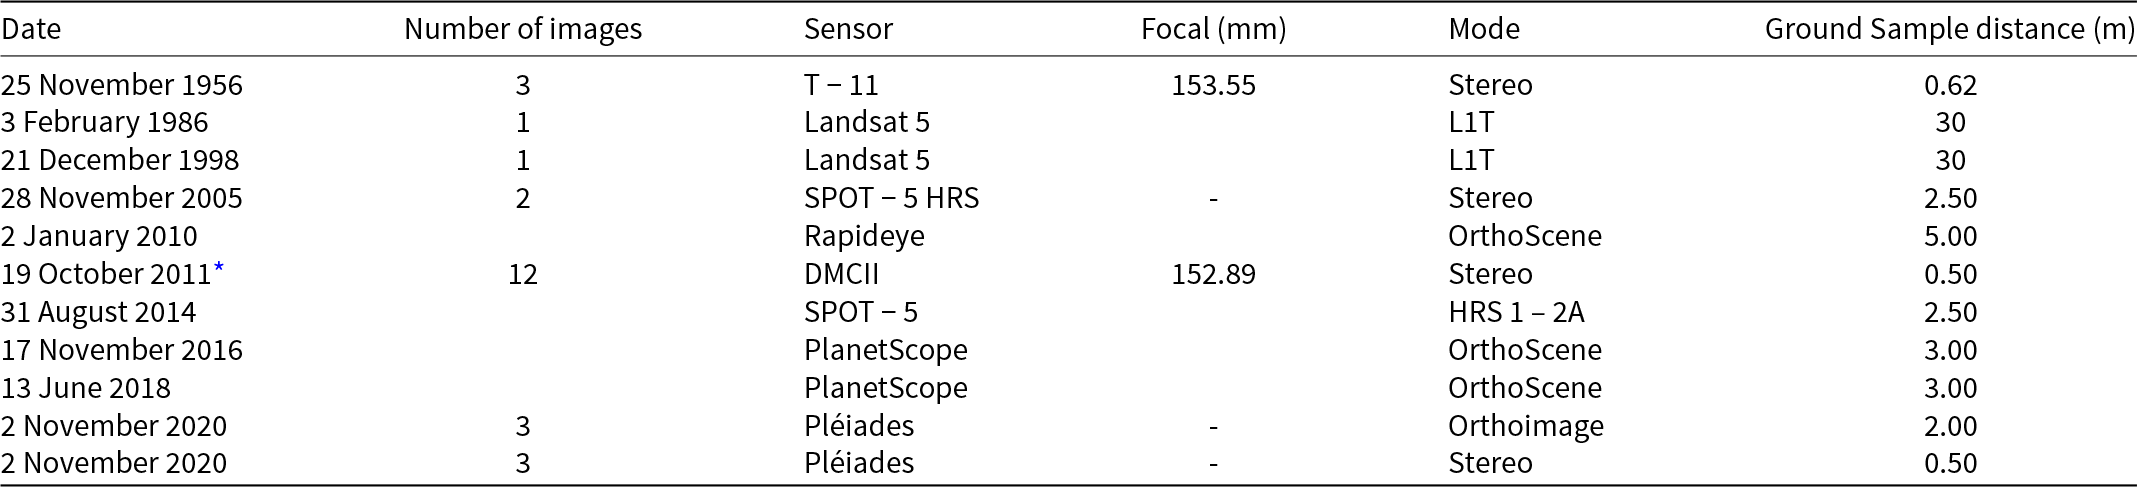
Aerial photographs and satellite images were used to map the glacier surface topography on the Carihuairazo Ice Cap since 1950s (Table 1). The first aerial surveys with mapping purposes were conducted by Instituto Geografico Militar (IGM, Ecuador) in the early 1950s with technical support from the Inter American Geodetic Survey, IAGS. The films were scanned using an Intergraph PhotoScan TD system to 20 μm. In addition, three aerial surveys were conducted in 1962, 1979 and 1989. However, the aerial surveys from 1962 and 1989 could not be used for glaciological applications due to overexposure. This affected the quality of the photographs, making it impossible to accurately identify the boundaries of the glaciers. The images from the 1979 aerial survey were not available for this study. All original aerial photos and sensor parameters were rescued.
Satellite data used in this study, spatial resolutions ranging from 0.5 m (high resolution) to 30 m (moderate resolution).

* geodetic reference used to validate the xyz-consistency of the elevation data set.
In 2011, Ecuadorian government conducted an extensive aerial survey to produce high resolution digital elevation models (DEMs) and orthophotos with a positional accuracy of approximately 1 m across the entire country. These data were used as a geodetic reference to validate the geometric consistency of the entire geodetic datasets.
Stereo images from the SPOT-5 satellite were downloaded free of charge through the SPOT World Heritage project. These images are particularly advantageous for glaciological applications due to the sensor’s high stereoscopic sensitivity (B/H ratio of 0.8), which enhances its ability to capture complex topography in mountainous environments (Berthier and Toutin, Reference Berthier and Toutin2008). Pléiades stereo data were acquired as part of the ISIS program of the French Space Agency, under the Pléiades Glacier Observatory initiative (Berthier and others, Reference Berthier2014).
To document the surface area evolution of the ice cap, terrain-corrected satellite images from multiple optical sensors were used to delineate glacier boundaries on different dates. The spatial resolution of these products ranged from 0.50 to 30 m (Table 1).
4. Methods
4.1. Digital elevation model generation
The photogrammetric workflow was implemented using the Leica Photogrammetry Suite of the Intergraph Company©. The 1956 aerial photogrammetric block was adjusted using an average of 5000 tie points for each pair of stereo images and a set of eight ground control points (GCPs) well distributed across the area. GCPs were triangulated from the 2011-aerial survey by selecting well-defined stable geomorphological features clearly visible in both aerial surveys (Papasodoro and others, Reference Papasodoro, Berthier, Royer, Zdanowicz and Langlois2015). The 2011-DEM supplied the vertical component, while the 2011-orthophoto provided the horizontal component.
The GCPs were then incorporated into the photogrammetric workflow and used in a bundle block adjustment to geometrically correct and accurately align the 1956-aerial photos, achieving accuracy comparable to those obtained with modern high-resolution digital cameras or satellite sensors, i.e., a mean error ∼ 0.3 m in x-y component and ∼ 0.6 m in z component. Due to the low contrast, shadows, and saturation effects present in the 1956 photographs, a manual photogrammetric restitution approach was employed to collect 3D point clouds, consisting of approximately 2500 samples selected following the Spatial Sampling Design proposed by Basantes-Serrano and others (Reference Basantes-Serrano, Rabatel, Vincent and Sirguey2018).
Likewise, DEMs were generated from satellite stereoscopic data using the automatic Ames Stereo Pipeline, which is an open-source software developed by NASA’s Ames Research Center (Beyer and others, Reference Beyer, Alexandrov and McMichael2018). Pléiades and SPOT imagery were processed following Cusicanqui and others (Reference Cusicanqui2023); relative orientation of the stereo pairs was determined using the Rational Polynomial Coefficients provided as ancillary metadata. The DEMs were subsequently derived using the Semi-Global Matching strategy, following the parameterization proposed by Deschamps-Berger and others (Reference Deschamps-Berger2020).
All the DEMs generated were resampled to a spatial resolution of 10 m. To evaluate the spatial consistency between DEMs, the standard co-registration method was applied (Nuth and Andreas, Reference Nuth and Andreas2011). To minimize vertical offsets between different datasets, the 2011 geodetic data was selected as the geodetic reference because of its accuracy and detailed topographic representation. The co-registration procedure was explained in detail in Basantes-Serrano and others (Reference Basantes-Serrano2022). Then, DEMs were used to correct distortions caused by terrain relief and sensor viewing geometry, resulting in orthorectified images with uniform scale and geometry, suitable for delineating of glacier boundaries using semi-automatic approach described by Paul and others (Reference Paul2017).
4.2. Geodetic mass balance computation
First, when DEMs were available, surface elevation changes were derived by directly differencing the sequential DEMs. On the contrary, for the 1956–2005 period, the elevation change was estimated at individual 3D point clouds restituted on 1956 photogrammetric block. The resulting elevation difference point cloud was interpolated into a continuous surface using universal kriging, allowing for spatially distributed elevation change calculations (Basantes-Serrano and others, Reference Basantes-Serrano, Rabatel, Vincent and Sirguey2018).
For all the periods, the geodetic mass balance was calculated using the following equation:
 \begin{equation}{B_g} = \left( {\bar \rho {\text{ * }}{r^2}{\text{ * }}\mathop \sum \limits_{i = 1}^p \Delta h\left( {{x_i}} \right)} \right)/\bar S\end{equation}
where  $\bar \rho $ is the average density value of 850 kg m−3 (Huss, Reference Huss2013), $r$ is the pixel size, $\Delta h$ is the change in glacier surface elevation at each location $\,{x_i}$, p is the number of pixels covering the glacier at its maximum extent. Pixel counts were obtained by converting raster pixels to points in a GIS platform. Only valid data were considered, and gaps or NaN values were excluded. The points were not re-gridded. $\bar S$ is the glacier surface area averaged over the period between the date of the first aerial survey and date of the second aerial survey.
5. Results and discussion
5.1. Co-registration of the geodetic data
Table 2 reports the results obtained before and after 3D co-registration was applied (Nuth and Kaab, Reference Nuth and Andreas2011; Zemp and others, Reference Zemp2013). The mean standard error of the elevation difference was 0.01 m, ensuring good agreement between the geodetic reference and the other DEMs, while reducing displacement in the XYZ location of successive DEMs caused by differences in sensor acquisition geometry.
Differences in average elevation and its standard deviation over the off-glacier terrain before [ ${\overline {dh} ^{\text{'}}};{ }\sigma {\text{'}}$] and after [ ${\overline {dh} ^{{\text{''}}}};{ }\sigma {\text{''}}$] the co-registration, computed over the total surface ( $dh$-samples) for the three periods.

The average standard error after adjustment [Se] are given.
5.2. Surface area change (1956–-2024)
Figure 2 shows the evolution of the glacier surface area during the study period. Unfortunately, high resolution data are not available between 1956 and 2005 to precisely document the evolution of glacier extents. Consequently, surface area changes during this period were taken from estimates made by Jordan and Hastenrath (Reference Jordan and Hastenrath1998) in 1979 based on aerial images which were not available for this study, and moderate-resolution Landsat imagery in 1986 and 1996. The image in 1986 was affected by cloud coverage, which hinders the accurate delineation of the glacier surface area. In contrast, the 1996 satellite imagery shows full ice coverage, which helps to precisely delineate the glacier boundary (see Supplementary Material).
Surface area change observed on Carihuairazo Ice Cap from different remote sensors (black circles and line) and observed on Antisana Ice Cap by Basantes-Serrano and others (Reference Basantes-Serrano2022) (gray circles and line). The surface area estimated by aerial photogrammetry using STEREOCORD is shown as a red point (Jordan and Hastenrath, Reference Jordan and Hastenrath1998), while blue points show the surface area estimated by using Landsat 5 imagery. Green points indicate the ice-patch area derived from GPS measurements reported by Vaca-Cárdenas and others (Reference Vaca-Cárdenas, Muñoz-Jácome, Vaca-Cárdenas, Cushquicullma-Colcha and Guerrero-Casado2025).

Furthermore, glacier surface areas reported by Vaca-Cárdenas and others (Reference Vaca-Cárdenas, Muñoz-Jácome, Vaca-Cárdenas, Cushquicullma-Colcha and Guerrero-Casado2025), collected with a handheld, single-frequency GPS device with a positional accuracy of ∼ 3 m, were incorporated into this study as complementary information for documenting the final stages of the glacier between September 2023 and January 2024.
Uncertainty in glacier boundaries is expressed as a percentage estimated by the following equation  ${\sigma _{{S_t}}} = \frac{{P \cdot \,r}}{{{S_t}}} \cdot 100$, where $P$ is the perimeter of the polygon, $r$ is the pixel size, and ${S_t}$ is the glacier surface area for a given date. It is noteworthy that it was not possible to estimate the uncertainty of the 1979 glacier surface area because the raw aerial images were not available.
The observed change of the Carihuairazo Ice Cap reveals the rapid retreat of the glacier over the past decades. Between 1956 and 2020, the glacier lost 99.5% of its surface area over 64 years. The apparent increase in surface area from 0.78 km2 in 1979 to 1.32 km2 in 1986 may be related to favorable climatic conditions, similar to those observed at the Antisana Ice Cap (Basantes-Serrano and others, Reference Basantes-Serrano2022). However, this temporary growth did not offset the overall negative trend observed since the 1990s, when the area declined at a linear rate of about 3% a−1. Considering a minimum surface area of 0.01 km2, which is a practical threshold below which an ice body may remain non-flowing and thus not qualify as a true glacier (Leigh and others, Reference Leigh, Stokes, Carr, Evans, Andreassen and Evans2019), this ice body can no longer be considered a glacier after 2020.
During the similar period, Antisana, which is a larger ice cap situated at a higher altitude (5690 m), has undergone a less severe reduction in glacier surface area, losing 43% of its surface area. In contrast, Carihuairazo Ice Cap lies at a lower elevation (4650 m) than the current 0°C isotherm (4750 m). This has left a large portion of its glacier exposed to above-freezing temperatures and rainfall, making it highly sensitive to climatic fluctuations (Basantes-Serrano and others, Reference Basantes-Serrano2022). Consequently, ablation processes intensify while accumulation diminishes, resulting in an overall loss of ice mass.
During the final months of its existence, the ice patch lost mass at a rate of 0.11 m w.e. per month between September 2023 and January 2024, ultimately leading to its complete disappearance (Vaca-Cárdenas and others, Reference Vaca-Cárdenas, Muñoz-Jácome, Vaca-Cárdenas, Cushquicullma-Colcha and Guerrero-Casado2025). It is important to note that the uncertainty associated with these estimates extends into negative values, indicating that the error exceeds the magnitude of the measured area. This does not imply the presence of a physically negative surface area, but rather that the remaining ice extent lay within the measurement uncertainty.
5.3. Geodetic mass balance fluctuation
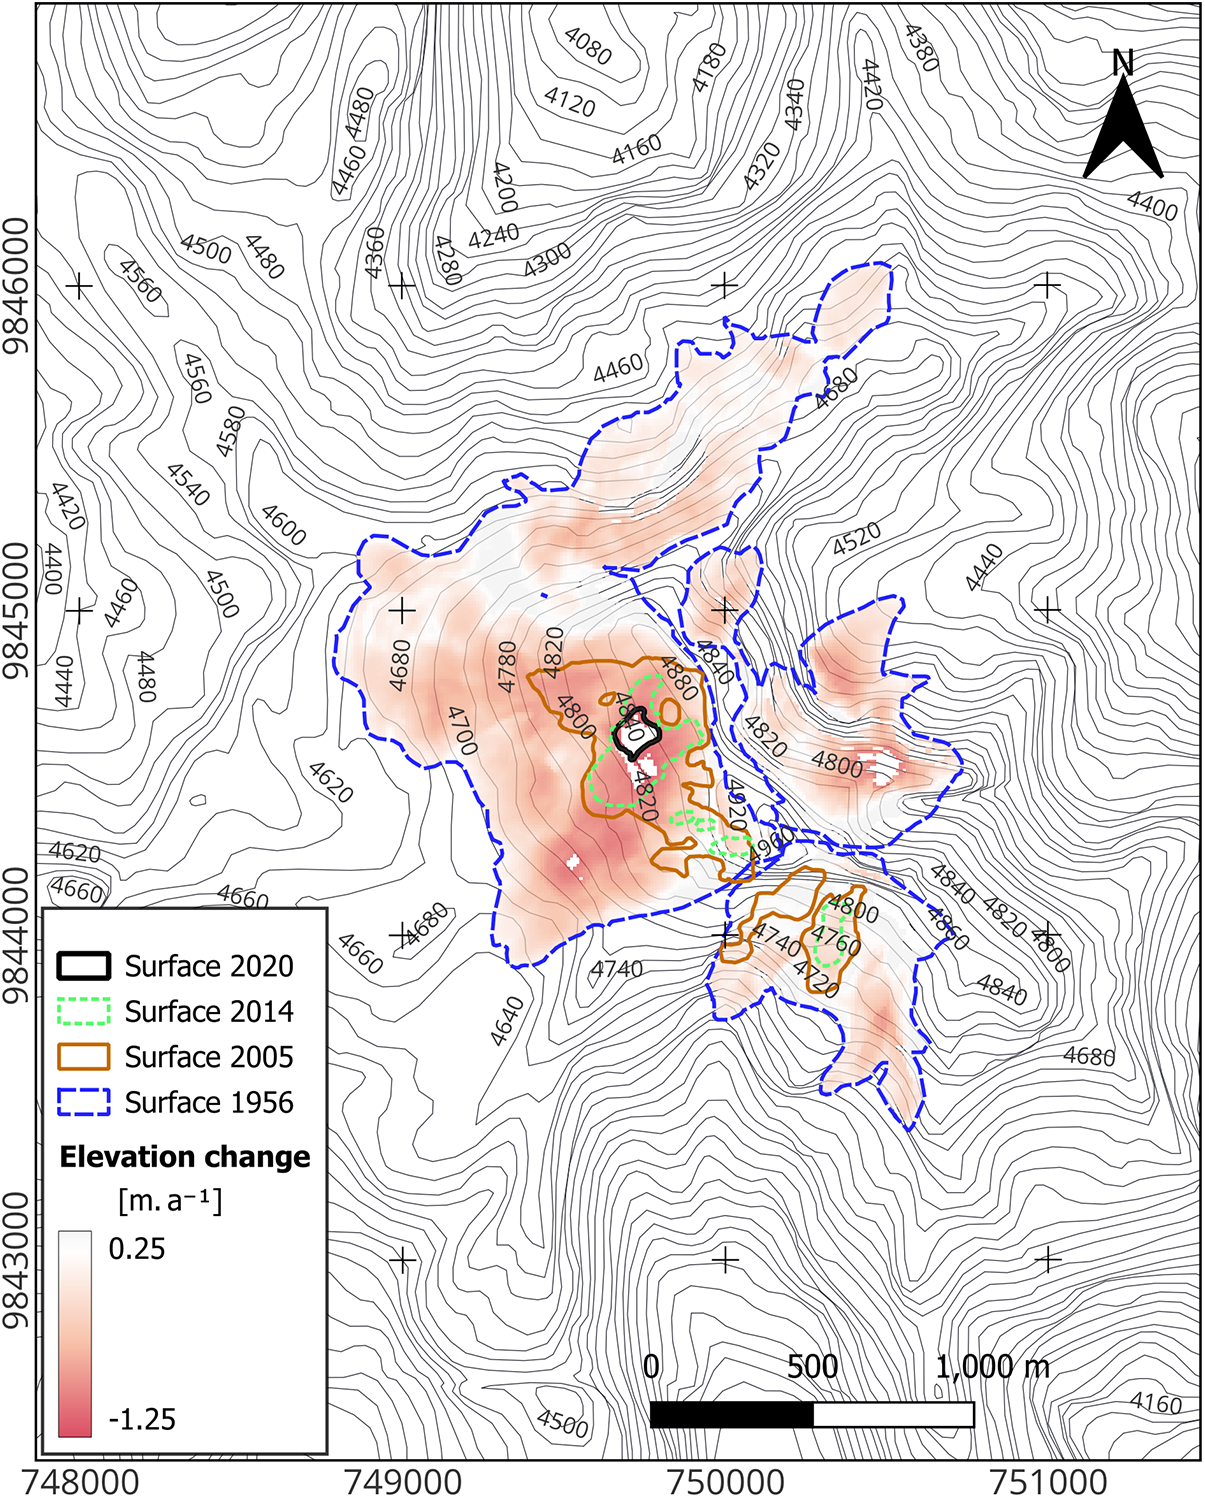
Surface elevation lowering prevails in all the periods everywhere on the glacier. The average elevation change for the entire period (1956–2020) is − 24.43 m which represents an average ice mass loss of − 0.49 ± 0.04 m w.e. a−1 (Figure 3). The fluctuation is given in three subperiods based on the availability of aerial surveys. During the first period (1956–2005), the glacier experienced a comparatively lower mass loss rate of − 0.41 ± 0.01 m w.e. a−1. This was followed by an accelerated phase of ice loss between 2005 and 2011, with a much higher rate of − 0.77 ± 0.07 m w.e. a−1. In the final subperiod (2011–2020), the mass loss remained substantial at − 0.75 ± 0.03 m w.e. a−1.
Spatial distribution of the annual average elevation changes on the Carihuairazo Ice Cap from 1956 to 2020. Glacier boundaries in 1956, 2005, 2014 and 2020 are shown in blue, brown, green and black line, respectively.

Broadly, the pattern of ice mass loss observed at the local scale is consistent with regional trends reported in previous study (e.g. Hugonnet and others (Reference Hugonnet2021)) (see Supplementary Material).
5.4. Vanishing of an equatorial glacier
Our results reveal a persistent negative trend in ice mass fluctuations, with an acceleration in mass loss beginning in 2005. This highlights an intensified period of tropical glacier shrinkage in recent decades.
Climate observations at the site reveal a warming trend of approximately 0.11°C per decade, accompanied by shifts in precipitation patterns and a decrease in total annual rainfall (La Frenierre and Mark, Reference La Frenierre and Mark2017). Also, the elevation of the freezing level has risen by about 300 m since the 1990s, resulting in rainfall increasingly replacing snowfall on the glacier surface. This change enhances ablation processes and accelerates ice loss.
Meanwhile, the potential for accumulation has been reduced to small areas above the current freezing level height of 4750 m, where steep slopes prevail (averaging around 60°), hindering snow deposition and preventing the development of significant glacier tongues and ice flow paths (Paterson, Reference Paterson1994; Benn and Evans, Reference Benn and Evans2014). Indeed, the summit of Carihuairazo Ice Cap reaches only 5000 m a.s.l., placing it below the critical altitude threshold where tropical glaciers become particularly vulnerable; glaciers situated below 5400 m often lack a permanent accumulation zone (Rabatel and others, Reference Rabatel2013).
Likewise, volcanic activity has played a significant role in shaping the massif’s irregular and asymmetric form (Samaniego and others, Reference Samaniego2022), influencing the distribution of the glaciers. Multiple volcanic collapse events created a large caldera opening toward the northeast, resulting in steep, cliff-dominated slopes on the eastern side. In contrast, the western side has broader, gentler topography (Samaniego and others, Reference Samaniego2022), favoring snow retention and more stable glacier formation. Moisture from the Amazon Basin arrives with southeasterly winds, producing a sharp east–west precipitation gradient. The northeastern slopes receive around 2000 mm of precipitation per year, whereas the southwestern slopes receive approximately 500 mm (La Frenierre and Mark, Reference La Frenierre and Mark2017). Despite the higher precipitation and colder conditions on the eastern side, glacier growth is limited due to steep, unstable terrain. Meanwhile, the drier western slopes, although experiencing greater ablation under clearer skies, offer more favorable topography that supports glacier formation. As a result, glaciers on the eastern side of the Carihuairazo Ice Cap were smaller and less developed than those on the western side, due to a combination of asymmetric mountain geometry and climate.
The highest rate of mass loss observed in this study occurred from 2005 to 2011, which coincided with the eruptive period of the Tungurahua volcano from 1999 to 2016. Tungurahua volcano, located 34 km to the east of the ice cap, had five large explosive eruptions in July-August 2006, May 2010, December 2012, July 2013 and February 2016 (Muller and others, Reference Muller, Biggs, Ebmeier, Mothes, Palacios, Jarrín and Ruiz2018). These events produced pyroclastic flows, and continuous emissions of gases and ash, which affected the western and southwestern flanks of the volcano (Hidalgo and others, Reference Hidalgo2015). On many occasions, the ashfall was carried eastwards by the prevailing winds and reached the surfaces of the glaciers on the Carihuairazo and Chimborazo massifs (see Supplementary Material). There, it reduced the albedo and increased the absorption of solar radiation, which may have increased ablation and consequently accelerated the melting process (Nield and others, Reference Nield, Chiverrell, Darby, Leyland, Vircavs and Jacobs2013).
In addition, Carihuairazo or Kari-Huayra-Razu massif is much more than a receding glacier: it is a living archive where mythical, religious, scientific and territorial memories converge (Salomon, Reference Salomon2018). The meaning of the mountain for local communities is established in the Andean beliefs that regard mountains as living beings, endowed with soul and emotion, expressed in narratives such as the war between the young Carihuairazo and Tayta (Father) Chimborazo volcanoes for the love of Mama Tungurahua. Over time, however, this pagan point of view was progressively supplanted by the Catholic narrative of the apparition of the Virgen de la Elevación on the slopes of Carihuairazo massif in 1695. This ‘new’ perspective, promoted by colonial evangelization (Trouillot and Del Arco Blanco, Reference Trouillot and Del Arco Blanco2017), redefined the mountain as a site of penitence and Christian miracles, effectively removing its identity as an Apu (deity).
Glaciers of Carihuairazo Ice Cap were also a source of inspiration for philosophers and artists (Francou, Reference Francou, Deler and Mesclier2004). In 1889, the Ecuadorian politician and painter Luis A. Martinez describe the ice cap as follow: ‘Ahead rise three enormous peaks, draped in cascading icefalls that plunge in immense glaciers to the depths of the crumbling crater, displaying the most whimsical shapes.’
The melting glaciers, together with the moorlands and precipitation, have historically provided freshwater to communities living near the glacierized catchments (La Frenierre and Mark, Reference La Frenierre and Mark2017; Hidalgo and others, Reference Hidalgo2024). This water is essential for agriculture, irrigation, and human consumption, particularly for those living in the surrounding semi-arid areas (La Frenierre and Mark, Reference La Frenierre and Mark2017). However, as the glaciers shrink and precipitation decreases, these communities are losing a water source, especially during the dry season. The loss of glacial meltwater from these ice caps could lead to economic hardship, food insecurity, and conflicts over increasingly scarce water resources. These potential impacts warrant further investigation.
6. Conclusions
Our results show that the Carihuairazo Ice Cap has exhibited a marked negative trend over the past seven decades, with continuous retreat since the mid-1980s. In particular, ice mass loss has accelerated since the late 2000s, with an average annual mass balance of – 0.76 m w.e a−1. over the past 20 years, with a substantial reduction in glacier area, particularly along its perimeter where the ice is very thin.
In situ mass balance observations at a benchmark Glacier Antisana 15α suggest an ELA of ∼5100 m a.s.l. Assuming this ELA is regionally representative, the Carihuairazo Ice Cap was particularly vulnerable because its highest point lies below 5100 m and the ice thickness distribution, which prevent the formation of permanent accumulation zones. As a result, the ice cap has rapidly disappeared under the influence of rising temperatures and decreasing snowfall.
Therefore, the presence and stability of the glacier have been significantly affected by both climatic changes and morphological characteristics of the glacier bed. This situation led to a pronounced loss of ice mass by 2020, reducing and thinning the ice cap to the point that it could no longer sustain flow, ultimately resulting in complete deglaciation by 2024. This fact was confirmed by the geodetic data collected by Vaca-Cárdenas and others (Reference Vaca-Cárdenas, Muñoz-Jácome, Vaca-Cárdenas, Cushquicullma-Colcha and Guerrero-Casado2025).
In the context of hydrological changes associated with the loss of meltwater contributions to downstream catchments, accurately reconstructing the evolution of this ice cap is essential for evaluating the implications of glacier shrinkage for local communities. For instance, a recent study aimed to estimate the hydrological response of this ice cap by using a hydrological model, however, the authors underestimated the reference surface area when calibrating the model in 1956, using a value of 0.34 km2 (Hidalgo and others, Reference Hidalgo2024). This is nearly 6.5 times smaller than the surface area estimated in the present study. Such an underestimation may negatively affect the interpretation of the role of tropical glaciers as water towers.
Likewise, the loss of the Carihuairazo Ice Cap has resulted in what some authors describe as a ‘cultural trauma’ (Hidalgo, Reference Hidalgo Ponce2022). This loss signifies the disappearance not only of an ecosystem and water resources but also of memories embedded in local culture, rituals and customs. Although the attribution of spiritual meaning to high mountains is a common trait across the Andes (Descola, Reference Descola2001; Salomon, Reference Salomon2018), the case of Carihuairazo ice cap reveals a particular characteristic. Like other Apus in the Andes, it is framed within a relational ontology, whereby mountains are considered living entities capable of engaging in emotional and social interactions with humans and each other (Salomon, Reference Salomon2018). In fact, the myths surrounding the Carihuairazo massif, such as the fraternal struggle with the Chimborazo volcano for the affection of Mama Tungurahua, later reinterpreted in Catholic tradition through the apparition of the Virgen de la Elevación, mark the origin of a perpetual symbolic transformation, where ancestral narratives are continuously reshaped within colonial and Christian narratives. In this sense, Carihuairazo massif simultaneously partakes in the wider Andean grammar of mountain personhood and crystallizes a local synthesis shaped by evangelization and, more recently, by the cultural and ecological consequences of glacial retreat (Hidalgo Ponce, Reference Hidalgo Ponce2022).
Thus, the myths associated with this mountain have played an essential role in sustaining resistance to dominant Western paradigms that contribute to the current climate crisis. In this context, as glaciers approach extinction, preserving cultural memory becomes essential for saving our local identity but also as a base for developing adaptive strategies in the face of climate change (Hock and others, Reference Hock2019).
Carihuairazo Ice Cap is the first glacier to be officially declared extinct by the Ecuadorian government. This study highlights the vulnerability of small, low-altitude tropical glaciers. However, detailed research is needed to estimate the impact of glacier retreat on communities and ecosystems. The fate of the Carihuairazo Ice Cap is a warning of what could happen to other tropical glaciers, such as Illinizas and Chimborazo, in the face of ongoing climate change. Through this work, we are therefore advocating for Carihuairazo to be included as a featured glacier in the inner tropics on the Global Glacier Casualty List (Howe and Boyer, Reference Howe and Boyer2025).
Supplementary material
The supplementary material for this article can be found at https://doi.org/10.1017/aog.2025.10036.
Data availability statement
The data presented in this study are available on request from the corresponding author.
Acknowledgements
The authors thank Yachay Tech University for the financial support given to the project PII25-09 through the Internal Call for Research Project Funding 2025. Part of the computation were performed using the GRICAD infrastructure (https://gricad.univ-grenoble-alpes.fr), which is supported by the Rhône-Alpes region (GRANT CPER07_13 CIRA), the OSUG@2020 labex (reference ANR10 LABX56) and the Equip@Meso project (reference ANR-10-EQPX-29-01) of the programme Investissements d’Avenir supervised by the Agence Nationale pour la Recherche. The high-resolution aerial data used in this study was generated in the framework of SIGTIERRAS project and the Instituto Geográfico Militar (IGM, Ecuador). We also acknowledge access to Pléiades stereo imagery, obtained through the Pléiades Glacier Observatory (PGO). Finally, we thank Dr Brian Menounos (scientific editor) and Dr Guðfinna Aðalgeirsdóttir (Associate Chief Editor), and two anonymous referees for their constructive comments that helped improve the quality of this paper.
Author contribution
RBS conceived this work, AS contributed his knowledge about the significance of Andean glaciers for cultural and societal aspects. DC generates DEMs from Pléiades data. SR, GT, NJ, EP and LC assist with data processing. AR facilitates logistics and instrumentation. All the authors contributed to writing the manuscript.


 Open access