

Inflammatory bowel disease (IBD) is a group of intestinal inflammation disorders, including Crohn’s disease and ulcerative colitis (UC). Patients with IBD suffer from diarrhoea, rectal bleeding, abdominal pain and cramps for long periods, as well as recurring inflammation( Reference Ananthakrishnan 1 ). It has been estimated that IBD affects 1·5 million Americans, 2·2 million Europeans and hundreds of thousands of individuals worldwide( Reference Ananthakrishnan 1 , Reference Molodecky, Soon and Rabi 2 ). Traditionally, IBD incidence rates have been higher in developed countries such as North America and Western Europe; however, the incidence of IBD is increasing in Asian countries, such as Japan, Korea and China, suggesting that both environmental and genetic factors play a role in the pathogenesis of IBD. The importance of dietary factors in the incidence of IBD has been established through epidemiological studies, which show that high fat and sugar diets are associated with an increased risk of IBD( Reference Chapman-Kiddell, Davies and Gillen 3 ) and that a high intake of dietary fibre (DF), for example from fruits or vegetables, may protect against the development of certain types of IBD( Reference Ananthakrishnan 1 ). A number of studies have investigated the inverse association between DF intake and IBD incidence, suggesting that DF consumption affects the intestinal microbiota, which is largely responsible for the overall health of the host. Intestinal micro-organisms metabolise DF, particularly soluble DF, to SCFA that suppress the transcription of pro-inflammatory mediators and maintain intestinal barrier integrity( Reference Suzuki, Yoshida and Hara 4 , Reference Liu, Li and Liu 5 ). However, the physiological functions of DF depend on the physio-chemical and physico-chemical properties of the specific types of DF and the role of DF in the prevention and treatment of IBD remains unclear.
Psyllium fibre isolated from Plantago ovata seed husk contains arabinoxylan and consists of both soluble and insoluble DF. As a result of its unique physico-chemical and biochemical properties, psyllium fibre is often used to improve the softness, viscosity and texture of foods and beverages, and it has been used in the treatment of a range of disorders and symptoms, such as constipation, diarrhoea, obesity, cholesterolaemia and diabetes( Reference Singh 6 ). Furthermore, some clinical studies have suggested that psyllium fibre could be helpful in the management of IBD intestinal symptoms. Hallert et al.( Reference Hallert, Kaldma and Petersson 7 ) demonstrated the beneficial effects of psyllium fibre supplementation on UC intestinal symptoms in patients in remission. Fernandez-Banares et al.( Reference Fernandez-Banares, Hinojosa and Sanchez-Lombrana 8 ) reported that the consumption of psyllium fibre was similar to the effect of mesalamine, an anti-inflammatory agent, in the treatment of patients with inactive UC. Psyllium fibre is not digested in the upper intestinal tract, reaching the colon via the same mechanisms used by other DF. However, the colonic fermentability of psyllium fibre is relatively low( Reference Ogata, Van Hung and Tari 9 , Reference Marteau, Flourie and Cherbut 10 ). Therefore, the psyllium-fibre-mediated anti-inflammatory effects seems to differ from highly fermentable DF and are independent of SCFA production by colonic bacteria( Reference Ogata, Van Hung and Tari 9 ).
Multiple cellular events regulate intestinal inflammation. There is increasing evidence suggesting that the impairment of the intestinal epithelial tight junction (TJ) barrier and subsequent penetration of luminal pro-inflammatory substances into the intestinal mucosa are involved in IBD pathogenesis( Reference Turner 11 , Reference Suzuki 12 ). Patients with IBD often exhibit intestinal hyperpermeability, and colon biopsies from patients with UC reveal a decreased expression and distribution of occludin, claudin-1, claudin-4, tricellulin and the junctional adhesion molecule (JAM)-A( Reference Heller, Florian and Bojarski 13 – Reference Vetrano, Rescigno and Cera 15 ). Therefore, the maintenance and protection of the intestinal epithelial TJ barrier could be a therapeutic and preventive approach for IBD management. In previous studies, we demonstrated that different dietary components, such as polyphenols and fermentable DF, protect and enhance the intestinal epithelial TJ barrier and reduce intestinal inflammation( Reference Hung and Suzuki 16 – Reference Azuma, Shigeshiro and Kodama 20 ). However, the role of psyllium fibre in the regulation of TJ barrier integrity in colitic mice remains unknown.
In our most recent study, we demonstrated that the consumption of supplemental psyllium fibre increased intestinal cytoprotective heat-shock protein (Hsp) 25 levels in mice, thereby increasing oxidative stress resistance( Reference Ogata, Van Hung and Tari 9 ). Hsp25 is a mouse homologue of the human Hsp27, and Hsp are involved in a wide range of physiological cellular processes, including the promotion of cell survival under conditions of stress( Reference Soti, Nagy and Giricz 21 , Reference Otaka, Odashima and Watanabe 22 ). The underlying mechanisms of Hsp are diverse and have been shown to be associated with the stabilisation of critical cellular components and processes, including cytoskeletal function, antioxidative activity, apoptosis inhibition and possibly TJ barrier integrity. Therefore, the psyllium-mediated increase in colonic Hsp25 expression is potentially beneficial in the maintenance of IBD symptoms.
Multiple studies have indicated that intestinal epithelial cell integrity is supported by the gut epithelial basement membrane, which is a specialised structure composed of extracellular matrix (ECM) proteins, particularly laminin, collagen and fibronectin( Reference Bonnans, Chou and Werb 23 ). These proteins play an important role in several cell biological processes, including migration, proliferation and differentiation. Furthermore, basic studies using cultured cells have shown that the composition and modification of the ECM influence the epithelial barrier integrity. Koval et al.( Reference Koval, Ward and Findley 24 ) reported that the expression of TJ proteins, such as claudin and occludin, in alveolar epithelial cells is different in various ECM basement membranes. However, the effects of DF on colonic ECM composition and intestinal TJ barrier remain unclear.
The present study aimed to investigate the ameliorative effects of psyllium fibre in colitic mice and to improve understanding of the underlying mechanisms. First, this study conducted a DNA microarray analysis to examine the psyllium-mediated changes of colonic gene expression in normal mice. Then, the effects of psyllium fibre on the TJ barrier and intestinal inflammation were examined in dextran sodium sulphate (DSS)-induced colitis in mice. Human intestinal Caco-2 cells were further used to examine the effects of different ECM components on TJ integrity.
Methods
Chemicals
Psyllium fibre was extracted from the whole husk of Plantago ovate (BIZEN Psyllium Husk; Bizen Chemical) and the fibre content of the preparation was 97·8 %. DSS (36 000–50 000 molecular weight) was purchased from MP Biomedicals Inc. Rabbit anti-zonula occludens (ZO)-1, ZO-2, occludin, claudin-3, claudin-4, claudin-7, JAM-A and goat Alexa Fluor 488-conjugated anti-rabbit IgG were purchased from Life Technologies. Horseradish peroxidase (HRP)-conjugated anti-rabbit IgG was purchased from SeraCare. Cell culture reagents and supplies were purchased from Thermo Fisher Scientific Inc. All other chemicals were obtained from Wako Pure Chemical Industries, Ltd.
Animals and diets
All study protocols were preapproved by the Animal Use Committee of Hiroshima University and all mice were maintained in accordance with the guidelines for the care and use of laboratory animals of Hiroshima University (authorisation no. C15-10-3). Male ICR and BALB/c mice aged 7 weeks were obtained from Japan SLC and Charles River, respectively. Throughout the study, the mice were housed under conditions with controlled temperatures (22±2°C), relative humidity (40–60 %) and lighting (light: 08.00–20.00 hours). The mice were allowed to acclimatise to the laboratory environment with free access to a fibre-free modification of AIN-93G-formula control diet (Table 1)( Reference Reeves 25 ) and distilled water for 1 week before the start of the experiments.
Composition of test diets
* Casein (ALACID; New Zealand Daily Board).
† Chuo-Shokuryou (Amylalpha CL; Aichi).
‡ Sucrose (Nippon Beet Sugar Manufacturing).
§ Mineral and vitamin mixtures were prepared according to the AIN-93G formulation.
|| Psyllium fibre (BIZEN Psyllium Husk; Bizen Chemical)
Experimental designs of animal studies
DNA microarray analysis was performed to examine the effects of supplemental psyllium fibre on colonic gene expressions in normal mice. The ICR mice (n 12) were randomly divided into the following two groups: the control group (n 6) and the psyllium group (n 6). The psyllium and control groups were fed diets with and without 10 % psyllium fibre by weight, respectively. For the control group, an equal amount of starch was substituted for the psyllium fibre. A period of 5 d after the start of the diet, the mice were euthanised by exsanguination under isoflurane anaesthesia. The colon was removed and subjected to DNA microarray, quantitative RT-PCR (qRT-PCR) and immunoblot analyses, as described below.
The ameliorative effects of supplemental psyllium fibre were examined in colitic mice. BALB/c mice (n 24) were randomly divided into four groups: control, DSS, DSS+5 % psyllium and DSS+10 % psyllium (n 6/group). Mice in the DSS+5 % psyllium and DSS+10 % psyllium groups were fed diets containing 5 and 10 % psyllium by weight, respectively, until the end of the experiment (13 d). Mice in the control and DSS groups were fed the control diet. For the control diet, an equal amount of starch was substituted for the psyllium fibre. A period of 5 d after the start of the diet, the DSS, DSS+5 % psyllium and DSS+10 % psyllium groups were administered 2 % (w/v) DSS via drinking water for 8 d, whereas the control mice were administered only distilled water. Colitis clinical scores were evaluated every day after the start of DSS administration, as described below. For the microbiota analysis, fresh faecal samples were collected 4 d after the start of DSS administration, as described below. At the end of the experiment, mice were placed under isoflurane anaesthesia and blood was collected from the abdominal vein to measure lipopolysaccharide-binding protein (LBP) levels. The mice were then euthanised by exsanguination. Plasma LBP levels were measured using a commercially available ELISA kit (Biometec). The colons were dissected and their length was measured. The colon tissues were subjected to immunoblotting, immunofluorescence and qRT-PCR analyses, as described below.
Experimental design of cell culture studies
Caco-2 cells (HTB-37; American Type Culture Collection) were propagated and maintained under standard cell culture conditions, as previously described( Reference Suzuki and Hara 18 , Reference Noda, Tanabe and Suzuki 19 ). Apical sides of permeable polyester membrane filters support (Transwell, 12 mm diameter, 0·4 µm pore size; Corning Costar Co.) were pre-coated with and without human fibronectin (3, 20, and 30 μg/ml; Wako Pure Chemical Industries) and porcine collagen (0·01, 0·03 and 0·1 mg/ml; Nitta Gelatin Inc.), according to the manufacturer’s protocols. The cells were seeded into the membrane filter supports at a density of 0·25×106 cells/cm2. Cultures were used between passage 50 and 55, and the medium was refreshed every 3 d.
Microarray analysis
Total RNA was isolated from the whole colon tissues of normal mice fed diets with or without psyllium fibre using NucleoSpin® RNA II (Macherey-Nagel). DNA microarray analysis was performed using a contract analysis service at Filgen Incorporation Japan. RNA quality was confirmed with an Agilent 2100 Bioanalyzer using an Agilent RNA 6000 Nano Kit (Thermo Fisher Scientific Inc.). The complementary RNA amplification and labelling were performed using the GeneChip® WT PLUS Reagent Kit according to the manufacturer’s instruction (Thermo Fisher Scientific Inc.). Using 0·1 µg of total RNA, an array analysis of all expressed RNA, not limited to mRNA, was conducted with Affymetrix GeneChip® Mouse 2.0 ST Arrays (Thermo Fisher Scientific Inc.). An Affymetrix GeneChip® Scanner 3000 7G was used to scan the data and Affymetrix Expression Console™ software used a robust multichip analysis algorithm to establish probe set summarisation and normalisation (Thermo Fisher Scientific Inc.). A Filgen Microarray Data Analysis Tool (version 3.2) was also utilised. All microarray data were Minimum Information About a Microarray Experiment (MIAME) compliant and were deposited in a MIAME-compliant database – the National Center for Biotechnology Information Gene Expression Omnibus (http://www.ncbi.nlm.nih.gov/geo/; GEO Series accession no.GSE99292) – as detailed on The Functional Genomics Data Society website (http://fged.org/projects/miame/).
Quantitative RT-PCR analysis
Total RNA from whole colonic tissue was isolated using NucleoSpin® RNA II (Macherey-Nagel) and reverse-transcribed using a ReverTra Ace® qPCR RT kit (Toyobo) according to the manufacturer’s instructions. The expression of Hsp25, fibronectin, collagen type Iα1 (colIα1), TNF-α-chemokine C-X-C motif ligand (CXCL-2), IL-1β, IL-6 and IL-10 were determined using qRT-PCR, as previously described( Reference Hung and Suzuki 16 ). The qPCR was performed using a Step One Real Time PCR system (Life Technologies) and the KAPA SYBR FAST qPCR kit (KapaBiosystems). The primer sequences used for PCR are shown in the online Supplementary Table S1. The data were analysed by the comparative threshold cycle (ΔΔC T ) method and were normalised to glyceraldehyde-3-phosphate dehydrogenase (GAPDH) expression levels as an internal control.
Immunoblot analysis
The whole colon tissue (50 mg) was homogenised in 1 ml of lysis buffer containing 1 % (w/v) SDS, 1 % (v/v) TritonX-100 and 1 % (w/v) sodium deoxycholate in 30 mmol/l TRIS with protease and phosphatase inhibitors (pH 7·4) using a polytron®-type homogenizer (KINEMATICA AG). Protein concentrations were measured using the Bicinchoninic acid method (Pierce Biotechnology). Tissue extracts were mixed with a half volume of Laemmli sample buffer (3X concentrated) containing 6 % (w/v) SDS, 30 % (v/v) glycerol, 15 % (v/v) β-mercaptoethanol and 0·02 % (w/v) bromphenol blue in 188 mmol/l TRIS (pH 6·8) and heated to 100°C for 5 min. Proteins (20 μg) were separated using SDS-PAGE and transferred to polyvinylidene fluoride membranes. Membranes were blotted for Hsp25, fibronectin, ZO-1, ZO-2, JAM-A, occludin, claudin-3 and claudin-7 using specific antibodies in combination with HRP-conjugated anti-rabbit IgG antibody( Reference Azuma, Shigeshiro and Kodama 20 ). Quantification was performed by densitometric analysis of specific immunoblot bands using Image J software (National Institutes of Health).
Evaluation of colitis clinical scores
To assess the severity of colitis, clinical scores were determined based on a standard scoring system, as previously described( Reference Hung and Suzuki 16 , Reference Azuma, Shigeshiro and Kodama 20 ). In summary, the clinical score was calculated as the sum of scores for diarrhoea, bloody stools and weight loss (online Supplementary Table S2).
Immunofluorescence analysis
Mouse colon tissues were embedded in optimal cutting temperature compounds (Sakura Finetek) and frozen sections (8 μm) were prepared on glass slides. Immunostaining for ZO-1, claudin-3 and claudin-7 was performed as previously described( Reference Hung and Suzuki 16 , Reference Azuma, Shigeshiro and Kodama 20 ). The specimens were preserved in a mounting medium and fluorescence was visualised using a LCM710 confocal laser scanning microscope (Carl Zeiss).
Profile analysis of faecal microbiota by PCR-denaturing gradient gel electrophoresis
DNA was extracted from fresh faeces of mice in the control, DSS and DSS+10 % psyllium groups using the QIAamp DNA Stool mini kit (Qiagen) and the ZircoPrep mini kit (Nippon Genetics), according to the manufacturer’s instructions. The DSS+5 % psyllium group was omitted in this analysis because the 5 and 10 % psyllium diets showed similar protective effects on DSS-induced colitis. The V2–V3 region of the 16S rRNA gene from the DNA samples was amplified with universal primers: HAD-1 GC (CGC CCG GGG CGC GCC CCG GGC GGG GCG GGG GCA CGG GGG GAC TCC TAC GGG AGG CAG CAG T) and HAD-2 (GTA TTA CCG CGG CTG CTG GCA C). The denaturing gradient gel electrophoresis (DGGE) analysis was conducted as previously described( Reference Kaikiri, Miyamoto and Kawakami 26 ). The gel was silver-stained with Bio-Rad silver stain and densitograms of the DGGE bands were created via Image J software. Results of the hierarchical cluster analysis of the DGGE band patterns were displayed as a dendrogram via R software (The R Foundation for Statistical Computing). The squared distances between clusters were measured by Ward’s method( Reference Ward 27 ).
Measurement of intestinal tight junction barrier function in Caco-2 cells
Intestinal TJ barrier integrity was evaluated by measuring transepithelial electrical resistance (TER) and unidirectional fluxes of fluorescein isothiocyanate-conjugated dextran (FD4; average molecular weight 4000) in Caco-2 cell monolayers in Transwell filter supports. The cell monolayers showed a TER of 1100–1400 Ωcm2 and high alkaline phosphatase and sucrase activities (data not shown). TER was measured using a Millicell-ERS system (Millipore) 8 d after seeding, as previously described( Reference Suzuki and Hara 18 , Reference Noda, Tanabe and Suzuki 19 ). FD4 (100 μm) was injected into the apical wells and the basal well flux was assessed for 24 h. FD4 concentrations of the basal solutions were measured by fluorescence (ARVO×4; PerkinElmer).
Statistical analysis
All data are presented as the means with their standard errors of the mean. Statistical analyses were performed by one-way ANOVA, followed by the Tukey–Kramer post hoc test with Statcel 3 software (OMS Publishing). Differences were considered to be statistically significant if P<0·05.
Results
Effect of psyllium fibre on colonic gene expression in normal mice
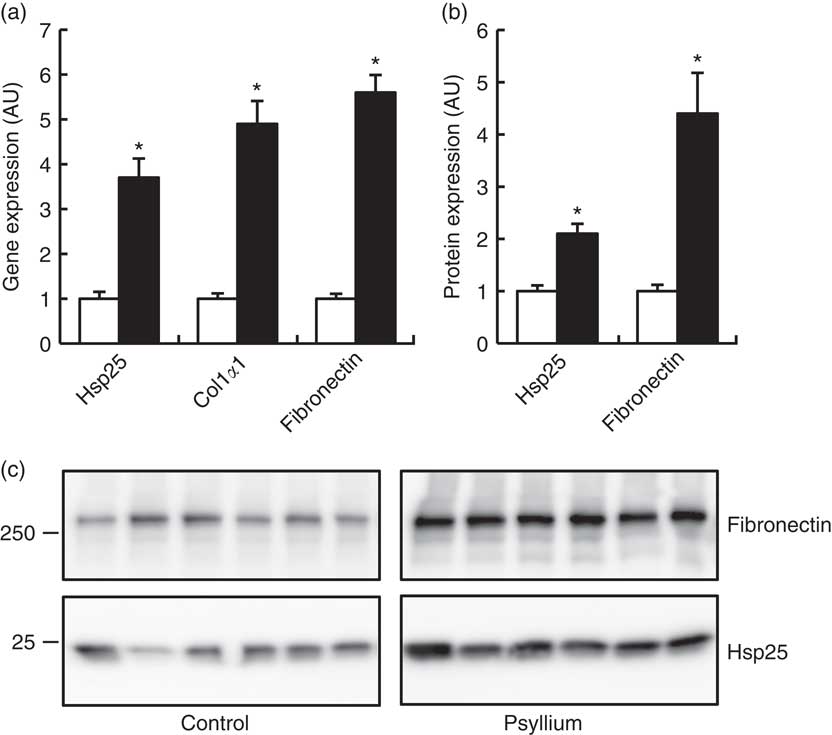
DNA microarray analysis was performed to examine the changes of colonic gene expression in mice that were fed psyllium fibre. To ensure abundant levels of expression, only genes with arbitrary fluorescence units higher than the average of the negative control probes were selected. Of the total 13 902 genes chosen for further analysis, 152 genes were up-regulated by more than 2-fold and eighty-eight genes were down-regulated by more than 2-fold. Hsp25 expression, which was shown to increase with psyllium fibre intake in our previous study, was up-regulated by 1·6-fold. Gene ontology (GO) analysis identified functional classes of the differentially expressed genes. The 114 up-regulated genes and forty-four down-regulated genes were classified into different GO terms. In all, twenty-three of the 114 up-regulated genes were assigned to the GO term of structural molecule activity, and eleven (colIα1, Iα2, IIIα1, IVα1, Ivα2, Vα1 and Vα2, elastin, fibrillin 1, peroxidasin homolog and microfibrillar associated protein 5) of these twenty-three genes were further assigned to the GO term of ECM structural constituent (Table 2). A further ECM molecule, fibronectin, which was not labelled with either of these two GO terms, was up-regulated by 6-fold with the administration of psyllium fibre. The qRT-PCR analysis revealed that mRNA expressions of colIα1, fibronectin and Hsp25 in the psyllium group were higher than those in the control group. These results are consistent with the results of the DNA microarray analysis (Fig. 1(a)). The increase in fibronectin and Hsp25 expression with the administration of psyllium fibre was confirmed at the protein level by immunoblot analyses (Fig. 1(b)).
Effects of psyllium fibre consumption on colonic expression of heat-shock protein (Hsp) 25, collagen type I (ColI) α1 and fibronectin in normal mice. (a) Gene expression of Hsp25, ColIα1 and fibronectin was determined by quantitative RT-PCR analysis. (b) Protein expression of Hsp25 and fibronectin was determined by immunoblot analysis. (c) Immunoblot images of fibronectin and Hsp25 are shown. Values are means (n 6), with their standard errors represented by vertical bars. □, Control; ■, psyllium; AU, arbitrary units. * P<0·05.
Up-regulated genes involved in the extracellular matrix of mouse colons by psyllium feeding in DNA microarray analysis
Effects of psyllium fibre on weight gain, clinical score and colon length in dextran sodium sulphate-administered mice
Compared with mice in the control group, mice in the DSS group had a smaller body weight gain at and after 4 d (Fig. 2(A)). The administration of 5 and 10 % psyllium fibre diets appeared to suppress DSS-induced body weight loss. Furthermore, DSS administration appeared to increase the clinical score of the mice and the DSS group had a greater clinical score than the control group at and after 4 d. However, the administration of 5 and 10 % psyllium fibre diets reduced the clinical scores that were increased by DSS (Fig. 2(B)). Colon shortening is known to be associated with histological changes in DSS-administered mice, and colon length is often used as a morphological parameter for the degree of inflammation. DSS administration decreases colon length, but the administration of 5 and 10 % psyllium fibre diets prevented this shortening (Fig. 2(C)). In the DSS group, colonic specimens stained with haematoxylin–eosin showed extensive ulceration or erosion in the epithelium with massive infiltration of inflammatory cells in the submucosal tissues. In the DSS+5 % and DSS+10 % groups, these changes were observed in colonic specimens, although to a less extent (Fig. 2(D)).
Effects of psyllium fibre consumption on dextran sodium sulphate (DSS)-induced colonic damage and inflammation in mice. Body weight change (A), colitis clinical score (B) and colon length (C) were evaluated in mice fed diets with and without 5 and 10 % psyllium fibre and with and without DSS administration. (D) The colons were stained with haematoxylin–eosin. Values are means (n 6), with their standard errors represented by vertical bars. ![]() , Control;
, Control; ![]() , DSS;
, DSS; ![]() , DSS+5 % psyllium;
, DSS+5 % psyllium; ![]() , DSS+10 % psyllium. a,b,c Mean values with unlike letters were significantly different from each other (P<0·05).
, DSS+10 % psyllium. a,b,c Mean values with unlike letters were significantly different from each other (P<0·05).

Effect of psyllium fibre on heat-shock protein 25, fibronectin and collagen type Iα1 expression in the colon of dextran sodium sulphate-administered mice
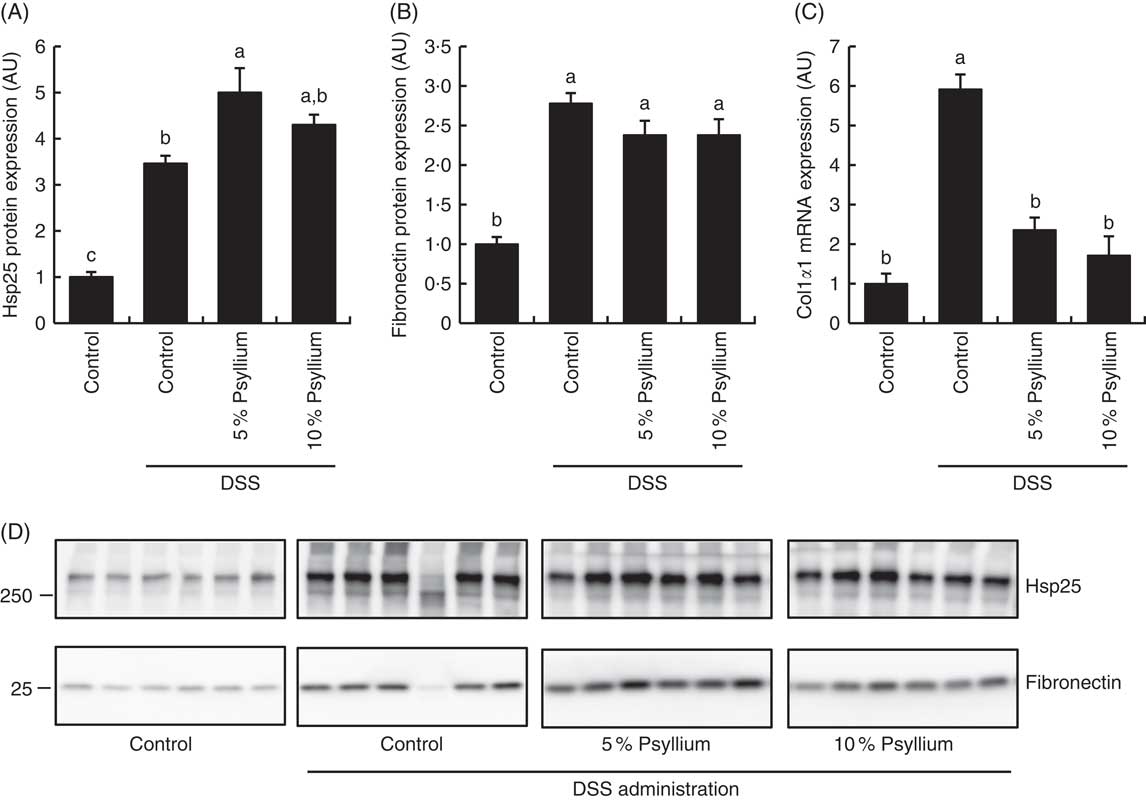
Because the results of the experiment in normal mice suggested that psyllium feeding may have anti-inflammatory effects that are mediated by increased colonic expressions of Hsp25, fibronectin and colIα1, expression of these molecules was examined in DSS-administered mice. DSS administration increased colonic Hsp25 and fibronectin protein expression and colIα1 mRNA expression (Fig. 3). The DSS+5 % and the DSS+10 % groups had higher levels of Hsp25 and fibronectin expression than the control group. Further, the DSS+5 % group had a higher expression of Hsp25 than the DSS group. The colIα1 mRNA expression in the DSS+5 % and the DSS+10 % groups tended to be higher than in the control group, but the differences between groups were not statistically significant. These results suggest that increased colonic expression of Hsp25 and fibronectin, but not colIα1, by pre-feeding with psyllium fibre for 5d before DSS administration, was sustained during DSS administration.
Effects of psyllium fibre consumption on colonic expression of heat-shock protein (Hsp) 25, collagen type I (ColI) α1 and fibronectin in dextran sodium sulphate (DSS)-administered mice. (A) Hsp25 protein expression, (B) fibronectin protein expression and (C) ColIα1 gene expression were measured in the colons of mice fed diets with and without 5 and 10 % psyllium fibre, with and without DSS administration. (D) Immunoblot images of fibronectin and Hsp25 are shown. Values are means (n 6), with their standard errors represented by vertical bars. AU, arbitrary units. a,b,c Mean values with unlike letters were significantly different from each other (P<0·05).
Effect of psyllium fibre on plasma lipopolysaccharide-binding protein of dextran sodium sulphate-administered mice
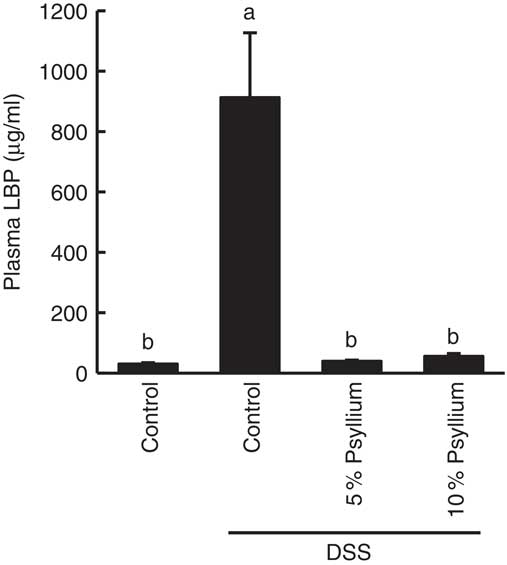
LBP is a major transporter of pro-inflammatory lipopolysaccharides (LPS) in the plasma. As impaired colonic barriers allow bacterial LPS to enter the circulatory system by penetrating the lumen, plasma LBP concentration is often used as an indicator of colonic barrier integrity. DSS administration increased the plasma LBP concentration, indicating colonic barrier impairment. However, the levels of the DSS+5 % and the DSS+10 % groups were comparable with the control values, suggesting that the administration of 5 and 10 % psyllium fibre diets prevented colonic barrier degradation (Fig. 4).
Effects of psyllium consumption on plasma lipopolysaccharide-binding protein (LBP) in dextran sodium sulphate (DSS)-administered mice. Plasma LBP was measured in mice fed diets with and without 5 and 10 % psyllium fibre, with and without DSS administration. Values are means (n 6), with their standard errors represented by vertical bars. a,b Mean values with unlike letters were significantly different from each other (P<0·05).
Effect of psyllium fibre on tight junction protein expression in the colon of dextran sodium sulphate-administered mice
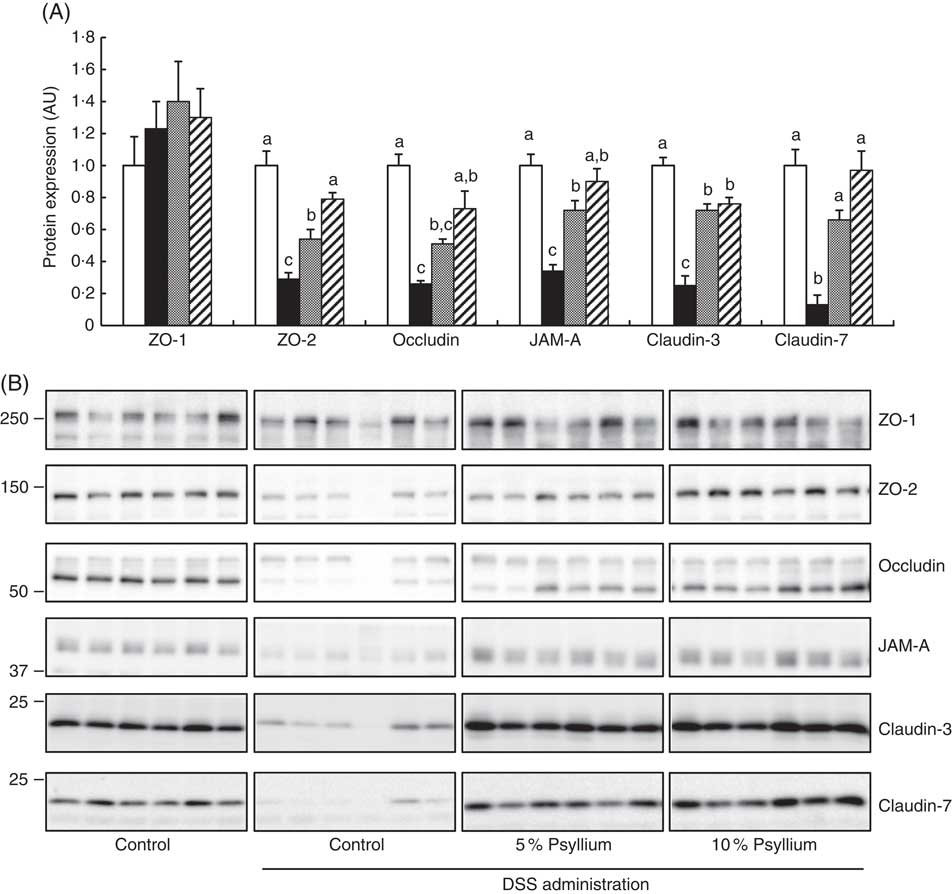
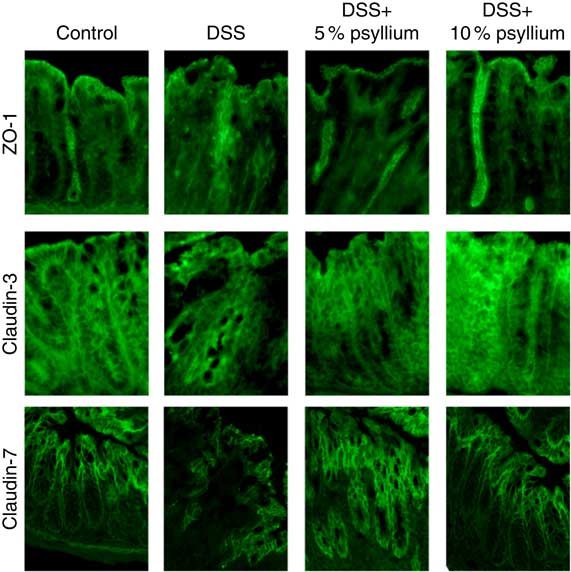
TJ are located at the intercellular junctions of epithelial cells and play a critical role in intestinal barrier integrity. Immunoblot analyses showed that colonic expression of ZO-2, occludin, JAM-A, claudin-3 and claudin-7 decreased with DSS administration (Fig. 5). However, administering the 10 % psyllium fibre diet attenuated the decreased expression of all TJ proteins tested and administering the 5 % psyllium fibre diet attenuated the decreased expression of ZO-2, JAM-A, claudin-3 and claudin-7. The occludin expression in the DSS+5 % group tended to be higher than that in the DSS group, but the change was not statistically significant. No differences in ZO-1 expression were observed among the groups. The localisation and expression of ZO-1, claudin-3 and claudin-7 were visualised in the colon by immunofluorescence microscopy (Fig. 6). In the control mice, TJ proteins were observed in colonic epithelial cells with different patterns of expression and localisation throughout the crypts. ZO-1 was assembled in the contours of the apical lateral membranes. Claudin-3 and claudin-7 were similarly detected in the junctional regions of the epithelial cells throughout the crypts, but claudin-7 expression was higher in the upper region of each crypt. Furthermore, claudin-3 and claudin-7 were also detected in the basolateral membrane of the epithelial cells. DSS administration severely impaired the expression and localisation of these TJ proteins. However, the mice that were fed 5 and 10 % psyllium fibre diets had relatively intact colonic expression and localisation of these TJ proteins.
Effects of psyllium fibre consumption on tight junction (TJ) protein expression in the colons of dextran sodium sulphate (DSS)-administered mice. (A) Protein expression of zonula occludens (ZO)-1, ZO-2, occludin, the junctional adhesion molecule (JAM)-A, claudin-3 and claudin-7 were determined by immunoblot analysis in the colons of mice fed diets with and without 5 and 10 % psyllium fibre, with and without DSS administration. (B) Immunoblot images of TJ proteins are shown. Values are means (n 6), with their standard errors represented by vertical bars. □, Control; ■, DSS; ![]() , DSS+5 % psyllium;
, DSS+5 % psyllium; ![]() , DSS+10 % psyllium; AU, arbitrary units. a,b,c Mean values with unlike letters were significantly different from each other (P<0·05).
, DSS+10 % psyllium; AU, arbitrary units. a,b,c Mean values with unlike letters were significantly different from each other (P<0·05).
Effects of psyllium fibre consumption on colonic tight junction protein localisation and expression in dextran sodium sulphate (DSS)-administered mice. Immunolocalization of zonula occludens (ZO)-1, claudin-3 and claudin-7 were analysed by immunofluorescence microscopy in the colons of mice fed diets with and without 5 and 10 % psyllium fibre, with and without DSS administration.
Effect of psyllium fibre on cytokine expression in the colon of dextran sodium sulphate-administered mice
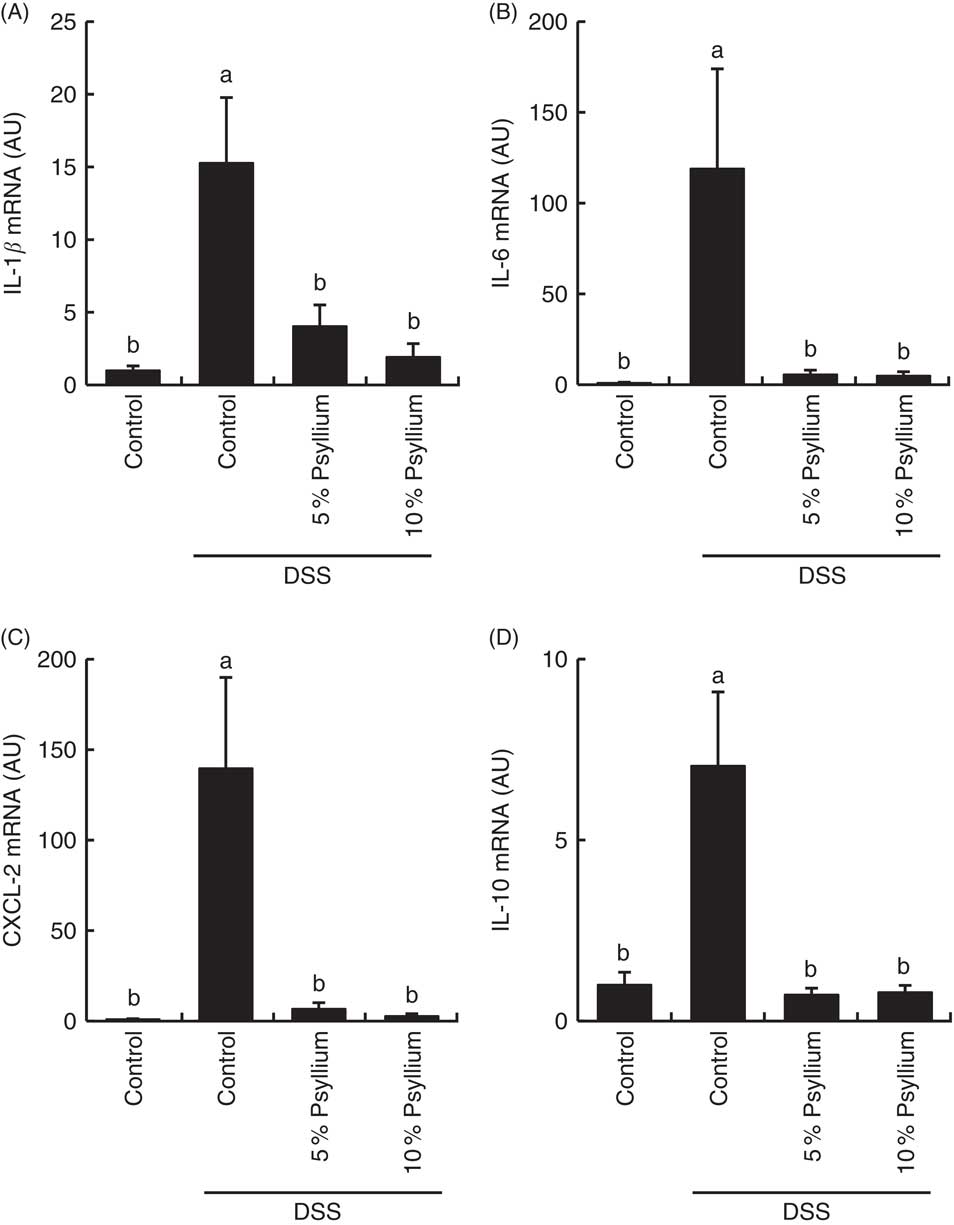
DSS administration increased the expression of pro-inflammatory cytokines IL-1β, IL-6 and CXCL-2 (Fig. 7) and tended to increase IL-17A (data not shown) in the colon. The expression of an anti-inflammatory cytokine, IL-10, was also increased by DSS administration, indicating that DSS induced acute colitis in the experimental conditions. No differences in TNF-α expression were observed among the groups (data not shown). Feeding 5 and 10 % psyllium fibre diets restored the DSS-induced increases in IL-1β, IL-6, CXCL-2 and IL-10 expression.
Effects of psyllium fibre consumption on IL-1β, IL-6, chemokine C-X-C motif ligand (CXCL)-2 and IL-10 gene expression in the colons of dextran sodium sulphate (DSS)-administered mice. Gene expression of IL-1β (A), IL-6 (B), CXCL-2 (C) and IL-10 (D) was evaluated by quantitative RT-PCR analysis in the colons of mice fed diets with and without 5 and 10 % psyllium fibre, with and without DSS administration. AU, arbitrary units. Values are means (n 6), with their standard errors represented by vertical bars. a,b Mean values with unlike letters were significantly different from each other (P<0·05).
Effect of psyllium fibre on faecal microbiota of dextran sodium sulphate-administered mice
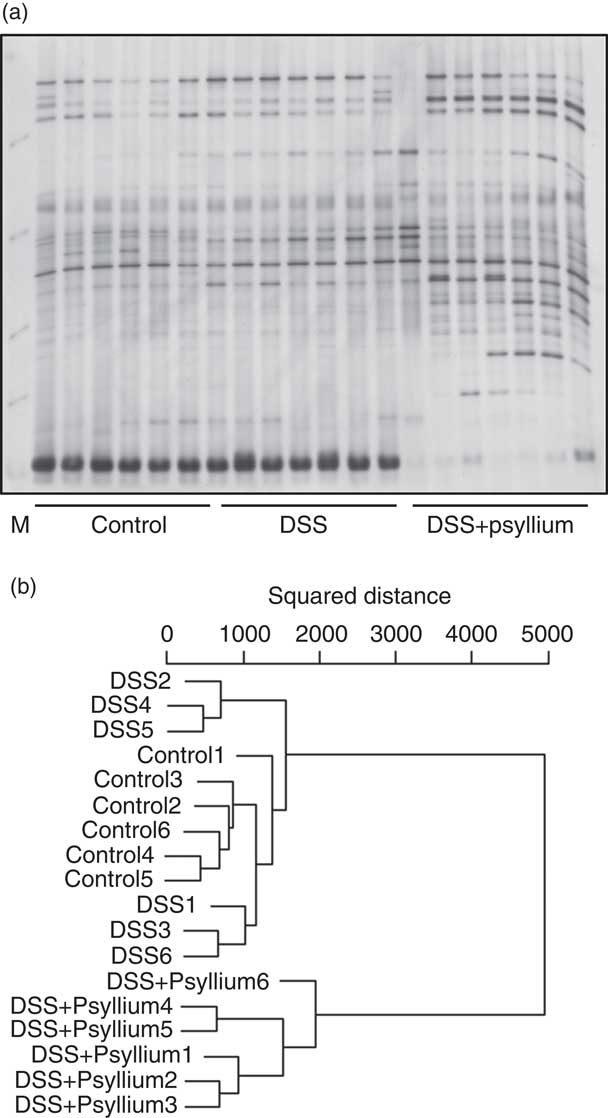
The diversity of faecal microbiota was compared by PCR-DGGE analysis based on 16S rRNA gene sequences. A representative DGGE band profile is shown in Fig. 8(a). The intensity and position of detected bands were subjected to cluster analysis. The dendrogram shows two large clusters composed of the DSS+10 % group and the other two groups (Fig. 8(b)), indicating that psyllium fibre consumption influenced faecal microbiota composition. Furthermore, the large cluster comprising the control and DSS groups was divided into two sub-clusters: the first cluster included three mice in the DSS group and the second cluster included all of the mice in the control group and three mice in the DSS group. These results suggest that DSS administration did not significantly affect faecal microbiota in this study.
Effects of psyllium fibre consumption on faecal microbiota based on 16S rRNA gene sequences in dextran sodium sulphate (DSS)-administered mice. Denaturing gradient gel electrophoresis (DGGE) gel image (a) and dendrogram (b) of DGGE band profiles 4 d after the start of DSS administration. Each lane in the gel image and each line in the dendrogram represents individual mice. The squared distances between the two clusters were measured by Ward’s method. M, size marker.
Effect of fibronectin and collagen on tight junction barrier integrity in Caco-2 cells
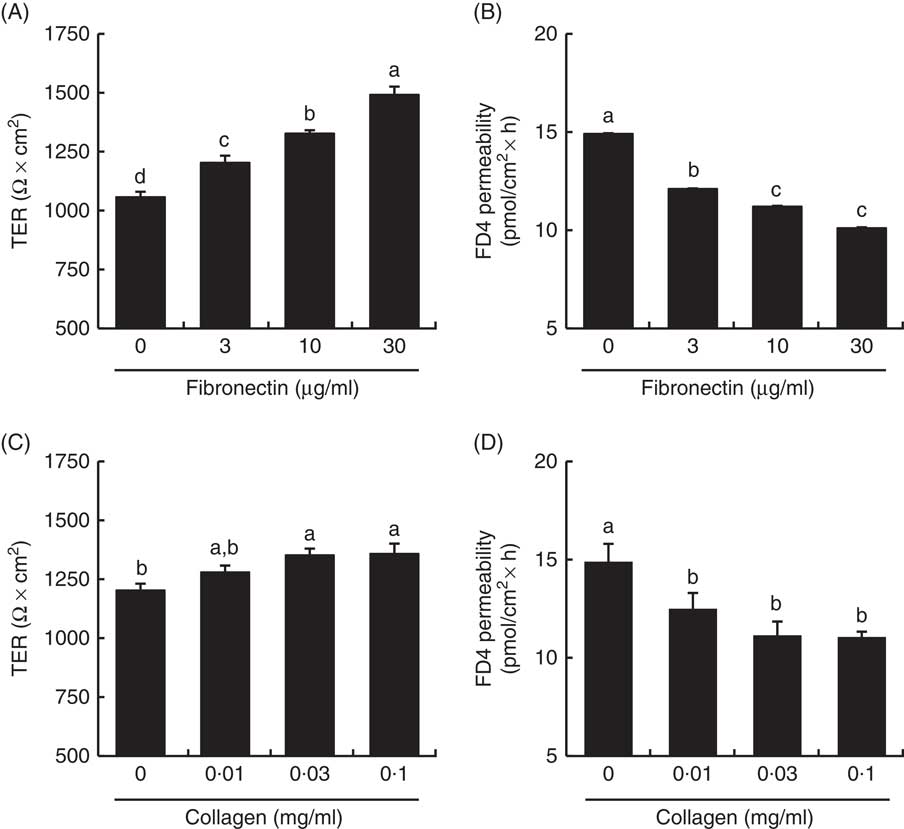
TER values across the Caco-2 cell monolayer were higher in fibronectin and collagen in a dose-dependent manner (Fig. 9). TER values with 30 µg/ml fibronectin and 0·1 mg/ml collagen were 141 and 113 % of the control values, respectively. The FD4 flux, another indicator of TJ barrier integrity, was also lower in fibronectin and collagen in a dose-dependent manner. The FD4 flux with 30 µg/ml fibronectin and 0·1 mg/ml collagen were 68 and 74 % of the control values, respectively.
Effect of collagen and fibronectin on barrier integrity in intestinal Caco-2 cells. Caco-2 cells were grown on membrane filter supports pre-coated with fibronectin (A, B) and collagen (C, D). The barrier integrity was evaluated by transepithelial electrical resistance (TER) (A, C) and fluorescein isothiocyanate (FITC)-conjugated dextran (FD4) permeability (B, D). Values are means (n 6), with their standard errors represented by vertical bars. a,b,c,d Mean values with unlike letters were significantly different from each other (P<0·05).
Discussion
In our most recent study, we demonstrated that the consumption of supplemental psyllium fibre increased the expression of intestinal cytoprotective Hsp25 expression and increased intestinal tissue resistance to oxidative stress in mice( Reference Ogata, Van Hung and Tari 9 ). In the present study, DNA microarray analysis was used to examine the colonic expression of Hsp25 and other cytoprotective proteins in mice that were fed psyllium fibre to determine the protective effect on DSS-induced colitis. The supplemental psyllium fibre increased ECM-associated proteins, such as collagens and fibronectins, and Hsp25 in the colons of normal mice. In colitic mice, the supplemental psyllium fibre effectively reduced colonic inflammation and intestinal barrier impairment. In the final experiment, examination of intestinal Caco-2 cells provided direct evidence of intestinal barrier regulation by collagen and fibronectin, which were induced by psyllium fibre consumption. Therefore, increased expression of Hsp25 and ECM-associated proteins that result in TJ barrier regulation may contribute to psyllium-mediated protection against DSS-induced colitis.
Feeding diets of psyllium fibre effectively protected the colonic TJ barrier from DSS administration in mice. An impaired TJ structure results in intestinal hyperpermeability, enabling the penetration of luminal inflammatory molecules that induce robust and chronic inflammatory responses. A number of studies have suggested that an impaired TJ barrier may be the initial event in IBD pathogenesis because hyperpermeability is often observed in non-involved intestinal segments of patients with IBD( Reference Soderholm, Peterson and Olaison 28 ). Further, a subset of first-degree relatives of patients with CD has been shown to have increased intestinal permeability despite being apparently healthy( Reference Hollander, Vadheim and Brettholz 29 ). Therefore, supplemental psyllium fibre can have potential ameliorative effects in subjects with DSS-induced colitis because it supports the protection and maintenance of TJ barrier integrity and structure.
Although the precise mechanisms of psyllium-mediated TJ protective effects on the colon of DSS-administered mice remain unclear, this study suggests that at least two mechanisms exist: Hsp25 induction and ECM modification in the colon. Hsp25 is known to be expressed in colonic epithelial cells( Reference Ren, Musch and Kojima 30 ). Previous studies have demonstrated that intestinal Hsp25 confers mucosal protection against a range of injurious agents and appears to be involved in IBD pathogenesis. Hsp25 induction by butyrate and IL-11 protects intestinal epithelial cells from oxidative stress( Reference Ren, Musch and Kojima 30 , Reference Ropeleski, Tang and Walsh-Reitz 31 ). Intestinal epithelial Hsp25 and Hsp27 expression is reduced in inflamed segments of IL-10-null mice and patients with IBD( Reference Miyamoto, Borra and Abreu 32 , Reference Hu, Ciancio and Lahav 33 ). Evidence elucidating the interaction between Hsp25 and TJ function is lacking at present; however, as a part of Hsp’s broad cytoprotective function, Hsp25 expression does contribute, at least partially, to the psyllium-mediated protection of the TJ structure( Reference Otaka, Odashima and Watanabe 22 ). The experiment using intestinal Caco-2 cells found that the ECM-associated proteins of fibronectin and collagen, the expression levels of which were up-regulated by psyllium fibre, positively regulated TJ integrity. Although a number of studies have demonstrated that the ECM supports and influences different functions of epithelial cells, scarce information exists on the underlying molecular mechanisms( Reference Bonnans, Chou and Werb 23 ). The physiological effects of fibronectin depend on its binding to integrin receptors in epithelial cells. A recent study showed that the activation of integrin α5β1, known as a fibronectin receptor, promotes TJ formation in colonic epithelial SW480 cells( Reference Starchenko, Graves-Deal and Yang 34 ). Therefore, the modification of colonic ECM could play a role in the underlying mechanisms of psyllium-mediated TJ barrier protection.
ECM-associated proteins are derived from different intestinal cell types. Collagen is mainly produced from fibroblasts in the lamina propria of the colon, whereas fibronectin is known to be produced in both fibroblasts and epithelial cells. On the basis of an observation that fibronectin in isolated colonic epithelial cells of mice was not influenced by psyllium fibre consumption (a personal observation), psyllium fibre seems to increase the fibronectin expression in the fibroblasts, but not epithelial cells. Therefore, consumption of psyllium fibre, or the subsequent change in intestinal microbiota, is likely to stimulate fibroblast production of collagen and fibronectin through intercellular signalling between colonocytes and fibroblasts because psyllium fibre and luminal bacteria never directly reach fibroblasts in the lamina propria. A previous study reported that soluble mediators derived from intestinal epithelial cells influence the immune response of dendritic cells( Reference Sahasrabudhe, Schols and Faas 35 ), suggesting intercellular signalling in the intestine. Activation of pattern-recognition receptors, such as dectin-1 and toll-like receptor 2, which recognise both luminal bacteria and DF, on the plasma membrane of epithelial cells appears to stimulate the secretion of soluble mediators. Psyllium fibre is poorly metabolised by intestinal bacteria( Reference Ogata, Van Hung and Tari 9 , Reference Marteau, Flourie and Cherbut 10 ), although PCR-DGGE analysis revealed that the supplement has a great impact on microbiota composition.
This study shows that DSS administration alone induces the colonic expression of fibronectin and colIα1, indicating colonic fibrosis. However, the psyllium-mediated changes in the expression of these molecules are likely to be distinct from fibrosis. Intestinal fibrosis, a commonly observed complication in colitic mice and patients with IBD, is defined as an excessive deposition of ECM resulting from chronic inflammation and impairment of intestinal wound healing( Reference Rieder and Fiocchi 36 ). Fibrosis is characterised by up-regulation of growth factors, such as transforming growth factor-βI, and inflammatory cytokines, such as IL-1β, IL-6 and TNF-α ( Reference Rieder and Fiocchi 36 ). In this study, DNA microarray analysis showed that psyllium fibre alone did not increase these cytokines in the colons of the mice. Further, psyllium fibre has often been used as a thickener and stabiliser in food products and, to date, no serious side effects have been reported. Similarly, this study did not observe any signs of sickness or complications in the mice. Therefore, the psyllium-mediated modification of colonic ECM is not likely to induce any health problems in humans.
In conclusion, supplemental psyllium fibre reduces the colonic inflammation and barrier impairment in DSS-administered mice. Increased colonic Hsp25 expression and ECM modification contribute, at least partially, to the psyllium-mediated protection against DSS-induced colitis. Therefore, psyllium fibre may be useful in the prevention and/or control of intestinal inflammatory diseases, including IBDs.
Acknowledgements
The authors would like to thank Editage (www.editage.jp) for English language editing.
This study received no specific grant from any funding agency, commercial or not-for-profit sectors.
M. O. and T. S. designed the research; M. O. conducted the research and performed the statistical analysis; M. O., T. O., H. T., T. A. and T. S. analysed the data; T. S. wrote the paper and was primarily responsible for the final content.
The authors declare that there are no conflicts of interest.
Supplementary Material
For supplementary material/s referred to in this article, please visit https://doi.org/10.1017/S0007114517002586


