


NOMENCLATURE $\diameter$
Diameter [mm]
- c
Thermal capacity [J kg−1 K]
- H
Enthalpy [MJ kg−1]
- k
Turbulent kinetic energy [m2 s−2]
- $k_T$
Thermal conductivity [Wm−1 K]
- M
Mach number [−]
- P
Pressure [Pa]
- $q,\,Q$
Heat flux [kWm−2]
- t
Time [s]
- T
Temperature [K]
- u
Velocity [m s−1]
- V
Voltage [V]


Greek symbols
- $\alpha_{fin}$
Fin angle [deg]
- $\alpha_R$
TFHG sensitivity [K−1]
- $\delta$
Boundary layer thickness [mm]
- $\eta$
Efficiency
- $\rho$
Density [kgm−3]


Subscripts
- 0
Stagnation
- ST
Shock Tube
- $\infty$
Free stream
- inj
Injector
- mix
Mixing
- w
Wall

1.0 INTRODUCTION
A substantial part of the take-off mass of a rocket for access to space is fuel and oxidiser. Air-breathing propulsion removes the requirement to carry oxidiser. This results in significant theoretical advantages over rockets. These advantages include a higher specific impulse, efficiency, and payload mass fraction(Reference Smart and Tetlow1,Reference Cook and Hueter2) . For these reasons, using air-breathing propulsion for access-to-space missions has the potential to increase the overall efficiency as well as decrease the cost per kilogram of placing satellites into orbit(Reference Smart3,Reference Preller and Smart4) .
Scramjet propulsion has been demonstrated for different Mach number and flight durations through the X-43 and X-51 flight demonstration programmes(Reference Marshall, Bahm, Corpening and Sherrill5,Reference McClinton6,Reference Hank, Murphy and Mutzman7) . However, at the high Mach number conditions required for access-to-space (between  $M=10$ to 12(Reference Preller and Smart4,Reference Jazra, Preller and Smart8) ), performance and thrust margins are extremely tight, and heat management becomes very challenging. To meet the performance requirements, efficient and rapid mixing is essential.
The use of vortex generating elements protruding into the internal flow path, such as hypermixers and strut injectors, has been studied extensively(Reference Khang9,Reference Riggins and Vitt10,Reference Seiner, Dash and Kenzakowski11) . These elements can substantially increase mixing rate and are effective at moderate Mach numbers (maybe up to Mach 6). However, at the higher Mach numbers required for access to space (Mach 6 to 12), this approach is no longer viable due to the high heat loads experienced and the incurred drag losses. To overcome this issue, inlet injection, whereby a portion of the fuel is injected on the inlet ramp has been proposed. The fuel injected on the inlet ramps is able to mix prior to reaching the combustor and has been shown to enhance combustion performance at high Mach numbers(Reference Turner and Smart12,Reference Barth, Wheatley and Smart13) .
This approach can be further enhanced by using the vortices intrinsically generated in scramjet inlets, a strategy that incurs minimal increase in total losses. Non-axisymmetric inlets inherently generate vortices due to the presence of Shock-Wave Boundary-Layer Interactions (SWBLI)(Reference Alvi and Settles14). The flowfield and characteristics of supersonic and hypersonic streamwise vortices in isolation has been researched extensively in the past.
The benefits of exploiting these streamwise vortices and flow structures for mixing rate enhancement in scramjets was first explored, to the authors knowledge, in works by Llobet etal. (Reference Llobet, Jahn and Gollan15,Reference Llobet, Gollan and Jahn16) which showed promising improvement in mixing.
Llobet et al. (Reference Llobet, Gollan and Jahn16) studied the vortex-injection interaction using Reynolds Averaged Navier-Stokes (RANS) Computational Fluid Dynamics (CFD). They showed that by injecting into a representative streamwise vortex, typical for inlet-sidewall SWBLI in scramjet engines, the air-fuel mixing rate is improved substantially. For the vortices presented in their work, the distance required to achieve 50% mixing efficiency can be reduced by a factor of two or more, compared to the case of injection in the undisturbed freestream. The largest mixing rate enhancements correspond to injection approximately half way between the vortex core and the separation line created by the SWBLI(Reference Llobet, Gollan and Jahn16). In their numerical studies, Llobet et al. used a canonical geometry consisting of a flat plate and a compression wall, which can generate vortices representative of 2-D and 3-D shape transitioning inlets(Reference Llobet, Barth and Jahn17,Reference Llobet18)
The aim of the current work is to replicate the geometry of these prior works in experiment, to collect heat transfer data downstream of the vortex-injection interaction, and to benchmark prior numerical studies by providing corresponding experimental data.
The experiments were carried out in the T4 Stalker Tube at the University of Queensland (UQ). A preliminary test was performed with no injection to obtain the vortex flowfield and a reference heat flux map. This test also serves to ascertain the ability of the numerical approach to accurately simulate the vortex flow. Subsequent tests are performed with two different injection pressures, and two fin locations, allowing to explore the effect of these parameters on the vortex-injection interaction.
2.0 T4 REFLECTED SHOCK TUBE TUNNEL
The T4 Stalker Tube is a free-piston reflected shock tube at the University of Queensland. Commissioned in 1987(Reference Doherty19) from the design of Stalker(Reference Stalker20), the tunnel is capable of a total enthalpy range of 2.5-15.0MJ/kg(Reference Doherty19) at a variety of Mach numbers(Reference Tanimizu21), currently with nozzles for nominal Mach numbers of  $4.0$, $7.0$, $7.6$, and $10.0$. The nozzle supply pressure ranges between $10{}\sim90 \mathrm{MPa}$. This high-enthalpy impulse facility is usually run in a direct connect(Reference Kirchhartz22,Reference Ridings23) or semi free-jet configuration(9.24) due to the relatively small core size of the facility(Reference Itoh, Ueda, Komuro, Sato, Tanno and Takahashi25,Reference Stalker, Paull, Mee, Morgan and Jacobs26) .
Able to achieve test times on the order of 1ms(Reference Stalker, Paull, Mee, Morgan and Jacobs26), this facility has been used extensively for scramjet propulsion/high-speed aerodynamic research(Reference Hunt, Paull, Boyce and Hagenmaier27,Reference Wise and Smart28) . Figure 1 shows a generic overview of the facility with reference(Reference Doherty19) containing an extensive description of the facility for the interested reader.
Schematic of the T4 Stalker Tube. Extracted from(Reference Doherty19).

3.0 EXPERIMENTAL MODEL
Figure 2(a) shows the canonical geometry used in the tests, consisting of a flat plate and a normal fin at an angle-of-attack used to generate scramjet-inlet like vortices. In the figure, the axial freestream moves in the positive X direction. Figure 2(b) shows a slice normal to the flow and illustrates how the vortex is generated by the shock-viscous interactions. The resulting vortex is equivalent to those generated in the inlet of non-axisymmetric scramjets(Reference Llobet, Gollan and Jahn16,Reference Llobet, Barth and Jahn17) , where differing compression rates between ramp and sidewalls lead to similar interactions.
Test geometry and vortex flowfield structure depiction. Extracted from(Reference Llobet, Gollan and Jahn29)

Figure 3 shows the model used in the experimental campaign. To ensure the model creates representative vortices, the Q factor was used to extract the vortex core location, size (defined as the region with  $Q > 0.5 \, Q_{max \, at \, core}$), and intensity from these simulations(Reference Llobet, Jahn and Gollan15,Reference Llobet18) . Setting the fin angle to $10^{\circ}$, and simulating a geometry equivalent to Fig. 3 at free stream conditions close to the experimental conditions resulted in representative vortices with a vortex intensity of 0.48. This vortex intensity is very similar to the values found in simulations of 2D scramjet geometries tested in T4 and the X3 expansion tube at UQ(Reference Llobet, Jahn and Gollan15,Reference Llobet18) .
Experimental model for measuring jet-vortex induced heat transfer.

The width of the model/plate was 220 mm, which was selected to reduce the potential of any three-dimensional effects reaching the measurement area. The length of flat plate upstream of the fin leading edge was limited to 156mm due to the potential interference with the tunnel nozzle walls. The injector has a diameter of 1mm and is located 126mm downstream of the fin leading edge and inclined at  ${45}^{\circ}$ relative to the axial flow direction. The injector is supplied with gaseous hydrogen from a plenum mounted below the plate. The plenum is fed by a Ludwieg tube at room temperature to maintain a constant total pressure during the test duration.
To test different injection locations, corresponding to different locations within the vortex, the fin can be translated in the model Y axis, as shown in Fig. 3(b).
To measure heat transfer downstream of the injector, Thin-Film Heat-transfer Gauges (TFHG) are arranged along five parallel lines as shown in Fig. 3(b). Each line of gauges contains 11 TFHGs that were manufactured at the Centre for Hypersonics at the University of Queensland. Each gauge consists of an approximately 20 nm thick nickel resistive strip element that is sputtered onto an optically smooth quartz substrate and shielded with a layer of  $SiO_2$. The gauges are individually calibrated after manufacture following the procedure by Wise(Reference Wise24). Heat flux is calculated using Eq. 1, following the procedure from Schultz(Reference Wise24,Reference Schultz and Jones30) , which integrates the change in voltage across the TFHG driven by a constant current source. $\rho$, c, $k_T$ are the properties of the substrate and $\alpha_R$ is the resistance-independent calibrated TFHG sensitivity.
 \begin{equation}\dot{q}_n = \frac{\sqrt{\rho \, c \, k_T}}{\sqrt{\pi}\alpha_R V_0}\sum^n_{i=1}\frac{V\!\left(t_0\right)-V\!\left(t_{i-1}\right)}{\left(t_n-t_i\right)^{1/2}+\left(t_n-t_{i-1}\right)^{1/2}}\end{equation}
 The theoretical uncertainty for the TFHG heat flux measurements, considering material property variations, voltage measurement, and calibration uncertainties is  $\pm {5.8}{\%}$(Reference Wise24). However, due to fabrication flaws and/or mounting imperfections this value was found to underpredict the actual uncertainty. For this reason, the uncertainty was calculated by comparing the average heat flux value measured from multiple TFHGs during a fuel off flat plate configuration experiment (no injection and fin removed). The resulting TFHG 95% confidence interval is $\pm {30}{\%}$, calculated using t-Student distribution for a population of 10 gauges(Reference Llobet18).
Stanton number for the TFHG’s in the boundary layer measurement region(Reference Llobet18). Theoretical laminar and turbulent Stanton number values calculated with the Cebeci Boundary Layer Code(Reference Cebeci and Bradshae31).

Figure 3(b) shows the TFHG sensor field that was employed to resolve the heat-transfer profile for the vortex-injection interaction. This arrangement was selected based on analysis presented in(Reference Llobet, Gollan and Jahn29). The gauges centers are separated by 4mm in the Y direction, while the lines are separated by 24.15mm in the X direction (or freestream direction). Moreover, the gauge lines have a 4.5mm offset in the positive Y direction in order to improve the sensor coverage. The first TFHG line is 12mm downstream of the injector.
Additionally, the model incorporates six TFHG on the farthest region of the flat plate from the fin, as shown in Fig. 3(c). These gauges measure and identify the state of the undisturbed boundary layer in the vicinity of the fin leading edge and injection location. These gauges are grouped in two sets of three, 10 mm apart. The first set starts at 143mm and is at the same axial location as the fin leading edge. The second set starts at 249mm and is located just upstream of the injector. Both sets of gauges are located far enough away from the fin that they are not affected by the oblique shock-wave or vortex.
The state of the boundary layer at both locations is determined by comparing the Stanton number calculated from the experimental measurements to the Cebeci Boundary Layer Code(Reference Cebeci and Bradshae31). The results shown in Fig. 4, show that the measurements correlate with the Stanton number for laminar flow, indicating that the undisturbed flow across the flat plate remains laminar.
Two flush mounted pressure tappings, using Kulite sensors, are incorporated in the flat plate to measure the free-stream static pressure upstream and downstream of the fin shock during the experiment.
3.1 T4 test flow conditions
The experiments were performed using the T4 Mach 7.6 nozzle at a Mach 8 flight-enthalpy. The nozzle exit flow conditions are derived from measurements of the shock tube fill pressure  $\left(P_{ST}\right)$, shock tube shock-speed $\left(u_{S}\right)$, shock tube temperature $\left(T_{ST}\right)$, and the stagnation region nozzle supply pressure $\left(P_e\right)$. Uncertainties in the flow conditions are obtained by assuming the measured quantities are independent and normally distributed, and evaluating the sensitivities of the derived quantities to changes in the measured quantities(Reference Khang9,Reference Mee32) . Table 1 summarises the calculated nozzle exit conditions along with their uncertainties.
Nominal conditions during testing a nozzle exit

The nozzle exit conditions in Table 1 are calculated using the UQ in-house code NENZFr(Reference Doherty, Chan, Jacobs, Zander, Gollan and Kirchhartz33). NENZFr is a wrapper that integrates an ESTCj(Reference Jacobs, Gollan, Potter, Zander, Gildfind, Blyton, Chan and Doherty34) shock-tube simulation into a space-marched thermal and chemical non-equilibrium simulation of the nozzle using the Eilmer CFD code. Eilmer3 is a collection of programs for the simulation of 2-D/3-D thermal and chemical non-equilibrium transient flows, developed at the UQ(Reference Gollan and Jacobs35) and extensively validated for hypersonic flows.
The axisymmetric grid used for the space-marched Eilmer3 simulation is constructed by inscribing a uniform structured grid between a Bezier curve defining the nozzle wall and the nozzle centerline. The mesh employed in this study consisted of 600 by 40 elements in the axial and radial directions respectively. The chemical composition of the gas is calculated using finite-rate reactions with a five species air model:  $N_2$, $O_2$, NO, N and O. The thermodynamic properties are obtained using NASA CEA2(Reference McBride and Gordon36).
Moreover, to improve the accuracy of the nozzle exit conditions, an iterative approach is applied to determine the transition location in the nozzle. The baseline predictive value is iterated until a satisfactory solution is found that agrees with the experimentally measured static pressure on the model plate. The uncertainty of this static pressure measurement is lower than the resultant sensitivity from the nozzle transition location, and thus is considered a truth value target for the iterative convergence(Reference Doherty19).
4.0 TEST CASES
Two experimental arrangements, corresponding to the fin being translated along the Y axis as depicted in Fig. 3(b) were tested. Moving the fin adjusts the relative position between the jet and vortex, and allows the effect of injector placement relative to the vortex to be observed. The fin locations are defined by the distance between jet and fin in the Y direction, non-dimensionalised by the jet diameter. The two arrangements have a fin-to-injector distance of  $26.2 \, \diameter_{inj}$ and $35.2 \, \diameter_{inj}$, and are labeled Upper Fin (UF), and Lower Fin (LF) respectively.
Three tests were performed for each arrangement. The initial test uses No Injection (NI) and is used to obtain baseline heat flux data corresponding to an undisturbed vortex. For the other two tests hydrogen is injected with measured injector plenum pressures of approximately  $P_{inj}={1300}{\text{kPa}}$ and $P_{inj}={430}{\text{kPa}}$. As the plenum and Ludwieg tube are at room temperature, a stagnation temperature of 300 K is assumed for all tests. These two tests are labeled High Injection (HI) and Low Injection (LI) respectively. These injections pressures result in injection-to-free-stream momentum ratios of approximately (J) of $5.24$, and $1.73$. The resulting six experimental configurations are summarised in Table 2.
Combination of injection conditions and fin position for the different test cases

5.0 CFD REFERENCE RESULTS
The data obtained in the experiments is complemented with numerical simulations to enhance the understanding of the results and assess the validity of the numerical methodology. The CFD solver used is US3D, developed at the University of Minnesota(Reference Nompelis, Drayna and Candler37). Steady state RANS simulations using non-reacting flow and the SST turbulence model with a Schmidt number (Sc) of 0.7 are performed. The typical near-wall cell size is 2 µm, keeping the y+ values below 1 for the whole domain, except for the first few cells adjacent to the fin leading edge. The Steger-Warming flux vector splitting method is used for the convective fluxes. In regions of strong shocks, the MUSCL scheme with pressure limiter is used. The implicit time integration uses the DPLR method(Reference Wright, Candler and Bose38). The typical value for CFL number is 50 towards the end of the simulations.
The numerical domain spans from 10 mm upstream to 300 mm downstream of the fin leading edge and 200 mm in the spanwise direction. The boundary layer development over the first 146mm of the flat plate upstream of the fin leading edge was calculated in a separate quasi two-dimensional simulation with an infinitely sharp leading edge. The exit profile from this simulation is used as the inflow boundary condition for the three-dimensional numerical domain described above. The walls are modeled as non-slip isothermal walls with a temperature of 300 K, the mean for the laboratory in which the experiments were conducted.
The structured three-dimensional domain contains approximately four million cells and has a minimum spacing in the vicinity of the injector of approximately 0.05mm. The cell growth from the injector is restricted to 1mm in the region of uniform flow and is considered an appropriate limit to resolve the far-field of the vortex-injection interaction. The meshes use a typical near-wall cell size of 2 µm, keeping the  $y^+$ value below 1. Halving $y^+$ produced a 3% change in heat flux in the region of interest. The meshes used in the current study are equivalent to the ones used in a previous numerical study(Reference Llobet, Gollan and Jahn16), which includes a grid dependency study investigating several key parameters for vortex-injection interactions, such as mixing efficiency and penetration. Grids using approximately 3.8 to 4.0 million cells depending on the volume of the domain were found to be adequate.
GCI for mixing efficiency and maximum penetration 1 to 3 from finer to coarser

This level adequately captures the main flow features as demonstrated in the prior work by comparing three levels (3.8, 7.6, 16.2 million cells) of refinement(Reference Llobet, Gollan and Jahn16). Moreover, the Grid Convergence Index (GCI) values(Reference Roache39), based on mixing efficiency  $\left(\eta_{mix}\right)$ at two locations downstream of the injector, and maximum penetration were calculated and are reproduced in Table3. The GCI values for mixing efficiency near the injector ( $\eta_{mix}\mid_{x=0.05}$) has relatively poor values due to the large concentration gradients in this region. Nonetheless, the GCI value improves further downstream, where the most relevant data is extracted. These values of mixing efficiency ( $\eta_{mix}$) are obtained by analysing the flow over planes normal to the axial direction. On each plane, the mixing efficiency is calculated using Equation (2)(Reference Lee40), where $\rho$, u, and $c^{stoic}_{H2}$ are the density, axial velocity, and stoichiometric hydrogen ( $H_2$) mass fraction.
 \begin{equation}\eta_{mix} = \frac{\int\int c^{r}_{H2} \cdot \rho \cdot u \cdot dy dz}{\int\int c_{H2}\cdot \rho \cdot u \cdot dy dz}\mbox {where} \quad \quad {c^{r}_{H2}} = \begin{cases} c_{H2} & c_{H2}\leq c^{stoic}_{H2} \\[3pt] \frac{1-c_{H2}}{1-c^{stoic}_{H2}} & c_{H2}> c^{stoic}_{H2}\end{cases}\end{equation}
The inflow conditions used for the simulations are the nominal conditions calculated at the nozzle exit from Table 1. Stanton number over the plate, as presented in Fig. 4, shows the flow remains fully laminar upstream of the oblique shock and injector. This also agrees with the transition predictions for the T4 tunnel from He and Morgan(Reference He and Morgan41). Thus, the pseudo-2D simulations to resolve the boundary layer development were conducted as fully laminar.
In the three-dimensional domain the RANS equations are closed with the SST  $k-\omega$ turbulence model. This ensures turbulent mixing of the fuel and the production of turbulence in the boundary layer region separated by the fin shock is simulated satisfactorily. In order to accommodate the laminar inflow from the quasi-2D simulation, the Turbulent Kinetic Energy (TKE) at the inlet to the domain is set to zero. This replicates the laminar nature of the flow upstream of the fin, to match the experimental data shown in Fig. 4. More importantly, using a zero TKE inflow with the SST $k-\omega$ model, allows for an appropriate modeling of the viscous turbulence generation in the laminar boundary layer at the interaction with the fin shock, as well as turbulence generation in the separations and vortex-injection interaction.
Figure 5a shows contours of TKE for the flow domain. From these contours the generation of turbulence downstream of the separation line and further generation surrounding the fuel jet is clearly evident. For a quantitative comparison TKE and heat flux was extracted along the dashed line TKE Extraction line shown in Fig. 5a. Examining the trace of TKE inset in Fig. 5a, it is evident that TKE remains negligible until just downstream of the injector, when a rapid increase occurs, with TKE stabilising at a higher level downstream of approximately  $x = {400}{\text{mm}}$. Considering the heat flux from simulation and experiments, shown in Fig. 5b, again good agreement is seen for $x < {300}{\text{mm}}$, at which point the CFD simulations predict a rapid increase in heat transfer.
TKE and heat transfer from reference simulation to assess accuracy of boundary layer state prediction.

As in the experimental case, the flow upstream of the injector is laminar. Therefore, the swept shock interacts with a laminar boundary layer to generate the corner vortex. Further downstream, the transition to turbulent boundary layer in CFD introduces a deviation from the experimental case, where the boundary layer unaffected by the vortex remains laminar much longer. This deviation is only relevant in the region outside of the vortex, and thus is not relevant to the aim of this discussion. Nonetheless, the region where this discrepancy between CFD and experimental data is visible is briefly described in subsequent sections for completeness.
6.0 RESULTS
The experimental and numerical results for the six tests cases outlined in Table 2 are presented here. The no injection, NI cases are presented first to show the effect of the vortex. These are followed by the cases with the vortex-injection interaction.
6.1 Unfueled vortex
The two baseline cases using the UF and LF positions without injection are investigated to identify the heat transfer distribution induced by the vortex in isolation, and to show the ability of the numerical methodology to accurately simulate the vortex flowfield. Figure 6 shows the numerically predicted and measured heat flux. To facilitate the comparison, numerical data is extracted along lines coincident with the TFHG inserts.
Numerical and experimental heat transfer data on gauges lines A to E, at  $X_{inj}$ axial distance from the injector. Cases ${\#}1$ and ${\#}2$, without injection.

6.1.1 Heat flux distribution from experimental data
Vortex formation
The flat plate and compression wall produces a vortex through shock-shock and shock-viscous interactions(Reference Llobet, Gollan and Jahn16). As shown in Fig. 2, the interaction of the swept fin shock with the flat plate boundary layer is the main driver of the vortex formation and growth. As can be seen in Fig. 2b, just above the flat plate the fin generates a velocity component in the spanwise direction, moving away from the fin. This flow is fed by the hot and dense stream of gas from behind the swept shock labeled ‘jet’ in Fig. 2b. The production of this ‘jet’ stream is cause by the velocity gradient within the boundary layer and how it interacts with the swept shock. This velocity variation produces a gradual variation of the swept shock angle and pressure ratio across the shock, with maximum pressure ratio in the inviscid region, and minimum pressure ratio on the flat plate surface. As the flow moves away from the fin over the flat plate, it interacts with the incoming freestream, rolling up and forming the streamwise vortex. This boundary layer separation induces the appearance of the separation shock depicted in Fig. 2b.
Heat flux distribution
From right to left, the experimental data in Fig. 6 shows a sharp increase in heat flux as we enter the vortex crossing the separation line. The experimental data presents a maximum relatively close to the separation line within the vortex region, and then drops in the regions closer to the fin. The flow near the fin is dense and hot, and it expands as it gains velocity in the spanwise direction and moves towards the separation line. The drop in density and temperature tends to reduce heat flux, but the increase in velocity enhances it, reaching a point of maximum heat flux relatively close to the separation line. Moreover, near the separation line the flow is slightly re-compressed by the presence of the separation shock, contributing to the displacement of the heat flux peak towards the separation line. The same heat flux distribution was observed by Law(Reference Law42).
6.1.2 Numerical and experimental comparison
Subsets Fig. 6a and Fig. 6b correspond to the UF and LF positions respectively. The heat flux curves show a relatively flat region on the right hand side, where the boundary layer is not affected by the vortex. In this region, just outside of the vortex, the numerical data tends to overestimate the heat flux. This is due to the previously mentioned early boundary layer transition in CFD, which predicts higher heat flux in comparison to the experimental case (where the boundary layer remains laminar outside of the vortex for the complete length of the model). This effect is more apparent in the LF cases as more gauges are placed in the region outside of the vortex. However, as mentioned earlier, this does not affect the region of interest in the measurement region within the vortex. Thus it is not relevant in this study, and this effect is not discussed further.
Moving from this flat region towards the fin wall (lower Y values), heat flux increases sharply as we enter the vortex region. Both numerical and experimental data agree reasonably with respect to the location where heat transfer increases due to the presence of the vortex, showing relative good prediction of the separation line location. Moreover, the initial gradient of the slope is well matched between numerical and experimental data. However, the two data sets diverge closer to the fin wall, as experimental values rapidly decrease, whereas the numerical values continue to increase further. From these results, the experimental data shows the peak in heat flux takes place relatively close to the separation line, below the separation shock. However, in CFD this peak caused by the effect of the separation shock is displaced towards the fin, and is only a local peak, as even higher heat flux is observed very closer to the fin.
This overestimation of heat flux in the numerical data is consistent across the entire dataset. It is visibly more prominent in the UF case, where the TFHGs are placed closer to the fin wall, meaning that more sensors are located inside this region, where numerical heat flux is overestimated.
To visualise the entire surface where heat transfer is measured, Fig. 7 presents a contour map based on the mean of each TFHG measurement together with the corresponding numerical data for the LF case. In the numerical results (Fig. 7(b)) the locations of the separation line and inviscid fin shock are also indicated. This figure clearly shows that the numerical simulations overestimated heat flux in the region adjacent to the fin wall.
Reconstructed heat transfer map. Comparison of heat flux from experiments and CFD. NI-LF (Case 2 in Table 2).

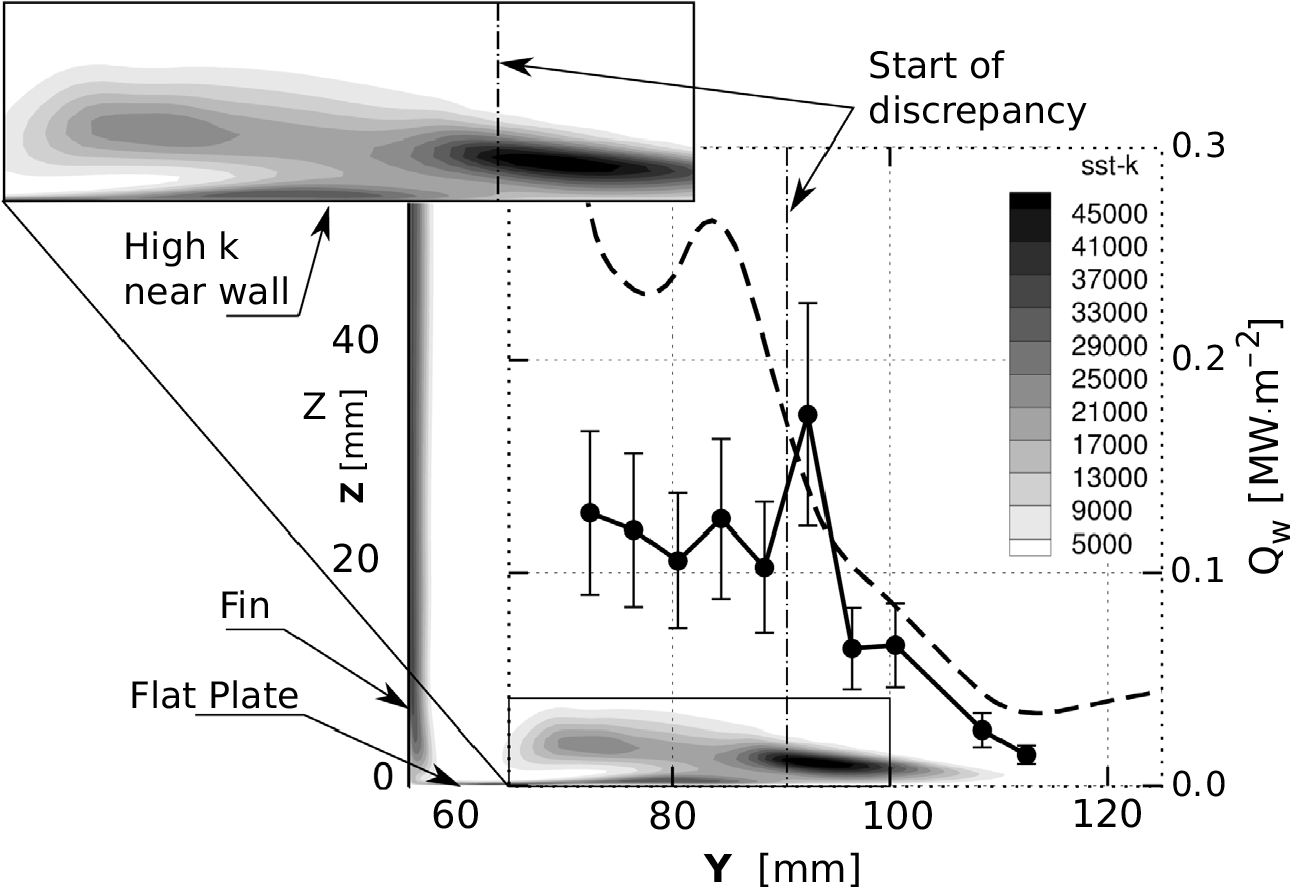
To investigate the cause of this effect, the numerical flowfield is analyzed in a vertical plane slicing along line A (first set of TFHGs). Figure 8 shows the heat flux along line A from the UF case (Fig. 6a) overlayed with the TKE field. This shows that the point where the numerical estimation begins to diverge from the experimental data is coincident with a region of increased TKE immediately adjacent to the flat plate wall. The magnified image in Fig. 8 gives a better visualisation of this region of elevated TKE. This elevated TKE region on the flat plate surface corresponds to the location where hot and dense gas, compressed by the oblique shock impinges on the flat plate. This stream of gas is depicted in Fig. 2b and labeled as jet, and creates the reattachment of the swept separation vortex. Considering how numerical heat transfer is calculated, this high level of turbulence significantly enhances heat transfer, leading to the elevated values seen in the numerical data. Effectively, in this region the SST  $k{-}\omega$ model fails to correctly dampen TKE, resulting in an overprediction of heat transfer. Thus numerical heat transfer is overpredicted in this region where the vortex reattaches. Jie and Jie(Reference Jie and Jie43) evaluated the ability of the k-omega model in an equivalent geometry producing equivalent swept-shock separation vortices and observed a very similar overprediction of Stanton number near the fin. Therefore, this is a limitation of the model, which presents unrealistically high heat flux in the region just adjacent to the fin.
Contours of turbulent kinetic energy (TKE) combined with experimental and numerical heat flux data, along line A (at  $X_{inj} = {12}{\text{mm}}$).

This discrepancy created by the turbulence model in the reattachment region is likely to appear in a wide range of corner flows, and can have a significant impact in the estimation of the heat management requirements in scramjet design. Moreover, as it is stressed in the following sections, it is a key aspect to take into account when comparing the numerical and experimental data from the fueled results shown hereafter, as the reattachment line affects the measurement region in all cases. This region of overestimation will be referred to as the ‘numerical overestimation zone’ in further discussions.
6.2 Fuel vortex interaction
This section discusses the results for cases 3 to 6 in Table 2 providing insight into the complex vortex-injection interaction flowfield.
6.2.1 Flowfield description from numerical data
The flowfield generated in the vortex-injection interaction is very complex. Figure 9 shows the three-dimensional flowfield within the vortex-injection interaction to provide a global overview of the main processes. In Fig. 9(a) the red lines represent iso-surfaces of equivalence ratio (Fr) and show the fuel plume shape. The fuel plume is nearly hemispheric shape just above the injector, and evolves to a highly elongated profile(Reference Llobet, Gollan and Jahn16) as it is convected downstream. Far downstream, the fuel plume splits into two regions, as shown in Fig. 9(b & c), one located within the vortex recirculation region, and the other adjacent to the flat plate wall, but further away from the fin. The streak lines on the flat plate surface, shown in Fig. 9(b), highlight the coincidence between the separation lines and regions of low heat flux, and the reattachment lines and regions of high heat flux. The separation and reattachment lines are indicated by the cohesion and divergence of streak lines respectively. Figures 9(b & c) further visualise the velocity field on a slice normal to the flow direction using streamlines (black lines). The close-up in Fig. 9(c) shows the presence of a small counter rotating vortex, marked as C.R.Vortex, which creates the reattachment and separation lines observed in Fig. 9(b). This counter rotating vortex appears to originate very close to the injector location. It is likely created by the interaction between the swept-shock separation vortex and the horseshoe vortex produced by the fuel jet. The side of the horseshoe vortex spinning in the same direction as the swept-shock separation vortex is dissipated, whereas the side of the horseshoe vortex spinning in the opposite direction persists as shown in Fig. 9.
Numerical results for Case 3 (HI-UF). Flat plate surface: numerical heat flux map with streak lines. Slices: contours of turbulent kinetic energy, lines of equivalence ratio (red), and streamlines. a) Isometric view, b) top-front tilted view, c) frontal close up on the plume and vortex area.

For the interested reader, the heat flux distribution over the flat plate in an equivalent geometry and similar flow conditions is described in more detail in reference(Reference Llobet, Gollan and Jahn29).
6.2.2 Upper fin position, high injection pressure
The experimental and numerical results for Case 3, (the high injection pressure, upper fin position) are presented in Fig. 10 and 11. Qualitatively, there is a good agreement between the numerical and experimental results far from the fin wall. The two curves have similar trends. Moreover, the double peak in heat flux induced by the injection bow shock at location A matches closely between numerical and experimental data. However, the numerical heat flux values near the fin (low Y values) are again overestimated when compared to the experimental results. This overestimation is again caused by an overestimation of TKE close to the wall as discussed previously for the no-injection case in section 6.1.
Numerical and experimental heat transfer data. HI-UF (Case 3 in Table 2)

Reconstructed heat transfer map. Comparison of heat flux from experiments and CFD. HI-UF (Case 3 in Table 2)

Despite the inability to properly quantify heat transfer in the region closest to the fin, the numerical data is able to adequately describe the main characteristics of the flowfield. The double peak at location A, corresponding to a horseshoe of high heat transfer surrounding the injector, as shown in Fig. 11 is captured by both, and heat transfer magnitudes are consistent. The heat transfer far away from the fin is the same for both and the onset of the rise in heat flux indicating the location of the separation line, as well as the rate of increasing heat transfer are matched satisfactorily. Considering the surface heat flux contours further downstream, depicted in Fig. 11, the localised streak of high heat flux produced by the counter rotating vortex shown in Fig. 9(c) and a corresponding valley of low heat flux, approximately below the inviscid shock, are clearly visible in both the numerical and experimental data. These regions can be attributed to the counter rotating vortex depicted in Fig. 9, with low and high heat flux corresponding to localised separation and reattachment respectively. Closer to the wall, and mostly outside of the experimental measurement region, a region of high heat transfer is again predicted in the simulations, which can be attributed to an overestimation of TKE, as discussed previously.
Despite limitations of the model to accurately predict the heat flux values consistently over the measurement area, especially close to the fin, the numerical simulation accurately predicts the main flow features and their general impact on heat transfer. The accurate solution of the counter-rotating vortex within the main separation gives further confidence that the macro structures of the 3-D flowfield are correctly modeled and resolved. This in turn improves confidence in the ability of the simulation to accurately predict fuel distribution and convective mixing caused by the vortex-injection interaction away from the wall. This indicates that this methodology can provide good insight of the flow structure, and serve as a valid tool to better understand and investigate vortex-injection interaction flows. However, the effect of this interaction in heat flux near the compression wall is far from adequate, and this needs to be kept in mind if heat load or combustion are the focus of the analysis.
6.2.3 Upper fin position, low injection pressure
The LI-UF case produced similar results to the HI-UF case. As shown in Fig. 12, the location of heat flux peaks agree well between numerical and experimental data. Moreover, in the region unaffected by the aforementioned overprediction of TKE and heat transfer, the heat flux values tend to fall within experimental uncertainty. In the region close to the fin, where TKE and heat transfer is overpredicted, the discrepancies between numerical and experimental data are similar to what has been observed in the high injection pressure (HI-UF) case above.
Numerical and experimental heat transfer data. LI-UF (Case 4 in Table 2)

6.2.4 Lower fin position, high injection pressure
The heat flux results for Case 5, high injection pressure, low fin position (HI-LF) are presented in Fig. 13. In this case, the agreement between numerical and experimental data are better across the entire measurement domain. A large factor in this is that the region of overestimated heat transfer (see Fig. 8) has shifted in the negative Y direction and now sits outside the measurement region. Considering the measurement region alone, this case, HI-LF, shows the best match between numerical and experimental data in the present work.
Numerical and experimental heat transfer data. HI-LF (Case 5 in Table 2)

The good match between numerical and experimental data is particularly visible along line A, where the two distinct heat flux peaks created by the bow shock are clearly visible. Moreover, the location, peak value, and gradients of the heat flux curves across the whole measured domain are matched satisfactorily.
6.2.5 Lower fin position, low injection pressure
The heat flux data for Case 6, lower fin position, low injection pressure is presented in Fig.14. Again, thanks to the fin sitting further away from the measurement region, the effect of the region where heat transfer is overestimated close to the fin is reduced. When compared with the HI-LF case (same fin location but higher injection pressure), the agreement between numerical and experimental data appear to be slightly worse, due to the reduction in absolute heat transfer magnitude. Nevertheless the main flow features are adequately captured by the heat transfer measurements.
Numerical and experimental heat transfer data. LI-LF (Case 6 in Table 2)

7.0 DISCUSSION
Comparison of the simulations and experimental data has identified two regions where the simulations using the SST  $k-\omega$ model are deficient. First, in the freestream above the flat plate, and away from the region affected by the fin shock or vortex, the turbulence models predicts a too rapid increase in turbulence kinetic energy, leading to premature transition. As shown in Fig. 5(b), the simulations predict transition and an increase in heat transfer at approximately 300mm from the flat plate leading edge. In contrast, surface heat transfer measurements indicate that heat transfer remains low, indication a continued laminar state. Second, in the region close to the fin, corresponding to where the jet shown in Fig. 2 impinges on the flat plate, heat transfer is seen to be overpredicted substantially. Inspection of the simulation results indicate that this is caused by a localised region of elevated turbulence kinetic energy (TKE) that establises near the wall, as depicted in Fig. 8. This heat flux overprediction has been reported in literature in equivalent flowfields(Reference Jie and Jie43).
However, outside of these two regions good agreement between the numerical and experimental data exists, especially when focusing on the location of the main flow features and their effect on heat flux distribution. Both clearly show the presence of the horseshoe shaped region of high heat transfer, created by injector bow shock, as well as the presence of streaks of high and low heat transfer that form downstream of the injector, created by a counter rotating vortex as indicated in Fig. 9. This counter rotating vortex sits below the main boundary layer roll up vortex, and is caused by its interaction with the fuel jet. As the horseshoe vortex generated by the fuel jet interacts with the swept-shock separation vortex, one if its sides is dissipated, whereas the other is preserved and gains strength as it moves downstream. The fact that these detailed flow features are correctly resolved in the simulations, both in regards to position and heat transfer magnitude, give us confidence that the simulations correctly capture and resolve the complex flow field generated by the vortex-injection interaction, especially in the wake of the injector.
Being able to accurately resolve spatial heat transfer distributions on the flat plate surface, allows us to conclude that the simulations correctly capture the 3-D macro flow structures generated above the flat plate, including the vortex structures and transport of injected fuel. The RANS SST  $k-\omega$ approach showed limitations to accurately retrieve the heat flux distribution, especially close to the fin. Nonetheless, this approach seems an effective tool for analyzing the vortex-injection interaction when the main focus is on the location of the main flow features and vortical structures. Such is the the case of prior numerical studies by Llobet et al. that have analysed the mechanisms behind mixing enhancement in vortex-injection interactions(Reference Llobet, Jahn and Gollan15,Reference Llobet, Gollan and Jahn16) . On the contrary, numerical investigations focused on heat flux distribution in a vortex-injection interaction flowfield such as a study by Llobet et al. (Reference Llobet, Gollan and Jahn29) may suffer from the inherent SST $k-\omega$ limitations near the fin region.
When dealing with separated flows and mixing, the SST  $k-\omega$ is the model of choice. However, it could be of interest investigating other turbulence models that may improve the predictions of heat flux on the flat plate near the fin. Also, LES methods may provide more information and improve the prediction of the fuel mixing process, but the use of turbulence models near the walls is likely to reproduce the problems seen in RANS. These are topics to be considered in order to improve upon the presented work.
8.0 CONCLUSIONS
The aim of this study was to compare numerical and experimental data for a vortex-injection interaction, representative of scramjet inlet flow. To achieve this, a canonical geometry consisting of a flat plate plus a fin with a compression angle was used to generate vortices representative of those intrinsically generated in scramjet inlets. Fuel is injected into this vortex to generate a vortex-injection interaction and heat flux is measured downstream to allow a comparison between numerical and experimental data. A detailed description of the interaction flowfield, focusing on the heat flux distribution surrounding and downstream of the injector is presented and the data is used to assess the validity of the numerical methodology.
Results from a reference case with no injection showed that numerical simulations severely overpredicted heat transfer in a localised region near the fin. This discrepancy was identified as a tendency of the SST  $k-\omega$ turbulence model to overpredict turbulent kinetic energy (representative of turbulence intensity) close to the flat plate surface, where the fin shock compressed flow impinges on the flat plate. This heat flux overprediction has been previously reported in literature and seems an intrinsic limitation of the turbulence model. The same effect was also observed for the cases with fuel injection, but the affected area remained mostly outside the area of interest for studying the vortex-injection interaction. Moreover, the presence of the fuel jet creates strong effects that reduce the influence of this particular limitation of the turbulence model on the data. As such, the cases with higher injection pressure are less affected by this error.
When analysing the heat transfer in the wake of the vortex-injection interaction, good agreement is observed between the experiment and simulations, giving confidence in the ability of the current RANS approach to correctly capture the flow structures critical to the interaction flow field. For the presented configuration, a counter-rotating vortex is formed adjacent to the flat plate below the swept-shock separation vortex. This feature produces two characteristic strips of high (up to three times above the surrounding heat flux) and low heat flux at the reattachment and separation locations respectively. The location of these features is accurately retrieved numerically. The magnitude of heat flux for the bow shocks and separation lines correlate adequately between the simulations and experimental results. This strongly indicates that the numerical methodology is able to accurately predict the 3D flowfield structure created by the vortex-injection interaction.
The presented experimental data and simulation results create new insight into the heat transfer downstream of fuel jets injecting into vortices, as typicaly present in scramjet engines. The data also provide a new benchmark to assess current and future numerical works on vortex-injection interactions for scramjet engines. Moreover, this reinforces the validity of prior studies evaluating the ability of streamwise vortices to enhance mixing rate in scramjet engines(Reference Llobet, Gollan and Jahn16).
ACKNOWLEDGEMENTS
This research was supported under Australian Research Council’s Discovery Projects funding scheme (Project DP130102617-The science of scramjet propulsion). This research was undertaken with the assistance of resources from the National Computational Infrastructure (NCI), which is supported by the Australian Government, and by resources provided by The Pawsey Supercomputing Centre with funding from the Australian Government and the Government of Western Australia. The authors would also like to thank the School of Mechanical and Mining Engineering at UQ for the financial support.




 Open access

