


Although a number of studies have focused on native copper mining and use in the Great Lakes (Bebber and Eren Reference Bebber and Eren2018; Bebber et al. Reference Bebber, Norris, Flood, Fisch, Meindl and Eren2019; Bradford Reference Bradford2017; Drier and DuTemple Reference Drier and DuTemple2012; Ehrhardt Reference Ehrhardt, Roberts and Thornton2014; Griffin Reference Griffin1961; Halsey Reference Halsey1992, Reference Halsey2018; Hill Reference Hill2009, Reference Hill2012; Holmes Reference Holmes1901; Martin Reference Martin1999; Quimby and Spaulding Reference Quimby and Spaulding1957; Steinbring Reference Steinbring1975; Trevelyan Reference Trevelyan2004; Wittry Reference Wittry1950, Reference Frank and Mack1951), few have focused on native copper production. Those that have focused on copper production have taken one of two approaches. The first is through experimental archaeological re-creations of copper production to gain an experiential understanding of how the process works (Clark and Purdy Reference Clark, Purdy, Wertime and Steven F.1982; Cooper et al. Reference Cooper, Ling and Brenneman2015; Cushing Reference Cushing1894; Hoy Reference Hoy1903; LaRonge Reference LaRonge2001; Leader Reference Leader1988; Peterson Reference Peterson2003a, Reference Peterson2003b, Reference Peterson2004; Willoughby Reference Willoughby1903). The second examines formal tool forms to conceptualize how workers made the items (Crook Reference Crook2016; Martin Reference Martin1994; Schroeder and Ruhl Reference Schroeder and Ruhl1968; Vernon Reference Vernon, Lasca and Donahue1990).
Although these studies have expanded our understanding of the copper production process, they primarily focused on formal tool forms, giving little attention to waste materials generated during production (Clark Reference Clark1989). These waste materials are traces left by the interaction between people and copper throughout the production system. They hint at how the spatial organization of the production process reflects the relationships that people form with their material culture and the environment. By understanding the spatial organization of a production process, we can begin to understand not just the relationships that people in the past had with the entities around them but also how these relationships influenced aspects of their lives, including how and when they moved across the landscape. This is important both because it shines a light on Archaic lifeways in a largely understudied area of North America and it shows the complexity of one of the world’s oldest metallurgical traditions in the world: it pulls the narrative of the development of metallurgy away from the Old World and focuses it on Indigenous North America (Martin Reference Martin1999; Pompeani et al. Reference Pompeani, Steinman, Abbott, Pompeani, Reardon, DePasqual and Mueller2021).
The Archaic period (9000–2500 BP) in the northern Lake Superior Basin has been largely understudied, with few Archaic sites documented throughout the region (Clark Reference Clark1995; Dawson Reference Dawson1972, Reference Dawson1979; Emerson et al. Reference Emerson, McElrath and Fortier2009). The lack of information on this region is surprising, given the important role that the northern Lake Superior Basin plays as a primary source of native copper for the North American continent (Ehrhardt Reference Ehrhardt, Roberts and Thornton2014; Martin Reference Martin1999; Trevelyan Reference Trevelyan2004). Pompeani and colleagues (Reference Pompeani, Abbott, Bain, DePasqual and Finkenbinder2015) further complicated this gap in knowledge by demonstrating spikes in contaminants from sediment cores taken from across the region, indicating an increase in copper mining and use from 6500 to 5400 BP. In 2012 Isle Royale National Park launched the Nipissing relict-shoreline survey to locate Archaic deposits on ancient shorelines dating to between 4,000 to 6,000 years ago (Blewett Reference Blewett2009). Over the past 12 years, this project has identified more than 40 Archaic copper production and habitation sites on Isle Royale. The identification of these sites provides an opportunity to understand not only the Archaic period on Isle Royale but also the wide-reaching impact of native copper on Indigenous peoples in North America. The large number of copper production and habitation sites found by the Nipissing relict-shoreline survey highlights how the Archaic period is understudied across the region.
In my research on copper production, I brought together data from across the northern Lake Superior Basin, working with government entities, local universities, and private collectors to generate the information needed for this type of analysis. This new, cohesive body of data acts not only as a catalyst for examining Archaic copper production in this region but also opens a larger discussion of the role of native copper in the lives of Indigenous peoples who lived across North America during the Archaic period.
For this study, I examined copper waste on Archaic sites across the northern Lake Superior Basin to identify geospatial patterns in the copper production system. I began with a morphological analysis of copper waste at production sites. Previous work using geospatial analysis on copper production in North America was done by Pike and coauthors (Reference Pike, Cooper and Hunt2019), who used least-cost path analysis to identify the geospatial movement of people during the copper production process in the Arctic/Subarctic. I examined the production process by systematically examining copper waste materials from 223 copper production sites across the northern Lake Superior Basin. I then analyzed this information geospatially using both the Optimized Hot Spot Analysis and kernel density methods on ArcGIS to identify where stages of production take place as people and copper moved across the landscape.
A Brief Note on the Ethics of Using Private Collections
As Lundeen (Reference Lundeen1997) argues, artifacts from looted contexts contain important information and are necessary and important for archaeologists to study. By using these collections in research, archaeologists have an opportunity to recover some of the data lost when these artifacts were removed from context. However, it is also important to acknowledge the damage that these types of activities have on both the archaeological record and on global and local heritage (Elia Reference Elia1997; Proulx Reference Proulx2013). Archaeological deposits are a nonrenewable resource that once destroyed cannot be recovered. Part of the data used for this study comes from collaborations with private collectors in the Lake Superior Basin. They have spent their lives collecting artifacts, amassing large personal collections. Many of the artifacts recovered by these collectors come from contexts that had been previously disturbed by construction activities. These collections are well provenanced with detailed records of the artifact’s context and collection strategies. All but one of the collections analyzed were donated to local government and educational institutions for curation and research. The one exception is still privately owned, but the owner is in talks with a local educational institution to donate the collection for curation and research. The private collections analyzed for this project are only included in the tabulated data. No images are shown of these artifacts nor are any specific references made to them.
Native Copper Industry
The northern Lake Superior Basin is in the far northern reaches of a metal-using industry that began more than 9,500 years ago (Bebber and Key Reference Bebber and Key2022; Bebber et al. Reference Bebber, Buchanan and Holland-Lulewicz2022; Pompeani et al. Reference Pompeani, Steinman, Abbott, Pompeani, Reardon, DePasqual and Mueller2021). I use the term “Native Copper Industry” to refer to all copper procurement, production, and use by Indigenous peoples in North America’s Great Lakes Region. The development of this industry partly owes to the large deposits of native copper. In the northern Lake Superior Basin, copper comes primarily from deposits on Isle Royale. The native copper found on Isle Royale is upward of 99.9% pure copper and exists in a metallic form, allowing it to be worked without melting or smelting (Martin Reference Martin1999; Neiburger Reference Neiburger1987, Reference Neiburger1992, Reference Neiburger1999; Vernon Reference Vernon, Lasca and Donahue1990). Instead, people treated copper as a transformative technology that could manipulate it from the desired shape.
This manipulation could be done by either hot or cold forging the copper (Childs Reference Childs, Scott and Meyers1994; Crook Reference Crook2016; Ehrhardt Reference Ehrhardt, Roberts and Thornton2014; Frank and Mack Reference Frank and Mack1951; LaRonge Reference LaRonge2001; Martin Reference Martin1999; McPherron Reference McPherron1967; Schroeder and Ruhl Reference Schroeder and Ruhl1968; Vernon Reference Vernon, Lasca and Donahue1990). In hot forging, a worker heats the copper before hammering it to increase the copper’s elasticity. This process is done in cycles, pausing only to reheat the copper in between hammerings. The high working temperature of hot forging burns up the smaller pieces of copper waste, leaving behind only larger pieces. Cold hammering works the copper at room temperature, relying on periodic annealing to keep the copper malleable and elastic. Annealing heats the copper in a fire above 200°C, which allows the crystalline structure of the copper to regrow, making it malleable and able to be deformed (Bastian Reference Bastian and Griffin1961:171). Heating copper causes it to change color from gloss-off to black, red, and orange (LaRonge Reference LaRonge2001). These color changes indicate temperature changes, enabling the worker to track the annealing process. Working the copper at lower temperatures preserves smaller pieces of waste and makes them accessible in the archaeological record. It is through the generation of copper waste that the spatial patterns of copper production can be identified.
Copper Production
The study of copper waste has received limited attention, and as a result, little can be inferred about the organization of the production process. I define copper waste as pieces of copper that are discarded or abandoned during the production process for any reason (Peterson Reference Peterson2023). All copper artifacts that enter the production process are eventually discarded as waste in one form or another, as demonstrated by their presence in the archaeological record. Clark (Reference Clark1989) devised a preliminary classification for Woodland copper waste from Isle Royale based on lithic reduction sequences: raw with matrix; raw without matrix; nugget, hammered; flat, vesicular; flat, homogeneous; flat, laminated; rolled, laminated; and bars.
Stroh (Reference Stroh2014) applied Clark’s (Reference Clark1989) classification system to describe copper production on Archaic sites on Isle Royale, even though Clark noted that his classification system applied only to Woodland copper waste on Isle Royale and not other contexts. Olson (Reference Olson2018) then refined Clark’s (Reference Clark1989) classification system by dividing it into four stages of production:
1. Stage one: raw with matrix/raw without matrix
2. Stage two: nugget, hammered/flat, vesicular
3. Stage three: flat, homogeneous/flat, laminated/rolled, laminated
4. Stage four: bar, preform, tool
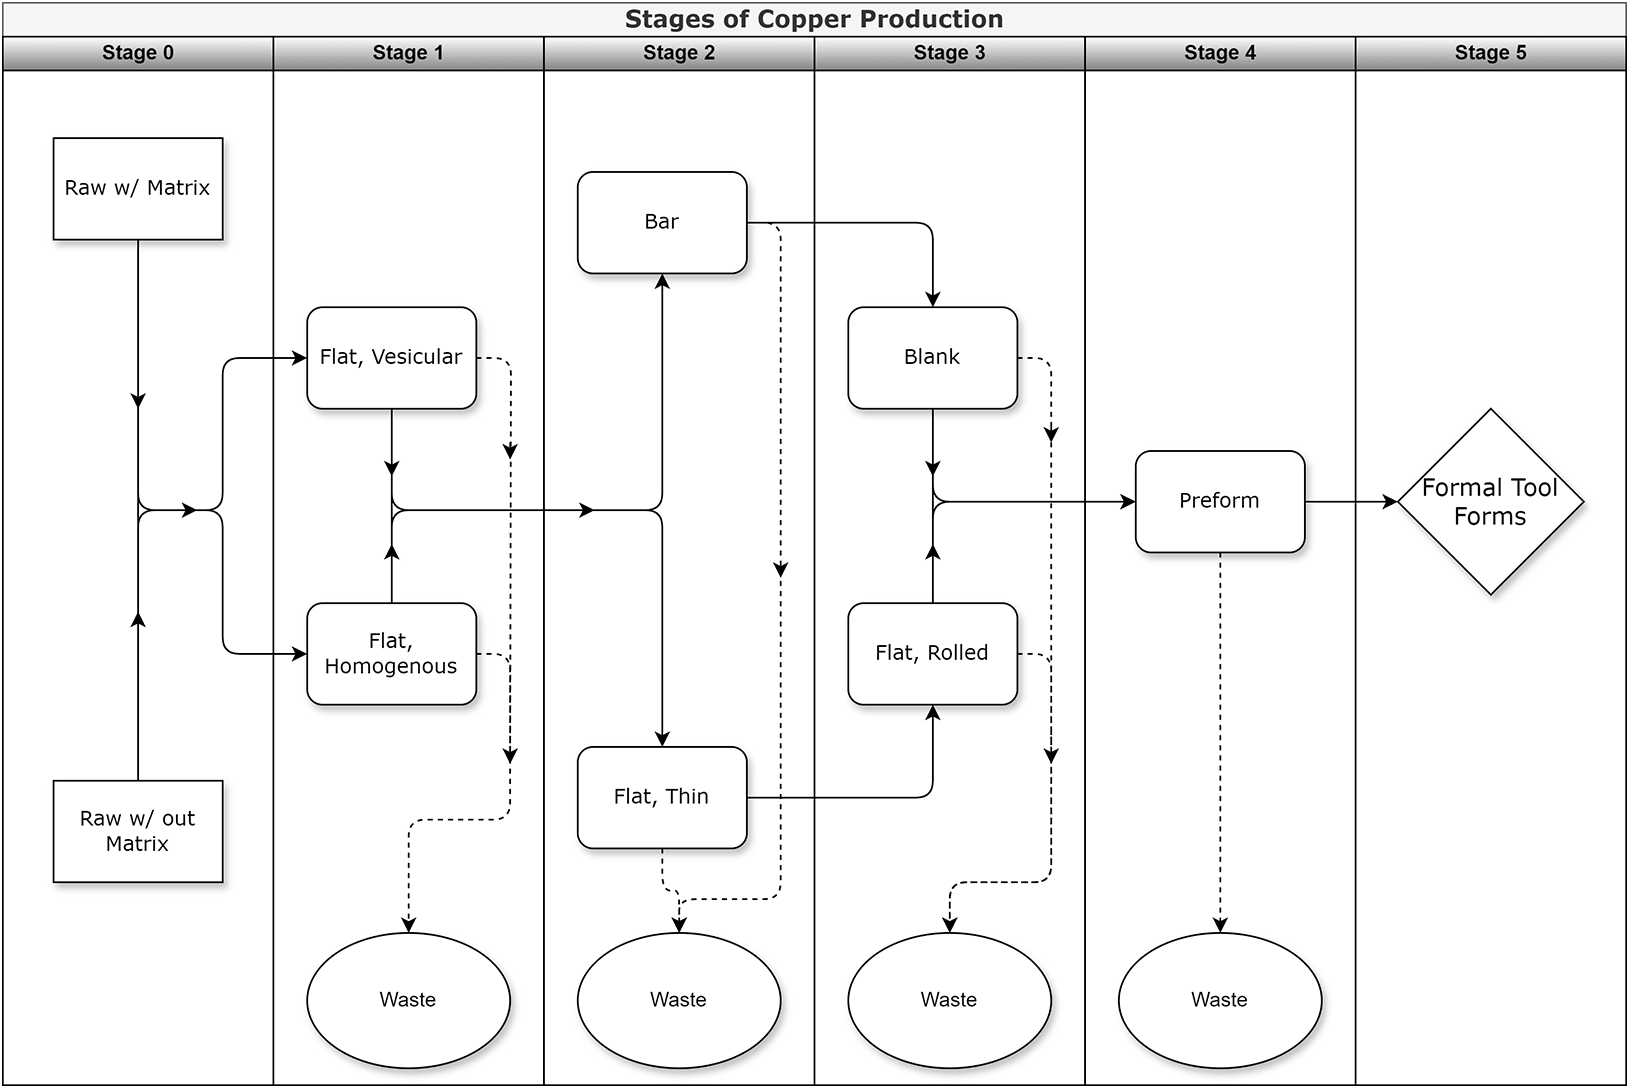
Olson’s (Reference Olson2018) study, however, did not evaluate the applicability of Clark’s (Reference Clark1989) classification in an Archaic context on Isle Royale. Therefore, I created a classification sequence for Archaic copper production sites on Isle Royale and Lake Superior’s north shore based on the morphological analysis of copper artifacts recovered from Archaic production sites in this region (Figure 1). It modified Clark’s (Reference Clark1989) terms and definitions to match the artifacts retrieved from Archaic sites. My system has 11 categories of Archaic copper production: 10 classify copper waste, and the last one represents formal tool forms (Figure 2):
1. Raw with matrix: This category applies to copper that contains a non-metallic matrix and shows no evidence of being hammered or modified. The copper can be partially attached or included in the non-metallic matrix made up of basalt, calcite, epidote, and other non-metallic materials. The extent of inclusion determines the quality of the copper. Pieces that are extensively intermingled into a rock matrix are low in quality, and it is difficult to separate a usable piece. This category represents the very beginning of the copper production process.
2. Raw without matrix: This category applies to copper that does not contain a non-metallic matrix and shows no evidence of hammering or other types of modification. These pieces can take a variety of shapes but are often rounded and amorphous. Float copper best represents raw copper without a matrix. The quality of these pieces is variable depending on the piece’s internal homogeneity. Some pieces are solid copper, whereas others contain internal matrices of rock.
3. Flat/Vesicular: This category and the next represent the initial stage in the copper production process. Flat vesiculars are hammered pieces of copper that contain cavities or gaps produced when the non-metallic matrix falls out when being hammered. Clark (Reference Clark1989) describes these pieces as having a “Swiss cheese effect” (Figure 3).
4. Flat/Homogeneous: This category represents homogeneous pieces of copper that are hammered flat and contain no cavities or holes. Pieces in this category have not yet been squared up on the sides. They vary in thickness, but all contain evidence of initial hammering on the top and bottom.
5. Thin/Flat: Copper in this category has been flattened and thinned into sheets of thin hammered copper, each of which represents a single flattened piece. There is no evidence that these pieces were layered together. Sheets vary in size and thickness, ranging from small, thin pieces to large, flattened sheets. This category represents the extent to which a piece of copper can be thinned.
6. Thin/Rolled: Copper pieces in this category have been rolled into thin/flat pieces. I include the partial or crushed rolling of beads within this classification.
7. Bar: This category includes initially hammered and flattened pieces that have been squared up. Bars are worked on at least four sides and sometimes six. They vary in size from large “ingots” to small bars. Once a piece is drawn out and formed, it is no longer included in the bar category (Figure 4).
8. Blank: In this category are bars that have begun to be drawn out. Blanks often are elongated rectangles that taper to one side. The difference between blanks and preforms is that we can identify the final form of a preform (Figure 5).
9. Preform: Pieces in this category are in the last step in the production process before being transformed into formal tools. Preforms are often elongated and partially formed blanks/bars, and we can usually identify their final form. In the case of pointed or bladed objects, preforms often take the general shape of their final state but lack an edge or a tip and often appear blunted compared to formal tools (Figure 6).
10. Formal Tool Form: Pieces in this category have completed the production process. The presence of a formal tool, however, does not indicate that copper production occurred at that site. Formal tools may be classified in different ways based on their form, although typically the Wittry typology is used. Formal tools are not finished products but can continue to be reworked throughout their use life. The transformative properties of copper enable tools to be easily reshaped and altered even after artisans have made them into a recognizable form tool (Figure 7).
11. Small/Amorphous: This category represents the small pieces of debris too small to fit into any other type. It also includes small pieces that break off during any stage of the production process.
Stages of copper production created while analyzing archaic copper waste.

Illustration of copper waste types.

Stage 1: flattened copper/vesicular (courtesy NPS, Isle Royale National Park). (Color online)

Stage 2: copper bar (courtesy NPS, Isle Royale National Park). (Color online)

Stage 3: copper blank (courtesy NPS, Isle Royale National Park). (Color online)

Stage 4: copper preform (courtesy NPS, Isle Royale National Park). (Color online)

Stage 5: formal tool form (copper knife; courtesy NPS, Isle Royale National Park). (Color online)

These categories provide the language to discuss the type of copper waste found on production sites, but they do not describe the sequence of the production process. Following Olson’s (Reference Olson2018) example, I synthesized these categories into six stages of production. I based these stages of production on my own experience working copper to create different types of objects (Peterson Reference Peterson2023). For my experimental work, I documented each change in the morphology of the copper between each stage of annealing. Although these changes were gradual, they gave me a basis to compare each piece of copper worked and to generalize overall stages in production. I also drew from my experience analyzing copper waste on the archaeological sites across the region. These stages are arbitrary and may not reflect how Indigenous peoples thought about production sequences, but they are reflective of the archaeological record and are an appropriate measure of copper production stages (see Figure 1 and 2):
1. Stage 0: raw w/matrix and raw w/out matrix
2. Stage 1: flat vesicular and flat homogenous
3. Stage 2: bar and thin flat
4. Stage 3: blanks and thin, rolled
5. Stage 4: preform
6. Stage 5: formal tool forms
Because multiple stages of production could occur at each site, I reclassified each site as early, mid, late, and multistage (Clark Reference Clark1989). Early-stage production sites contain primarily stage zero and one production debris; this category includes mining and extraction sites. Mid-stage production sites, which have mostly second- and third-stage production debris, focus on reducing hammered copper to be transported abroad. Late-stage production sites contain primarily fourth- and fifth-stage production debris and tools; at these sites occur the final hammering, grinding, and hafting of copper implements. Because a formal tool is not necessarily a finished tool, it may be reworked, resharpened, or even hafted by a worker. Multistage sites are late-stage sites, with earlier-stage material being transported to these locations for further reduction; however, not every late-stage site is a multistage production site. Multistage sites contain debris from all or most stages of production.
Methods
My analysis relies on the use of geographic information systems, particularly the Optimized Hot Spot Analysis and Kernel Density tools on ArcGIS Pro, as the primary method for analysis. I chose these tools because they enabled me to identify spatial statistically significant cold and hot spots of production, not just the overall density. The Hot Spot Analysis tool—and, by extension, the Optimized Hot Spot Analysis tool—calculates the Getis-Ord Gi* statistic for each feature in the dataset to identify statistically significant spatial clusters of hot and cold spots (ESRI 2023a).Footnote 1 A feature (site) must have a high value (or low for cold spots) and be surrounded by other features (sites) with high values to be statistically significant. The Hot Spot Analysis tool sorts features into three categories: statistically significant hot spots, statistically significant cold spots, and those with no statistical significance. The Optimized Hot Spot Analysis tool takes this even further by evaluating the characteristics of the input feature class to produce optimal results (ESRI 2023b). To strengthen the Optimized Hot Spot Analysis, I calculated the kernel density of each stage in the production process using the Kernel Density tool to determine where values concentrated geospatially.
Data Collection
On Isle Royale, the National Park Service (NPS) primarily recovers artifacts through pedestrian walkover surveys, standard test-pit surveys, and excavation test units. Most of the data generated on Archaic copper production came from an NPS project beginning in 2012 that surveyed high-elevation relict shorelines to locate Archaic deposits. The relict-shoreline survey used a combination of metal detectors and test-pit grids to identify cultural materials along the Nipissing relict shoreline. In situ site preservation was vital to this project, and so most archaeological deposits were left undisturbed. Accidental finds by park visitors and staff occurred often, especially along eroding trails and campgrounds. I accessed data on 58 Archaic copper production sites on Isle Royale through digital files of collection and site data provided by the NPS.
On the north shore of Lake Superior (“the north shore” hereafter), the archaeological record relies on the work of hobbyists and private collectors, who are avocational archaeologists. These collectors explore disturbed areas along the waterways of the north shore and then meticulously document and record every find. The sites were deemed to be Archaic either because of their location along the Nipissing relict shoreline or the aceramic nature of the site. The major difference between the collections on Isle Royale and on the north shore was that the private collectors took a total recovery approach to collecting, whereas the NPS project focused on a site-preservation approach (Table 1). Later, I discuss how I attempted to make these datasets compatible.
Total Counts for Copper Waste for Each Stage of Copper Production.

In addition to private collections, I also examined collections held by the Ontario Ministry of Tourism, Culture, and Sport: I was permitted to access their facility in Thunder Bay and document the relevant collections housed there. These collections primarily consisted of artifacts and records from the Renshaw site, an Archaic copper production site excavated by professional archaeologists in the 1990s. I also accessed collections housed at Grand Portage National Monument, Lake Superior National Forest, and Lakehead University. In total, I examined 165 archaeological sites from the north shore of Lake Superior for a total of 223 sites from across the northern Lake Superior Basin.
Data Analysis
Dating techniques varied depending on the site, but most of the sites were dated based on their placement on the Nipissing relict shoreline. Radiocarbon dates tested from a small number of these sites confirmed the age of the relict shoreline (Beukens et al. Reference Beukens, Pavlish, Hancock, Farquhar, Wilson, Julig and Ross1992; Olson Reference Olson2018). Other sites along Dog Lake (located to the north of and connected to Lake Superior via the Kaministiquia River) were dated either by diagnostic artifacts or the aceramic nature of the sites. I classified copper artifacts for each location according to the six stages of copper production discussed earlier.
As mentioned, collection methods on Isle Royale favored site preservation, and those on the north shore favored total recovery, which should have yielded more artifacts than found on Isle Royale; yet, there were more years of excavation on Isle Royale. To correct this discrepancy between the number of artifacts found in the two areas, I used the Optimized Hot Spot Analysis tool on ArcGIS Pro to identify statistically significant hot and cold spots, rather than just artifact density. First, I ran the analysis so that each site contained a count of copper artifacts from each production stage. Second, I averaged the count information for each stage of production of each site to identify the percentage of each stage at each location. By averaging the counts, I was better able to identify areas that specialized in certain stages of production. I then used the Kernel Density tool on ArcGIS Pro to determine the density of artifacts for each stage, regardless of statistical significance.
Results
The Optimized Hot Spot Analysis tool created two step-by-step map sequences that tracked the geospatial distribution of copper production across the northern Lake Superior Basin, one by count and one by percentage (Figures 8 and 9). Although there are differences between the two sequences, both follow a similar pattern. In the count model’s stage zero, there are statistically significant hot spots on Isle Royale, with a small hot spot on the north shore (Figure 9). Inland sites on the north shore show statistically significant cold spots. For stages one through three, there are no statistically significant hot or cold spots along the north shore and on Isle Royale, indicating the presence of these stages in those locations but not in statistically significant high or low amounts. In stage four, only a single site has statistically significant hot spots, which may be because high amounts of stage four materials are only found on a limited number of sites. In stage five there are statistically significant hot spots in the north shore’s interior along the south end of Dog Lake and statistically significant cold spots on Isle Royale.
Copper production hot spot analysis (percentage).

Copper production hot spot analysis (count).

In terms of percentages, stage zero follows a similar trend, with statistically significant hot spots on Isle Royale and along the shoreline of the north shore, as well as cold spots in the interior concentrated around Dog Lake (Figure 8). Stage one shows statistically significant hot spots along the coastline of the north shore and on the south end of Dog Lake. Stages two through four are all statistically insignificant, with a single hot spot in the interior of stage four. Thus, production is likely spread out across the landscape for stages two through four. Although this distribution could be in either high or low concentrations, the percentage data for each site indicate that most of these values are low, meaning that they account for little of the total site distribution. Stage five shows statistically significant cold spots on Isle Royale and the shoreline of the north shore while showing hot spots on all the interior sites.
Although the presence of hot and cold spots can be very telling, so can the locations that have no statistical significance. A lack of statistical significance does not mean that no production took place at these locations. In fact, the opposite is likely, because concentrations of zero values would cause an area to be considered a cold spot. Instead, these locations should be considered spread-out locations of production that are neither cold nor hot.
The kernel density analysis created one step-by-step map sequence that showed the density of copper production by stage of production (Figure 10). Three primary patterns appeared as copper production stages shifted between Isle Royale and the north shore. First, stage zero shows the highest concentration on Isle Royale, with a slight concentration along Lake Superior’s coast. Second, stages one through four show similar distributions, with concentrations along Lake Superior’s coast and around the south end of Dog Lake. Third, in stage five, although following a similar trend to stages one through four, sites are concentrated on the interior of the North Shore, including around Dog Lake.
Copper production kernel density.

Discussion
Organization of Production
The copper production process began at mining sites on Isle Royale. Researchers have not found any significant precontact sources of native copper on Lake Superior’s north shore, meaning that most of the copper found on sites in that region are manuports (Ripley et al. Reference Ripley, Lambert and Frick1998; Severson et al. Reference Severson, Miller, Peterson, Green, Hauck, Miller, Green, Severson, Chandler, Hauck, Peterson and Wahl2002; Smyk and Franklin Reference Smyk and Franklin2007). The hot spot analysis demonstrates that stage zero copper artifacts were concentrated on Isle Royale, with some being found on shoreline sites along the north shore. Inversely, we can see that stage zero copper artifacts have a cold spot on the north shore, indicating that people were working copper there before it entered the interior. Stage one copper artifacts concentrate on shoreline sites along the north shore and sites on the south end of Dog Lake. Other locations show no statistically significant hot or cold spots, indicating that people brought some stage one copper artifacts to these areas but not in a clear pattern. The changes in location between stage zero and stage one artifacts show that copper production moved from Isle Royale to shoreline sites along the north shore. This model does not support significant copper production on Isle Royale.
We can see the most significant difference between the count and percentage models in stages two and three. The percentage model shows no significant hot or cold spots for these two stages, whereas the count model shows significant hot spots on the shoreline of the north shore for both stages. This finding is due to the averaging effect of the percentage calculation. Multiple stages of production took place at these shoreline sites, causing the values to be lower and thus not recognized as hot spots in this model. I correct for this in the count model, which does not rely on data averaging. For each model, stage four contains only one hot spot at an isolated site in the interior. This indicates an even distribution of stage four artifacts across the sites in the area. The distribution of stage five sites is the opposite of stage zero sites, with significant cold spots on Isle Royale and significant hot spots on the interior of the north shore.
Thus, copper production stages changed as copper moved across the landscape. Here I return to the three stages of production identified earlier: early, middle, and late-stage production. Early-stage production took place on Isle Royale, where copper was first mined and procured. The lack of raw copper on the north shore indicates that the copper was altered before leaving Isle Royale. As people worked the copper, they transported it from Isle Royale to shoreline sites along the north shore. Middle-stage production took place at these shoreline sites: stages two and three both contain significant hot spots in this area. In stage four the copper was distributed across the landscape before being made into formal tool forms. Late-stage production took place in the interior of Lake Superior’s north shore, concentrated around Dog Lake and the surrounding bodies of water. Stage five shows a significant distribution on sites on the north shore’s interior, with a noticeable absence of stage five artifacts on Isle Royale and along the shoreline of the north shore. As copper progressed through the production system, little returned to Isle Royale.
The kernel density analysis, while not tracking the hot spot analysis exactly, shows the same pattern of copper production. Stage zero copper artifacts are primarily on Isle Royale, with limited raw copper pieces showing up on the coast of the north shore. There is little variation between stages one through four: artifacts are concentrated between the coast of the north shore and along inland waterways, with the largest concentration along the south end of Dog Lake. There is a slight decrease in concentration between stages one and two and stages three and four along the coast, indicating that late-stage copper production was shifting toward interior sites. The similar concentrations in these stages is likely due to the spread of production across this area as people moved from the north shore to the interior. We can see stage five copper artifacts primarily on interior sites around Dog Lake, with very few on Isle Royale. The kernel density analysis looks directly at raw counts at each location, and its result are influenced by the known collection bias between Isle Royale and the north shore: most of the copper is concentrated on the north shore, simply because higher amounts of copper were collected on sites in this area. However, the hot spot analysis tool uses statistical processing to help correct this bias. The combination of both the hot spot analysis and the kernel density analysis supports a shifting model of copper production, regardless of potential collection bias.
Archaic Copper Production
It is important to note that although we can view copper as an entity with its own agency that is capable of acting and being acted on, its movement reflected people’s movement across the landscape. Yet, not all the copper had to be moved at one time by an interconnected group or groups of people: instead, my findings argue the opposite. People used copper over a long period, with different generations and groups taking part in its production. The Nipissing high paleo lake level event took place over a 2,000-year period, a time of dynamic change in the landscape. It is thus necessary that during this 2,000-year period that a generational movement of technological knowledge is passed on as both recipes of production and the technoscience required to understand the technology.
We can better understand the copper production system by studying its discard stage. People worked copper at different locations in different stages of production throughout the Nipissing high (4,000 to 6,000 years ago). Copper procurement began by accessing naturally occurring deposits of copper on Isle Royale through industrial-scale mining. We can see this at procurement sites such as the Minong Mine (with more than 600 pits recorded) and the South Shore Copper Mining District (with more than 100 pits recorded). Excavations at the South Shore Copper Mining District in the 2023 season revealed that miners left behind very little copper. There was also a distinct lack of any habitation materials (such as chipped stone or bone) at the procurement site, indicating that copper production took place at a different site. Early to mid-stages of copper production primarily occurred along coastal areas on and off Isle Royale. These production sites were not physically separated from habitation sites: instead, people worked copper and lithics where they lived. Late-stage production sites correlate with inland habitation sites along waterways north of Lake Superior’s north shore that provided easy access between Lake Superior and the continent’s interior. These sites contain mostly formal tool forms, indicating that artisans finished copper tools away from Isle Royale.
Did the production process from start to finish involve down-the-line trade or the movement of single groups? We can answer this question by studying the use life of copper production. For a regional study such as this, it is challenging to identify evidence of trade because of the proximity of production sites. Hill (Reference Hill2009), for example, studied exchange on copper production sites in the western Great Lakes region. He compared and contrasted geographically distinct communities throughout Wisconsin based on the geochemistry of copper artifacts found at each site. In the northern Lake Superior Basin, there was a strong connection between materials and tools used on copper production sites on Isle Royale and those used on the north shore. Most obvious were similarities in lithic tool materials. Many lithic materials found on Archaic copper production sites on Isle Royale originated from primary and secondary deposits along the north shore (Olson Reference Olson2018; Stroh Reference Stroh2014). The most prominent deposits come from the Gunflint Formation, located northwest of Thunder Bay. Indigenous peoples have extensively used the Gunflint Formation since the Paleo period because of the high quality of the knappable stone found there (Dawson Reference Dawson1983; Julig Reference Julig1994).
According to Clark (Reference Clark1995) and Pompeani et alia (Reference Pompeani, Abbott, Bain, DePasqual and Finkenbinder2015), people visiting Isle Royale during the Archaic period primarily came from the north shore. Mulholland and colleagues (Reference Mulholland, Mulholland, Hamilton and Stark2011) surveyed Minnesota’s portion of Lake Superior’s north shore and identified no evidence of Archaic copper moving west. Dawson (Reference Dawson1979) also found sparse evidence of Archaic copper use in Pukaskwa National Park in the eastern Lake Superior basin. This argument partially relies on the distance between Isle Royale and the Keweenaw Peninsula (90 km) compared to that between Isle Royale and the north shore (24 km). Additionally, the presence of primary copper deposits in the Keweenaw Peninsula eliminated the need to travel to Isle Royale to access copper. Trotter (Reference Trotter2017) concluded from hammerstone use and manufacture that the people who mined in the Keweenaw were a different group of people than the individuals mining on Isle Royale. These arguments show that copper is primarily moving north in a drawn-out production system. Based on this, we can conclude that copper production sites on Isle Royale and the north shore are connected. It is probable that there was exchange between people in this region, but this would not be easy to distinguish in this setting.
If the movement of copper indicated movement within a group of people (across multiple generations), what was the meaning of these patterns of movement and production? The answer requires understanding how people moved across the landscape during the Archaic period. At that time, people were mobile hunter-gatherers who moved in seasonal rotations depending on the availability of resources (Emerson et al. Reference Emerson, McElrath and Fortier2009; Neubauer Reference Neubauer2018). Mobile groups during the Middle and Late Archaic were highly regionalized compared to earlier periods, taking advantage of resources in a specific region, including lithic and copper sources. The practice of seasonal mobility continued through the Woodland period and into the postcontact period, with Ojibwe people practicing a similar type of seasonal subsistence on and off Isle Royale (Clark Reference Clark1999; Cochrane Reference Cochrane2009). During the summer and fall, the Ojibwe gathered resources on Isle Royale, taking great care to be respectful to the island and the entities that inhabited it, as well as the surrounding waters (Cochrane Reference Cochrane2009). People gathered on the coast to access resources and to avoid the buggy, hot interior. During the spring and fall inland waterways served as highways for movement between the interior and Lake Superior. Dog Lake was especially important because of the multiple waterways that converged there before flowing south to Lake Superior. During the winter, people would disperse inland to escape the harsh winter weather of the Great Lakes (Cochrane Reference Cochrane2009; Neubauer Reference Neubauer2018:48). Although people occasionally crossed the ice to Isle Royale in the winter to hunt, no year-round habitation was recorded there (Cochrane Reference Cochrane2009). Crossing the ice between Isle Royale and the north shore was risky because of the unpredictable weather. The movement of copper across the landscape followed a similar pattern, traveling with people as they moved from warm-weather camps on Isle Royale to cold-weather ones in the interior.
Based on the evidence presented here, I argue for the seasonal mobility of copper production across the landscape. During the warmer months (summer and fall), people would mine copper at procurement sites in the interior of Isle Royale. After it was mined, people would transport copper to coastal production/habitation sites, where they would work it in the early stages of production. As the weather turned colder, people continued their movement across the landscape, moving to the mainland and eventually inland along traversable waterways: they would complete the process there of making copper tools during the colder months of the year. Evidence of multistage production sites along the coast of Isle Royale and the north shore indicates that the production system likely followed a general seasonal mobility pattern.
I propose two theories for this seasonality based on the beliefs and practices of descendant communities, most notably the Ojibwe. The first stems from the Ojibwe’s practice of storytelling. They told traditional stories only during the winter so that the manitous would not hear themselves being spoken of (Cochrane Reference Cochrane2009:44). Manitous are realities other than physical ones that entities such as copper, water, or fire embody (Johnston Reference Johnston1996). People during the Archaic period may have purposefully halted the final production of copper items until they had moved away from Isle Royale and Lake Superior because of the strong association between copper and Lake Superior/Isle Royale represented by copper manitous.
The second theory is that certain stages needed to be conducted at specific locations because of the connections between the entities involved in the copper production process. For example, in the Ojibwe creation story, the middle world is created from soil that is placed on the shell of a turtle, which creates the first island that grew into North America (Johnston Reference Johnston1996). As an island, Isle Royale is considered a sacred space because of this connection, and it may not have been deemed appropriate to create finished copper tools there (Cochrane Reference Cochrane2009). Isle Royale’s association with copper manitous may have also come into play. The removal of copper from Isle Royale had to be done with respect and reverence to the copper and its associated entities. Waiting to work the copper until it was moved off Isle Royale and across Lake Superior might have been seen as important for securing safe passage across the lake. These are just two examples of the spiritual connections underlying the copper production process. Thus, the spaced-out production process reflected a purposeful delay in manufacturing copper items largely because of the relationships that people formed with the copper during the production process.
Conclusion
In this article, I examined the geospatial organization of copper production in the northern Lake Superior Basin by examining copper waste across Archaic sites in the region. Copper production is a continuous process that played out across the landscape as people moved from place to place. As they traveled, they discarded waste pieces, leaving traces of the production process across the landscape. They discarded some pieces, but others made their way into the production process where workers fashioned them into formal tool forms.
This movement of people reflected their seasonal mobility across the landscape. Early stages of copper production took place on Isle Royale during the warmer parts of the year. Instead of continuing production on Isle Royale, Archaic people purposefully waited to continue the production process until they were at a different location in another time of the year. The middle stages of production took place along the coast of Lake Superior’s north shore during the transitional months (fall) of the year, with formal tools being made on inland sites that people traveled to as the weather got and stayed colder. This purposeful delaying of copper production by time and place can be linked to the relationship that people formed with copper and the environment. By studying copper waste across hundreds of production sites, we can begin to see how this relationship influences people’s choices.
Overall, this geospatial analysis demonstrates that Archaic copper production in the Lake Superior Basin was a complex metallurgical industry that intricately played out across the landscape. Metal production in the Great Lakes differed significantly from Old World metallurgy, because the purity of native copper obviated the need for smelting (Vernon Reference Vernon, Lasca and Donahue1990). Instead, a complex metallurgical system developed over the past 10,000 years that was only interrupted by European trade goods in the fifteenth century (Martin Reference Martin1999). The development of copper metallurgy required no progressive evolution that “failed” to take place. Indigenous peoples in North America were engaged in a complex system of copper production and interaction taking place on a continent-wide scale. Indigenous cultures in North America not only possessed metallurgy but also developed a complex system that should not be compared to European metallurgy but instead was part of a heterogenous global development of metallurgy that followed multiple paths (Roberts and Thornton Reference Roberts and Thornton2014; White and Hamilton Reference White and Hamilton2009).
My model demonstrates that the Indigenous groups from Lake Superior’s north shore were the primary miners and workers of copper during the Middle into the Late Archaic period. Based on the large amounts of copper found on production sites across this region, it is likely that much of the copper mined on Isle Royale did not stray far from its source. It is also equally as likely that some of this copper made its way outside the northern Lake Superior basin through the movement of people and trade of copper (Hill Reference Hill2012; Hill et al. Reference Hill, Greenlee and Neff2016). Copper was an important component not only of the Archaic toolkit but also of Archaic lifeways in the northern Lake Superior Basin. It is only through understanding copper production and use at its source that we can begin to understand the importance and impact of copper production on the North American continent.
Acknowledgments
My research would not have been possible without the help of individuals and institutions that provided me with the data I needed. First, I would like to acknowledge the employees and volunteers of Isle Royale National Park. I would like to thank everyone who was involved in the NPS relict-shoreline survey for their hard work and dedication. Specifically, I would like to thank park archaeologist Seth DePasqual. Without Seth’s help and support, this project could not have happened. Second, I would like to thank my colleagues from the north shore, who agreed to help me before ever meeting me. My thanks go out to Clarence Surette, Chris McEvoy, Scott Hamilton, and Andrew Conly of Lakehead University; Lisa Sonnenburg and David Arthurs of Parks Canada; Robert Pierre of Fort Williams First Nation; Paige Campbell of the Ministry of Heritage, Sport, Tourism, and Culture Industries; Sarah Silvestri of Thunder Bay Museum; Stephen Veit of the National Park Service; and Lee Johnston and Samantha Olsen of the National Forest Service. I would also like to give a special thanks to Terry Wilson who opened his home to me to examine his collection.
Funding Statement
This work was supported by the Department of Anthropology at Indiana University under the David C. Skomp feasibility fellowship.
Data Availability Statement
All data are available in Peterson (Reference Peterson2024), which can be accessed through ProQuest at https://www.proquest.com/dissertations-theses/lake-superior-s-native-copper-industry-archaic/docview/3048407282/se-2.
Competing Interests
The author declares none.


 Open access