

1. Introduction
Climate has been shown to be a key driver of a range of development outcomes, including economic growth, human health and mortality, agricultural productivity and even conflict (Dell et al., Reference Dell, Jones and Olken2014; Carleton and Hsiang, Reference Carleton and Hsiang2016; Castells-Quintana, Reference Castells-Quintana2017). There is now increasing concern that climate change will heavily impact prospects for development. According to the latest estimates from the IPCC (Reference Masson-Delmotte, Zhai, Pirani, Connors, Péan and Berger2021), global average temperatures are expected to rise by between 1.5 and 5.7°C by the end of the century, depending on the evolution of greenhouse gas emissions. Along with gradual changes in global temperatures, there will be an increase in the frequency and intensity of extreme weather events. For 2°C of warming, the frequency of droughts, for instance, will more than double, while the frequency of a one-in-50-year extreme heat event will increase almost 14-fold (IPCC, Reference Masson-Delmotte, Zhai, Pirani, Connors, Péan and Berger2021). Understanding the socio-economic consequences of these changes is of first-order importance not only for informing climate change mitigation and adaptation strategies but also for the design of development policies.
The impacts of climate change are not felt homogeneously, but rather are unevenly distributed across locations and population groups, with potential consequences for inequality. In particular, the worst effects of climate change are expected to be felt in low-income countries, and within countries, the most vulnerable to these effects are typically low-income regions and households (Castells-Quintana et al., Reference Castells-Quintana, Lopez-Uribe and McDermott2018). Recent evidence suggests that climate change is increasing inequality between countries (Mendelsohn et al., Reference Mendelsohn, Dinar and Williams2006; Diffenbaugh and Burke, Reference Diffenbaugh and Burke2019). There is also recent empirical evidence suggesting that climate change has an impact on the spatial concentration of economic activity (Cattaneo and Peri, Reference Cattaneo and Peri2016; Castells-Quintana et al., Reference Castells-Quintana, Krause and McDermott2021), with important consequences on how income and wealth are generated and captured across space. However, to date, there continues to be limited evidence at the international level of the within-country distributional impacts of climate change.
This paper is the first to our knowledge to test the relationship between gradual warming (i.e., climate change) and long-run distributional dynamics within countries, for a global sample. To do so, we first build a global panel dataset combining gridded data on climate variables with gridded population data, which we match to country-level data on a range of inequality measures and development outcomes observed at 5-year intervals. We use these data to test the effects of warming on the (interpersonal) distribution of income within countries. Our main dataset includes information for more than 140 countries worldwide, over the 1955–2015 period. Using panel-data econometric techniques, we test whether (and how) climatic variation has an impact on changes in the distribution of income within countries. Specifically, we isolate the effect of warming on distributional outcomes by exploiting random variation in weather conditions over time. We find that warming increases overall income inequality, as well as the concentration of income at the top of the income distribution, at the expense of those in the middle and at the bottom. We also show that these effects are not transient but rather tend to persist over time. Our evidence on the warming–inequality relationship is robust to a battery of robustness checks. In additional analysis, we also consider the potential distributional impacts of higher temperatures on a range of outcomes beyond income dynamics, including the concentration of wealth, proxies of inequality in the spatial distribution of economic activity within countries, and measures of inequality in life expectancy. Finally, we complement our country-level analysis with an exploratory analysis of income inequality at the subnational level for the US, as the country with the highest absolute economic losses from weather events.Footnote 1 Overall, our analysis presents a rich picture of the far-reaching distributional effects of global warming.
Our paper relates to several strands in the literature. First, it is related to the literature on the socio-economic impacts of climate change (for recent reviews, see Castells-Quintana (Reference Castells-Quintana2017) and Patel et al. (Reference Patel, Dey, Sing, Singh, Singh, Kumar, Singh, Kumar, Rani and Sharma2021)). Second, it is related to the literature on the determinants of income inequality (for a recent review, see Furceri and Ostry (Reference Furceri and Ostry2019)).Footnote 2 Finally, our paper is related to recent papers exploring the distributional effects of climate change, either looking at individual countries (Mideksa, Reference Mideksa2010; Chisadza et al., Reference Chisadza, Clance, Sheng and Gupta2023) or between countries (Tol et al., Reference Tol, Downing, Kuik and Smith2004; King and Harrington, Reference King and Harrington2018; Diffenbaugh and Burke, Reference Diffenbaugh and Burke2019). A number of recent review articles have also assessed the growing evidence base on climate change, poverty and inequality (see Hallegatte et al., Reference Hallegatte, Fay and Barbier2018; Dang et al., Reference Dang, Hallegatte and Trinh2024; Méjean et al., Reference Méjean, Collins-Sowah, Guivarch, Piontek, Soergel and Taconet2024). While the range of relevant studies is growing rapidly, these reviews still point to a lack of conclusive, quantitative evidence on the impacts of warming on inequality. That is a gap our paper aims to fill.
Most closely related to our study are three recent papers that focus on within-country variation, using relatively short-run (annual) income inequality data as measured by Gini coefficients, and with an emphasis on agriculture as the fundamental channel in the climate–inequality nexus (Paglialunga et al., Reference Paglialunga, Coveri and Zanfei2022; Palagi et al., Reference Palagi, Coronese, Lamperti and Roventini2022; Gilli et al., Reference Gilli, Calcaterra, Emmerling and Granella2024). We contribute to this nascent literature in a number of ways. First, we provide empirical evidence on the role of global warming in the long-run evolution of income inequality within countries, using a large and novel global panel dataset. Second, we look not only at aggregate income inequality measures, like the Gini coefficient, but also at other dimensions of inequality, including concentration of income and wealth, as well as of economic activity across space. Third, we provide evidence on the warming–inequality relationship at different subnational levels. Finally, we provide empirical insights into the distributional impacts of higher temperature beyond income dynamics.
Our focus on measuring inequality over longer time periods is significant for at least two reasons. First, recent papers that test the effect of climate on within-country income inequality have tended to rely on annual measures of inequality that involve imputing values, whereas our data are based on newly assembled and more consistent data on income inequality with observations at 5-year intervals. Second, and perhaps more importantly, the finding of a short-run relationship between climate and inequality (based on annual data) is perhaps unsurprising, given the well-established evidence on differential impacts of climate-related disruptions and extreme weather events across income groups. Our evidence suggests that these inequality-enhancing effects are persistent. In other words, the current and historical adaptation to climate change (including, for example, relocation across space or between economic sectors) has been insufficient to mitigate the disproportionate impact of climate on lower-income groups.
The rest of the paper is organized as follows. Section 2 describes our data and methods. Section 3 presents our results. Finally, Section 4 discusses our findings, their policy implications and avenues for further research. An online appendix provides the supplementary material.
2. Climate and distributional dynamics: data and methods
2.1. Data
For climatic variables, we draw on country-level datasets obtained from the World Bank's Climate Change Knowledge Portal,Footnote 3 as well as gridded weather data from the CRU TS version 4.03 dataset from the University of East Anglia (Harris et al., Reference Harris, Jones, Osborn and Lister2014).Footnote 4 As our focus is on long-run dynamics, and in order to merge with the inequality data that we use, we aggregate for every country in 5-year periods from 1955 to 2015.Footnote 5 We focus on average annual temperatures, capturing variations in the climate from one 5-year period to the next, and long-run changes, capturing variation (in warming) over a 50-year period. We also control for total annual rainfall as another key climatic variable discussed in the related literature. As our focus is on socio-economic consequences, it is natural to look at the spatial distribution of the population. Changes in climatic conditions will have a stronger socio-economic impact where more people live. We thus match our gridded weather data with gridded population data (both on a 0.5° grid) from the Global Population of the World v4 dataset.Footnote 6 This allows us to construct population-weighted versions of our climatic variables. The online appendix provides more information on the construction of our climatic variables.
For distributional dynamics, we start with interpersonal income inequality, relying on the World Income Inequality Databases (WIID) compiled by the United Nations University World Institute for Development Economics Research.Footnote 7 The WIID databases (version 31 May 2021) include information for up to 208 countries or territories between 1950 and 2019, including estimates for the percentile share of each country's total net income. This allows us to look at different income inequality measures, including Gini coefficients, but also the concentration of income in different population groups, like the Top 10%, middle 50% and bottom 40%. Furthermore, previous papers that look at annual data have mostly used the SWIID database (Solt, Reference Solt2020), which heavily relies on interpolations and requires multiple imputation analysis. Recent papers (i.e., Palagi et al., Reference Palagi, Coronese, Lamperti and Roventini2022) use the World Inequality Database (WID), with smaller coverage than WIID. We rely on WIID databases, using data in 5-year periods, to (1) have a wide and long coverage, (2) capture long-run dynamics and (3) significantly reduce the issue of interpolations and multiple imputation (see Gradín (Reference Gradín2020, Reference Gradín2021) for more on the properties of the WIID databases).
In addition to income inequality at the national level, we also use data on income inequality at the subnational level for the US (both at state and county levels) from IPUMS NHGIS v17 (Manson et al., Reference Manson, Schroeder, Van Riper, Kugler and Ruggles2022) based on US Census/American Community Survey data. Descriptive statistics for these subnational inequality data, and corresponding temperature data, are included in the online appendix.
We complement our income inequality data with measures of concentration of wealth from the WID and measures of spatial concentration of economic activity, built from satellite data on night-time lights (see online appendix for more on the construction of these measures). We also consider inequality in life expectancy as an alternative outcome and as a proxy for human capital effects, relying on data from the United Nations Development Program. We look at these dimensions of inequality as relevant in the process of development, and as potentially important pathways linking warming with inequality that have been highlighted in recent reviews on this subject (see, e.g., Dang et al., Reference Dang, Hallegatte and Trinh2024; Méjean et al., Reference Méjean, Collins-Sowah, Guivarch, Piontek, Soergel and Taconet2024). Life expectancy is a key development outcome, while spatial concentration has recently been highlighted by the literature as a key component of inequalities. For both these dimensions, we are able to collect data (and construct measures) that have a global coverage and are comparable across countries and over time. An additional advantage of the night-lights data is that it offers a means of assessing inequality at the subnational level, but with global coverage, as a complement to our analysis using US states and counties.
Additional data used in our analysis include a range of other development outcomes, including measures of socio-political (in)stability and conflict, as well as measures of human health. For socio-political (in)stability and conflict, we rely on data from the International Country Risk Guide (ICRG) from the PRS Group. The ICRG evaluates several dimensions of political, economic and financial risks for some 150 countries over several decades.
Finally, as part of a suite of robustness tests on our main findings, we further control for potential determinants of inequality, including GDP per capita, total population, fertility rates, export rates and urbanization rates, among others. These additional variables are based on data from the World Bank Development Indicators and the Penn World Tables. Appendix Table A1 provides definitions and sources for the different variables included in our data, while Appendix Table A2 provides descriptive statistics for our main variables of interest at the national level, and Appendix Table A3 includes summary statistics for subnational data.
2.2. Econometric analysis
To study the association between climatic conditions and the evolution of inequality, we begin by looking at long-run changes in our key variables for our global sample. To do so, we follow a simple Long Difference specification, namely, regressing the 50-year change in inequality on a 50-year change in climatic conditions, as in Equation (1):
 \begin{equation}\Delta \text{Inequality}_i = {\textrm{ }}{\alpha _1} + {\textrm{ }}{\beta _1}\Delta \text{Climate}_i + {\epsilon}_i,\end{equation}
where 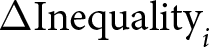 $\Delta \text{Inequality}_i$ is the 50-year change in the Gini coefficient, and $\Delta \text{Climate}_i{\text{ }}$is the 50-year change in average temperatures for country i.
We then turn to our main analysis using our full global panel data in 5-year periods, exploiting the random variation in weather conditions over time, to test the effects of temperature on inequality. We consider a panel-data model as specified in Equation (2):
 \begin{equation}\text{Inequality}_{it} = {\textrm{}}{\alpha _1} + {\textrm{}}{\beta _1}\text{Climate}_{it{\textrm{}}} + {\gamma _t} + {\textrm{}}{\theta _i} + {\textrm{}}{_{it}},\end{equation}
where Inequalityit is one of the different dimensions that we consider for income inequality within countries. Climateit is our climatic variable, capturing the country's average temperature over the preceding 5 years. Our panel specification also allows us to include period fixed effects,  ${\gamma _t}$, which control for common global shocks in the evolution of inequality, and country fixed effects, ${\theta _i}$, which control for country-specific time-invariant characteristics of countries. Standard errors are clustered by country. In addition, as part of our robustness checks, in some specifications, we add region- or country-specific trends, or alternatively, a range of time-varying socio-economic variables as controls.
As we include country-specific fixed effects, our panel-data specification exploits the within-country evolution over time, controlling for time-specific fixed effects. Our identification of  ${\beta _1}$ rests on the assumption that intertemporal variation in our climate measure is exogenous with respect to the evolution of within-country inequality, conditional on country and period fixed effects (i.e., local exogeneity of the climatic variables). As clearly stated by the climate literature, variation in climatic conditions for each country depends on the impact of a myriad of global phenomena, including changes in oceanic and wind changes, atmospheric pressure and more, making it exogenous to the evolution of country-level inequality.Footnote 8
Finally, we perform a battery of robustness checks. These include placebo tests, restricting the data to recent time periods (i.e., post-1980 and post-1990), and the inclusion of region- or country-specific trends. We also test the robustness of our results to alternative specifications and estimation techniques.
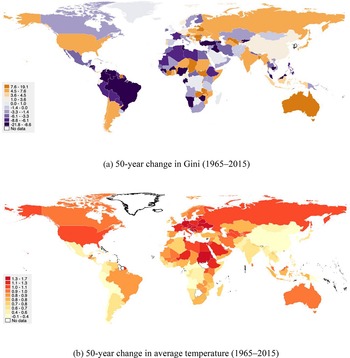
Long-run increase in temperatures and inequality.
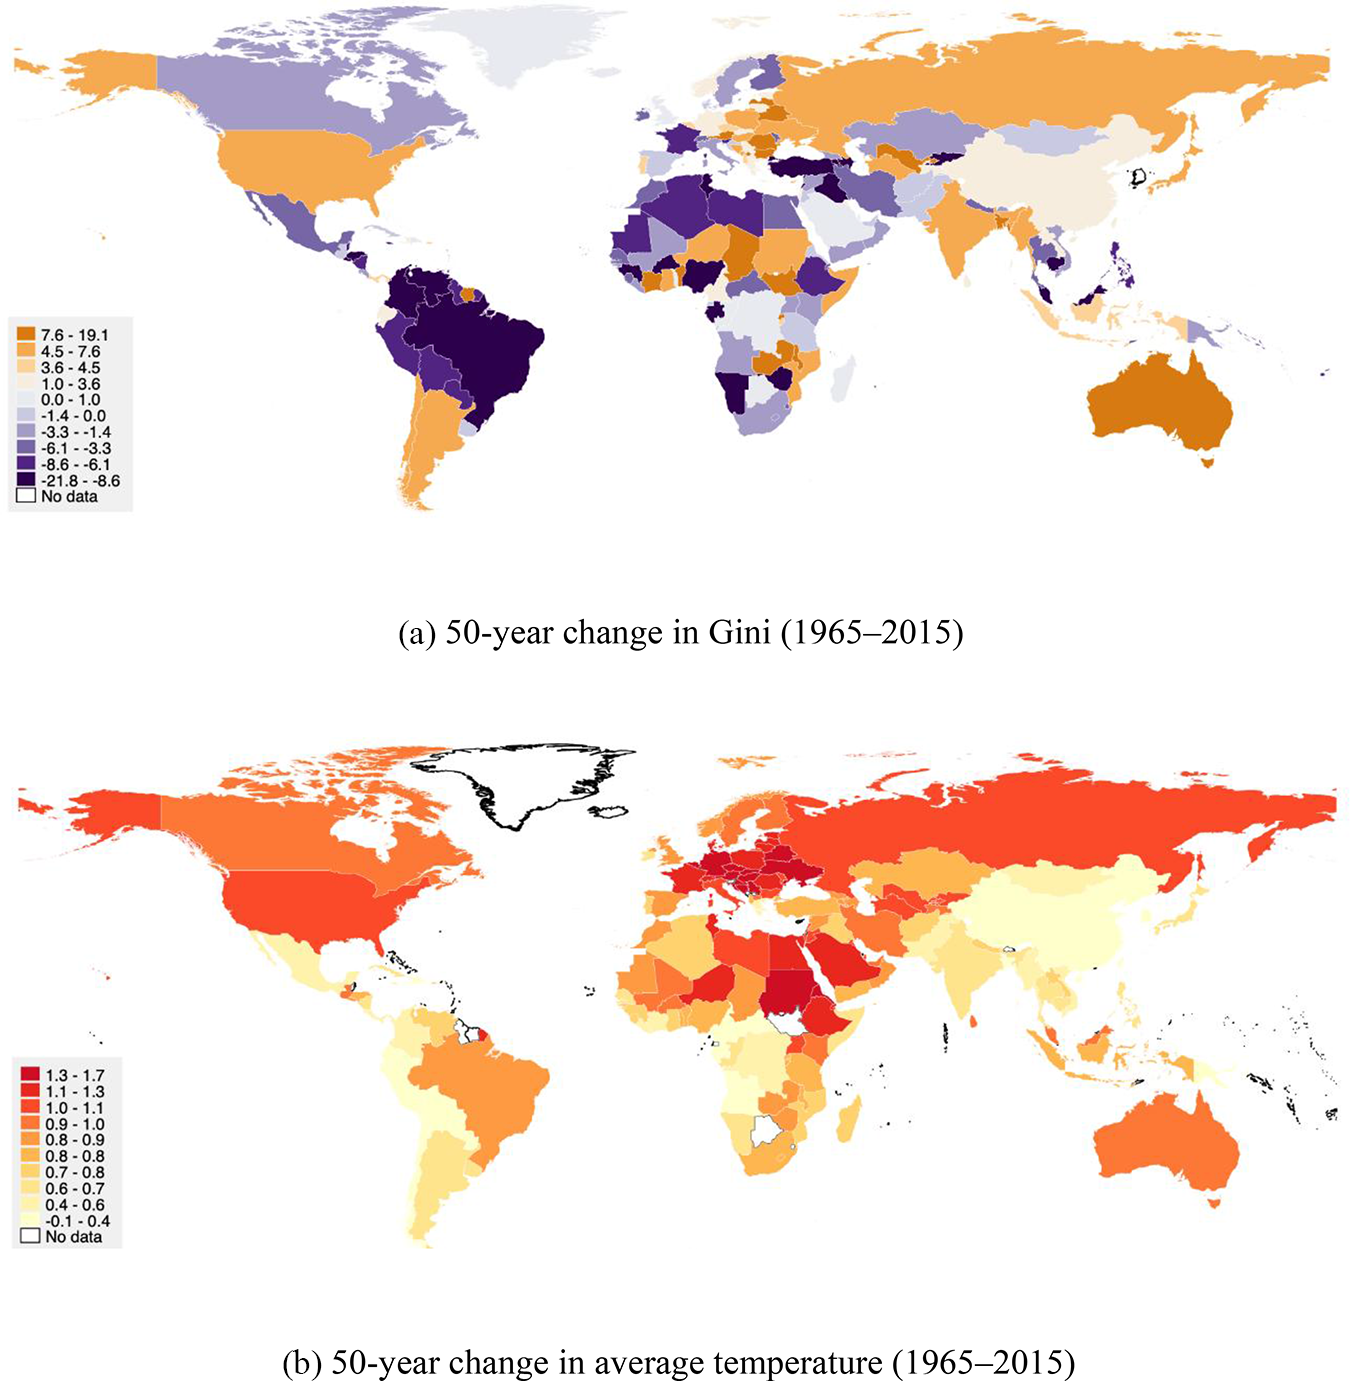
Figure 1 Long description
The image consists of two maps. The first map, labeled A, illustrates the 50-year change in the Gini index from 1965 to 2015, with different countries shaded in varying colors to represent changes in income inequality. The second map, labeled B, depicts the 50-year change in average temperature over the same period, with countries shaded to indicate temperature variations. Both maps use color gradients to convey the magnitude of changes, with legends indicating specific ranges for Gini index and temperature changes.
3. Temperature and inequality: results
Using our global dataset, we explore the impact of climate change on the evolution of inequality within countries. Our dataset includes information for more than 140 countries worldwide, over the last 50 years (1955–2015)Footnote 9 – see also online appendix A. Figure 1 shows maps of the 50-year change in income inequality in panel (a) and the 50-year change in temperatures in panel (b), both weighted by population. While within-country inequality has increased globally in the last 50 years, the increase has not been uniform, with some countries experiencing declines in inequality over the period, while others have experienced sharp increases. Similarly, some countries have been experiencing faster warming than others.Footnote 10
3.1. Warming and increasing inequality: main results
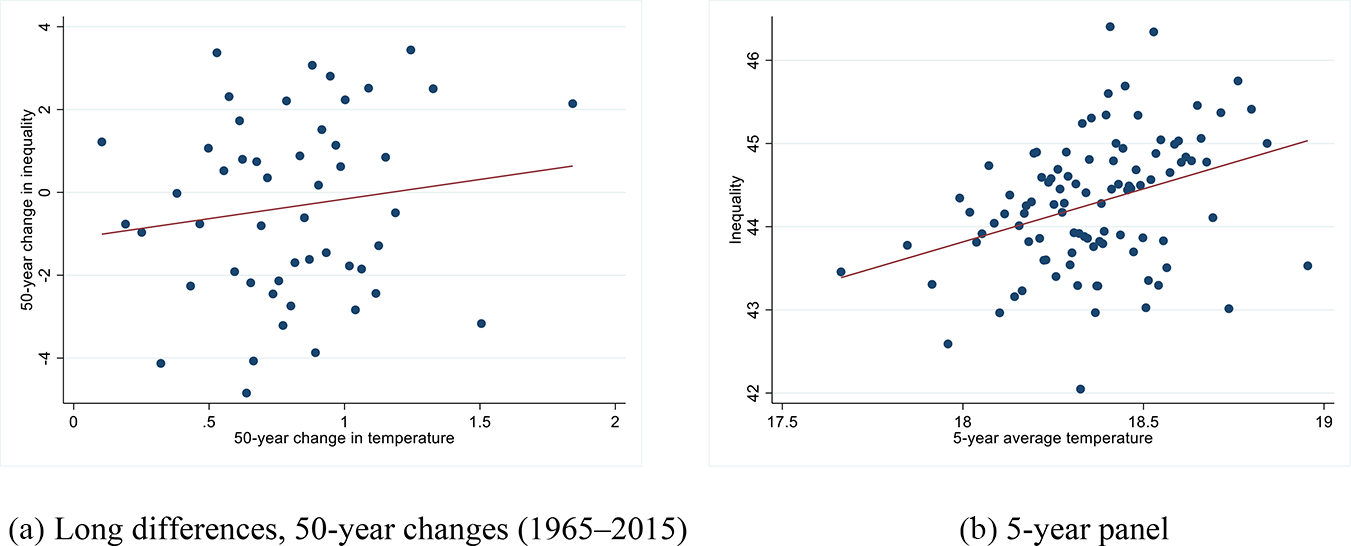
Figure 2 shows the association between average temperatures and income inequality (as measured by the Gini coefficient). We consider both a long-run and a medium-term association. For the long-run association, we look at changes in temperatures over 50 years (1965–2015) and changes in inequality over the same period for our global sample. We compute these long-run changes using the average temperature in the most recent 5-year period, compared to those same averages 50 years previously. By doing so, we reduce potential noise introduced by particularly hot and cold years. For inequality, being highly persistent, we just compute the difference between inequality levels in 2015 and those in 1965. Figure 2a shows the association for these long differences, controlling for regional fixed effects. For a more medium-term association, we look at 5-year periods using our full panel data. Figure 2b presents this association, controlling for country and time fixed effects. In this way, Figure 2b captures the connection between temperatures and inequality, considering only the within-country evolution over time (which is what we are after). Both figures suggest a clear association between higher temperatures and increases in income inequality within countries over medium to longer time scales.
Mean temperatures and income inequality.
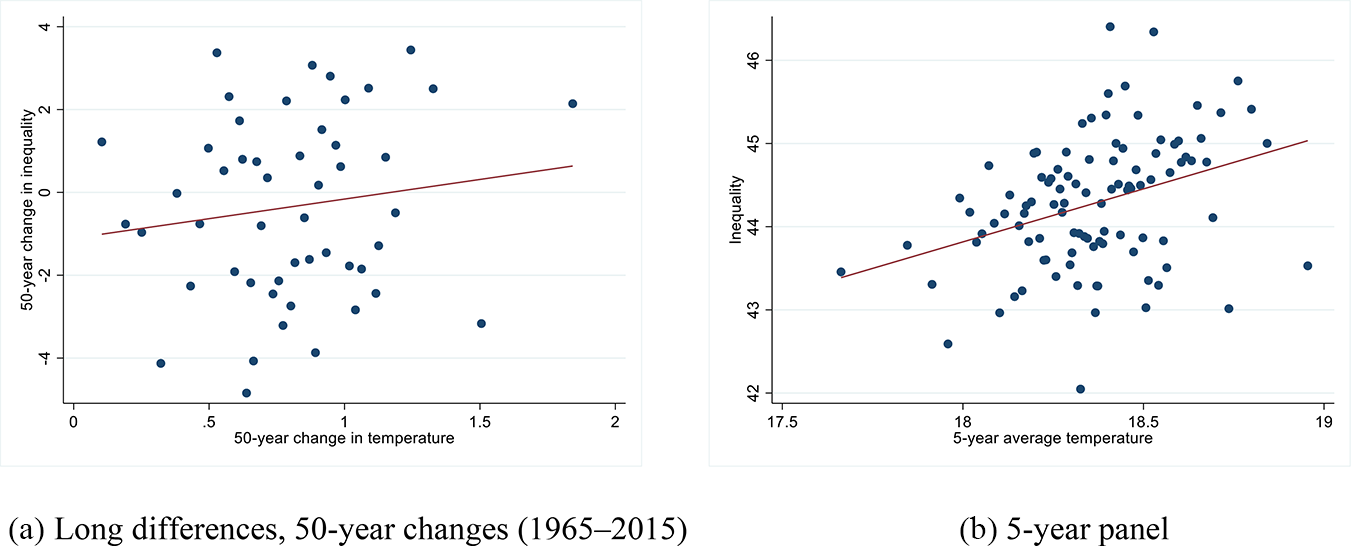
Figure 2 Long description
The image A shows a scatter plot with the x-axis labeled '50-year change in temperature' and the y-axis labeled '50-year change in inequality'. Data points are scattered across the plot, with a trend line indicating a positive correlation. The image B shows another scatter plot with the x-axis labeled '5-year average temperature' and the y-axis labeled 'inequality'. This plot also displays scattered data points with a trend line suggesting a positive correlation. Both plots illustrate the association between temperature changes and inequality over different time scales.
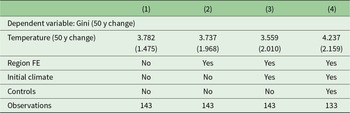
Table 1 presents results from regression models as in Equation (1), showing a positive and statistically significant coefficient for the 50-year change in temperatures, suggesting that countries that have experienced more warming are, on average, also those where inequality has increased the most. An obvious concern here might be that differences in warming over the past 50 years are not randomly assigned across countries (as appears to be the case in Figure 1; see also Appendix Table A4). Column (2) shows that the coefficient for the 50-year change in temperatures remains significant after the inclusion of region fixed effects (i.e., the results are not driven by a particular world region). The coefficient is also robust to controlling for changes in average rainfall and initial climatic conditions (column (3)), as well as controlling for economic growth over the 50-year period and several country-specific socio-economic characteristics (column (4)). Results in Table 1 suggest that a 1°C increase in average temperatures over a 50-year period has translated into a 3.5–4.3 point increase in the Gini coefficient over the same period, a non-negligible increase. A similar pattern of results is reported in Appendix Table A5, where the outcome Top10 is the 50-year change in concentration of income amongst the Top 10% of earners. While this evidence is suggestive of a long-run impact of higher temperatures on income inequality, the limited sample size and apparently non-random variation in long-run warming patterns warrant caution in interpreting these findings. We next turn to our 5-year panel data, where we exploit the random variation in weather conditions over time.
Warming and inequality, long-difference specification
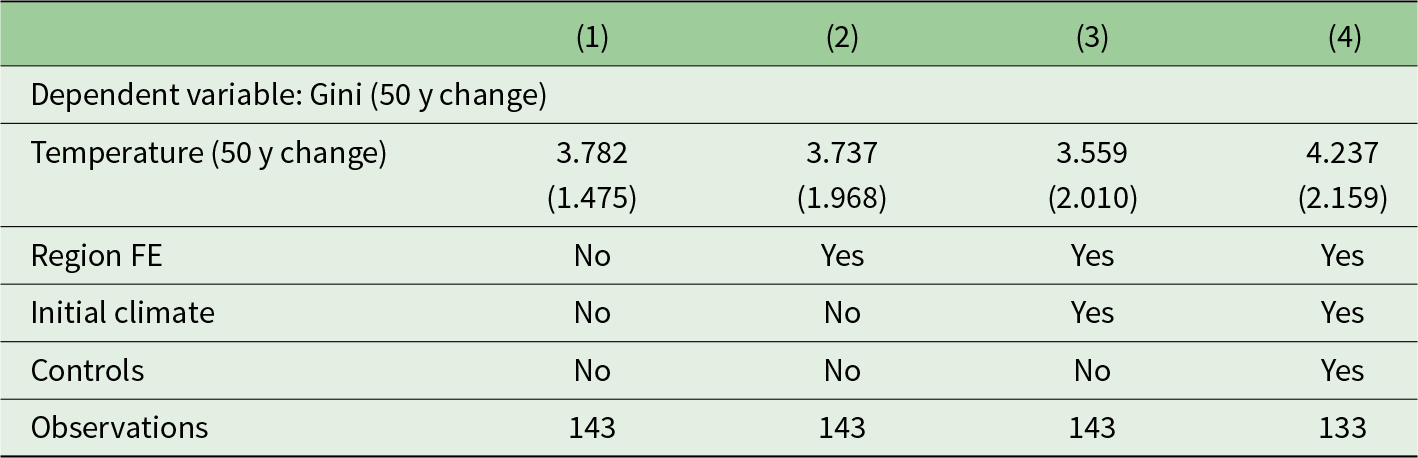
Table 1 Long description
The table examines the impact of a 50-year change in temperature on the Gini coefficient, a measure of inequality, across four model specifications. The effect of temperature change on inequality is positive in all models, with coefficients ranging from 3.559 to 4.237. The models vary by inclusion of regional fixed effects, initial climate conditions, and additional controls such as GDP per capita growth and export share. The number of observations is consistent at 143 for the first three models, but drops to 133 in the fourth model, which includes the most comprehensive set of controls. The standard errors, clustered by country, suggest varying levels of statistical significance across the models.
Notes: This table reports results of long-difference specifications as in Equation (1) in Data and Methods (Section 2). Variables are calculated as the change over a 50-year period (1965–2015). Initial climate includes average temperature and rainfall at the beginning of our sample (1960–1964). Controls include changes in average rainfall and GDP per capita growth over the 50-year period, as well as GDP per capita, export share and agricultural value added (to GDP) in levels (each lagged by one period). Robust standard errors (clustered by country) in parentheses.
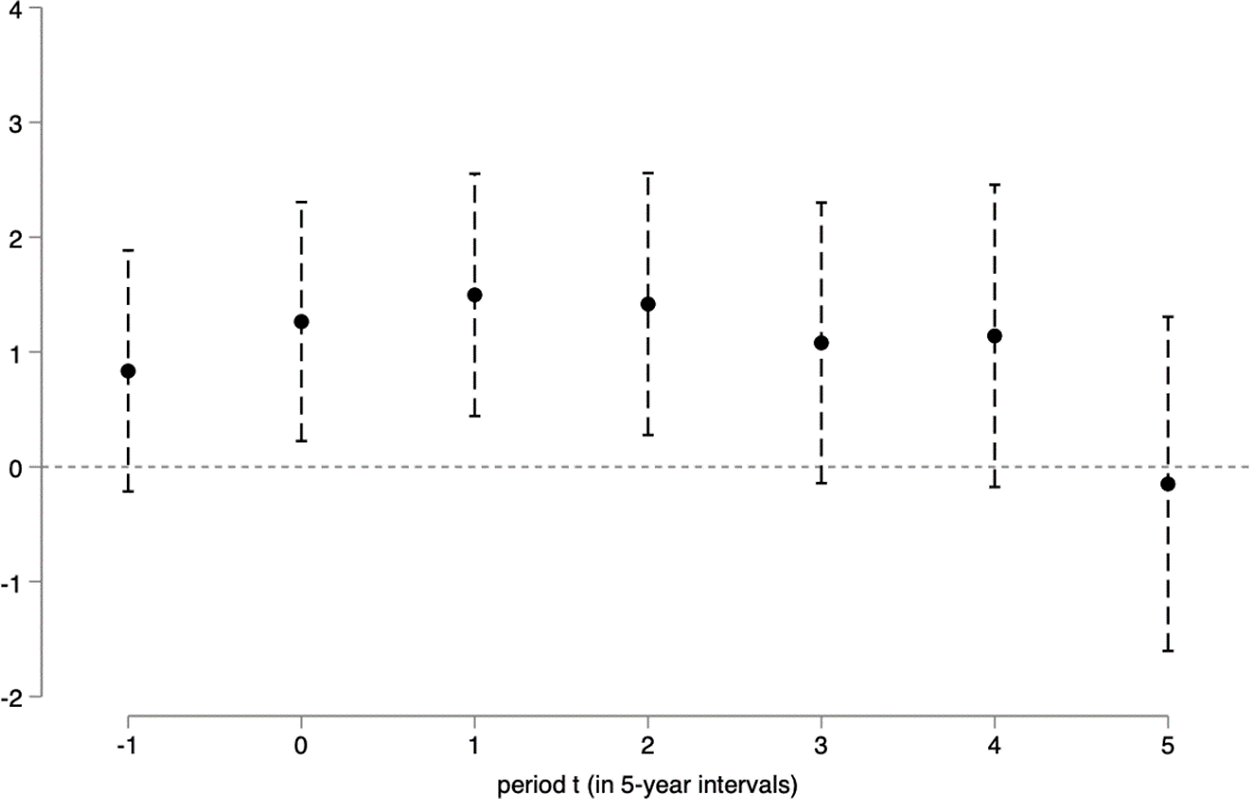
Figure 3 shows results for our 5-year panel, as in Equation (2), displayed as a simple event-style analysis, where we estimate the impact of rising temperature on inequality (see also Appendix Table A6). We do this for the first lead of our climate variables (a temporal placebo), as well as for the contemporaneous effect and up to five lags (the figure only reports the estimated coefficients on temperature, but the regressions also control for rainfall during the same period in each case). As expected, temperatures at time t have no effect on the Gini at time t – 1. However, for subsequent periods, results show a significant effect of rising temperatures in increasing inequality within countries. In particular, a 1°C increase in average temperatures over a 5-year period leads to a contemporaneous 1.3-point rise in the Gini coefficient.Footnote 11 Interestingly, the event study suggests that the effects of temperature on inequality are compounded over time, peaking at t + 1, or up to 10 years after the temperature shock (probably suggesting persistent structural effects). A linear combination of lagged coefficients on temperature shows an estimated cumulative effect of 5.44 (p-value 0.014). This is notably quite similar in magnitude to the estimate from our long-differences specification reported in Table 1, reinforcing our argument of a long-run impact of (gradually) increasing temperatures. These effect sizes are much larger than those reported in recent papers studying short-run annual impacts of temperature on inequality (e.g., Paglialunga et al., Reference Paglialunga, Coveri and Zanfei2022).
Event-style analysis for temperature and Gini.
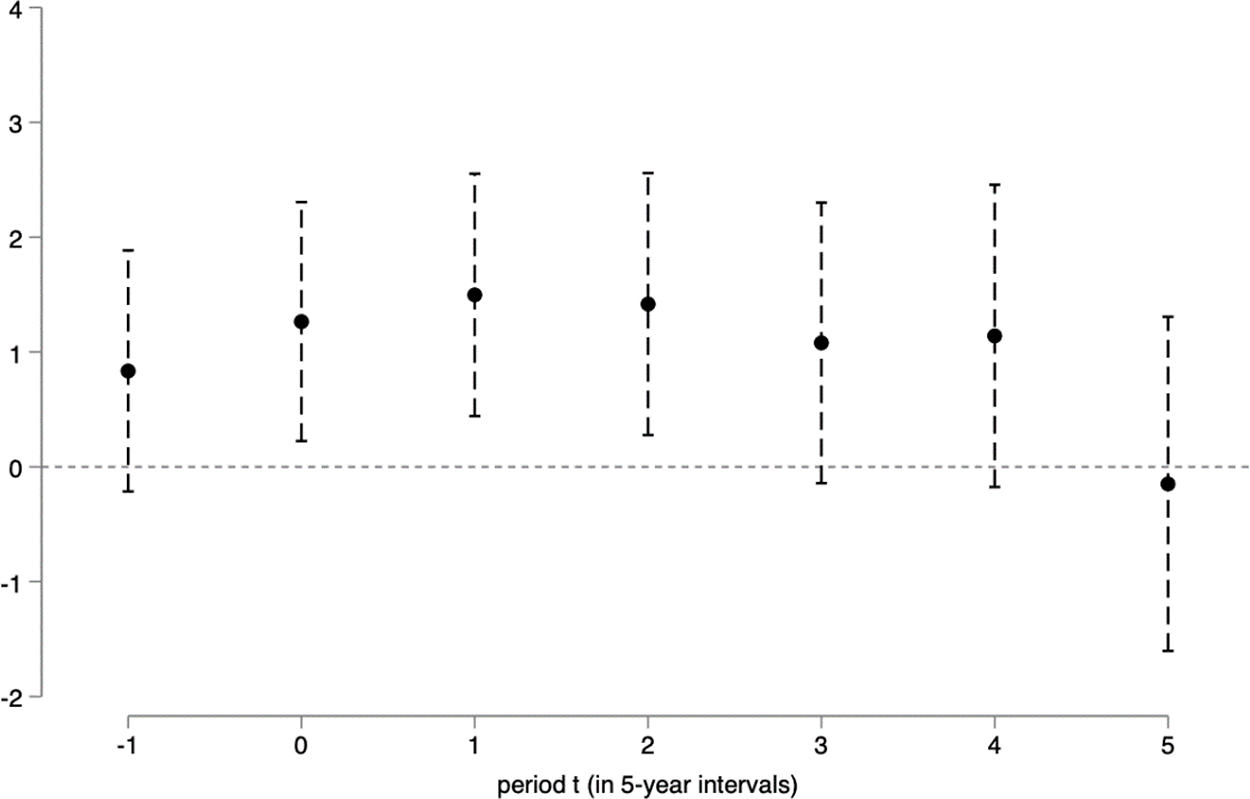
Figure 3 Long description
A dot plot with the x-axis labeled 'period t (in 5-year intervals)' ranging from negative 1 to 5. The y-axis ranges from negative 2 to 4. Each interval on the x-axis has a dot with vertical lines indicating variability or error bars. The dots are positioned around the zero line, with some above and some below, indicating variations across the periods.
3.2. Robustness checks
Our findings on the inequality-increasing role of higher temperatures are robust to a battery of robustness checks (see online appendix). In Appendix Table A7, we check the robustness of our results to alternative time periods and panel specifications. First, we perform a falsification (see column (1)). For falsification, we consider a simple temporal placebo test. If the temperature–inequality link was driven by internal trends, we would still find a positive coefficient if we assigned the change in temperatures in the following period to the increase in inequality in the preceding period. However, as expected, we find no significant coefficient for temperatures. This result reinforces the idea that it is the changing climatic conditions of each country, in particular higher temperatures, which is significantly associated with increases in inequality in that country. Second, we restrict our sample to data either post-1980 or, alternatively, post-1990. This reduces our sample size but restricts our data to more recent and more reliable inequality data. In both cases, we still find significant coefficients for temperatures (see columns (2) and (3) of Appendix Table A7). In terms of alternative specifications, we include region- or country-specific time trends (see columns (4) and (5)) and consider a dynamic model by including the lag of inequality as a regressor (see column (6)). The coefficient for lagged inequality is positive and significant, reflecting the high degree of persistence of inequality over time. In this line, we also implement dynamic panel data GMM methods (columns (7) and (8)). In all cases, our main results of an inequality-increasing role of rising temperatures remain statistically significant.Footnote 12
In Appendix Table A8, panel A, we test our results to the inclusion of several time-variant country characteristics potentially relevant to explaining the evolution in inequality. These include income per capita and its square, total population size, fertility rates, urban rates, trade, industry share, access to electricity and unemployment rates. The coefficient for average temperature remains significant across all specifications, including several controls.Footnote 13 One notable result here is in column (5) of Appendix Table A8, where we add the urban rate as an additional control. The estimated coefficient on temperature here drops in magnitude by almost a third (from 1.44 in column (5) to 1.01 in column (6)), albeit remaining positive and statistically significant (at the 5 per cent level). This finding suggests that urbanization could be a potential mechanism linking warming and inequality (as shown in Castells-Quintana et al. (Reference Castells-Quintana, Krause and McDermott2021)). We further investigate this here by estimating the relationship between temperatures and spatial inequality (proxied by inequality in lights) as discussed further below. In panel B of Appendix Table A8, we also check that our results are robust to model uncertainty. For this, we re-estimate the effects of temperature on inequality using Bayesian Model Averaging and Weighted-Average Least Squares methods (following De Luca and Magnus (Reference De Luca and Magnus2025)). The estimated coefficient for temperature remains positive and significant, with a posterior inclusion probability of 1. This reinforces our argument that temperatures are a key driver of inequality dynamics.
In Appendix Table A9, we consider a first-difference specification. When working with highly persistent dependent variables, such as inequality, the use of first differences rather than fixed effects has been suggested (see Wooldridge, Reference Wooldridge2010). Our main results for temperature remain significant.
In Appendix Table A10, following Papke and Wooldridge (Reference Papke and Wooldridge2008), we also implement alternative estimations using methods for bounded outcome variables (like Gini). In particular, we use quasi-likelihood estimators based on probit or logit, and maximum likelihood estimators based on the beta distribution. Our main results hold with a positive and significant coefficient for temperature across all these estimators.
In Appendix Table A11, we allow for more flexible specifications, allowing the coefficient for temperature to vary based on potentially relevant country characteristics. First, we allow the coefficient to vary by income per capita levels, and second, by the initial share of agriculture in total employment. We find no evidence of significant heterogeneity of effects across these two dimensions, at least in the cross-section. We also allow for the effect of temperature on inequality to vary as incomes rise, or as agricultural share shifts over time for a given country, finding that the positive temperature–inequality association is weaker as income per capita rises over time. This is expected, as richer countries have higher resilience and adaptation capacity. However, unlike the findings in recent papers that focus on short-run associations between climate and inequality (see, for instance, Palagi et al., Reference Palagi, Coronese, Lamperti and Roventini2022), the longer-term relationship between higher temperatures and inequality that we document appears to be independent of agricultural share.
In panel B of Appendix Table A11, we estimate our main model separately for low-, middle- and high-income groups of countries (as defined by the World Bank). While the results of this exercise are not conclusive – by splitting the sample we lose some precision in our estimates – they do appear to show that our main findings are coming primarily from effects of temperature in low- and middle-income countries, and not high-income countries.Footnote 14
Finally, in Appendix Table A12 (and Figure A2), we replicate Appendix Table A6, adding quadratic terms for our climate variables. Regression coefficients for quadratic terms are very small (mostly, likely capturing some higher dispersion in the temperature–inequality relationship at higher temperatures). Although the results suggest some marginal nonlinearities, with the predicted Gini coefficient peaking at around 20°C, confidence intervals at higher temperatures are quite large and we cannot reject the possibility that inequality continues to increase with temperature at higher levels of temperature.
3.3. Spatial concentration and inequality in subnational regions
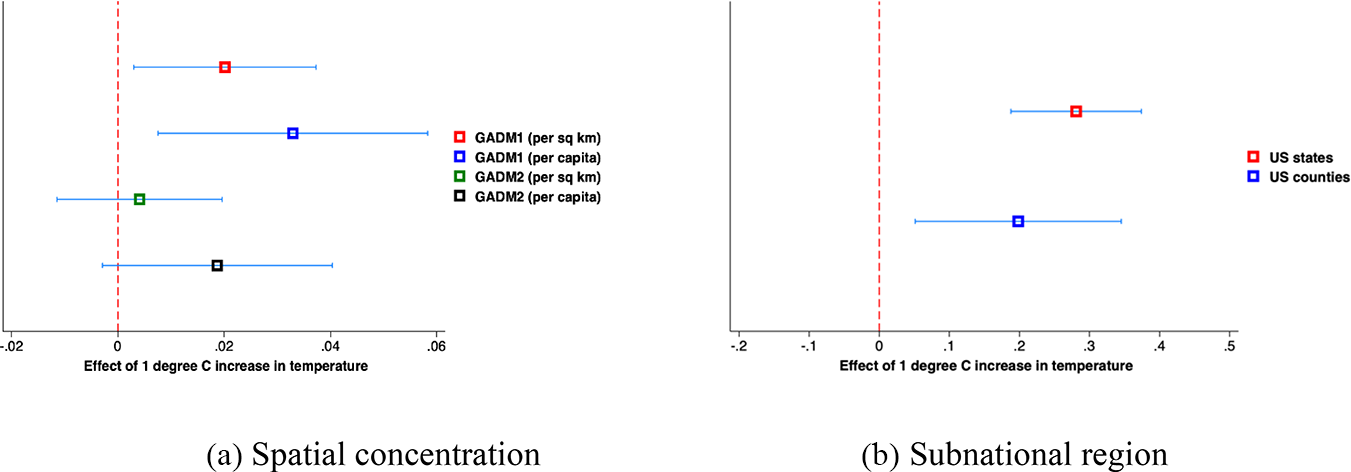
Having established that warming increases income inequality within countries, in Figure 4, we now present the results of two complementary sets of analysis at a finer spatial scale. First, in Figure 4a, we show results from analysis using night-time lights to build measures of spatial concentration of economic activity within countries (see also Appendix Tables A13 and A14). While spatial concentration of economic activity is not bad per se, excessive concentration can be (see, for instance, Barca et al., Reference Barca, McCann and Rodriguez-Pose2012; Castells-Quintana, Reference Castells-Quintana2017). Our results suggest that higher temperatures are associated with an increase in the spatial concentration of economic activity (as measured by night-lights). The estimates are larger when using larger subnational units (global administrative level 1) and per capita rather than per km2 measures of night-lights, suggesting that warming may increase income inequality (economic activity per person) across regions, as well as within them. Second, in Figure 4b, we explore income inequality in subnational regions for the US, looking at state-level as well as county-level Gini coefficients. Results suggest a positive association between temperatures and inequality even at a subnational level, with larger estimates for state rather than county level inequality (in line with our results with night-lights).Footnote 15
Spatial concentration and inequality in subnational regions.
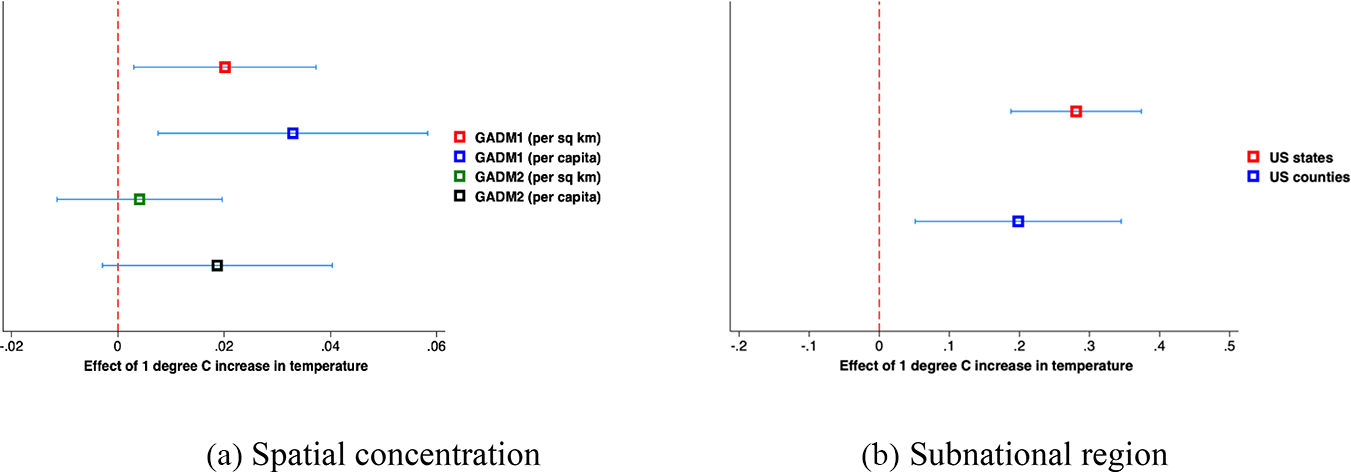
Figure 4 Long description
The image contains two graphs. Graph A, labeled 'Spatial concentration', shows the effect of a 1 degree Celsius increase in temperature on spatial concentration using four measures: GLASM per km squared, GLASM per capita, GLASM per km squared and GLASM per capita. Each measure is represented by a different colored square. The x-axis is labeled 'Effect of 1 degree Celsius increase in temperature', with values ranging from negative 20 to positive 40. Graph B, labeled 'Subnational region', shows the effect of temperature increase on US states and US counties. The x-axis is labeled 'Effect of 1 degree Celsius increase in temperature', with values ranging from negative 2 to positive 4. US states are represented by a red square and US counties by a blue circle. Both graphs include horizontal lines indicating confidence intervals for each measure.
3.4. Warming and concentration of income and wealth
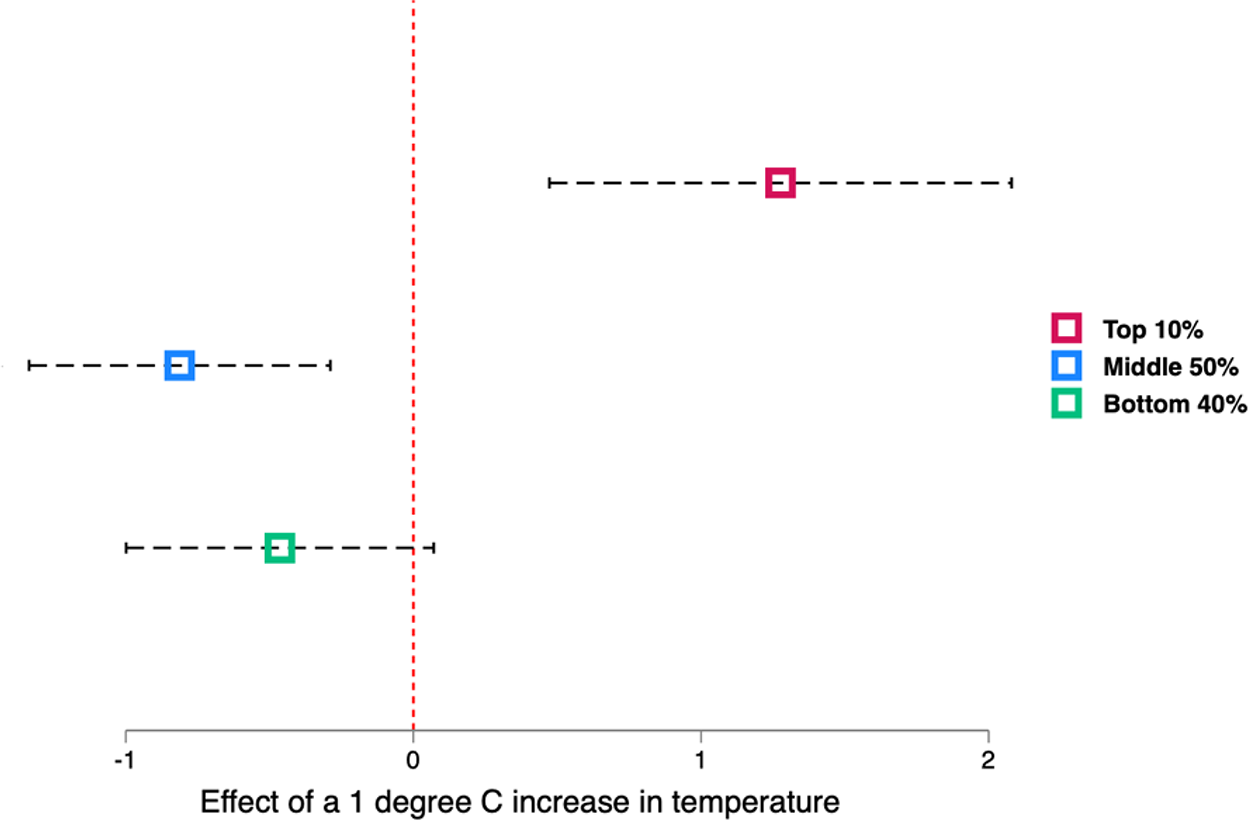
If rising temperatures have the potential to increase income inequality, do they also change the pattern of inequality? Or, similarly, do rising temperatures affect different parts of the income distribution differently? And, if so, do they increase the concentration of income and wealth? To answer these questions, we explore how rising temperatures affect different parts of the distribution of income: the concentration of income at the Top 10% (Top10), the concentration at the Middle 50% (Middle50) and the concentration at the Bottom 40% (Bottom40). Results for these alternative measures and dimensions of inequality are presented in Figure 5 (see also Appendix Table A15). We find that higher temperatures lead to more concentration of income at the top of the income distribution (in red), and less concentration at the middle and bottom of that distribution (in blue and green, respectively). This pattern of results for concentration at the top and at the bottom remains significant after controlling for country-specific trends (see Appendix Table A16). Together, these results would suggest that the inequality-increasing role of rising temperatures is associated with increasing (relative) concentration of income at the top (i.e., the rich) at the expense of the middle and bottom parts of the distribution (i.e., the middle class and the poor).
Warming and concentration of income.
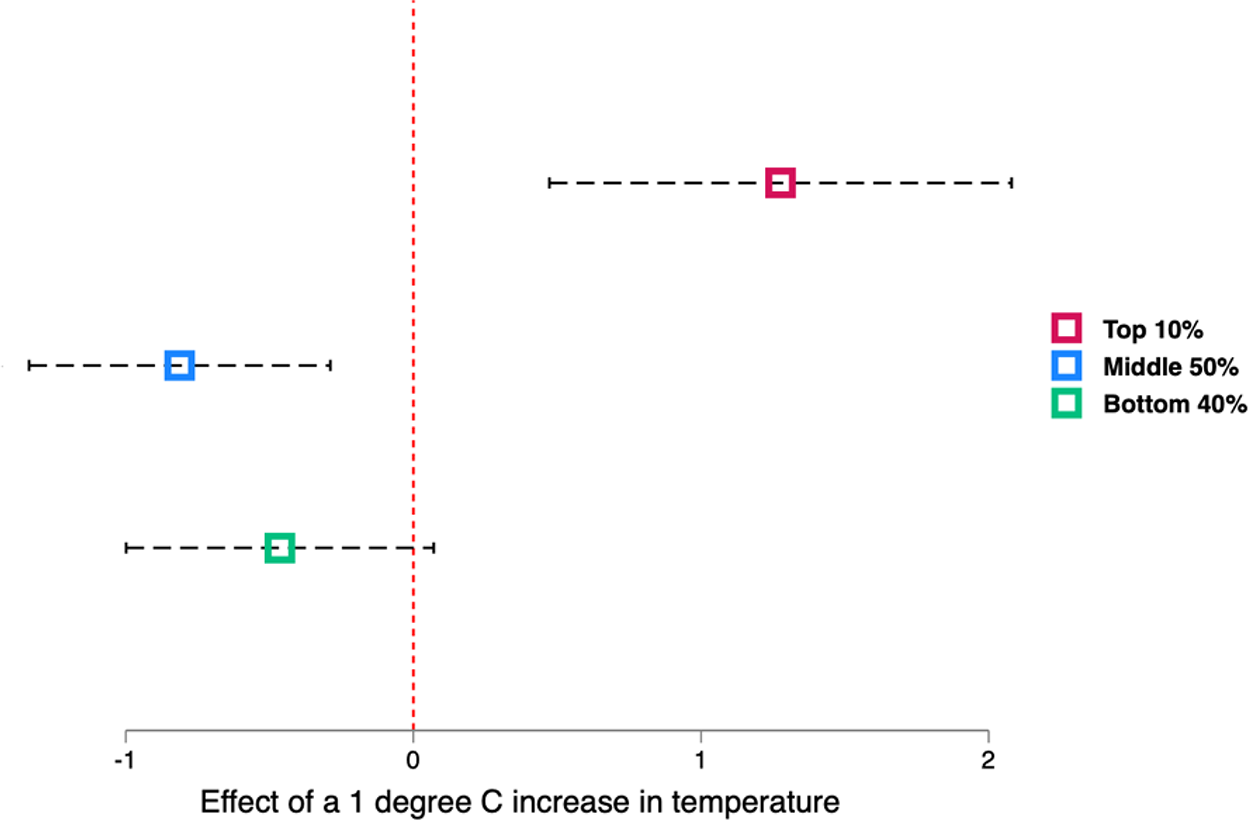
Figure 5 Long description
The graph illustrates the effect of a 1 degree Celsius increase in temperature on income distribution across three segments: Top 10 percent, Middle 50 percent and Bottom 40 percent. The x-axis is labeled 'Effect of a 1 degree C increase in temperature' with a range from negative 1 to 2. The y-axis is not labeled. Three horizontal dashed lines represent each income segment. The Top 10 percent is marked with a square, the Middle 50 percent with a square and the Bottom 40 percent with a square. The Top 10 percent line extends further to the right, indicating a positive effect, while the Middle 50 percent and Bottom 40 percent lines show less positive effects. A vertical dashed line at zero serves as a reference point.
If there is a long-run impact of higher temperatures on the concentration of income, we could expect that this will eventually be reflected in effects on the concentration of wealth. To assess this, we draw on data from the WID, which provides data on the concentration of wealth at the country level every 10 years from 2000 to 2020. We find a positive and significant role of temperatures in the evolution of wealth concentration, robust to several time-variant controls, including income inequality (see Appendix Table A17). The results suggest a delayed effect of higher temperatures on the concentration of wealth. This income- and wealth-concentrating impact of rising temperatures is in line with, and reinforces, previous findings suggesting that, globally, while the poor are getting poorer, the rich are getting richer under climate change (see Park et al., Reference Park, Bangalore, Hallegate and Sandhoefner2018; Diffenbaugh and Burke, Reference Diffenbaugh and Burke2019).
3.5. Warming and inequalities in life expectancy
Finally, we consider the possibility of rising temperatures affecting distributional dynamics beyond income and wealth. If comparable international data on income inequality is scarce, data availability for other dimensions of inequality is even more limited. However, the United Nations Development Program provides data on several development outcomes, including inequality in life expectancy in 5-year intervals from 2010 to 2020. Life expectancy is not only a key dimension of development but also a long-run one that depends on income as well as other non-economic factors. Focusing on (inequality in) life expectancy allows us to explore the role of rising temperatures on inequality dynamics beyond income. Deteriorating climatic conditions have been associated with socio-political instability and conflict (see, for instance, Burke et al., Reference Burke, Hsiang and Miguel2015), as well as worse health conditions and higher mortality (see, for instance, Hondula et al., Reference Hondula, Balling, Vanos and Georgescu2015; Ebi et al., Reference Ebi, Capon, Berry, Broderick, de Dear, Havenith, Honda, Kovats, Ma, Malik, Morris, Nybo, Seneviratne, Vanos and Jay2022). These potential wider impacts of rising temperatures are likely to disproportionally affect the most vulnerable and thus likely to have unequal consequences (see insights in Cramer (Reference Cramer2003)). Consequently, as temperatures rise, we could expect to see not only more instability and conflict, worse health conditions and higher mortality, but also higher inequality in life expectancy.
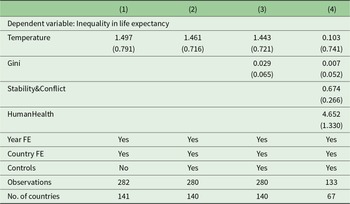
We start by showing (in Appendix Tables A18 and A19) the association between temperature and government stability, corruption and internal conflict, as well as with undernourishment, infant mortality, maternal mortality and the incidence of widespread diseases like tuberculosis and malaria (further details on data sources and variables used are included in Data and Methods [Section 2]). We then turn to exploring the relationship between temperature and inequality in life expectancy. Column (1) of Table 2 shows a significant connection between temperatures and inequality in life expectancy, controlling for time- and country-fixed effects, while column (2) shows that this result also holds when controlling for several time-variant factors (including income, population, fertility and urbanization). As shown in column (3), this result is not driven by income dynamics; controlling for income inequality (as measured by the Gini coefficient) hardly affects the magnitude and significance of the coefficient for temperatures. By contrast, as shown in column (4), introducing composite proxies for (in)stability and conflict and for health conditions and mortality yields highly significant coefficients and makes our coefficient for temperatures nonsignificant. In other words, the connection between rising temperatures and inequality in life expectancy seems related to higher instability and conflict and worse health conditions and not merely a consequence of income inequality dynamics.Footnote 16
Warming and inequality in life expectancy
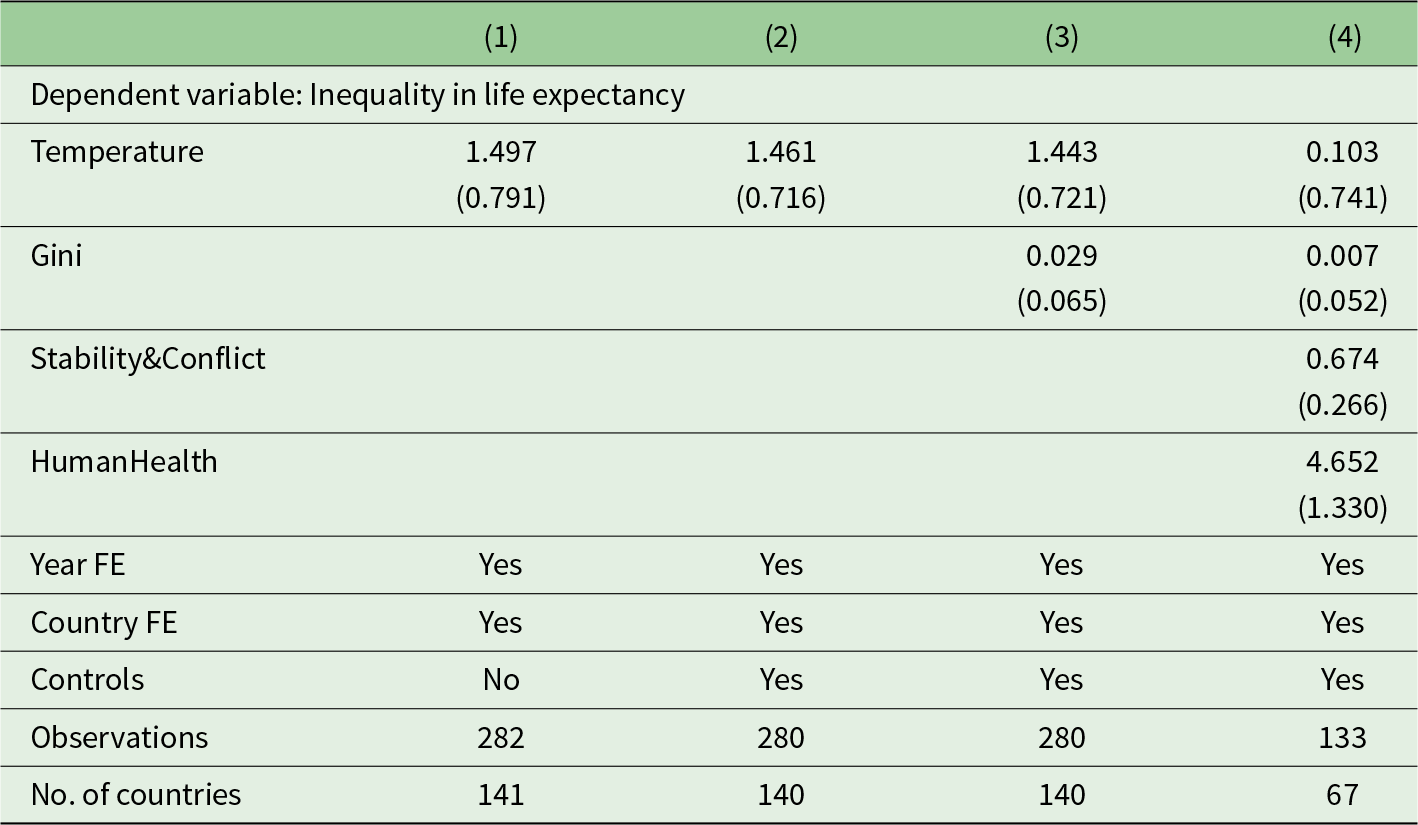
Table 2 Long description
The table examines the relationship between temperature, income inequality, government stability, human health, and inequality in life expectancy across four models. Temperature consistently shows a positive effect on life expectancy inequality, with the highest coefficient in models without additional controls. Income inequality, measured by the Gini coefficient, is only included in the last two models, showing a small positive effect. Government stability and human health factors are only considered in the final model, both showing significant positive impacts on life expectancy inequality. All models account for year and country fixed effects, with varying numbers of observations and countries analyzed. The results suggest that temperature and human health factors are significant contributors to life expectancy inequality, while income inequality and government stability have smaller effects.
Notes: This table reports results of specifications based on Equation (2) and as described in Data and Methods (Section 2). Gini is income inequality (lagged). Temperature is average temperature in degrees Celsius over the preceding 5-year period. Stability&Conflict is the principal component of government stability, corruption and internal conflict. HumanHealth is the principal component of undernourishment, infant mortality, maternal mortality, tuberculosis and malaria. All specifications control for rainfall. Controls include GDPpc and its square, total population, fertility and urbanization rate. Robust standard errors (clustered by country) in parentheses.
4. Discussion and conclusion
A warming climate implies a change in the distribution of local weather conditions that are relevant for socio-economic outcomes (as per Hsiang (Reference Hsiang2016)). In particular, global warming is expected to bring increases in the frequency and intensity of extreme events, including heat waves, floods, storms and droughts (see IPCC, Reference Masson-Delmotte, Zhai, Pirani, Connors, Péan and Berger2021). All this might be particularly relevant for inequality, given that those at the bottom of the income distribution are the least able to cope with and adapt to changing weather conditions brought by a warming climate. In this paper, we explicitly test the relationship between gradual warming (i.e., climate change) and long-run distributional dynamics within countries, for a global sample. We find that warming increases overall income inequality, as well as the concentration of income at the top of the distribution, at the expense of those in the middle and at the bottom. Our findings suggest a non-negligible impact of rising temperatures on the evolution of income inequality: we estimate that a 1°C increase in average temperatures increases a country’s Gini coefficient by 1.3 points. We also show that these effects persist over time. Taken together, this evidence represents a set of novel and robust findings on the effects of warming on long-run income inequality.
Beyond income inequality, we have shown that rising temperatures may also lead to a higher concentration of wealth and of economic activity across space, as well as increased inequality in life expectancy. In relation to the latter, we find suggestive evidence that the connection between temperatures and inequality in life expectancy is likely to operate not only via economic dynamics but also via other socio-political and health outcomes associated with warming. These wider distributional impacts of climate change, beyond income dynamics, are something, to the best of our knowledge, novel in the literature and clearly worthy of further research.
Our aim in this paper has been to document the relationship between gradual warming and inequality, drawing on data for a global sample of countries over a 50-year period. Our analysis presents a rich picture of the far-reaching distributional effects of global warming. While we have explored heterogeneity of our results across income levels and groups, agricultural shares and levels of urbanization, future work could evaluate in more depth the generalization of our findings, for instance, across different contexts, levels of development and institutional settings. In this regard, further research is clearly warranted, likely drawing on microdata, to understand how local context could potentially moderate the effects of warming on inequality.
There are various ways to potentially explain our findings on the effects of warming on inequality. To begin with, climate change is expected to have greater impacts in rural areas, and rural areas are, on average, poorer than urban areas. Second, in both rural and urban areas, extreme weather events disproportionally affect the more vulnerable: they tend to live in riskier locations, are the first to be displaced by climatic shocks and have fewer coping mechanisms to deal with climatic shocks (i.e., savings, access to financial services, etc.). Moreover, public response (adaptation) is usually addressed to protect valuable assets owned by the rich. It has also been shown that higher temperatures reduce both agricultural as well as non-agricultural productivity (Deryugina and Hsiang, Reference Deryugina and Hsiang2014; Zhang et al., Reference Zhang, Deschenes, Meng and Zhang2018; Ortiz-Bobea et al., Reference Ortiz-Bobea, Ault, Carrillo, Chambers and Lobell2021). These productivity effects are likely to have a greater impact on the poor, as their incomes tend to be more reliant on climate-dependent activities. Finally, higher temperatures can also affect access to basic services – like clean water and sanitation, as well as access to affordable food – all of which may have important knock-on effects for health outcomes. While these various mechanisms that potentially link warming and inequality are discussed elsewhere in the literature (Islam and Winkel, Reference Islam and Winkel2017; Castells-Quintana et al., Reference Castells-Quintana, Lopez-Uribe and McDermott2018; Dasgupta et al., Reference Dasgupta, van Maanen, Gosling, Piontek, Otto and Schleussner2021), exploring them in detail remains an important area for future research.
Understanding the socio-economic and political consequences of climate change, including the impact on distributional dynamics, is of first-order importance not only for informing climate change mitigation and adaptation strategies but also for the design of development policies. Global average temperatures are expected to rise (even in the best-case scenario), along with an increase in the frequency and intensity of extreme weather events. All these climatic changes will have significant socio-economic impacts, including effects on distributional dynamics, which call for urgent policy action. On the one hand, our findings reinforce the need for climate policies that explicitly acknowledge the far-reaching distributional effects of global warming and thus design specific adaptation and mitigation strategies that support the most vulnerable. On the other hand, we show that mitigation policies have the additional social benefits of reducing the inequality effects of warming. Our results not only provide relevant insights in this regard but also point towards the need for further research to guide policy design.
Supplementary material
The supplementary material for this article can be found at https://doi.org/10.1017/S1355770X26100606.
Data availability statement
The data and code that support the findings of this study come from different sources, as described in ‘Data and Methods’. The final dataset and replication do-file are available from the authors upon reasonable request.
Acknowledgements
We thank two anonymous referees and the editor for helpful comments and suggestions. We also thank Vicente Royuela, Carlos Gradin and Melanie Krause for helpful discussions and for generously sharing data. We acknowledge comments received at the Department of Applied Economics of the Universidad Autónoma de Barcelona, the Department of Statistics at Universidad Carlos III de Madrid, the Bari Conference on Economics of Global Interactions, the Faculty of Business and Economics at Technische Universität Dresden, the Department of Applied Economics at the Universidad de Valencia, the OCDE in Paris, the 4th Workshop on Regional and Urban Economics at Bogotá, the 2023 Congress on the European Regional Science Association in Alicante, the Workshop on Migrations, Climate Change and Development at the Universidad de Zaragoza, the Development Economics Workshop at the University of Barcelona and the 2023 International Economics Association World Congress in Medellin. David Castells-Quintana is a Serra Húnter Fellow and gratefully acknowledges the Generalitat de Catalunya, as well as the support from the Spanish Ministry of Science and Innovation, grant no.’s PID2020-118800GB-100 and PID2022-136482OB-I00.
Competing interests
The authors declare no competing interests.
Author contributions
D.C. and T.Mc.D. contributed equally to the conception and design, analysis and interpretation of the data; the drafting of the paper; revising it critically for intellectual content; and the final approval of the version to be published.



 Open access

