


Highlights
-
• Heritage speakers (HSs) of Spanish rated their peers in terms of accentedness.
-
• HSs were perceived as more native-like than L2s but less so than homeland speakers.
-
• Speakers judged as more native were perceived to live in a Spanish-speaking country.
-
• Prosody contributes more to heritage accent than segments do.
1. Introduction
Heritage speakers (henceforth HSs) are bilinguals who are raised in homes where a language other than the majority language of their society is spoken (Polinsky, Reference Polinsky2018; Valdés, Reference Valdés2005). In the U.S., any language spoken in domestic settings other than English (e.g., Spanish, Korean, Mandarin) would be understood as a heritage language. As adults, HSs are often unbalanced bilinguals, primarily due to a lack of input in their heritage language in terms of both quality and quantity (e.g., Flores et al., Reference Flores, Santos, Jesus and Marques2017; Place & Hoff, Reference Place and Hoff2016). As a result of reduced input, qualitative differences between heritage and homeland varieties and/or influence from the majority language, certain linguistic features in the heritage language may deviate from those observed in homeland varieties. While divergence of HSs from homeland speakers has received much attention over the past decade, the bulk of research has focused on the morphosyntactic domain, likely due to greater prominence of morphosyntactic variation in comparison to phonological divergence. HS phonology is generally considered native-like, but there is some anecdotal evidence suggesting that HSs sound “‘funny,’ ‘off,’ and not like ‘real’ speakers of the language” (Polinsky & Kagan, Reference Polinsky and Kagan2007, p. 378). This notion finds support from several studies wherein HS speech is perceived as “(foreign) accented” by monolingual listeners (Au et al., Reference Au, Oh, Knightly, Jun and Romo2008; Einfeldt et al., Reference Einfeldt, Van De Weijer and Kupisch2019; Kan, Reference Kan2020; Kupisch et al., Reference Kupisch, Barton, Hailer, Klaschik, Stangen, Lein and van de Weijer2014, Reference Kupisch, Lloyd-Smith, Stangen and Bayram2020; Lloyd-Smith et al., Reference Lloyd-Smith, Einfeldt and Kupisch2020; Monarrez, Reference Monarrez2023; Yeni-Komshian et al., Reference Yeni-Komshian, Flege and Liu2000). Perception of the so-called heritage accent possibly stems from segmental divergence (Amengual, Reference Amengual2018; Barlow et al., Reference Barlow, Branson and Nip2013; Łyskawa et al., Reference Łyskawa, Maddeaux, Melara and Nagy2016; Mayr & Siddika, Reference Mayr and Siddika2018; Repiso-Puigdelliura & Kim, Reference Repiso-Puigdelliura and Kim2021), as well as from suprasegmental divergence from the homeland varieties (Chang & Yao, Reference Chang and Yao2016; Kan, Reference Kan2020; Kim, Reference Kim and Willis2015, Reference Kim2020). However, the relative contribution of segments and prosody to perceived heritage accent remains poorly understood. Hence, this study employs resynthesized speech to tease apart the effects of segmental information and suprasegmental information on perceived heritage accent.
Research on HSs’ perception of heritage language phonemes (Cheon & Lee, Reference Cheon and Lee2013; Kim, Reference Kim2011; Lee-Ellis, Reference Lee-Ellis2012; Oh et al., Reference Oh, Jun, Knightly and Au2003; Tees & Werker, Reference Tees and Werker1984) and prosody (Kim, Reference Kim and Willis2015, Reference Kim2020) demonstrates that HSs exhibit perceptual abilities comparable to those of non-heritage native speakers (NHNSs). However, there is limited understanding of how HSs perceive speech at the holistic level. Moreover, employing HSs as raters to evaluate heritage speech provides a more valid and ecologically sound approach to investigating the heritage accent. To our knowledge, all previous studies on heritage accent perception have recruited NHNSs as raters. Yet prior research has found that unfamiliar native varieties may be perceived as less native-like (Schoonmaker-Gates, Reference Schoonmaker-Gates, Carvalho and Beaudrie2013). This suggests that, while homeland speakers may rate heritage speech as less native-like, the presence of a distinct accent should not necessarily be equated with a non-native accent. To address these points, this study includes HSs as listeners to rate heritage speech.
The present study aims to address two primary objectives: (1) assessing the relative contribution of segments and prosody to heritage accent and (2) examining how HSs perceive speech at the global level. Specifically, we recruit both Mexican NHNSs and Mexican HSs to evaluate resynthesized heritage speech.
2. Background
2.1. Accent in heritage speakers’ speech
Over the last decade, there has been a growing body of literature on heritage language sound systems, including several studies examining how HSs’ global accent is perceived by non-heritage native listeners (Kupisch et al., Reference Kupisch, Barton, Hailer, Klaschik, Stangen, Lein and van de Weijer2014, Reference Kupisch, Lloyd-Smith, Stangen and Bayram2020; Lloyd-Smith et al., Reference Lloyd-Smith, Einfeldt and Kupisch2020; Monarrez, Reference Monarrez2023; Stangen et al., Reference Stangen, Kupisch, Ergün, Zielke and Peukert2015). Most studies agree that HS speech is less accented than that of second language learners (L2s), but more accented than that of NHNSs (Au et al., Reference Au, Oh, Knightly, Jun and Romo2008; Kupisch et al., Reference Kupisch, Barton, Hailer, Klaschik, Stangen, Lein and van de Weijer2014; Lloyd-Smith et al., Reference Lloyd-Smith, Einfeldt and Kupisch2020; Monarrez, Reference Monarrez2023; Oh et al., Reference Oh, Jun, Knightly and Au2003; Stangen et al., Reference Stangen, Kupisch, Ergün, Zielke and Peukert2015; Yeni-Komshian et al., Reference Yeni-Komshian, Flege and Liu2000).
Yeni-Komshian et al. (Reference Yeni-Komshian, Flege and Liu2000) investigated bilinguals of Korean and English with varying ages of arrival (AOA) in the U.S. (from 1 to 23 years). The participants produced sentences in a delayed sentence repetition task with the text provided. Monolingual Korean raters, who had recently arrived in the U.S., gave ratings on a scale of 1 to 9 (= no accent). It was found that early bilinguals (AOA 1–7 years) sounded strongly accented in Korean compared to bilinguals who arrived in the U.S. after 12 years of age. Similarly, in Au et al. (Reference Au, Oh, Knightly, Jun and Romo2008), HSs, NHNSs, and L2s produced Spanish stop phonemes embedded in a carrier phrase and natural speech was elicited using a picture book. Their nativeness was rated by non-heritage native listeners using a 5-point scale. HSs outperformed L2s but still diverged from the monolingual speakers. Monarrez (Reference Monarrez2023) also examined the accentedness of Spanish HSs to determine whether language proficiency has an effect. Two groups of HSs were recruited: one group at the elementary level and another at the advanced level. Proficiency level was determined based on course enrollment at the time of participation. Elementary-level HSs were recruited from elementary Spanish courses, and advanced-level HSs were drawn from advanced Spanish or upper-division courses. While both groups were perceived as more accented than the homeland speakers, they did not differ significantly from each other, leading the author to conclude that proficiency did not influence perceived accent.
Some studies have implemented the foreign accent rating procedure by De Leeuw et al. (Reference De Leeuw, Schmid and Mennen2010) that takes into consideration the confidence level of the raters. Raters first decide whether the speaker is native or foreign and then indicate their level of certainty as certain, semi-certain, or uncertain. Due to the nature of HSs having phonological skills greater than those of L2s but not quite reaching native-like levels, monolingual judges are generally uncertain and hesitant about making decisions on HS speech (Kupisch et al., Reference Kupisch, Barton, Hailer, Klaschik, Stangen, Lein and van de Weijer2014, Reference Kupisch, Lloyd-Smith, Stangen and Bayram2020; Lloyd-Smith et al., Reference Lloyd-Smith, Einfeldt and Kupisch2020; Stangen et al., Reference Stangen, Kupisch, Ergün, Zielke and Peukert2015). For instance, in Lloyd-Smith et al. (Reference Lloyd-Smith, Einfeldt and Kupisch2020), Italian HSs were rated as non-accented only about half of the time (50.8%). This percentage lies between those of the monolingual speaker group (97.2%) and the L2 speaker group (1.3%). The level of certainty was reported to be significantly lower for the HSs than for the monolinguals or the L2s. In Kupisch et al. (Reference Kupisch, Barton, Hailer, Klaschik, Stangen, Lein and van de Weijer2014), Italian-German, French-German, German-Italian and German-French heritage bilinguals were classified as “foreign” as opposed to “native” in their heritage language more than 60% of the time. This percentage is much higher compared to monolingual speakers, who were rated as having an accent only 10% of the time. Additionally, raters reported being “uncertain” or “semi-certain” of their classification of HSs nearly 40% of the time, showing a significantly higher degree of uncertainty compared to other speakers.
Several researchers went a step further to investigate specific cues that led raters to consider HSs as foreign-accented. For instance, Lein et al. (Reference Lein, Kupisch and Van De Weijer2016) found that, while HSs’ voice onset time (VOT) significantly differed from that of NHNSs, there was no correlation between VOT and perceived foreign accents in the heritage language. Similarly, Einfeldt et al. (Reference Einfeldt, Van De Weijer and Kupisch2019) examined the singleton-geminate contrast in Italian among HSs in Germany and found that, although HSs sounded accented when speaking Italian, they maintained a monolingual-like contrast. Meanwhile, Kan (Reference Kan2020) and Shin (Reference Shin2005) examined the relationship between prosody and perceived accentedness. Kan (Reference Kan2020) found that child HSs of Cantonese perceived as having stronger accents tend to have reduced tonal space, slower speech rate and more frequent pauses. Shin (Reference Shin2005) investigated whether HSs’ prosody is perceived as accented by non-heritage native Koreans. She used low-pass filtering to manipulate speech samples produced by Korean HSs, isolating only suprasegmental features. Based solely on these prosodic features, the native Korean listeners considered the HS speech less accented than the L2 speech. Also, when the listeners were asked to determine whether the stimuli came from a “Korean” or a “foreigner,” the HSs were identified as “Korean” more often than the L2s were. However, the participant pool in this study was very small, with just two HSs, of which one was considered “Korean” only 58% of the time. This study suggests that HSs demonstrate more native-like prosody compared to L2s, even though their performance still diverges from that of homeland speakers. Moreover, it shows that NHNSs can perceive this divergence of HSs solely based on prosodic information.
In line with the previously mentioned research, findings in Stangen et al. (Reference Stangen, Kupisch, Ergün, Zielke and Peukert2015) and Wrembel et al. (Reference Wrembel, Marecka, Szewczyk and Otwinowska2019) suggest that prosody plays a more crucial role than segments in perceived nativeness. In Stangen et al. (Reference Stangen, Kupisch, Ergün, Zielke and Peukert2015), early bilingual speakers of Turkish and German produced speech samples in both languages, and two listener groups (i.e., monolingual speakers of Turkish and monolingual speakers of German) rated the foreign accent of the samples in their native language. For each speech sample, they were asked to specify the features on which their judgments were based. Results showed that prosodic features were most frequently identified as the prominent factor in their judgments (28% for German and 26.8% for Turkish). Wrembel et al. (Reference Wrembel, Marecka, Szewczyk and Otwinowska2019) examined the accentedness and phonetic divergence of Polish-English bilingual children’s speech. They assessed the relationship between accent ratings and the number of atypical speech patterns related to vowels, consonants and prosody. The result indicated that prosody, represented by incorrect numbers of syllables and stress patterns, was the only significant predictor of the accent ratings. That is, speech samples with more non-target-like prosodic features were perceived as less native-like.
Taken together, previous research suggests that prosody, more so than segments, contributes to the perception of heritage accent. However, many studies have focused on either segmental or suprasegmental information rather than exploring both, which makes it difficult to conclude that prosody plays a more significant role than segments. Although the studies by Stangen et al. (Reference Stangen, Kupisch, Ergün, Zielke and Peukert2015) and Wrembel et al. (Reference Wrembel, Marecka, Szewczyk and Otwinowska2019) suggest that prosody might have a greater impact on perceived heritage accent than segments, the raters listened to the speech samples that included both segmental and suprasegmental errors. Consequently, it cannot be ascertained whether it was solely prosody or a combination of prosody and segments that led to the perception of a foreign accent. Given that prosody and segments are interrelated in speech, it is essential to employ speech manipulation techniques to effectively assess the relative contributions of segments and prosody to accent judgment.
Lastly, all previous studies on heritage accent perception have recruited NHNSs as raters; little is known about how HSs rate other HSs’ speech. Given that an accent unfamiliar to raters could be perceived as less native-like (see Schoonmaker-Gates, Reference Schoonmaker-Gates, Carvalho and Beaudrie2013), recruiting HS raters is essential to gain a more comprehensive understanding of heritage accent perception. To our knowledge, this study is the first to investigate how HSs perceive heritage accents by including them as raters in the accent rating task.
2.2. Contribution of segmental/suprasegmental information on global accent perception
In contrast to heritage language literature, numerous studies have investigated the global accent perception of L2 speech. In L2 acquisition literature, it is well-attested that native listeners can perceive foreign accents based on limited information, either segmental information (Park, Reference Park2013; van Els & de Bot, Reference van Els and de Bot1987) or suprasegmental information alone (Boula de Mareüil & Vieru-Dimulescu, Reference Boula de Mareüil and Vieru-Dimulescu2006; Conceição Silva & Almeida Barbosa, Reference Conceição Silva and Almeida Barbosa2018; Jilka, Reference Jilka2000; Kolly et al., Reference Kolly, Leemann and Dellwo2014; Munro, Reference Munro1995; Trofimovich & Baker, Reference Trofimovich and Baker2006; van Els & de Bot, Reference van Els and de Bot1987). Furthermore, native listeners can perceive foreign accents regardless of the L2s’ first language (L1) (Kolly et al., Reference Kolly, Leemann and Dellwo2014; van Els & de Bot, Reference van Els and de Bot1987) or their length of residence in the host country (Trofimovich & Baker, Reference Trofimovich and Baker2006).
In a study by Conceição Silva and Almeida Barbosa (Reference Conceição Silva and Almeida Barbosa2018) with Brazilian L2 learners of Spanish and Spanish native speakers, Spanish native listeners were first asked to identify the nationality of the speaker (either Spanish or Brazilian) based on suprasegmental information (i.e., F0, duration, and overall intensity) alone. Then, they heard the original stimuli and gave an accent rating from 0 to 10 (= very strong foreign accent). The nationality identification response was highly correlated with the accent rating. That is, the speakers judged as Spanish for their delexicalized stimuli received more native-like ratings for their original stimuli. While this finding suggests that prosody plays an important role in global accent rating, it does not elucidate the relative importance of prosody and segments in global accent rating.
Some studies have attempted to investigate the relative contributions of segmental and suprasegmental information to global accent perception by employing resynthesized speech samples (Boula de Mareüil & Vieru-Dimulescu, Reference Boula de Mareüil and Vieru-Dimulescu2006; Sereno et al., Reference Sereno, Lammers and Jongman2016; Ulbrich & Mennen, Reference Ulbrich and Mennen2016). Boula de Mareüil and Vieru-Dimulescu (Reference Boula de Mareüil and Vieru-Dimulescu2006) conducted two experiments in which they transplanted the prosody of one speaker onto the segments of another speaker, creating stimuli with Spanish prosody over Spanish segments, Spanish prosody over Italian segments, Italian prosody over Spanish segments and Italian prosody over Italian segments. They concluded that native listeners are at least equally influenced by both segmental and suprasegmental information. Other studies have demonstrated that segments play a larger role in perceived L2 foreign accent than prosody. In Sereno et al. (Reference Sereno, Lammers and Jongman2016), two L1 Korean-L2 English adult learners and two native English speakers read 40 sentences aloud for a perception experiment. For each stimulus, the segments from one speaker were combined with the prosody (i.e., duration and F0 contour) from another speaker. For example, the duration and intonation produced by a Korean speaker were superimposed onto the segments of an English speaker. They found that native segments-L2 intonation combination samples were rated as less foreign-accented than L2 segments-native intonation samples. Moreover, no significant differences were found between the L2 segments-native intonation samples and the L2 segments-L2 intonation samples. Thus, it was concluded that segmental information has a larger effect on foreign accent perception than suprasegmental information. Ulbrich and Mennen (Reference Ulbrich and Mennen2016) used similar methods to examine the relative contribution of segments and prosody to foreign accent perception. Monolingual Belfast English speakers were asked to rate manipulated speech produced by L1 German-L2 Belfast English speakers. The duration and pitch of an L2 speaker were copied onto the segments of an English native speaker, and vice versa. The results indicate that both segments and prosody play significant roles in foreign accent perception, given that the foreign accent rating is significantly higher when the native speaker’s prosody or segments are replaced by those of the L2 speaker. Nevertheless, segments seem to contribute more to perceived foreign accentedness. Native segments crossed with L2 prosody yielded significantly more native-like ratings than native prosody crossed with L2 segments.
Very few studies have implemented an acoustic approach and extracted segmental and suprasegmental properties to examine the correlation between these measurements and accent ratings. Pellegrino (Reference Pellegrino, Mello, Pettorino and Raso2012) found that Chinese L2 speakers of Italian who are perceived as less foreign-accented tended to produce fewer pauses, speak faster and use a wider tonal range. At the segmental level, speakers who sounded more native-like made fewer phoneme production errors. However, statistical analyses were not reported to confirm that these measurements were correlated with accent ratings. Recently, Oganyan et al. (Reference Oganyan, Wright, McCullough and Wayland2021) analyzed L2 speech at the segmental level (i.e., VOT and F1/F2) and at the prosodic level (i.e., duration, intensity, pitch) by speakers of various language backgrounds (i.e., Hindi, Spanish, Korean, and Mandarin). They found that the strongest predictors of accent rating varied across the L1 backgrounds. For Hindi and Spanish speakers, VOT was most strongly correlated with accent ratings, whereas for Korean and Mandarin speakers, it was duration. This suggests that the relative contribution to the perception of a foreign accent may depend on the linguistic background of the speaker.
In sum, global accent perception research using L2 speech demonstrates that segments are as important as prosody, if not more important, in the perception of foreign accents. As implied in Oganyan et al.’s (Reference Oganyan, Wright, McCullough and Wayland2021) study, the relative contribution of segmental and prosodic features is likely to be conditioned by speakers’ language backgrounds. Although both HSs and L2s in the U.S. are typically English-dominant, HSs differ from L2s in their first language experience. Whether the same patterns observed in L2s also apply to HSs has yet to be determined. Therefore, it is worth investigating the interplay between segments and prosody in the context of heritage accents.
3. The present study
In the current study, we invite HSs as well as NHNSs to partake as listeners in an accent rating task. While previous studies have conducted accent rating tasks using HS speech, the listeners were exclusively NHNSs (Au et al., Reference Au, Oh, Knightly, Jun and Romo2008; Kupisch et al., Reference Kupisch, Barton, Hailer, Klaschik, Stangen, Lein and van de Weijer2014; Lloyd-Smith et al., Reference Lloyd-Smith, Einfeldt and Kupisch2020; Monarrez, Reference Monarrez2023; Oh et al., Reference Oh, Jun, Knightly and Au2003; Shin, Reference Shin2005; Stangen et al., Reference Stangen, Kupisch, Ergün, Zielke and Peukert2015). It remains to be explored whether HSs perceive accents in their heritage language in a manner similar to NHNSs. This leads to our first set of research questions: RQ-1a. Do HSs sound native-like? RQ-1b. Is HS raters’ perception of accents different from that of NHNS raters? Based on the existing literature on HS speech, we expect HSs to be perceived as less native-like than homeland speakers but to outperform L2s. It is anticipated that HS raters will distinguish between native and non-native speakers based on their speech, exhibiting a similar overall pattern as NHNS raters. However, compared to NHNS raters, HS raters may perceive HS peers as less accented, likely due to the familiarity effect. This posits that prior experience with a particular accent positively influences how listeners assign ratings (Kornder & Mennen, Reference Kornder and Mennen2021; Winke et al., Reference Winke, Gass and Myford2011; Winke & Gass, Reference Winke and Gass2013; Yuan et al., Reference Yuan, Jiang and Song2010; but see Major, Reference Major2010; Schoonmaker-Gates, Reference Schoonmaker-Gates2012; Xi & Mollaun, Reference Xi and Mollaun2011, who found no significant differences between rater groups or even contradicting results). That is, greater exposure to the heritage accent may increase HS raters’ familiarity with it, resulting in more native-like ratings compared to NHNS raters.
Another significant contribution of this study is the use of manipulated speech to observe the role of segmental and suprasegmental information in heritage accent perception. Previous studies on global accent perception primarily focused on the foreign accent often perceived in L2 speech. A handful of studies have attempted to quantify the effects of certain segmental (e.g., voice onset time, F1, F2) and suprasegmental features (e.g., duration, speech rate, tonal range) on foreign accent (e.g., Munro & Derwing, Reference Munro and Derwing1998; Oganyan et al., Reference Oganyan, Wright, McCullough and Wayland2021), and some have implemented speech manipulation to examine the interplay between the two (Boula de Mareüil & Vieru-Dimulescu, Reference Boula de Mareüil and Vieru-Dimulescu2006; Sereno et al., Reference Sereno, Lammers and Jongman2016; Ulbrich & Mennen, Reference Ulbrich and Mennen2016). Given that previous studies are all based on L2 speech, our study aims to address the second research question: RQ-2. Which of the two aspects of speech, segments or prosody, contributes more to perceived heritage accent? Drawing upon the limited corpus of research exploring the relationship between specific phonological features and accent ratings (Kan, Reference Kan2020; Shin, Reference Shin2005; Stangen et al., Reference Stangen, Kupisch, Ergün, Zielke and Peukert2015; Wrembel et al., Reference Wrembel, Marecka, Szewczyk and Otwinowska2019), we predict that prosody will exert a greater influence than segments on heritage accent perception.
4. Methodology
4.1. Participants
4.1.1. Speakers
The speakers included 18 Spanish speakers who were asked to produce semi-spontaneous speech samples. These speakers were divided into three groups, each consisting of six participants, balanced by gender: heritage speakers of Mexican Spanish (HS speakers), non-heritage native speakers of Mexican Spanish (NHNS speakers) and adult learners of Spanish (L2 speakers).Footnote 1 The NHNS and the L2 speakers were included as comparison groups, representing two extreme values on the accentedness scale.
Six HS speakers were second-generation Mexican Americans (mean age = 20.8 years). They were born and raised in Southern California and were students at the University of California, Los Angeles at the time of recording. All had been exposed to both Spanish and English before the age of six. Six NHNS speakers were born and raised in Mexico (mean age = 24.3 years). They were residing in Querétaro, México, at the time of recording. The remaining six participants were L2 speakers (mean age = 24.8 years). They all began learning Spanish after the age of 12 and self-reported their proficiency in Spanish as intermediate or higher. That is, they were proficient enough to take part in the semi-spontaneous oral production task. Three participants were native speakers of American English, born and raised in the U.S. (New York: 1, California: 1, Ohio: 1). Additionally, three Korean speakers who were born and raised in Korea were included as L2 speakers. However, to facilitate comparison between speaker groups (NHNS/HS/L2), only L1 English speakers from the L2 group will be included in the subsequent analysis.
4.1.2. Raters
Two rater groups were recruited to participate in this study: heritage speakers (HS raters) and non-heritage native speakers of Mexican Spanish (NHNS raters). Seventy-one HS raters (37 female, 31 male, 3 non-binary) and 51 NHNS raters (18 female, 33 male) completed the accent rating task. All NHNS raters and 52 HS raters were recruited via Prolific (https://www.prolific.co), an online research participant recruitment platform. The remaining 19 HS raters were recruited at the University of California, Los Angeles. Data from 16 HS raters were excluded from the analysis due to both parents originating from Spanish-speaking countries other than Mexico. An additional six HS raters who were residing in states outside California were removed from the data set (Illinois: 2, Nevada: 1, Texas: 3). The remaining 49 HS raters were either born in California, U.S., or arrived in California at or before the age of six, and at least one of their parents were from Mexico. All NHNS raters were born and raised in Mexico.
4.2. Materials
Speech samples for the accent rating task were extracted from recordings of a story-narration task. We opted for a narration task rather than a sentence reading task, which is the more common approach in accent rating studies involving L2 speech (Boula de Mareüil & Vieru-Dimulescu, Reference Boula de Mareüil and Vieru-Dimulescu2006; Conceição Silva & Almeida Barbosa, Reference Conceição Silva and Almeida Barbosa2018; Kolly et al., Reference Kolly, Leemann and Dellwo2014; Sereno et al., Reference Sereno, Lammers and Jongman2016; Ulbrich & Mennen, Reference Ulbrich and Mennen2016). This decision was made based on the recognition that HSs tend to exhibit better performance in oral speech that does not require metalinguistic knowledge, and a narrative task would be more representative of their abilities in the heritage language (Colantoni et al., Reference Colantoni, Cuza, Mazzaro, Armstrong, Henriksen and del Mar Vanrell2016). Speakers (i.e., HS, NHNS and L2 speakers) were asked to narrate a story from the wordless picture book “Frog, Where Are You?” (Mayer, Reference Mayer1969). They were given a few minutes to go over the pictures to familiarize themselves with the story before they began the narration. This task took approximately 10 minutes.
Several speech samples were collected in person and others were gathered online. Recordings collected from in-person sessions (i.e., four HS speakers and six NHNS speakers) were recorded using an AKG C520 head-mounted microphone and a Zoom H4n handy portable digital recorder. The other speakers (i.e., two HS speakers and six L2 speakers) were instructed to record themselves in .WAV format using Audacity software (Audacity Team, 2021).
We extracted two 10-second speech samples per speaker, resulting in a total of 36 samples (= 18 speakers × 2 samples). The samples were syntactically complete and contained no lexical stress or morphosyntactic errors. Mid-clause pauses exceeding 0.3 seconds were manually trimmed using Praat software (Boersma & Weenink, Reference Boersma and Weenink2021).Footnote 2 Additionally, the speech rate (= number of syllables/second) was controlled across samples to ensure comparability between speaker groups. The mean and standard deviation values for each group were as follows: NHNS speakers: mean = 4.426, SD = .442; HS speakers: mean = 4.394, SD = .625; L2 speakers: mean = 4.044, SD = .421. A one-way ANOVA (F(2, 33) = 2.11, p = .14) performed using R (R Core Team, 2024) revealed no significant differences. Given that speech rate can influence listeners’ perception of accentedness, and recognizing that language learners typically speak at slower rates than fluent native speakers (Munro & Derwing, Reference Munro and Derwing1998, Reference Munro and Derwing2001), adjustments to the speech rate of the samples from HS and L2 speakers were made by shortening their duration using the Manipulation object in Praat.Footnote 3
After 36 speech samples were selected and manipulated to control for the speech rate, they underwent resynthesis in two distinct ways: one version retained solely segmental information, while another version retained solely suprasegmental information of the speech. Consequently, three distinct conditions for each speech sample were tested (i.e., original, segments-only, prosody-only). For the segments-only version, prior to monotonizing the pitch contour, rhythm manipulation was performed (adapted from the method used by Boula de Mareüil & Vieru-Dimulescu Reference Boula de Mareüil and Vieru-Dimulescu2006; Sereno et al. Reference Sereno, Lammers and Jongman2016; Ulbrich & Mennen Reference Ulbrich and Mennen2016) to mitigate the potential influence of rhythm on raters’ perception of accentedness, as rhythm does not contribute to the segmental information.Footnote 4 Thus, a monolingual speaker-like rhythm was superimposed onto the speech samples to standardize the rhythm. To achieve this, we recruited a homeland speaker residing in Mexico City, who did not participate as a speaker, to read aloud the same sentences featured in our stimuli. As a result, we had duplicate speech samples for all 36 stimuli. Subsequently, we created TextGrid files for a total of 72 speech samples, comprising 36 samples produced by our speakers and 36 samples produced by the homeland speaker. We ran the Montreal Forced Aligner (McAuliffe et al., Reference McAuliffe, Socolof, Mihuc, Michael and Sonderegger2017) to time-align all audio samples with the phone segments in the TextGrid file. These alignments were manually checked by the research team to ensure consistency in the number and order of segments between each pair of test stimuli and the reference sample from the native speaker. Following the alignment check, the onset, offset and duration of all the intervals (i.e., individual phones) in the phone tier were extracted using a Praat script adapted from Carignan’s script (Reference Carignan2009) to suit our specific requirements. Next, the onset, offset and duration data were fed into a Praat script that we created for this study. The script uses the PSOLA (Pitch Synchronous Overlap-Add) algorithm (Moulines & Charpentier, Reference Moulines and Charpentier1990) to superimpose the duration of each segment from the homeland speaker samples onto the test stimuli, thereby minimizing the influence of rhythm when evaluating segments-only stimuli. Once the rhythm manipulation procedure was completed, the samples underwent monotonization using the ‘Monotonize’ command in the Praat Vocal Toolkit (Corretge, Reference Corretge2021). This command monotonizes the pitch contour to the pitch median of the selected audio file. Monotonized samples do not demonstrate changes in pitch, thereby requiring the listeners to rely solely on the segmental information when assessing the accentedness of the speech.
The prosody-only stimuli were created by applying a low-pass Hann Band filter to the original stimuli in Praat (Jilka, Reference Jilka2000; Kolly et al., Reference Kolly, Leemann and Dellwo2014; Shin, Reference Shin2005; Trofimovich & Baker, Reference Trofimovich and Baker2006). The cutoff frequency was set to 320 Hz for males and 400 Hz for females, with a smoothing of 50 Hz. This cutoff point was selected based on the F1 values reported for the Spanish high vowel /i/ produced by non-heritage and heritage native speakers of Spanish (Ronquest, Reference Ronquest, Howe, Blackwell and Quesada2013; Willis, Reference Willis2005), aiming to exclude as much segmental information as possible. By removing significant segmental information, these low-pass filtered samples were rated solely based on the prosodic properties. Upon completion of the resynthesis procedure, the sound volume was normalized so that the average intensity was set at 80 dB for all samples, ensuring they were loud enough for listeners without requiring volume adjustments during the experiment.
In total, we had 108 stimuli (= 36 original condition + 36 segments-only condition + 36 prosody-only condition).
4.3. Procedures
The experiment was administered using SurveyMonkey (https://www.surveymonkey.com), which is an online platform for creating and conducting surveys. Raters first gave their consent to participate and completed a language background questionnaire (LBQ), which was followed by the accent perception task. The LBQ asked about their hometown, current city of residence, where their parents are from, educational experience in Spanish and language use. The accent perception task was carried out in three blocks, each block corresponding to one of the three conditions tested (i.e., original, segments-only, prosody-only). The blocks were presented in the order of original, segments-only and prosody-only with a short break in between. The test items were randomized within each block. The entire procedure took approximately 45 minutes to complete.
For the segments-only condition, raters were informed that they would hear speech samples resembling less sophisticated robots or androids. For the prosody-only condition, they were instructed that the samples would sound as if someone were speaking in an adjacent room behind a closed door (Munro, Reference Munro1995). Since the raters were not able to understand individual words, they were presented with the sentences corresponding to each sample (following Shin, Reference Shin2005; Trofimovich & Baker, Reference Trofimovich and Baker2006) and were encouraged to read them before playing the samples to facilitate comparison between what they expected to hear and what they heard. At the beginning of each block, along with the instructions, a training session with four speech samples from two speakers was provided to familiarize the raters with each condition. These speakers were not part of the main experiment. One speaker was a NHNS and the other was a second-language learner. The raters were not given any feedback on the training items, and these responses were not included in the analysis.
For each speech sample, raters were asked two questions: (1) how native the speaker sounds, on a scale of 1 (= completely non-native) to 6 (= completely native) and (2) in which country the speaker currently lives. Note that the term “non-native” was used here instead of “foreign,” which is commonly used in studies on heritage accent. This terminology choice was made to prevent raters from perceiving a non-Mexican accent (e.g., Argentinian Spanish) as “foreign.” Since the HS speakers were from the U.S., which is a foreign country for the NHNS raters, we used “non-native” to distinguish it from “foreign.”
As for the country of residence question, it was presented in a free-response format rather than a multiple-choice format to prevent raters from forming preconceived notions about the speakers’ origins. Moreover, L2 speakers with two different language backgrounds (i.e., L1 English and L1 Korean) were recruited to suggest to the raters that the speakers come from varied backgrounds, thereby encouraging responses that included countries other than Mexico or the U.S. This article will mainly discuss the data pertaining to the accent rating question. Additionally, to facilitate comparison between speaker groups (NHNS/HS/L2), only L1 English speakers from the L2 group will be included in the results below.
To ensure that the raters fully understood the instructions and that they were consistently paying attention to the rating task, we applied a two-step screening procedure. Initially, utilizing the accent ratings for the original condition, accuracy scores were computed for each rater concerning two baseline speaker groups (i.e., NHNS and L2 speakers). A response was deemed correct (1) if the rater assigned an L2 speaker an accent rating between 1 (= completely non-native) and 3 (= somewhat non-native) and incorrect (0) otherwise. Similarly, a response was considered correct (1) if the rater gave an NHNS speaker an accent rating between 4 (= somewhat native) and 6 (= completely native). Raters with an accuracy score of 50% or lower were excluded from the subsequent analysis. Secondly, raters who repeatedly provided the same response to the country of residence question were also excluded. For instance, a rater was excluded from the dataset for responding “U.S.” to all 36 items for the segments-only condition.
5. Results
Out of the 100 participants, 11 HS and 7 NHNS raters were excluded from the analysis after the two-step screening procedure mentioned above. Thus, our dataset comprised responses from 38 HS raters (22 female, 16 male) and 44 NHNS raters (14 female, 30 male). Table 1 presents the descriptive statistics of the 7380 accent ratings from the remaining 82 raters, each of whom rated 90 speech samples (30 items × 3 conditions).
Descriptive statistics of accent ratings

Note: Accent ratings were on a scale 1 (= completely non-native), 6 (= completely native). HSs = heritage speakers; L2 = L2 learners; NHNSs = non-heritage native speakers.
We performed an ordinal logistic regression using the cumulative link mixed models (clmm) function from the R package ‘ordinal’ (Christensen, Reference Christensen2023) to test the effects of speaker group (HS/L2/NHNS), stimulus type (original/segments-only/prosody-only), rater group (HS/NHNS) and the interactions among them on accent ratings. We also included participants’ gender as a control variable due to its potential effect on the perception of accented speech (Nelson et al., Reference Nelson, Signorella and Botti2016). Participant (raters) and item (speakers) were included as random effects. The best fitting model was selected through backward elimination and model comparisons were made using the anova() function from the R package ‘car’ (Fox & Weisberg, Reference Fox and Weisberg2019). Post hoc pairwise comparisons were conducted using the emmeans() function from the R package ‘emmeans’ (Lenth, Reference Lenth2024). Visualization of the data was carried out based on a data frame created using the ggpredict() function from the R package ‘ggeffects’ (Lüdecke, Reference Lüdecke2018).
The full model with all three predictors did not converge, thus, we split the data into two based on the rater group and conducted ordinal logistic regression analysis on each dataset with stimulus type, speaker group and the interaction between the two as fixed effects and participant (rater) and item (speaker) as random effects. For both datasets, the best-fitting model selected through backward elimination included random intercepts for participant and item, as well as by-participant random slopes for speaker group and by-item random slopes for stimulus type. Adding gender as a control variable did not improve the model fit in any of the datasets (ps > .1). Thus, we did not include this factor in the models. Table 2 demonstrates the model outputs. Detailed model outputs, the commands used in R software and the datasets are available online (https://osf.io/4nhke/).
Outputs of the ordinal logistic regression models on non-heritage native raters’ (top) and heritage raters’ (bottom) accent ratings

Note: Heritage speakers and original condition were set as the reference levels for speaker group and stimulus type, respectively. HSs = heritage speakers; L2 = L2 learners; NHNSs = non-heritage native speakers.
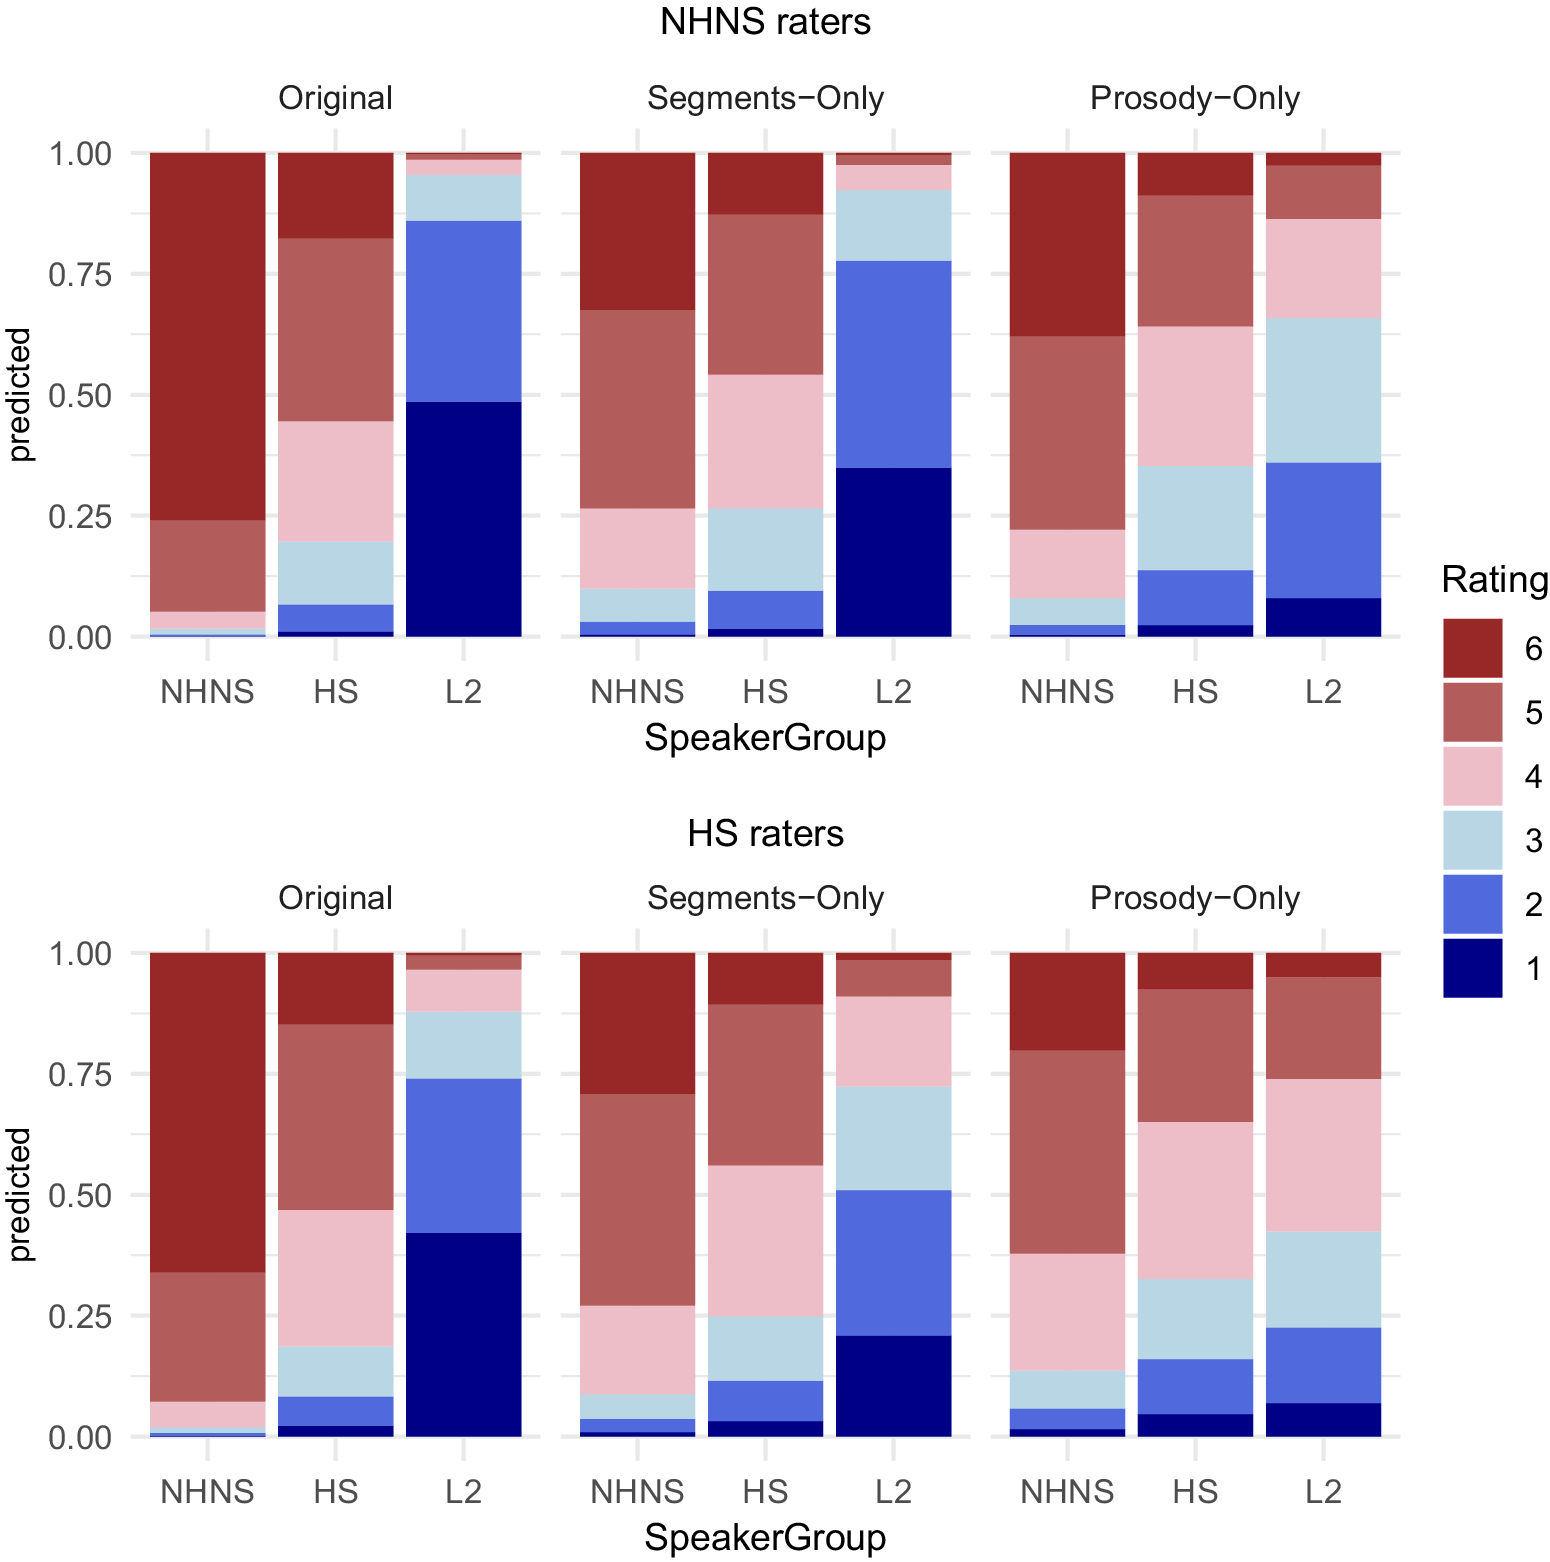
Effect plots of the interaction between stimulus type and speaker group for the NHNS and HS raters are shown in Figure 1. Red-shaded bars indicate accent ratings in the native range and blue-shaded bars indicate accent ratings in the non-native range.
Predicted probabilities of responses by stimulus type and speaker group for non-heritage native raters (top) and heritage raters (bottom) (1 = completely non-native, 6 = completely native). HSs = heritage speakers; L2 = L2 learners; NHNSs = non-heritage native speakers.

As shown in Table 2, a main effect of speaker group was found in both rater groups, suggesting that HS speakers’ accent ratings were significantly higher (i.e., more native-like) than L2 speakers’ (ps < .001) and significantly lower (i.e., less native-like) than NHNS speakers’ (ps < .001). We also found a main effect of stimulus type for the prosody-only condition (p < .001) in the case of the NHNS raters and for both segments-only (p < .05) and prosody-only conditions (p < .001) in the case of the HS raters. That is, both rater groups provided significantly higher ratings to the original condition than to the prosody-only condition. While the ratings of the original and segments-only conditions did not significantly differ from each other for the NHNS raters, they did for the HS raters in that the HS raters provided significantly higher ratings to the original condition, compared to the segments-only condition.
There were significant interactions between the speaker group and stimulus type in both rater groups (ps < .05). Post hoc pairwise comparison results revealed that the interactions were driven by varying rankings of the three stimulus types across the speaker groups. For both rater groups, NHNS speech in the original condition demonstrated significantly higher ratings than the two resynthesized conditions (ps < .001), while the ratings of the two resynthesized conditions did not differ from each other (ps > .18). That is, altering NHNS speech may slightly reduce NHNS and HS raters’ perception of nativeness but this effect occurs to a similar extent regardless of whether segments or prosody are altered. When listening to HS speech, both rater groups gave the highest accent ratings to the original condition and the lowest ratings to the prosody-only condition (original > prosody-only, ps < .001), with segments-only condition in the middle, although the accent ratings in this condition were not significantly different from those in the original and the prosody-only conditions (ps > .29). In contrast to the HS speech, when listening to L2 speech, the raters gave the highest ratings to the prosody-only condition and the lowest ratings to the original condition (original < prosody-only, ps < .001), with segments-only condition in the middle. While, for both rater groups, the segments-only condition received significantly lower ratings than the prosody-only condition (ps < .001), we found different patterns between them in that the NHNS raters gave similarly low ratings to both the original and the segments-only conditions (p = .737), whereas the HS raters gave significantly lower ratings to the original condition than to the segments-only condition (p < .001). Taken together, the findings of this study indicate a tendency for both rater groups to rely more on prosody when perceiving heritage accents and on segments when perceiving L2 foreign accents.
Post hoc pairwise comparison results also revealed that the interactions were driven by varying rankings of the speaker groups across the stimulus types. While speaker group differences were found to be statistically significant in most cases (ps < .001), demonstrating a NHNS > HS > L2 pattern across stimulus types (see Table 1), differences were not statistically significant between HS speakers and NHNS speakers in the segments-only condition for the NHNS raters (p = .27), while they were for the HS raters (p < .05). Moreover, differences were not statistically significant between HS speakers and L2 speakers in the prosody-only condition for both the NHNS raters (p = .238) and the HS raters (p = .986). In other words, when listening to L2 speech, both rater groups perceived L2 foreign accent in L2 speakers’ segments and prosody, but, when listening to HS speech, they demonstrated slightly different patterns in that the NHNS raters only perceived heritage accent in HS speakers’ prosody, whereas HS raters perceived it in both HS speakers’ segments and prosody. Table 3 summarizes these findings. The patterns that differ between the two groups are marked in bold.
Summary of findings by rater group

Note: Bold: different patterns between the two rater groups, >: statistically significantly higher, <: statistically significantly lower, ~: not statistically significantly different. HSs = heritage speakers; L2 = L2 learners; NHNSs = non-heritage native speakers.
6. Discussion
The present study explored how NHNSs and HSs perceive heritage accents by implementing a global accent rating task. Speech samples from non-heritage native speakers (NHNS speakers), heritage speakers (HS speakers) and second-language learners (L2 speakers) were evaluated on a scale from 1 (= completely non-native) to 6 (= completely native). For each speech sample, three stimulus types were tested: original, segments-only (i.e., segmental information was preserved, while prosodic information was removed) and prosody-only (i.e., prosodic information was preserved, while segmental information was removed). Regarding our research questions related to the nativeness of HS speech—RQ-1a: Do HSs sound native-like? RQ-1b: Is HS raters’ perception of accents different from that of NHNS raters?—our findings suggest that HS speech is native-sounding to both NHNS and HS raters and that HS raters exhibit similar patterns to NHNS raters in their perception of accents (NHNS ≳ HS ≳ L2 across stimulus types; NHNS speech: original > segments-only ~ prosody-only; HS speech: original > prosody-only; L2 speech: original ≲ segments-only < prosody-only). The NHNS speakers were perceived as “very-to-completely native” by both NHNS and HS raters (NHNS raters: 5.58, HS raters: 5.48), followed by HS speakers who were perceived as “somewhat-to-very native” (NHNS raters: 4.38, HS raters: 4.36). L2 speakers received the lowest ratings and were perceived as “somewhat-to-very non-native” (NHNS raters: 1.81, HS raters: 2.13). These results are consistent with previous research on heritage accent, which suggests that HSs sound less native-like than NHNSs but more so than L2s (e.g., Au et al., Reference Au, Oh, Knightly, Jun and Romo2008; Lloyd-Smith et al., Reference Lloyd-Smith, Einfeldt and Kupisch2020). Given that the two rater groups largely agreed in their ratings, we can conclude that HSs’ ability to perceive accents in their heritage language aligns with that of homeland speakers. This suggests that HSs’ perceptual abilities may be comparable to those of homeland speakers at a holistic level and are not limited to distinguishing specific segmental or suprasegmental features in their heritage language (Kim, Reference Kim2011, Reference Kim and Willis2015, Reference Kim2020; Oh et al., Reference Oh, Jun, Knightly and Au2003; Tees & Werker, Reference Tees and Werker1984).
With regard to our second research question—RQ-2: Which of the two aspects of speech, segments or prosody, contributes more to perceived heritage accent?—we found that HS speakers received the lowest ratings in the prosody-only condition, confirming our prediction that heritage accent is marked primarily through prosodic features (Stangen et al., Reference Stangen, Kupisch, Ergün, Zielke and Peukert2015; Wrembel et al., Reference Wrembel, Marecka, Szewczyk and Otwinowska2019). When listening to HS speech, both HS and NHNS raters gave significantly lower accent ratings to the prosody-only condition than to the original condition. Although the accent ratings of the segments-only condition did not significantly differ from those of the original and the prosody-only conditions, the trend of original > segments-only > prosody-only was observed in both rater groups (see Table 1). This trend may be more robust with a larger sample size. We believe that ambiguity of HS speech in terms of nativeness may have resulted in the non-significant differences between the segments-only condition, placed in the middle, and the other two conditions. Previous studies have consistently shown that raters are more uncertain in their judgments of HS speech than NHNS or L2 speech (Kupisch et al., Reference Kupisch, Barton, Hailer, Klaschik, Stangen, Lein and van de Weijer2014, Reference Kupisch, Lloyd-Smith, Stangen and Bayram2020; Lloyd-Smith et al., Reference Lloyd-Smith, Einfeldt and Kupisch2020; Stangen et al., Reference Stangen, Kupisch, Ergün, Zielke and Peukert2015). It is highly probable that our raters were less certain when evaluating HS speech, which is reflected in their tendency to give ratings in the middle range (3 or 4) (NHNS raters: original: 37.8%, segments-only: 44.6%, prosody-only: 50.4%; HS raters: original: 38.5%, segments-only: 44.5%, prosody-only: 49%), rather than at the extremes (1 or 6). In the original condition, the NHNS speakers and the L2 speakers received extreme ratings from NHNS raters 76.1% and 48.8% of the time, respectively, and 66.3% and 42.6% of the time from HS raters, respectively. On the other hand, the HS speakers received extreme ratings from the NHNS raters and the HS raters only 18.9% and 17.1% of the time, respectively. This preference for mid-range ratings when listening to HS speech likely contributed to non-significant differences observed between the segments-only condition and the other conditions.
Unlike HS speakers, who received the lowest ratings in the prosody-only condition, L2 speech showed the opposite pattern, with the prosody-only stimuli perceived as the most native-like. Given that the L2 speech came from only three speakers, caution is warranted in generalizing these findings. Nevertheless, our findings are consistent with previous studies indicating that L2 foreign accents are mainly perceived from segmental information (Sereno et al., Reference Sereno, Lammers and Jongman2016; Ulbrich & Mennen, Reference Ulbrich and Mennen2016). Taken together with findings that prosody is more influential in heritage accent perception than segments (Stangen et al., Reference Stangen, Kupisch, Ergün, Zielke and Peukert2015; Wrembel et al., Reference Wrembel, Marecka, Szewczyk and Otwinowska2019), these results suggest that raters perceive accent through different aspects of the speech signal (prosody versus segments) when listening to HS and L2 speech. Future research should further investigate whether cue weighting in accent perception varies depending on the speaker’s background.
It is worth noting that for both rater groups, the accent ratings of the segments-only and the prosody-only conditions of NHNS speech and the accent ratings of the prosody-only condition of HS and L2 speech were not significantly different from each other (see Table 3). The fact that the segments-only and prosody-only conditions of NHNS speech received comparable ratings, with both conditions being rated as less native-like than the original condition, is not surprising. While resynthesized speech is expected to sound more unnatural than the original speech, masking either the segments or the prosody should not have a significantly greater effect than masking the other, as both the segmental and suprasegmental information were highly native-like. This finding aligns with van Els and de Bot’s (Reference van Els and de Bot1987) study, which demonstrated that it is more challenging to identify native speakers when listening to manipulated speech than unaltered speech.Footnote 5
Furthermore, in our study, the difference between HS speakers and L2 speakers was not significant in the prosody-only condition. A potential explanation for this tendency is that the prosody of HS speakers and L2 speakers may indeed be comparable. That is, certain prosodic features may sound equally less native-like for both groups. Further investigation is needed to identify the specific prosodic features that influence this reduced perception of nativeness and to determine whether HSs and L2s differ in the production of these features. Based on the present data, we have found that while prosody contributes more to the heritage accent than segments do, segments play a larger role in L2 foreign accent, resulting in the lack of significant difference between the two groups in the prosody-only condition, while showing significant differences in original and segments-only conditions.
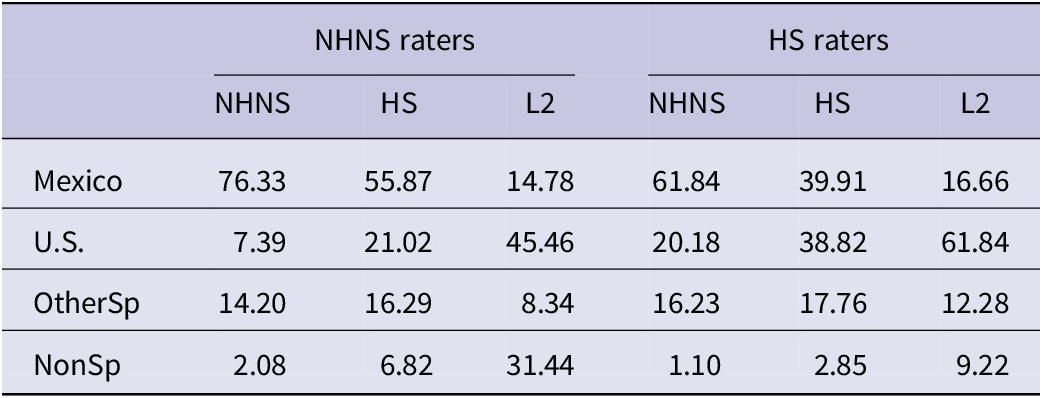
Although the two rater groups exhibited similar patterns, one notable distinction between them is that, unlike the NHNS raters who gave similar ratings to the NHNS speakers and the HS speakers in the segments-only condition, the HS raters gave more native-like ratings to the NHNS speakers than to the HS speakers. A potential explanation for this difference is that HS raters may be more sensitive to heritage accent than NHNS raters. To confirm this, we analyzed the responses regarding speakers’ predicted country of residence for segments-only stimuli. The country of residence data came from a follow-up question after the accent rating task, in which listeners were asked to identify the country where they believed the speaker resided. We recategorized raters’ responses into four categories: Mexico, U.S., any Spanish-speaking country other than Mexico (OtherSp) and any non-Spanish-speaking country (NonSp). Table 4 presents predicted response rates of the four different countries of residence.
Predicted country of residence responses for each speaker group (%)

Note: OtherSp = any Spanish-speaking country other than Mexico; NonSp = any non-Spanish-speaking country.
Our results show that HS raters (38.82%) were indeed more accurate than NHNS raters (21.02%) in identifying HS speakers. NHNS raters predominantly perceived HS speakers as residing in Mexico (55.87%). These findings are contrary to our prediction that HS raters would perceive HSs as less accented than NHNS raters would, due to the familiarity effect (Kornder & Mennen, Reference Kornder and Mennen2021; Winke et al., Reference Winke, Gass and Myford2011; Winke & Gass, Reference Winke and Gass2013; Yuan et al., Reference Yuan, Jiang and Song2010). While HS raters were more sensitive to heritage accent than NHNS raters, they gave lower accent ratings to the HS speakers than the NHNS raters did (see Schoonmaker-Gates, Reference Schoonmaker-Gates2012, who found that L1 English-L2 Spanish speakers rated other L2s more harshly despite their familiarity with the accent). This is possibly due to the standard language ideology deeply rooted within Spanish speakers in the U.S. It has been reported in previous studies that HSs tend to believe that there is an idealized or correct form of Spanish, which is the variety spoken by monolingual native speakers (Del Carpio & Ochoa, Reference Del Carpio and Ochoa2022; Leeman, Reference Leeman and Potowski2018; Valdés et al., Reference Valdés, González, García and Márquez2003). According to Del Carpio and Ochoa (Reference Del Carpio and Ochoa2022), it is challenging to eradicate this belief, as demonstrated in interviews with students who have been enrolled in one or more heritage language courses that were designed to combat those negative ideologies. It is likely that our HS raters also subscribe to this ideology and consider the Spanish spoken in the U.S. as informal, incorrect, and inferior to the monolingual homeland variety.
To verify whether this ideology was reflected in our accent rating task, we computed Pearson correlation coefficients to assess the relationship between the accent ratings and the response rates indicating the country of residence as either the U.S. or a Spanish-speaking country (e.g., Mexico, Colombia, Spain). We counted the number of times each speaker was considered to reside in either the U.S. or a Spanish-speaking country. The results indicated that there was a strong negative relationship between the accent ratings and the response rates of the U.S. as the country of residence for both the NHNS raters (stimulus types combined: r = −.96, p < .001; original: r = −.98, p < .001; segments-only: r = −.95, p < .001; prosody-only: r = −.96, p < .001) and the HS raters (stimulus types combined: r = −.91, p < .001; original: r = −.90, p < .001; segments-only: r = −.91, p < .001; prosody-only: r = −.93, p < .001). That is, irrespective of the rater group, speakers perceived as residing in the U.S. tended to be rated as having a stronger non-native accent in Spanish. As depicted in Figure 2, a few HS speakers and L2 speakers received native-like accent ratings, and these speakers were seldom predicted to live in the U.S. Conversely, there was a strong positive correlation between the accent ratings and the response rates of a Spanish-speaking country as the country of residence for both the NHNS raters (stimulus types combined: r = .99, p < .001; original: r = .99, p < .001; segments-only: r = .99, p < .001; prosody-only: r = .98, p < .001) and the HS raters (stimulus types combined: r = .94, p < .001; original: r = .94, p < .001; segments-only: r = .94, p < .001; prosody-only: r = .97, p < .001). This indicates that speakers who were predicted to reside in a Spanish-speaking country were more likely to be perceived as native-sounding in Spanish. Thus, it can be inferred from these findings that native listeners, regardless of whether they are HSs or NHNSs, tend to idealize Spanish spoken in Spanish-speaking countries, while considering Spanish spoken in the U.S. as less ideal. This attitude may have led the HS raters to be stricter with their peers, thereby assigning lower ratings to HS speech than to NHNS speech.
Relationship between accent rating and assumed country of residence (combined stimulus types) (top: U.S., bottom: Spanish-speaking country).

Our finding that listeners, regardless of language background, tend to be influenced by the standard language ideology has implications for both pedagogy and future research. Specifically, this finding highlights the significance of implementing critical approaches in heritage language classrooms to combat these ideologies (e.g., Beaudrie et al., Reference Beaudrie, Amezcua and Loza2020). Moreover, it underscores potential concerns in heritage language research. That is, anyone who participates in accent rating studies is likely to be influenced by this ideology, which may pose challenges in heritage accent research. Therefore, heritage perception research should take into account raters’ ideology toward nonstandard varieties.
Conversely, the familiarity effect appears to positively influence the ratings of L2 speakers, resulting in more native-like evaluations. Particularly for segments-only and prosody-only stimuli, the HS raters appear to perceive L2 speech as less accented, compared to NHNS raters. Using predicted probabilities, we calculated the likelihood of receiving accent ratings within the native range (4–6). In the segments-only condition, it is predicted that HS raters give a rating of 4 (= somewhat native) or higher 27.6% of the time, whereas NHNS raters do so only 7.7% of the time. In the prosody-only condition, HS raters are predicted to give a native-like accent rating 57.5% of the time, compared to 34.2% by NHNS raters. Thus, HS raters seem to be more lenient toward L2 speech than NHNS raters are, which can be attributed to the familiarity effect. Although HS raters are familiar with both L2 foreign accent and heritage accents, this familiarity positively influenced their ratings of L2 speech, while it had a negative effect on their ratings of HS speech.
7. Conclusion
In order to elucidate the phonetic divergence of heritage Spanish in the U.S. from homeland varieties, we compared the relative contribution of prosody and segments to the perceived heritage accent. Using HS and NHNS ratings of original and resynthesized speech, we found that HS and NHNS raters perceived NHNS speakers as the most native-sounding, followed by HS speakers and then L2 speakers, who were perceived as the most accented. Our data shows that, despite reduced input and contact with English, heritage bilinguals are generally perceived as native-like and demonstrate similar perceptual acuity as NHNSs for accent recognition. Additionally, we found that heritage accent is more strongly influenced by prosodic factors, as evidenced by the prosody-only condition being rated as the most accented for HS speech. Consistent with previous studies on foreign accent perception, L2 speech showed the opposite pattern: L2 speakers were perceived as the least accented in the prosody-only condition, suggesting that heritage accent is distinct from foreign accent.
Despite the global similarity between the two rater groups, some specific differences emerged with respect to the stimulus type; notably, HS raters were more charitable than NHNS raters when evaluating L2 speech, potentially due to a familiarity effect. This magnanimity was not extended to the HS speakers, who were not rated more highly by their peers than by NHNS raters, despite their accent being familiar to the HS raters. The predominant language ideology that privileges monolingual native speakers was corroborated by further tests which correlated assumed U.S. residence with a less native-like accent and assumed residence in a Spanish-speaking country with a more native-like accent.
Although our study is the first to investigate the perceptions that HSs have of the speech of other HSs, future research should include speakers from other generations, especially first-generation/long-term immigrants. This would provide an intermediary level between NHNSs and second-generation HSs. Furthermore, different sociolinguistic contexts may yield different outcomes regarding the relative contribution of prosody versus segments in the heritage accent. Thus, future research should determine whether the present findings are generalizable with different combinations of majority and minority languages and in different geopolitical situations. For example, Spanish HSs in Germany, where the majority language (i.e., German) has rhythmic patterns similar to English, might exhibit patterns similar to those of Spanish HSs in the U.S. but differ from Spanish HSs in Italy, where the majority language (i.e., Italian) has a syllable structure and stress pattern closer to that of Spanish. Similarly, one could compare Spanish HSs to German HSs in the U.S. to explore how the relative contributions of prosody and segments differ across HS groups. When conducting these studies with other HS populations, it may be advisable to account for their language ideology. As our findings suggest, the standard language ideology may be shared among HSs, which will influence how they assign accent ratings. Additionally, it would be interesting for future work to examine how language use by both speakers and raters may impact accent ratings, as Lloyd-Smith et al. (Reference Lloyd-Smith, Einfeldt and Kupisch2020) found that the perceived accentedness of HSs largely depended on their heritage language use. Finally, previous research has reported that masking the content of the message can make it challenging for raters to judge accentedness (see Jügler et al., Reference Jügler, Zimmerer, Trouvain and Möbius2016; Boula de Mareüil & Vieru-Dimulescu, Reference Boula de Mareüil and Vieru-Dimulescu2006; Sereno et al., Reference Sereno, Lammers and Jongman2016; Ulbrich & Mennen, Reference Ulbrich and Mennen2016; Yi, Reference Yi2007); thus, future research should implement prosody transplantation, where the prosody of HS is superimposed onto the segments of NHNS, and vice versa (using the same example sentences), to see if the present findings are replicable.
Data availability statement
The data that support the findings of this study are openly available on the Open Science Framework: https://doi.org/10.17605/OSF.IO/4NHKE.
Acknowledgments
We would like to thank the UCLA Pandemic Resource Program for funding the online data collection of this study. We also thank three anonymous reviewers for their thoughtful comments and feedback.
Competing interests
The authors declare none.


 Open access