





Voice Onset Time (VOT), defined as the time period between the release of the stop and the onset of voice in the following vowel, is an acoustic measure that varies across languages and is known to be vulnerable to cross-linguistic influence among multilinguals (e.g., Flege, Reference Flege1991, Reference Flege1995; Flege & Eefting, Reference Flege and Eefting1988; Llama et al., Reference Llama, Cardoso and Collins2010; Wrembel, Reference Wrembel, Wai-Sum and Zee2011, Reference Wrembel2014, Reference Wrembel, Gut, Fuchs and Wunder2015; Wunder, Reference Wunder, Dziubalska-Kołaczyk, Wrembel and Kul2010). For instance, English has longer VOT in /p, t, k/ sounds than Spanish. It is not unusual for first language (L1) English-speaking learners to transfer long VOT to their second language (L2) Spanish (e.g., Zampini, Reference Zampini1998; Nagle, Reference Nagle2017, Reference Nagle2019), pronouncing words like “taco” with distinctive long aspiration.
For Chinese-speaking learners of Spanish, learning to perceive and produce the negative VOT in Spanish voiced stops /b, d, g/ is known to be more challenging, as learners tend to assimilate Spanish /b, d, g/ to Chinese /p, t, k/ and produce short positive VOT due to their similarity (Bravo-Díaz, Reference Bravo-Díaz2020; Chen, Reference Chen2007; Liu, Reference Liu2016, Reference Liu2019; Liu & Machuca Ayuso, Reference Liu and Machuca-Ayuso2021; Zhang, Reference Zhang2022; Zhang et al., Reference Zhang, Morales-Front, Sanz, Brown, Fernández-Berke and Flynn2023). Lack of voicing in both initial and sentence-medial positions (i.e., pronouncing “ bollo ” in a way that is perceived as “ pollo ” by native Spanish speakers) is seen as a stereotype of Chinese-accented Spanish.
However, here as everywhere else in foreign language pronunciation, a tremendous degree of individual variation can be observed. While native-like pronunciation is generally thought to be out of reach for many second language learners (L2ers) who are exposed to the additional language after a fairly young age (6–7 years, e.g., Granena & Long, Reference Granena and Long2013), it is also not so uncommon for some adult learners of a new language to achieve excellent and even near-native pronunciation. Previous studies investigating Spanish VOT produced by Chinese university students identified individual learners who developed target-like negative VOT in Spanish voiced stops (Chen, Reference Chen2007; Zhang, Reference Zhang2022; Zhang et al., Reference Zhang, Morales-Front, Sanz, Brown, Fernández-Berke and Flynn2023). Considering that Spanish learners in China almost uniformly start learning the language in their first year of college, factors of individual differences (IDs) other than age of acquisition must be at play to give some individuals an advantage.
Previous research on L2 speech has pointed to language aptitude as an important factor that impacts the rate and outcome of speech development (e.g., Granena, Reference Granena2016; Saito, Reference Saito2017, 2019; Skehan, Reference Skehan2002). However, there is a dearth of longitudinal and multi-wave studies that tap into how language aptitude interacts with time to shape pronunciation development. The present study aims to revisit language aptitude in an L3 classroom setting investigating the roles of language aptitude in interaction with development by applying a time-series method to trace VOT trajectories over 5 months. In particular, previous research pointed to delayed acquisition of negative VOT (prevoicing) in the target language when the feature does not prevail in the learner’s previous language(s) (e.g., Face & Menke, Reference Face, Menke, Collentine, García, Lafford and Marín2009; Bravo-Díaz, Reference Bravo-Díaz2020). This study follows the VOT production of L3 Spanish learners across a range of proficiency levels—from beginning to advanced—to trace how VOT patterns develop over time, both at the level of the full participant sample and in the individualized trajectories of learners. In doing so, the study examines which language aptitude components predict the accuracy and rate of prevoicing development in the production of Spanish voiced stops.
VOT and voicing contrast in Spanish
VOT refers to the time-lapse between the release of the consonant closure and the onset of voicing of the following segment. Lisker and Abramson (Reference Lisker and Abramson1964) were the first study to propose using VOT as a unified phonetic measure of the phonemic voicing contrast. Their cross-language study demonstrated three ways that voicing contrast is mediated through VOT values: 1) negative VOT (i.e., voicing begins before the release of the stop, also known as “prevoicing”) is typical in voiced stops; 2) short-lag VOT (i.e., voicing begins very shortly after the release of the stop, typically between 0 and ~30 ms) indicate voiceless, unaspirated stops; 3) long-lag positive VOT (i.e., voicing starts much later, typically 40 to 100 ms or more) is characteristic of voiceless, aspirated stops.
The combination of L1 Mandarin-L2 English-L3 Spanish involves all three VOT scenarios. Spanish is known as a voicing language, in which voiced stops in word-initial position typically show negative VOT (prevoicing) ranging from −60 to −100 ms depending on the place of articulation, e.g., “ bollo ” (bread roll). Voiceless stops have short, positive VOT typically shorter than 30 ms, e.g., “ pollo ” (chicken) (see Rosner et al., Reference Rosner, López-Bascuas, García-Albea and Fahey2000). Although English has a phonemically voiced stop category /b, d, g/, these stops are often realized as voiceless with short-lag VOT by the majority of English speakers in word-initial position (e.g., bike), although some individuals prefer prevoicing (Lisker & Abramson, Reference Lisker and Abramson1964; Herd, Reference Herd2020). English voiceless stops /p, t, k/ are aspirated in word-initial positions with long-lag VOT typically between 50 and 90 ms. Although some southern Chinese languages, such as Wu and Min, preserve voiced-voiceless stop contrasts from ancient Middle Chinese (Han, Reference Han2025; Zhai, Reference Zhai2022), modern Mandarin is generally assumed not to have a phonemically voiced category, contrasting two voiceless series of stops differentiated by aspiration—the unaspirated stops /p, t, k/ have short-lag VOT, e.g., “ baigu ” (skull) and the aspirated /pʰ, tʰ, kʰ/ have long-lag VOT, e.g., “ paigu ” (rib). Previous studies showed that Mandarin aspirated stops generally have longer VOTs than their English counterparts (Liao, Reference Liao2005; Rochet & Fei, Reference Rochet and Fei1991). Table 1 summarizes mean VOTs of stops in English, Mandarin, and Spanish according to different authors.
Mean VOTs of Stops in English, Mandarin, and Spanish.

Table 1. Long description
The table consists of 10 columns. The first column lists the language and source study, while the subsequent columns are labeled with phonetic symbols for stops: forward slash p super h forward slash, forward slash t super h forward slash, forward slash k super h forward slash, forward slash p forward slash, forward slash t forward slash, forward slash k forward slash, forward slash b forward slash, forward slash d forward slash, and forward slash g forward slash.
* Mandarin (Liao 2005; Rochet and Fei 1991): Values are 99.6, 98.7, and 110.3 for aspirated stops; 17.9, 18.6, and 21 for voiceless unaspirated stops. Voiced stop columns are empty.
* English (Lisker and Abramson 1964): Aspirated stop columns are empty. Voiceless unaspirated stops are 58, 70, and 80. Voiced stops show ranges: 1 to negative 101 for forward slash b forward slash, 5 to negative 102 for forward slash d forward slash, and 21 to negative 88 for forward slash g forward slash.
* Spanish (Rosner et al. 2000): Aspirated stop columns are empty. Voiceless unaspirated stops are 13.1, 14, and 26.5. Voiced stops are negative 91.5, negative 91.6, and negative 73.7.
The Perceptual Assimilation Model for L2 (PAM-L2; Best & Tyler, Reference Best, Tyler, Flege, Bohn and Munro2007) proposes that late-learned additional languages are perceived through the filter of previously acquired phonological categories, typically those of the L1. According to the model, learners develop a unified interlanguage phonological system in which contrasts in the new language are interpreted relative to prior language knowledge. As in the original PAM model for monolingual perception (Best, Reference Best1994), non-native contrasts may be assimilated in several ways: two-category assimilation (the two sounds are mapped onto distinct native categories), single-category assimilation (both sounds map onto the same native category), category-goodness assimilation (both sounds map to the same native category but differ in perceived fit), and uncategorized assimilation (a sound does not match any native category).
In the case of L3 Spanish acquisition by L1 Mandarin speakers with prior experience in L2 English, additional cross-linguistic interactions may influence assimilation patterns (cf. PAM-L3; Wrembel et al., Reference Wrembel, Marecka and Kopečková2019). Since fully voiced stops with negative VOT do not exist in Mandarin, and given that English provides partially overlapping stop categories (e.g., short-lag VOT voiceless stops), learners may initially map Spanish voiced stops /b, d, g/ onto their L1 voiceless unaspirated categories, which exhibit short-lag VOT values somewhat closer to the negative VOT of Spanish stops. This prediction aligns with empirical findings showing that Chinese learners often produce both Spanish /b, d, g/ and /p, t, k/ with short-lag VOT values, without differentiating voicing contrasts (Bravo-Díaz, Reference Bravo-Díaz2020; Chen, Reference Chen2007; Zhang, Reference Zhang2022; Zhang et al., Reference Zhang, Morales-Front, Sanz, Brown, Fernández-Berke and Flynn2023). Nevertheless, these studies have also documented individuals who successfully produce prevoicing in Spanish, particularly among more advanced learners. The core argument drawn from PAM-L2 for the present study is that acquiring Spanish prevoicing is not merely a matter of adjusting phonetic details, but rather a structurally difficult process of breaking a “single-category” assimilation. To successfully produce negative VOT, learners must establish an entirely new phonetic category—a cognitive hurdle that explains why prevoicing development is often delayed, and why individual differences in language aptitude may be critical in helping learners overcome this initial L1 perceptual filter.
While perception typically guides and overlaps with production (Nagle, Reference Nagle2018; Nagle & Baese-Berk, Reference Nagle and Baese-Berk2022), the ability to produce target-like prevoicing implies that some learners have established new L2 phonetic categories and acquired the articulatory control necessary for accurate production. The Speech Learning Model-revised (SLM-r; Flege et al., Reference Flege, Aoyama, Bohn and Wayland2021) offers a complementary framework for understanding these production outcomes, emphasizing that phonetic category formation is shaped by factors such as amount and quality of input, age of acquisition, language learning experience, and individual differences. According to SLM-r, successful acquisition of new phonetic categories in production depends not only on the perceptual similarity between L1 and L2 sounds, but also on learners’ ability to detect phonetic distinctions, receive sufficient input, and develop the requisite auditory-motor skills (see discussions in Saito et al., Reference Saito, Kachlicka, Suzukida, Mora-Plaza, Ruan and Tierney2024). Therefore, investigating individual difference variables, especially in an interactive and dynamic manner, is crucial for understanding variability in L2 and L3 pronunciation and phonological category development (Nagle, Reference Nagle, Li, Hiver and Papi2022).
Language aptitude and phonological development
Foreign language aptitude (LA) generally refers to a set of cognitive abilities that affects the rate, speed, and ease with which one individual, usually an adult, learns a foreign language, and has long been studied as a predictor of foreign language learning success (e.g., Carroll, Reference Carroll and Glaser1962, Reference Carroll1981; Granena & Long, Reference Granena and Long2013; Li, Reference Li2015, Reference Li2016; Skehan, Reference Skehan2002, Reference Skehan, Granena, Jackson and Yilmaz2016). Although the field has not yet reached a complete agreement on the cognitive components of LA, three major abilities, as measured by the five subsets of the MLAT (Modern Language Aptitude Test, Carroll and Sapon, Reference Carroll and Sapon1959, Reference Carroll, Sapon and Bethesda2002) are considered essential to SLA, namely phonetic coding ability (i.e., sound-symbol mapping), language analytic ability (i.e., grammatical sensitivity and inductive learning ability), and memory. Research has demonstrated that LA is independent of other individual variables such as motivation and is specific to the domain of language learning, although it overlaps with general intelligence (Li, Reference Li2015, Reference Li2016). Evidence has shown an association between LA and general second language proficiency (e.g., Carroll, Reference Carroll and Glaser1962, Reference Carroll1981; Dörnyei & Skehan, Reference Dörnyei, Skehan, Doughty and Long2003; Granena & Long, Reference Granena and Long2013; Sasaki, Reference Sasaki1996). With the aim to theorize LA within the frame of SLA, Skehan (Reference Skehan, Granena, Jackson and Yilmaz2016) proposed the acquisition-aptitude model, hypothesizing that different types of aptitude are uniquely tied to different stages of L2 learning, i.e., phonemic coding is linked to analyzing incoming input, associative memory is linked to automatizing partially acquired knowledge, and sequence recognition is linked to attaining advanced-level use of the language.
Over the years, the majority of empirical studies on LA have focused on how different components of aptitude relate to the acquisition of grammar and morphosyntactic structures (e.g., Granena, Reference Granena2013; Yilmaz & Granena, Reference Yilmaz and Granena2016; Yalçın & Spada, Reference Yalçın and Spada2016; see Li, Reference Li2015, for meta-analytic review), while relatively fewer studies have examined the relationship between aptitude and L2 phonological acquisition. And among these, the majority focus on learners’ overall speaking abilities, most commonly taking foreign accent as the dependent variable. Granena and Long (Reference Granena and Long2013) studied a group of 65 Chinese learners of Spanish living in Barcelona and investigated the relationship between age of onset, length of residence, language aptitude, and ultimate L2 attainment in three linguistic domains. In the domain of phonology, they found aptitude sub-tests measuring phonetic coding ability and grammatical inference to have the strongest correlation with learners’ degree of foreign accent as rated by native speakers. Another study, Hu et al. (Reference Hu, Ackermann, Martin, Erb, Winkler and Reiterer2013), also found phonetic coding ability, as measured by MLAT-spelling cues, to be a predictor of advanced learners’ rated foreign accent.
Research examining a wider range of variables related to oral production has uncovered the link between LA components and different aspects of speech development. Saito (Reference Saito2017) examined the relationship between aptitude components measured using the LLAMA subtests (Meara, Reference Meara2005; Meara & Rogers, Reference Meara and Rogers2019) and a range of pronunciation, fluency, vocabulary, and grammar measures of elicited picture descriptions produced by Japanese ESL learners. Results indicated that explicit aptitudes, specifically phonetic coding ability (LLAMA E), associative memory (LLAMA B), and language analytic ability (LLAMA F), were moderately associated with phonological accuracy, fluency, and lexicogrammar complexity in oral production. In particular, phonetic coding ability was significantly associated with the segmental measure of pronunciation rating. These results highlighted the link between phonetic coding ability and phonological accuracy in L2 speech, especially in limited-input classroom conditions, as it “might help L2 learners notice and integrate new linguistic knowledge more efficiently via optimizing the processing of incoming linguistic input” (p. 683).
There has been a dearth of studies on the role of LA in the acquisition of segmental features. Saito (Reference Saito2019) investigated the relationship between different components of aptitude and the attainment of different dimensions of English /ɹ/ by Japanese learners in reading tasks. Learners with higher phonetic coding ability (LLAMA E) performed better in a relatively easy dimension of English /ɹ/ (lower F2 for tongue retraction), while those with greater associative memory (LLAMA B) demonstrated an advantage in a more difficult dimension of English /ɹ/ (longer transition duration for phonetic length; lower F3 for labial/alveolar/pharyngeal constrictions). In another study, Saito et al. (Reference Saito, Sun and Tierney2019a) investigated how aptitude and experience factors are associated with English oral production proficiency of Chinese international students in the UK. Phonetic coding ability (LLAMA E) emerged as a predictor for segmental attainment, along with neurophysiological measures of implicit aptitude. These results highlight the important roles of explicit language aptitudes in L2 learners’ segmental attainment, and pointed to an interaction between aptitude and segment difficulty and/or learnability.
Up to now, only one longitudinal study has been conducted to uncover the dynamic link between LA components and pronunciation development. In a year-long investigation of a group of English learners in Japan, Saito et al. (Reference Saito, Suzukida and Sun2019b) identified both phonetic coding ability (LLAMA E) and associative memory (LLAMA B) as contributors to general comprehensibility in the first semester. However, during the second semester, as learners’ exposure to English continued to accumulate, sequence recognition ability (SRA), an implicit aptitude component measured by LLAMA D subset, played a more decisive role in segmental accuracy. Their findings on oral proficiency development at a macro level corroborate Skehan’s hypothesis that explicit aptitudes are stronger predictors for attainment in L2 oral production during earlier stages of learning, while implicit aptitude characterized by the capacity of inducing patterns from natural input might benefit learners in more advanced stages. Similar conclusions were reached by Serafini and Sanz (Reference Serafini and Sanz2016) for morphosyntactic development.
By conducting a longitudinal examination of a specific segmental feature (VOT) at the micro-level, this study aims to contribute to the existing literature in three distinct ways. First, while previous studies have largely confirmed the role of explicit language aptitude in predicting macro-level pronunciation outcomes like overall foreign accent, this study tests whether those findings hold true for the micro-level articulatory control required for L3 prevoicing. Second, by tracking learners over 5 months, this research addresses a methodological gap; it moves beyond cross-sectional snapshots to uncover whether different aptitude components (specifically explicit versus implicit aptitudes) exert their influence at different developmental stages, as hypothesized by Skehan’s (Reference Skehan, Granena, Jackson and Yilmaz2016) acquisition-aptitude model. Finally, this study generates new knowledge regarding L3 phonological development, revealing how individual cognitive differences mitigate or exacerbate the cross-linguistic challenges faced by Mandarin-English bilinguals acquiring Spanish voiced stops.
In light of these objectives, the present study is mainly guided by the following questions:
RQ1. What developmental paths do Mandarin-English bilingual learners follow in their Spanish voiced and voiceless VOT over 5 months?
We expect asymmetric patterns in the VOT growth paths of voiced and voiceless stops. Because Spanish voiceless stops align perceptually with Mandarin unaspirated stops (both exhibiting short-lag VOT), we predict learners will demonstrate target-like accuracy for voiceless stops from the beginning. Conversely, because negative VOT (prevoicing) does not prevail in Mandarin, we hypothesize its development in Spanish voiced stops will be delayed and characterized by high levels of inter-subject variation over time. Moreover, the fact that prevoicing is more marked (due to its articulatory effort and lower perceptibility) than aspiration also makes us expect asymmetric patterns.
RQ2. To what extent do individual differences in language aptitude predict Mandarin-English bilingual learners’ production of prevoicing?
-
a. Which language aptitude indicator(s) predicts accuracy in prevoicing production?
Based on previous findings that highlighted the role of explicit aptitude in segmental pronunciation, we expect stronger phonetic coding ability (PCA) and associative memory (AM) to facilitate production of prevoicing. Specifically, stronger PCA should help learners notice and process fine-grained acoustic cues like prevoicing in the input, while AM should assist in storing these new sound-to-symbol mappings in short-term memory during early acquisition stages.
-
b. Which language aptitude indicator(s) predicts the rate of development in prevoicing production?
Following Skehan’s (Reference Skehan, Granena, Jackson and Yilmaz2016) acquisition-aptitude model, initial input processing is tied to explicit aptitudes, whereas sequence recognition ability (SRA)—an implicit aptitude—is linked to extracting regularities from natural input and proceduralizing knowledge over time. Because our 5-month longitudinal design captures the continuous accumulation of L3 exposure, we expect SRA to interact with time and proficiency, serving as the primary predictor for the rate of accelerated prevoicing development.
Methodology
Participants
An initial group of 33 sequential trilingual speakers of L1 Mandarin-L2 English-L3 Spanish participated in the study; 30 of these participants completed all data collection (N = 30). Their ages range from 17 to 21 (M = 19.6, SD = 1.21). They were all university students majoring in Spanish in four institutions of higher education located in northern China. All participants are native speakers of Mandarin dialects who typically started learning English in primary school (age, M = 6.9, SD = 2.0), and started learning Spanish when entering university (age, M = 17.9, SD = 0.6). Participants were enrolled in different years (1–4) in their undergraduate program and had varied proficiency levels in Spanish; their proficiency levels were measured using the Spanish Elicited Imitation Test (EIT, Ortega et al., Reference Ortega, Iwashita, Norris and Rabie2002). At the time of first data collection, year-1 students (n = 5) were beginners with barely any previous contact with the language; year-2 students (n = 8) had studied the language for two semesters; year-3 (n = 15) students for four semesters; and year-4 students (n = 2), six semesters. However, participants’ EIT oral proficiency test scores indicate that their Spanish proficiency was not always aligned with their academic placement groups. For this reason, participants were not divided into groups by their placement. Instead, we examined their proficiency (EIT scores) as a continuous variable. Figure 1 illustrates the distribution of initial Spanish proficiency (EIT score at beginning of the study with a range of 0 to 120).
Violin boxplot of initial EIT scores of participants by year.

Figure 1. Long description
The x-axis is labeled year with categorical values 1, 2, 3, and 4. The y-axis is labeled E I T with numerical increments of 25 from 0 to 125.
* Year 1: The data is concentrated at the baseline with a very flat violin shape and a boxplot showing a median near 0.
* Year 2: The violin plot expands vertically from approximately 25 to 110. The internal boxplot shows a median score of roughly 68, with an interquartile range between 60 and 78.
* Year 3: The distribution is similar to year 2, spanning from 30 to 115. The median is slightly lower at approximately 65, with an interquartile range between 58 and 78.
* Year 4: The distribution shifts upward, spanning from 35 to 120. The violin shape is wider at the top. The median is higher at approximately 82, with an interquartile range between 75 and 92.
Only three participants had studied abroad. Participants 17 and 25 (both year-4) had spent 10 and 7 months, respectively, studying in Spain, but had returned to China by the time data collection started. Participant 10 was the only student who was abroad during the length of the study. The first data collection coincided with her first month studying in Santiago de Compostela, Spain, and the last data collection was shortly after she completed her semester abroad and returned to China. No other participants reported living in or traveling to English or Spanish-speaking countries for more than one month.
Three participants reported minimal knowledge of additional foreign languages, including Korean (Participant 3, AoA = 14), Portuguese (Participant 3, AoA = 20), Japanese (Participant 23, AoA = 18), and German (Participant 27, AoA = 15). Their self-rated oral proficiency in these additional languages was between 1 and 3 on a scale of 0 to 7. Participant 18 was the only speaker of Wu—a southern Chinese dialect that preserves voiced stops, but indicated minimal exposure to the language after moving to Beijing during elementary school.
Experimental procedure
The protocol for the study was approved by the university’s IRB (MOD00005370). Participants provided informed consent online when they first reported to the experiment and completed an online Language History Questionnaire. They agreed to meet with the primary researcher five times, once per month. At each session, participants were recorded reading word lists in English, Mandarin, and Spanish, as well as a short text in Spanish, as part of a larger project. Their Spanish oral proficiency was assessed twice during the study, at Time 1 and Time 5. At the midpoint of the study (Time 3), participants completed the LLAMA language aptitude tests online. The present study analyzes only the recordings of the Spanish word list readings.
Word list reading task
Word lists
The word lists contained voiced and voiceless stop consonants in word-initial position in Mandarin, English, and Spanish, but only Spanish data were analyzed for the current study. Word lists have been used as instruments in previous studies on stop consonants as a measure to gather VOT in a controlled way both in L2 (Flege, Reference Flege1991; Yavas & Wildermuth, Reference Yavaş and Wildermuth2006) and in L3 studies (Llama & Cardoso, Reference Llama and Cardoso2018; Tremblay, Reference Tremblay2007; Wrembel, Reference Wrembel2014). Most of these studies looked at stops in initial position because the difference in VOT is the most prominent both word-initially and in the onset of stressed syllables.
All the words are frequent real words selected from Spanish textbooks used by Chinese college Spanish majors ( Español Moderno I and II). A pre-study survey completed by a separate group of Chinese college students (n = 7) with similar profiles assessed how familiar they were with the words, based on the frequency with which they heard or pronounced them. The included words received an average familiarity ranking of 4.88 out of 5 (SD = 0.14). The list includes 5 items for each of the 6 consonants—/b, d, g, p, t, k/—resulting in 30 target words with stop consonants in stressed, word-initial position (e.g., /pa.to/, “duck”). Twenty distractors that do not contain stop consonants were added to the word lists. The words were presented embedded in a short carrier sentence “ Voy a decir , #_____” (I will say). The carrier sentences were designed to ensure that the stop consonants were located in word-initial position after a pause. The word list is available in the IRIS database (Zhang, Reference Zhang2026).
Recording procedure
Due to COVID-19 restrictions, data collection was conducted remotely via Zoom. Participants joined individual sessions in which the experimenter shared a screen displaying randomized words presented with PsychoPy software (Peirce et al., Reference Peirce, Gray, Simpson, MacAskill, Höchenberger, Sogo and Lindeløv2019). As each target word appeared within the carrier sentence, participants read the sentences aloud. Audio was recorded locally on the experimenter’s computer using Praat (Boersma & Weenink, Reference Boersma and Weenink2018), in mono mode at 44,100 Hz, thereby avoiding compression artifacts or bandwidth-related distortions from online transmission.
Since the primary measure was voice onset time (VOT), a durational parameter relatively robust to minor variations in recording quality (Ge et al., Reference Ge, Xiong and Mok2021), the procedure was well suited to the study’s aims. When connectivity issues led to noticeable lags or dropouts, immediate repetitions were elicited to ensure data quality. The recording procedure was repeated five times at one-month intervals.
Coding of VOT
To answer RQ1, data from the Spanish word list collected at five points during the semester were coded for VOT values. A total of 4,500 stop tokens were annotated manually using Praat and extracted using the Praat script VOT logger (DiCanio, Reference DiCanio2011). Of those, 131 tokens (2.9%) were excluded from the analysis due to mispronunciation or poor recording quality, resulting in 4,369 tokens. Following Lisker and Abramson (Reference Lisker and Abramson1964), VOT was annotated as the time lapse between the release burst of the stop (RB) and the onset of the following vowel (VO), marked by the onset of periodic waveform and vowel formant. Stops pronounced with positive VOT show a period of aspiration before the periodicity of the vowel with no voicing during the stop closure (Figure 2), while stops produced with prevoicing are characterized by periodicity before the onset of the vowel, marked as the negative VOT (Figure 3).
Positive VOT of voiceless stop.
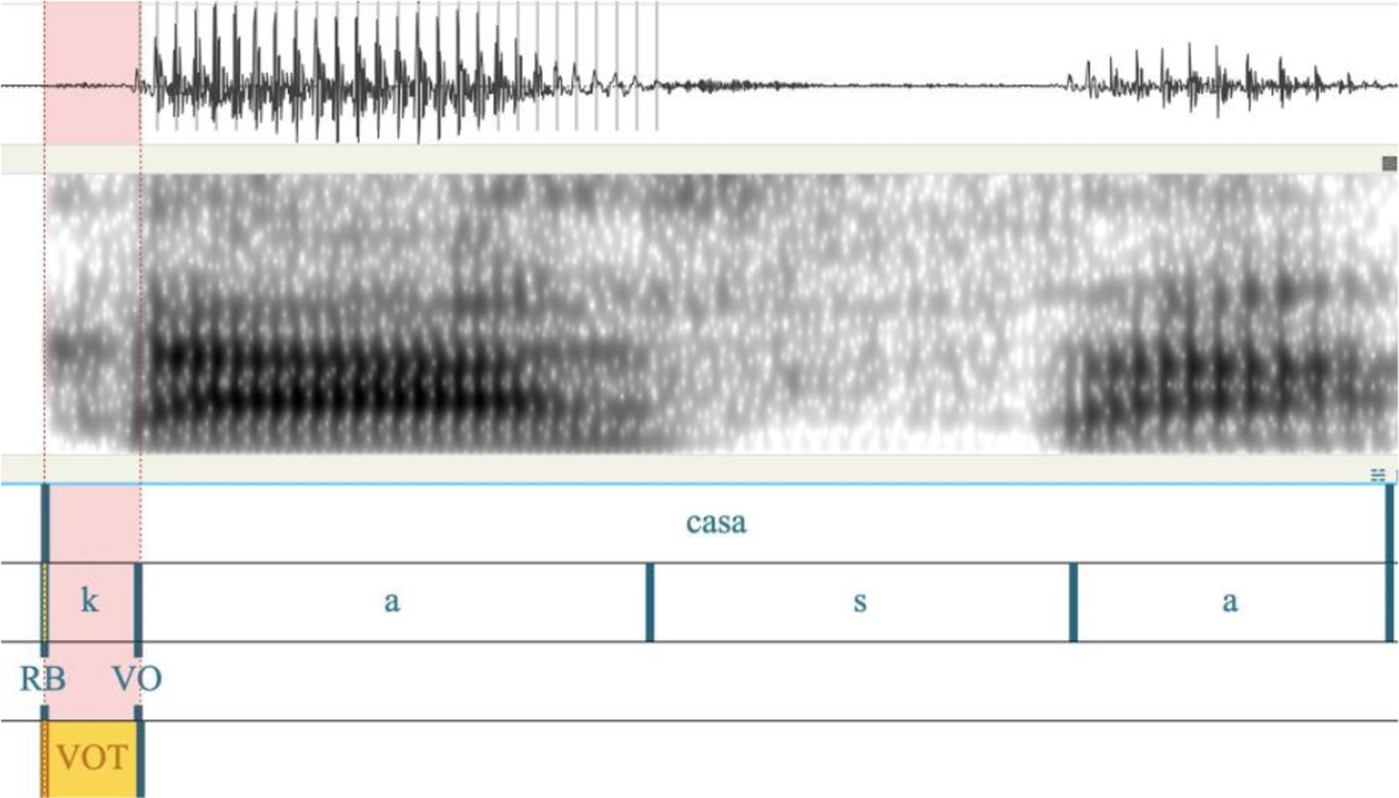
Figure 2. Long description
The acoustic analysis is divided into three vertical sections.
At the top is a waveform showing sound pressure over time. A pink shaded region at the beginning corresponds to the release of the initial consonant.
The middle section is a wideband spectrogram showing frequency distribution. Dark horizontal bands represent formants. The pink shaded region from the top panel continues down through this section, indicating a period of aspiration before the onset of periodic voicing for the vowel.
The bottom section contains three annotation tiers.
- The first tier labels the entire word as casa.
- The second tier segments the word into individual phonemes: k, a, s, and a. The k segment is marked with a vertical line for R B at the release burst and V O at the voice onset.
- The third tier contains a yellow highlighted box labeled V O T, which spans the duration between the R B and V O markers, illustrating the positive voice onset time for the voiceless velar stop.
Negative VOT of voiced stop.
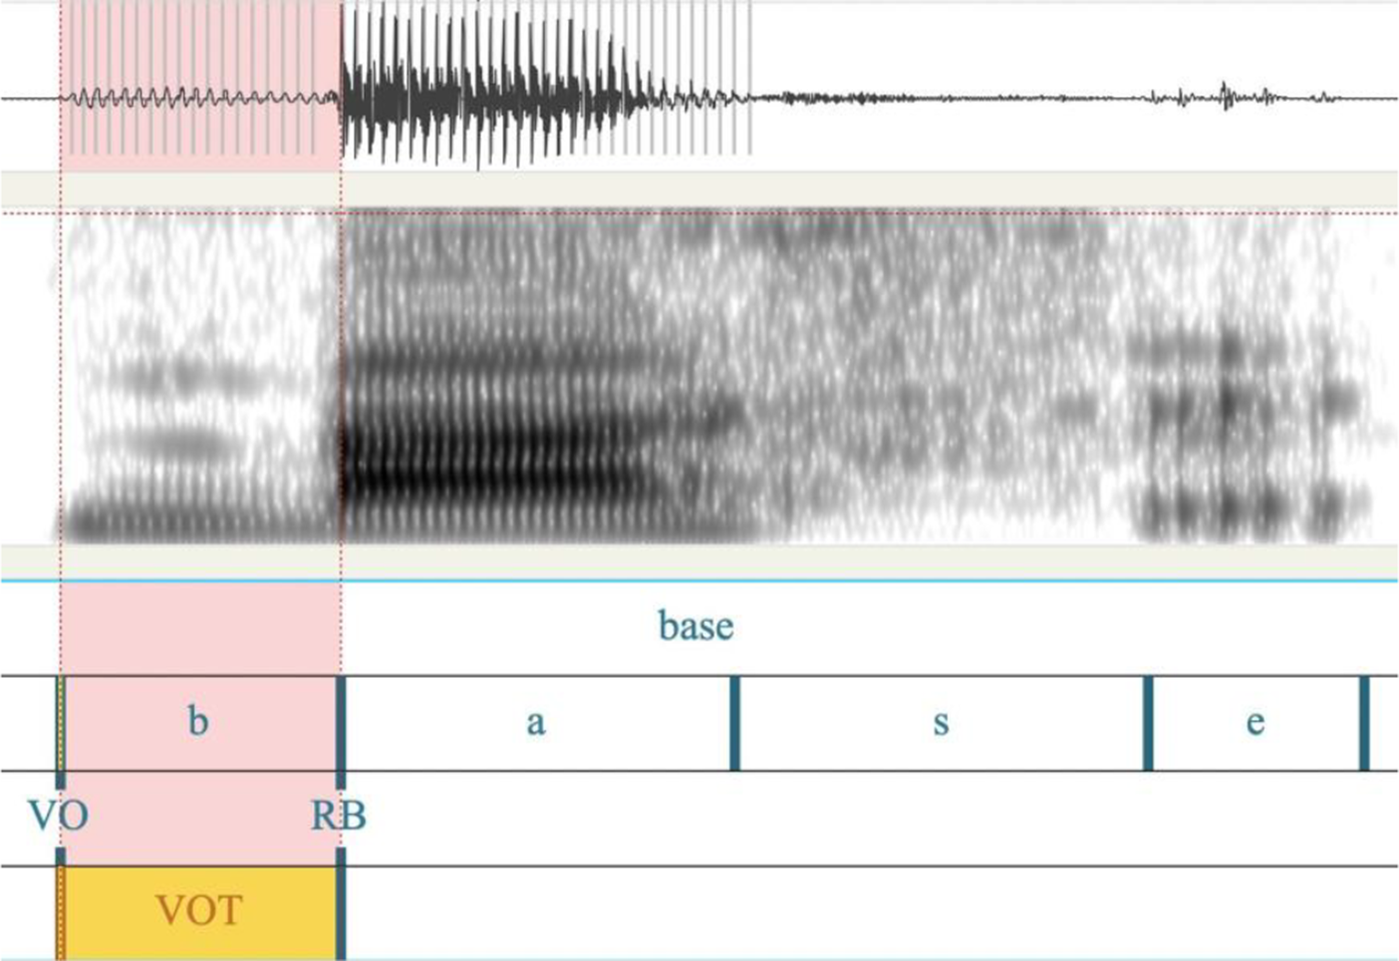
Figure 3. Long description
The display is organized into three vertical sections.
At the top is a waveform showing periodic oscillations. A light red shaded region on the left indicates pre-voicing before the release of the consonant.
The middle section is a spectrogram showing frequency energy over time. Dark horizontal bands represent formants. A vertical red dotted line marks the release burst of the consonant b.
The bottom section contains four annotation tiers.
- The first tier is labeled base.
- The second tier divides the word into segments b, a, s, and e. The segment for b is shaded in light red.
- The third tier marks two specific points: V O at the start of voicing and R B at the release burst.
- The fourth tier contains a yellow box labeled V O T, which spans the duration between V O and R B. Because the voicing V O begins before the release burst R B, this represents a negative Voice Onset Time.
Aptitude tests
Participants’ language aptitude was measured by Version 3 of the LLAMA tests released in 2019 (Meara & Rogers, Reference Meara and Rogers2019; available at https://www.lognostics.co.uk/tools/LLAMA_3/). This version of the tests is completely web based and has made important changes to the original version (Meara, Reference Meara2005; Rogers et al., Reference Rogers, Meara, Rogers, Wen, Skehan and Sparks2023), addressing criticisms concerning its internal validity (Bokander & Bylund, Reference Bokander and Bylund2020; Bokander, Reference Bokander, Wen, Skehan and Sparks2023). Recent analyses conducted by the LLAMA lab based on large-scale tester data have shown that LLAMA v.3 has improved internal consistency and reliability over LLAMA v.1 (Bokander et al., Reference Bokander, Rogers, Meara and Rogers2023). According to Skehan (Reference Skehan, Granena, Jackson and Yilmaz2016), the LLAMA is considered a domain-specific language aptitude test, in which linguistic materials are used to target four language-specific learning abilities: phonetic coding ability (LLAMA E), associative memory (LLAMA B), grammatical inference ability (LLAMA F), and sequence recognition ability (LLAMA D). The tasks use an artificial language in a way that simulates the experience of learning a new, unfamiliar language. The LLAMA tests provide researchers with an L1-neutral and open-source tool that has been increasingly used in SLA studies, generating a pattern of generally consistent and intuitive results (Artieda & Muñoz, Reference Artieda and Muñoz2016; Granena, Reference Granena2013; Granena & Long, Reference Granena and Long2013; Saito, Reference Saito2017, 2019; Saito et al., Reference Saito, Sun and Tierney2019a, Reference Saito, Suzukida and Sun2019b).
Following Saito (Reference Saito2019), subsets LLAMA_E, LLAMA_B, and LLAMA_D were selected. These subsets are believed to highlight different modes of L2 learning: LLAMA_E and LLAMA_B measure language aptitude in an explicit and intentional learning context, giving participants a practice phase to study the new language intentionally before the testing phase, while LLAMA_D taps into more implicit aptitude component, characterized by the absence of practice phase and explicit learning of materials, also believed to require a larger amount of input to take effect (see Saito, Reference Saito2019 for detailed introduction and meta-analysis of Li, Reference Li2015 for a review of cross-test validity). Following Saito’s suggestion, participants completed the subtests online in the following order: LLAMA_D, followed by LLAMA_E, and then LLAMA_B, to ensure that implicit aptitude was measured first to avoid participants’ awareness and attention to the task. The LLAMA aptitude tests are automatically scored once participants complete each subset of the tests online. The maximum score is 20 for each subtest.
In addition to the word list reading task and online LLAMA aptitude tests, participants also completed a language history questionnaire (adapted from Li et al., Reference Li, Zhang, Yu and Zhao2020) at the beginning of the study and a language use survey before each data collection (both can be found in the IRIS database; Zhang, Reference Zhang2026).
Statistical analysis
Linear mixed-effects models were run in R (R Core Team, 2019) and the lme4 package (Bates et al., Reference Bates, Mðchler, Bolker and Walker2015) to fit the growth paths of voiced (vd) and voiceless (vl) VOT, respectively. Prior to model fitting, the data were examined to ensure statistical assumptions were met; visual inspection of Q-Q plots and residual plots confirmed the normality of residuals and the linearity of predictors, with no significant outliers distorting the data. Following the procedure suggested by Singer and Willet (Reference Singer and Willet2003), we first fit unconditional linear growth models without any predictor variables to examine the effect of time, controlling words and Participant ID as random effects. Then, by-participant random slopes for time were added to inspect variabilities in trajectories over time. Lastly, we fit conditional LMM models with Spanish proficiency (EIT score) and language aptitude scores as predictors and words and Participant ID as random effects to examine what variables may affect the initial point and changing slope of VOT.
Results
The goal of the study is to understand L3 phonological development by investigating the developmental paths that learners show in Spanish VOT and the ways in which language aptitude predicts them.
RQ1. What developmental paths do Mandarin-English bilingual learners follow in their Spanish voiced and voiceless VOT over 5 months?
To answer RQ1, and to single out the effect of time, we conducted an unconditional LMM with Time as a fixed effect and Participant ID and Word as random effects on voiced (vd) and voiceless (vl) VOT, respectively. We first present group trends followed by individual analysis that highlights inter-subject variability in VOT trajectories.
Group paths
The LMM model for voiced stops yielded a significant effect of Time (β = −0.05, t = −3.5, p < 0.01, 95% CI [−0.07, −0.02]), indicating that participants’ voiced VOT significantly decreased by 2.24 ms on average between each time point over the period. To further investigate whether participants’ developmental trajectories varied significantly, by-participant random slopes for time were added to the model. ANOVA for model comparison revealed significantly better goodness of fit (p < 0.01), indicating significant variability in individual trajectories over time.
The same procedure was applied to voiceless VOT. Unconditional LMM revealed lack of significant effect for Time (β = 0.00, p = 0.68, 95% CI [−0.01, 0.02]). However, the model was significantly improved by adding a by-participant random slope for Time (p < 0.01), meaning that although Time did not have an overall effect, there was significant variability in individual voiceless VOT trajectories.
Figure 4 graphs interpolation lines that demonstrate group voiceless and voiced VOT paths.
Group path of voiceless (left) and voiced (right) VOT.

Figure 4. Long description
A two-panel line graph. Both panels share a horizontal x-axis labeled time with intervals from 1 to 5 and a vertical y-axis labeled Voice Onset Time with values from negative 200 to 100.
* Left Panel: Voiceless V O T. Most individual gray lines are clustered tightly between 0 and 50. A few outlier lines dip significantly below 0, reaching as low as negative 150 at time point 2. A thick, bold green line representing the group path remains stable and nearly horizontal just above the 0 mark across all five time points.
* Right Panel: Voiced V O T. The individual gray lines show much higher variance compared to the left panel, with many lines fluctuating between 0 and negative 100. The thick, bold green group path line starts at 0 and follows a slightly undulating, nearly horizontal path that stays very close to the 0 mark, ending slightly below 0 at time point 5.
Individual paths
Individual paths demonstrated a great deal of variation in relation to both intercept—their initial VOT values—and slope—the direction and rate of VOT change over time (see Figure 5).
Individual paths of voiceless (vl) and voiced (vd) VOT.

Figure 5. Long description
A grid of thirty line graphs arranged in five rows and six columns. The vertical Y axis represents Voice Onset Time with values from negative 300 to 0. The horizontal X axis represents time with five discrete intervals labeled 1 through 5. A legend at the bottom identifies two line styles: a solid line for v d and a dashed line for v l.
* Panels 1, 4, 5, 9, 10, 11, 12, 13, 14, 20, 21, 22, 24, 25, 27, 28, 31, 32, and 33 show both v d and v l lines clustered near the 0 mark with minimal fluctuation.
* Panels 2, 3, 7, 8, 16, 17, 18, 19, and 23 show significant divergence. In these panels, the dashed v l line remains near 0 while the solid v d line drops sharply into negative values, often reaching between negative 100 and negative 300.
* Panel 16 shows the most extreme drop for both categories, with both lines dipping toward negative 300 at time interval 2 before the v l line recovers more quickly than the v d line.
* Panel 29 shows a unique pattern where both lines fluctuate slightly above and below the 0 mark in a mirrored wave pattern.
It is notable to observe that while the group curve for voiced VOT demonstrated improvement over time, the majority of participants showed flat lines of both voiceless (vl) and voiced (vd) VOT, with the two largely overlapping (Participants 1, 4, 5, 9, 13, 14, 27, 28, 33). These participants demonstrated “neutralization” between voiced and voiceless stop VOTs in Spanish, pronouncing both groups of stops with short-lag VOT, as observed in Chen (Reference Chen2007), Zhang (Reference Zhang2022), and Zhang et al. (Reference Zhang, Morales-Front, Sanz, Brown, Fernández-Berke and Flynn2023). However, other participants showed clear signs of prevoicing development from the beginning or during the course of study. The majority of these “prevoicing” participants (Participants 2, 3, 7, 8, 12, 16, 19, 23) consistently produced negative VOT, but the values of their VOTs showed “W-shaped” patterns marked by ups and downs over time. This demonstrates a destabilization of the emerging voice-lead category.
Further inspection of participants’ profiles demonstrated that an increase in proficiency did not guarantee prevoicing development. For instance, Participant 14 was a third-year student and was in his fifth semester as a Spanish major. He had an EIT proficiency score of 85 out of 120 (70.8%) at Time 1 of the study. His VOT trajectory did not show any development of prevoicing over the course of the study. In contrast, Participant 2 was a first-year student in her first semester of college learning Spanish ab initio . However, since Time 2, her VOT trajectory showed clear prevoicing development. Subsequent analysis of the dynamic roles of language aptitude will shed light on inter- and intra-subject variation exemplified here.
RQ2. To what extent do individual differences in language aptitude predict Mandarin-English bilingual learners’ production of prevoicing?
RQ2 is concerned with the effect of language aptitude components on the development of prevoicing in Spanish voiced stops, and how aptitude components interact with Spanish Proficiency and Time to shape the rate of development. To answer these questions, conditional LMM models were applied to investigate the effect of language aptitude measures—LLAMA D, LLAMA B, and LLAMA E—on participants’ production of voiced VOT, as well as the interaction between each indicator and time.
Statistical profile of the variables
Table 2 summarizes scores from the LLAMA sub-tests (out of 20 for each sub-test) and pre/post test scores from the EIT tests (out of 120); it shows a striking level of interpersonal variability. Data were scaled by subtracting mean and dividing by standard deviation (SD) when entered into statistical analysis.
Descriptive Statistics of Variables.
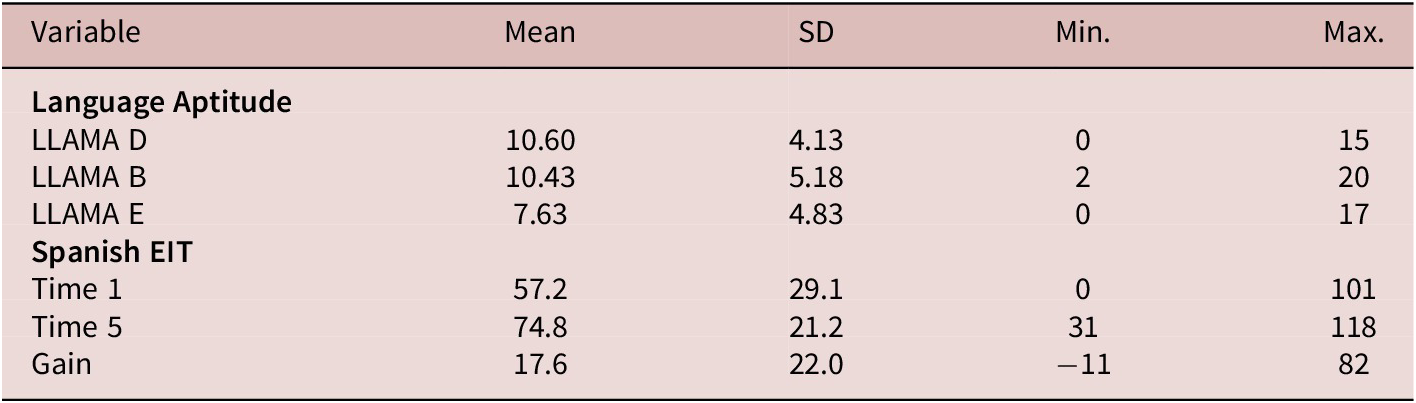
Table 2. Long description
The table is organized into five columns: Variable, Mean, S D, Min. (Minimum), and Max. (Maximum). It is divided into two main categories.
1. Language Aptitude:
* L L A M A D: Mean 10.60, S D 4.13, Min. 0, Max. 15.
* L L A M A B: Mean 10.43, S D 5.18, Min. 2, Max. 20.
* L L A M A E: Mean 7.63, S D 4.83, Min. 0, Max. 17.
2. Spanish E I T:
* Time 1: Mean 57.2, S D 29.1, Min. 0, Max. 101.
* Time 5: Mean 74.8, S D 21.2, Min. 31, Max. 118.
* Gain: Mean 17.6, S D 22.0, Min. minus 11, Max. 82.
A Spanish proficiency gain score was calculated for each participant (SP EIT T5 – SP EIT T1). As displayed in Table 2, participants’ Spanish oral proficiency score increased by an average of 17.6 points from the first to the fifth months, although not all participants improved their Spanish every semester (four 3rd-year learners showed a decrease in their proficiency score).
Correlation Matrix Analysis (see Table 3) was conducted primarily to check for multicollinearity. According to Plonsky and Oswald’s (Reference Plonsky and Oswald2014) field-specific benchmarks for correlation strength in L2 research, correlation coefficients (r) close to .25 should be considered small, .40 medium, and .60 large. Not surprisingly, participants’ EIT score at Time 5 was highly correlated with their score at Time 1 (r = 0.66, p < .01). At the same time, EIT gains showed a large-strength negative correlation with EIT T1 (r = −0.69, p < .01), indicating that participants who had lower proficiency at the beginning of the study demonstrated more improvement during one semester. To avoid multicollinearity issues, we included SP EIT T1 as the sole proficiency measure in the models. The matrix also revealed significant moderate correlations between specific aptitude components and proficiency measures—namely, LLAMA E with EIT gain and LLAMA B with final EIT T5 scores; all of which aligns well with the premise that explicit aptitude facilitates overall language development. It is worth noting that the LLAMA sub-test scores were not significantly correlated with each other, confirming the previous statement that the sub-tests LLAMA D, B, and E each target a different aspect of language aptitude (e.g., Saito, Reference Saito2019).
Correlation Coefficients (Pearson’s r) Among Variables.
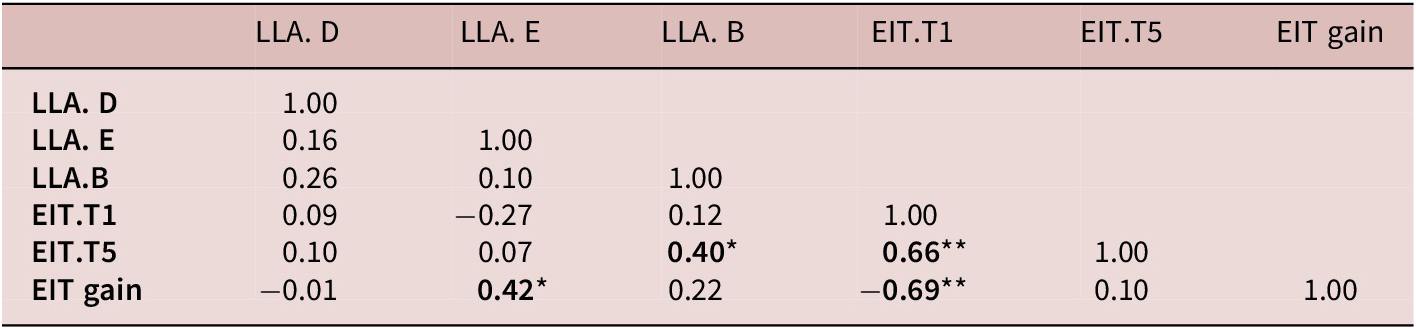
Table 3. Long description
The table presents Pearson r correlation coefficients across six variables. The diagonal values are all 1.00.
Row 1: L L A dot D correlates with itself at 1.00.
Row 2: L L A dot E correlates with L L A dot D at 0.16.
Row 3: L L A dot B correlates with L L A dot D at 0.26 and L L A dot E at 0.10.
Row 4: E I T dot T 1 correlates with L L A dot D at 0.09, L L A dot E at minus 0.27, and L L A dot B at 0.12.
Row 5: E I T dot T 5 correlates with L L A dot D at 0.10, L L A dot E at 0.07, L L A dot B at 0.40 asterisk, and E I T dot T 1 at 0.66 double asterisk.
Row 6: E I T gain correlates with L L A dot D at minus 0.01, L L A dot E at 0.42 asterisk, L L A dot B at 0.22, E I T dot T 1 at minus 0.69 double asterisk, and E I T dot T 5 at 0.10.
Model selection was conducted using the Anova() function in R in an iterative process until the minimally adequate model (i.e., with the least number of predictors and with the best goodness of fit) was selected. The final selected model was as follows:
Model <- lmer (VOT ~ time +
LLAMA_e + LLAMA_b + LLAMA_d + SPN_EIT_t1 + # predictors
time*LLAMA_d + time*SPN_EIT_t1 + # interactions
(1 | id) + # by-participant random intercepts
(1 | word), # by-word random intercepts
data = df.vd)
RQ2a. Which language aptitude indicator(s) predicts accuracy in prevoicing production?
LMM with vd VOT as response (see Table 4) yielded a significant effect for Time (β = −0.05, p < .001, 95% CI [−0.07, −0.02]), indicating that participants’ overall voiced VOT progressively and significantly decreased toward negative values over time. LLAMA E emerged as a significant main effect predictor for voiced VOT (β = −0.35, p < 0.01, 95% CI [−0.61, −0.09]). Because the iterative model selection process eliminated the non-significant interaction between LLAMA E and Time, this main effect indicates an overall, consistent influence across the entire 5-month period. Controlling for proficiency, participants with stronger phonetic coding ability (PCA), as operationalized by higher LLAMA E scores, produced significantly lower overall voiced VOT across all data collection points (Figure 6). LLAMA B scores were associated with higher VOT (β = 0.35, p < 0.01, 95% CI [0.10, 0.60]) (Figure 7). No main effect was isolated for sequence recognition ability (LLAMA D).
RQ2b. Which language aptitude indicator(s) predicts the rate of development in prevoicing production?
Summary of Significant Parameters in the LMM of the Overall vd VOT Data.
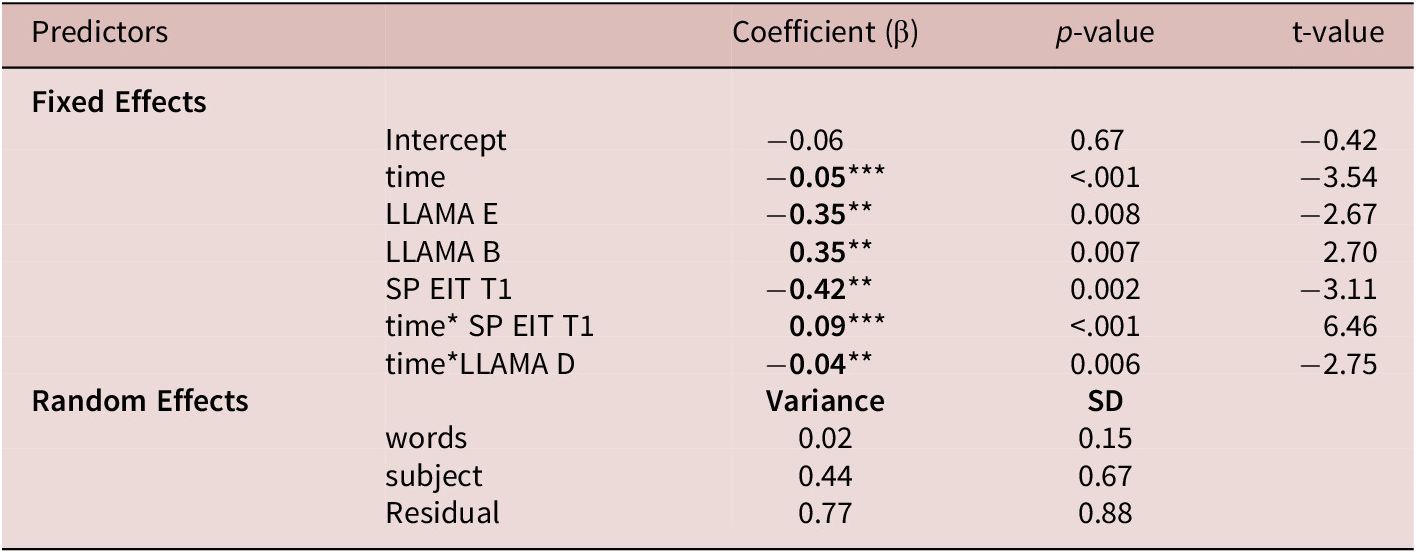
Table 4. Long description
The table is organized into five columns: Predictors, an unlabeled sub-category column, Coefficient beta, p-value, and t-value.
Fixed Effects section:
- Intercept: Coefficient negative 0.06, p-value 0.67, t-value negative 0.42.
- time: Coefficient negative 0.05 triple asterisk, p-value less than .001, t-value negative 3.54.
- L L A M A E: Coefficient negative 0.35 double asterisk, p-value 0.008, t-value negative 2.67.
- L L A M A B: Coefficient 0.35 double asterisk, p-value 0.007, t-value 2.70.
- S P E I T T 1: Coefficient negative 0.42 double asterisk, p-value 0.002, t-value negative 3.11.
- time asterisk S P E I T T 1: Coefficient 0.09 triple asterisk, p-value less than .001, t-value 6.46.
- time asterisk L L A M A D: Coefficient negative 0.04 double asterisk, p-value 0.006, t-value negative 2.75.
Random Effects section (columns change to Variance and S D):
- words: Variance 0.02, S D 0.15.
- subject: Variance 0.44, S D 0.67.
- Residual: Variance 0.77, S D 0.88.
Note: Significance levels are indicated by asterisks where triple asterisk denotes p less than .001 and double asterisk denotes p less than .01.
Note: p < .1; p < .05; p < .01**; p < .001***
Predicted voice onset time (VOT) as a function of LLAMA E scores based on the linear mixed-effects model. Shaded areas represent 95% confidence intervals.

Figure 6. Long description
The horizontal x-axis is labeled L L A M A underscore e with numerical markers at 0, 5, 10, and 15. The vertical y-axis is labeled V O T with numerical markers at negative 50, negative 25, 0, and 25. A solid red regression line begins at a V O T of approximately 22 when L L A M A underscore e is 0 and follows a steady downward linear trend, ending at a V O T of approximately negative 38 when L L A M A underscore e is 17. A light red shaded area representing the 95 percent confidence interval surrounds the line. This shaded region is widest at the far left and far right ends of the x-axis and narrowest near the center around an L L A M A underscore e score of 10.
Predicted voice onset time (VOT) as a function of LLAMA B scores based on the linear mixed-effects model. Shaded areas represent 95% confidence intervals.

Against our prediction, none of the aptitude components interacted significantly with proficiency. However, sequence recognition ability (SRA), measured by LLAMA D test, showed a significant interaction with Time (β = −0.04, p < 0.01, 95% CI [−0.06, −0.01]) (Figure 8). Participants with stronger SRA showed accelerated decrease of voiced VOT over time, evidencing faster development of prevoicing over the 5 months of study. These results mirror previous research that highlighted the link between PCA and segment production accuracy at the macro-level (Granena, Reference Granena2013; Saito, Reference Saito2017, 2019; Saito et al., Reference Saito, Sun and Tierney2019a) and corroborate findings suggesting that SRA exerts its effect with continuous language exposure over time (Granena, Reference Granena2020; Saito et al., Reference Saito, Suzukida and Sun2019b).
Predicted values from the linear mixed-effects model illustrating the interaction between Time and LLAMA D. Lines represent predicted trajectories for learners with low (−1 SD), mean, and high (+1 SD) LLAMA D scores. Shaded areas indicate 95% confidence intervals.

Figure 8. Long description
The graph is titled Predicted values of V O T. The horizontal x-axis is labeled time and ranges from 1 to 5. The vertical y-axis is labeled V O T and ranges from negative 25 to 50. Two primary linear trajectories are shown.
* The first line, representing a L L A M A underscore d score of 0, is red and shows a gradual linear increase starting at approximately 5 on the y-axis at time 1 and rising to approximately 15 at time 5. It is surrounded by a wide light-red shaded area representing the 95 percent confidence interval.
* The second line, representing a L L A M A underscore d score of 15, is blue and shows a linear decrease starting at approximately negative 3 at time 1 and dropping to approximately negative 20 at time 5. It is surrounded by a narrower light-blue shaded area representing its 95 percent confidence interval.
A legend on the right side identifies the red line as 0 and the blue line as 15 under the heading L L A M A underscore d.
Additionally, Spanish oral proficiency operationalized as EIT score at Time 1 showed a significant effect on Spanish voiced VOT (β = −0.42, p < 0.01, 95% CI [−0.69, −0.16]). As expected, participants at higher proficiency level produced significantly lower voiced VOT, suggesting more target-like prevoiced tokens with negative VOT values. Proficiency also interacted with time to predict the slope of change. The significant interaction between Time and EIT score (β = 0.09, p <.001, 95% CI [0.06, 0.11]) showed that participants with higher initial Spanish proficiency had a slower rate of change over time, while those with lower proficiency demonstrated a more prominent change.
Discussion
This study aims to investigate, firstly, the VOT developmental paths of Spanish voiced (vd) and voiceless (vl) stops produced by Mandarin-English sequential bilingual learners; secondly, how language aptitude as an individual difference variable may influence the development of prevoicing in voiced stops, a difficult feature for this learner population.
RQ1. What developmental paths do Mandarin-English bilingual learners follow in their Spanish voiced and voiceless VOT over 5 months?
At the group level, a mixed-effect model was applied to vd and vl VOTs separately to examine the effect of Time and showed distinct developmental paths for vd and vl stops as predicted. Specifically, as time progressed for 5 months, participants’ mean vd VOT decreased significantly from 0.37 ms to −8.69 ms, showing improvement toward target-like prevoicing in Spanish. In contrast, vl VOT showed a flat pattern with target-like short-lag VOT sustained from Time 1 to Time 5. In fact, none of the participants produced /p, t, k/ with long-lag VOT, including the four ab initio learners (Participants 2, 16, 21, and 29).
The target-like short-lag VOT in vl stops confirms that Chinese learners map Spanish /p, t, k/ to Mandarin unaspirated /p, t, k/ from initial stages of learning. This differs from the pattern observed in English-speaking learners of Spanish, who typically map Spanish /p,t, k/ onto English aspirated stops [ph, th, kh], resulting in the production of relatively long VOT values. Such distinction might be a consequence of an enhanced perceptual distance because VOTs in aspirated stops are longer in Mandarin than in English (Chen, Reference Chen2007). Another factor is the orthographic system. Although in word-initial positions, Spanish /p, t, k/ are perceptually more similar to English /b, d, g/, orthographic representations may lead English speakers to link the unaspirated Spanish “p” to aspirated English “p”, while this scenario is less likely to occur with L1 Mandarin learners given that Chinese’s writing system is logographic. Additionally, explicit instructions about phonetic systems widely present in language curricula in China may contribute to higher awareness of the long-short VOT distinction (Zhang et al., Reference Zhang, Morales-Front, Sanz, Brown, Fernández-Berke and Flynn2023).
The vd group path shows a decreasing trend but the mean values are far from the target values (−60 to −100 ms). At the same time, progress seems to be mostly driven by a few participants who developed prevoicing when the majority did not. Compared to the unaspirated-aspirated distinction that exists in Mandarin, the prevoiced-unaspirated distinction in Spanish is less salient, making the Spanish voiced and voiceless VOT contrast more difficult to discern for L1 Mandarin learners. Previous studies on English-speaking learners of Spanish also found the development of VOT in voiced stops to be delayed. Learners are more successful in adjusting phonetic details (i.e., reducing long VOTs in the voiceless stops) than creating a new negative VOT category (Nagle et al., Reference Nagle, Morales-Front, Moorman, Sanz, Velliaris and Coleman-George2016; Zampini, Reference Zampini1998).
At the individual level, there was significant variability in trajectories over time. Individual plots in Figure 5 revealed three distinct patterns according to trends of change and categorical assimilation. We hypothesize three scenarios to account for these patterns:
-
1. Flat line, i.e., short positive VOT values in both vl and vd stops with no development over time. This pattern is characteristic of 50% of the participants across proficiency levels. We hypothesize that they map both voiced and voiceless stops onto the unaspirated stop category in Mandarin, consistent with single category or category goodness assimilation from the PAM-L2 model (Best & Tyler, Reference Best, Tyler, Flege, Bohn and Munro2007). This assimilation in perception blocks the formation of a negative VOT category in their mental representation and causes equivalent assimilation in production (SLM; Flege, Reference Flege1995). As noted earlier, this pattern spans across experience levels; for example, Participant 14, despite being an advanced 3rd-year student with high overall Spanish proficiency, demonstrated complete neutralization. This suggests that without the necessary perceptual shifts or aptitude-driven interventions, early-stage category assimilation can fossilize regardless of accumulated classroom experience. Figure 9 illustrates two examples of this pattern from Participants 14 and 32.
-
2. “W” shape development, i.e., vd VOTs demonstrate great destabilization in the negative VOT domain and vl VOTs tend to partially overlap with vd VOT showing similar prevoicing (Participants 2, 3, 16, 18, 19). We hypothesize that two categories, a vd and a vl stop category, were formed in their mental representation, but their level of motor articulatory control was not advanced enough to consistently differentiate vd and vl stops with prevoicing and short-lag VOT, respectively, causing them to produce comparable prevoicing in both categories. Articulatory control can improve with time, as observed in Participant 16, whose vl and vd VOT gradually drove apart from each other from Time 2 to Time 5; the vl VOT increased to reach positive values, while the vd VOT remained negative. This pattern illustrates the dynamic process of category formation. Examining individual profiles reveals that experience plays varied roles here. For instance, Participant 2, an ab initio learner, began exhibiting this destabilized prevoicing as early as her second month of learning, capturing the genesis of the phonetic category. Conversely, Participant 18’s presence in this group may be influenced by prior linguistic experience, as she reported minimal but existent childhood exposure to the Wu dialect, which preserves voicing contrasts. Figure 10 illustrates two examples of this pattern from Participants 16 and 19.
-
3. Two-category development, i.e., vd and vl VOT lines do not overlap and follow distinct trajectories (Participants 7, 8, 10, 12, 17). These participants appear to be able to clearly differentiate vd and vl VOTs producing target-like prevoicing for vd stops and short-lag VOTs for vl stops. It is likely that in perception, they assimilate the vl VOTs to the unaspirated stops in Mandarin, but could recognize a difference in the vd stops and created a new negative VOT category that is specific to Spanish. This new category coupled with strong articulatory control helps them transduce acoustic information in the input into articulatory gestures in production. Auditory processing ability—a set of perceptual, cognitive, and motoric skills including the perception of fine-grained acoustic detail, the selective attention to relevant dimensions, and the integration of auditory input into motor action (e.g., Saito & Tierney, Reference Saito and Tierney2024; Saito et al., Reference Saito, Kachlicka, Suzukida, Mora-Plaza, Ruan and Tierney2024)—may offer a domain-general explanation for the aptitude-related differences underlying two-category versus W-shaped developmental trajectories. When examining the role of experience, it is interesting to note that this successful pattern includes learners with immersive study abroad experience. Participant 17, who consistently produced target-like prevoicing from Time 1, had previously spent ten months studying in Spain. Similarly, Participant 10 was studying abroad in Spain for the duration of the data collection. This strongly indicates that for some learners, the negative VOT category was indeed developed through prior, intensive immersive experience. Figure 11 illustrates two examples of this pattern from Participants 8 and 17.
RQ2. To what extent do individual differences in language aptitude predict Mandarin-English bilingual learners’ production of prevoicing?
RQ2a. What language aptitude indicator(s) predicts the accuracy in prevoicing production?
Examples of flat-line pattern from Participants 14 (left) and 32 (right).

Figure 9. Long description
The image consists of two side-by-side line graphs. Both graphs share identical axes. The x-axis is labeled time with intervals from 1 to 5. The y-axis is labeled Voice Onset Time with a scale from negative 100 to 100 in increments of 50. A legend at the bottom of each graph identifies a solid line as v d and a dashed line as v l.
* Participant 14 (Left Panel): Both the v d and v l lines remain nearly horizontal, clustered closely together between the 0 and 50 marks on the y-axis. The v d line shows a slight dip at time 2 and a slight peak at time 3, while the v l line remains relatively stable with a very slight upward trend at time 5.
* Participant 32 (Right Panel): Similar to the first graph, both lines are flat and positioned just above the 0 mark. The v d and v l lines are almost overlapping from time 1 to time 3. After time 4, both lines show a slight downward trend, converging near the 15 mark at time 5.
Examples of “W”-shape pattern from Participants 16 (left) and 19 (right).

Figure 10. Long description
Two side-by-side line graphs with identical axes. The y-axis represents Voice Onset Time ranging from negative 200 to 100. The x-axis represents time points 1 through 5. A legend below each graph identifies a solid line as v d and a dotted line as v l.
In the left panel for Participant 16, both lines start near 0 at time 1 and drop sharply to approximately negative 130 at time 2. From time 2 to 5, the v l dotted line rises steadily back toward 0. The v d solid line remains lower, fluctuating between negative 110 and negative 120 before ending at negative 70.
In the right panel for Participant 19, both lines exhibit a W-shaped pattern. The v l dotted line stays between 0 and negative 50. The v d solid line follows a parallel path but is positioned lower, fluctuating between negative 50 and negative 100. Both lines show peaks at time 1, 3, and 5, with troughs at time 2 and 4.
Examples of two category development from Participants 8 (left) and 17 (right).

Figure 11. Long description
The figure consists of two side-by-side line graphs. Both graphs share the same axes: the x-axis is labeled time with intervals from 1 to 5, and the y-axis is labeled Voice Onset Time with a scale from negative 200 to 100. A legend at the bottom of each panel identifies a solid line as v d and a dotted line as v l.
In the left panel for Participant 8:
* The v l dotted line remains stable and nearly horizontal at a Voice Onset Time of approximately 25 across all five time points.
* The v d solid line fluctuates at lower values, starting near negative 75 at time 1, dipping to negative 90 at time 2, rising to negative 70 at time 3, and settling near negative 85 for times 4 and 5.
In the right panel for Participant 17:
* The v l dotted line shows a very slight downward trend, starting just above 20 at time 1 and ending just below 20 at time 5.
* The v d solid line starts at negative 50 at time 1, rises slightly to negative 40 where it plateaus through time 4, and then drops to approximately negative 60 at time 5.
To examine the roles of language aptitude components on the accuracy of prevoicing, mixed effect models were applied with voiced VOT as continuous dependent variables. Results suggest that PCA emerged as a predictor for lower VOT values and more target-like prevoicing. In contrast, AM was linked to higher vd VOT values and less target-like prevoicing. Additionally, SRA—an implicit component of language aptitude— mediated prevoicing development: higher SRA predicted more rapid growth in the production of prevoicing.
PCA is a component of language aptitude that is linked to analyzing incoming input and that maps sounds to corresponding symbols (Skehan, Reference Skehan, Granena, Jackson and Yilmaz2016). Previous studies have found PCA to correlate with foreign-accentedness (Granena & Long, Reference Granena and Long2013; Hu et al., Reference Hu, Ackermann, Martin, Erb, Winkler and Reiterer2013), and is significantly associated with segmental measure of pronunciation rating (Saito, Reference Saito2017, 2019). In a classroom learning setting, stronger phonetic coding ability can help learners to better notice and discern phonetic features and differences. Thus, those with stronger PCA tend to be more likely to notice prevoicing as characterized by a period of voicing during the consonant closure, and map this feature to the vd stop category in Spanish. While the relationship between accurate perception and accurate production remains a subject of ongoing discussion (see Flege & Bohn, Reference Flege, Bohn and Wayland2021; Nagle, Reference Nagle2018; Nagle & Baese-Berk, Reference Nagle and Baese-Berk2022), our results suggest that stronger ability in coding and analyzing phonetic features in the input facilitates more accurate production of VOT.
Our results also indicate AM to associate with higher VOT values and less prevoicing. AM is believed to be linked to the short-time store component of working memory (Li, Reference Li2016) and phonological short-term memory (Saito, Reference Saito2019). Previous studies found that AM also contributes to the learning of easy syntactic structure (past progressive) in oral production (Yalçın & Spada, Reference Yalçın and Spada2016) as well as to fluency, i.e., articulation rate in spontaneous speech, and complexity, i.e., clause-to-AS-unit ratio (Saito, Reference Saito2017). That is to say, in spontaneous speech (i.e., picture naming task), a speaker with stronger rote and associative memory may be able to store and retrieve linguistic information, i.e., vocabulary and syntactic structure, at a higher rate, which permits more efficient processing of input and more fluent and complex oral production. However, in the context of L3 phonological acquisition, this robust storage capacity may actually entrench non-target phonetic categories from previously learned languages. According to PAM-L2, L1 Mandarin learners typically assimilate novel Spanish voiced stops to their native unaspirated stops, which are characterized by short-lag positive VOT. We hypothesize that learners with higher AM may more rapidly stabilize and routinize this non-target sound-to-category mapping. Thus, the positive main effect of LLAMA B—where stronger memory predicts higher, positive VOTs—may reflect the successful, albeit inaccurate, establishment of an L1-transferred phonetic category. Nevertheless, the current dataset limits our ability to definitively test this mechanism. Future research incorporating perception tasks is necessary to confirm whether high associative memory directly correlates with the stabilization of non-target interlanguage representations during both initial and later learning stages. However, it appears that the development of production of a specific segmental feature such as prevoicing in the voiced Spanish stops seems to rely not only on storage functions, but also specific phonological analytical skills that may allow learners to capture the phonetic feature in the input, and further match it to the corresponding phonemes. Such ability seems to be more in line with the PCA measured by LLAMA E.
In interpreting the negative association of AM to prevoicing, it is also imperative to consider the nature of the task and target items in this study. During the word reading task, participants focused on producing the sounds corresponding to the graphic letters they saw on the screen. While this production process would involve PCA, i.e., processing graphic input and matching the forms to their corresponding sounds, AM may be less relevant since little information is being stored or retrieved in and out of the short-term memory system. With these considerations, we cautiously interpret the observed association as potentially reflecting task-related limitations on the role of AM in this specific production context.
RQ2b. What language aptitude indicator(s) predicts the rate of development in prevoicing production?
Skehan (Reference Skehan, Granena, Jackson and Yilmaz2016) proposes that in the first half of the acquisition process, input processing, noticing, and pattern identification are likely linked to working memory capacity and PCA. A longer working memory span may allow learners to retain more input for phonological analysis, while PCA supports learners in identifying phonetic features—such as prevoicing—and mapping them to appropriate phonological categories. In contrast, the later stages of acquisition, including pattern extension, automatization, and lexicalization, are thought to engage implicit learning abilities, such as SRA, though AM may also contribute to automatization in speech development (Saito, Reference Saito2017).
Although this theoretical framework implies a growing influence of SRA and AM with increasing proficiency, the present findings did not reveal a statistically significant interaction between these aptitude components and proficiency level. One possible explanation is that the acquisition of prevoicing among L1 Mandarin speakers may be constrained by fossilization processes in segmental development. Due to perceptual assimilation and/or articulatory limitations, some learners may be less likely to revise their phonetic categories or articulatory routines even as their general L2 proficiency increases. This interpretation is supported by the individual learner trajectories (see Figure 5), which suggest variability in prevoicing development despite overall group-level improvement. That is, while mean VOT values decreased with proficiency, individual-level data show that increased oral proficiency does not uniformly predict segmental refinement such as VOT.
In this context, the global effect of PCA appears to play an important role in predicting overall continued development, which may help explain why certain learners successfully avoid plateauing in prevoicing production. Extrapolating from these overarching statistical trends, we hypothesize that learners with stronger phonetic coding skills may be better equipped to analyze fine-grained acoustic input and establish or maintain the distinct phonetic categories observed in the two-category developmental pattern.
At the same time, across the entire sample, participants with higher SRA scores demonstrated more rapid progress towards target-like VOT values over time, as indicated by a steeper decline in their overall voiced VOT trajectories. While our current statistical model evaluates the group as a whole, this overarching trend suggests a compelling hypothesis for the individual trajectories identified in RQ1: for learners who were not blocked by perceptual assimilation and who already showed some evidence of prevoicing (e.g., the “W-shape” or “two-category” patterns), stronger SRA may have supported more efficient proceduralization and refinement of articulatory patterns. This finding aligns with results from a pioneer longitudinal study by Saito et al. (Reference Saito, Suzukida and Sun2019b), which found that while in the earlier instructional phases, explicit aptitude (PCA and AM) helped students enhance their fluency and prosody, it was incidental aptitude (SRA measured by LLAMA D) that significantly predicted the extent to which learners continued to improve their segmental accuracy and ultimately attain advanced-level comprehensibility.
Importantly, “stage of learning” in the present study can be understood along two dimensions: macro-level proficiency differences across learners and micro-level developmental change over time. On the one hand, the sample included learners at different proficiency and placement levels, representing both earlier and later stages of acquisition. On the other hand, all participants continued to accumulate language exposure over the 5-month study period. The significant SRA × Time interaction, together with the absence of an SRA × proficiency interaction found in this study, suggests that the role of SRA became increasingly important with continued language exposure regardless of learners’ initial proficiency levels. This finding appears to support the micro-level interpretation of Skehan’s (Reference Skehan, Granena, Jackson and Yilmaz2016) acquisition-aptitude model.
It is worth noting that previous studies (e.g., Saito, Reference Saito2017; Saito, Reference Saito2019) did not find any link between implicit aptitude and phonological development, probably due to their cross-sectional design. Our findings tentatively support the hypothesis that the influence of SRA is likely to be developmentally mediated—that is, its impact may be more observable with increased language experience. This is in line with findings from previous studies on morphosyntactic acquisition, where implicit language aptitudes have been found to exert greater influence at later stages of acquisition (e.g., Abrahamsson & Hyltenstam, Reference Abrahamsson and Hyltenstam2008; Granena, Reference Granena2013, Reference Granena2020; Serafini & Sanz, Reference Serafini and Sanz2016).
Nonetheless, these findings should be treated with caution, considering that the reliability of LLAMA v.3, although improved from previous versions, is still subject to further examination (Bokander et al., Reference Bokander, Rogers, Meara and Rogers2023), and additional longitudinal studies are needed to clarify the developmental trajectory of aptitude effects on L2 segmental learning. It is also important to note that although the LMM model controls other predictors when analyzing effects of the aptitude indicators, an array of other confounding factors might be at play to shape multilingual learners’ phonetic acquisition, including previous study abroad experience in Spanish-speaking countries and exposure to Chinese dialects that preserve voicing contrasts. For instance, Participant 18’s experience with the voicing Wu dialect from childhood and family, though reported to be minimal, might exert an influence on her development of prevoicing during the study.
Conclusion and future directions
The study explored the shape of 5-month developmental trajectories in L3 Spanish VOT among Mandarin-English bilinguals, with results that suggest learners generally improve on VOT in parallel with proficiency, with high levels of individual variation driven by individual difference factors. Specifically, it was clear that individual plots could be grouped according to common patterns showing how learners at different stages can share neutralization, destabilization, or development in their VOT production. Part of this variation can be explained by the facilitative role of phonetic coding ability in the development of prevoicing production, as well as the role of sequence recognition ability that facilitates a more rapid development of prevoicing as the learner’s experience and exposure increase, particularly once a certain perceptual or articulatory threshold has been crossed.
Of note is the sizable proportion of participants who showed little or no change in VOT over the 5-month period. Rather than indicating a methodological limitation, this plateau may reflect meaningful learner-internal constraints—such as perceptual assimilation patterns or articulatory routinization—that merit further investigation. The findings highlight the need to better understand the conditions under which prevoicing development does or does not occur, and how this interacts with both aptitude and developmental stage.
Future research can benefit from following individual learners over a longer period to scrutinize their developmental trajectories more comprehensively, including the investigation of perception and the link between perception and production. It remains unclear whether perceptual assimilation results in fossilization in production, and the locus of influence of the language aptitude component discussed—whether it is perception, production, or both. Replication studies in immersive contexts, such as study abroad programs, could also provide valuable insights into how language aptitude interacts with contextual factors, thereby offering a more holistic understanding of the effects of explicit and implicit language aptitude components on segmental development in distinct learning contexts. Future research should also consider assessing auditory processing abilities—such as sensitivity to pitch, rhythm, and temporal structure in non-linguistic sounds—as these domain-general skills may help explain individual differences in the perception–production link and phonetic category development (Saito & Tierney, Reference Saito and Tierney2024).
In spite of its limitations—sample size and uneven sample distribution across proficiency levels, which may have constrained the scope of the proficiency-related analyses—as one of the first time-series studies in L3 phonological development, the study unveiled individual development paths and contributed to our understanding of how these paths are influenced by language aptitude components. Crucially, while three distinct developmental trajectories were identified qualitatively, the sample size constraints of the current study precluded the ability to run separate inferential statistical models for each subgroup. Future research with larger cohorts should investigate whether specific aptitude components interact differently depending on the learner’s distinct developmental trajectory.
Author Note
Linxi Zhang Georgetown University, Washington, DC, USA.
Alfonso Morales-Front Georgetown University, Washington, DC, USA.
Cristina Sanz Georgetown University, Washington, DC, USA.
Declaration of Competing interest
The authors declare that they have no known competing financial interests or personal relationships that could have appeared to influence the work reported in this paper.
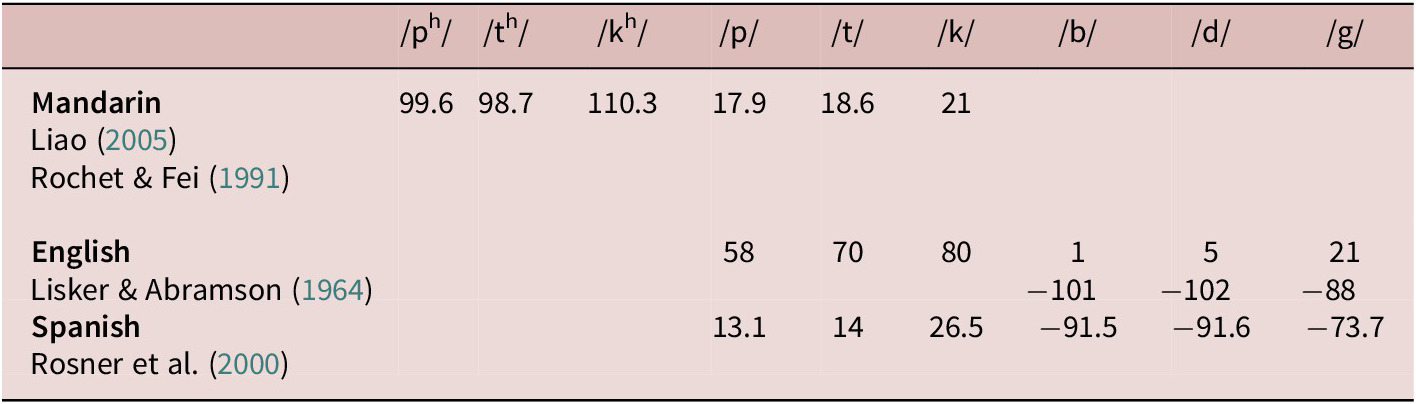
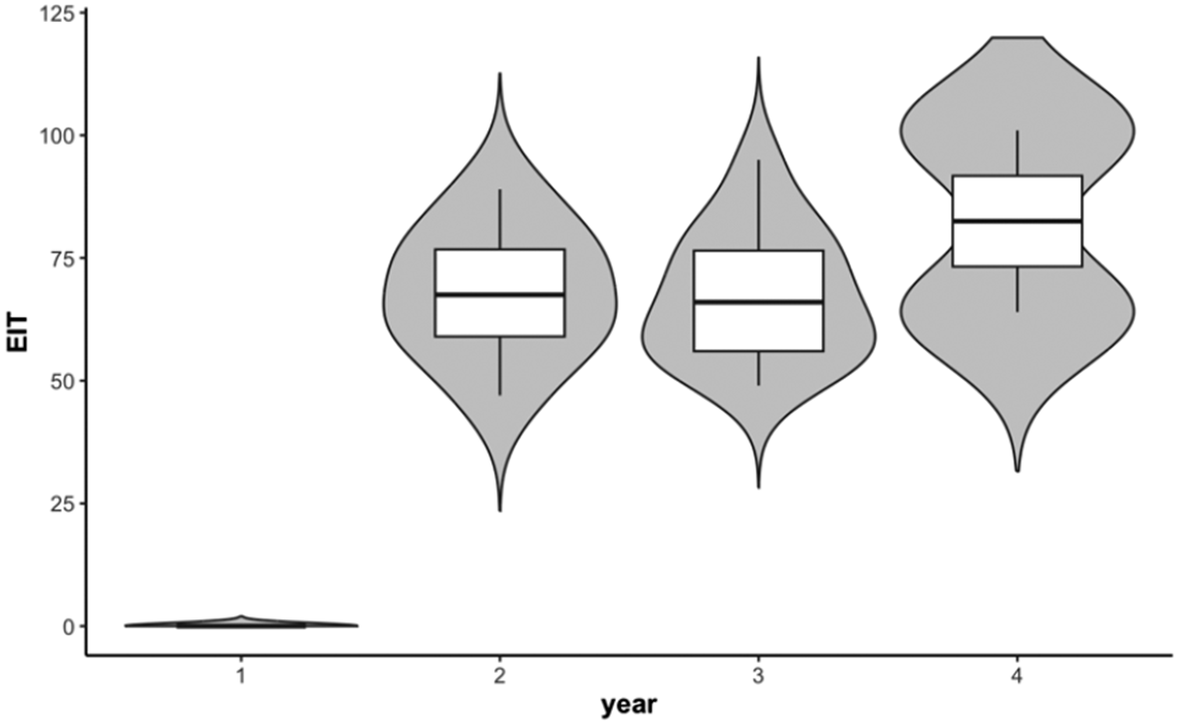
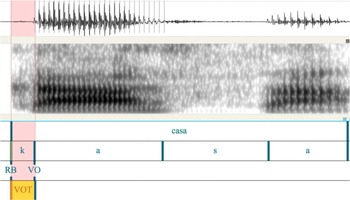
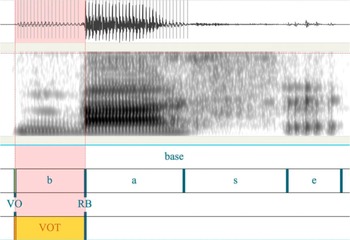
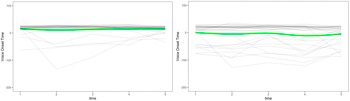

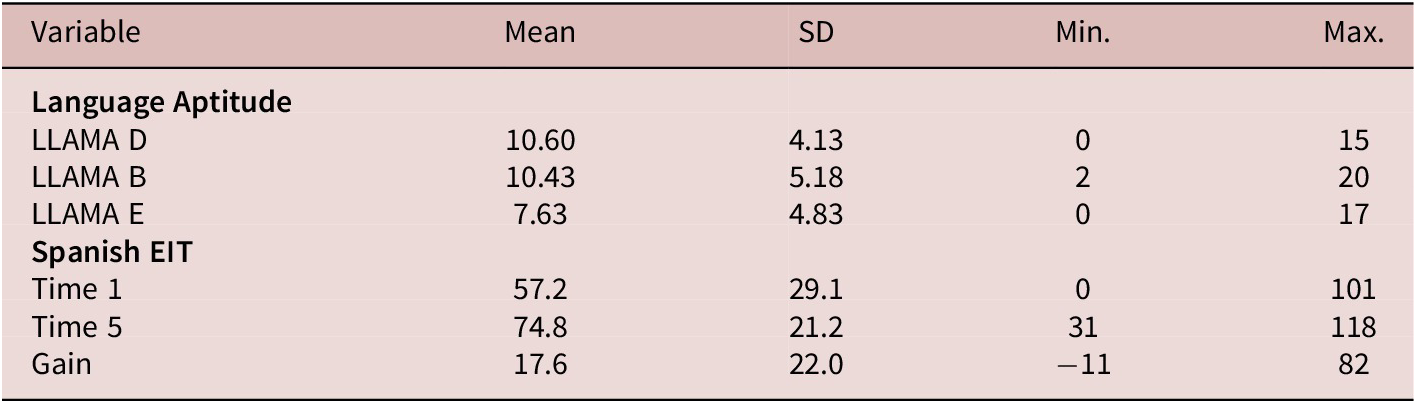
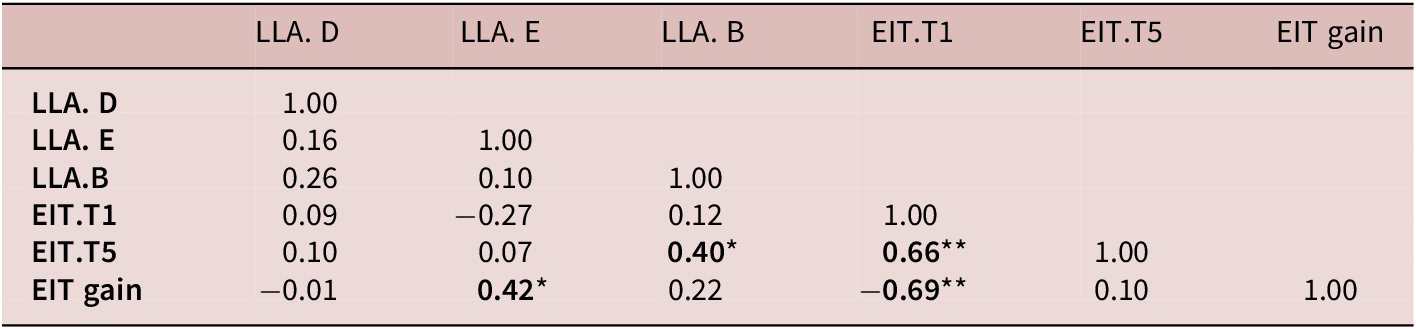
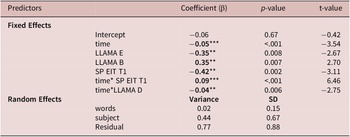
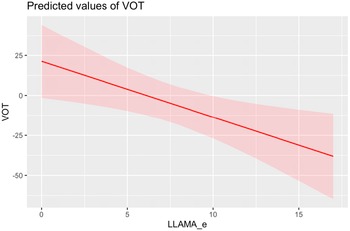
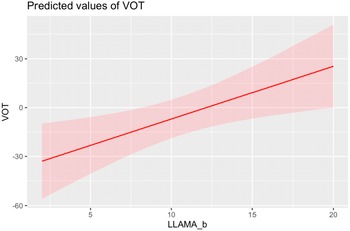
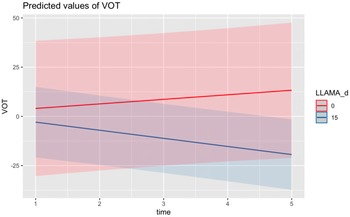

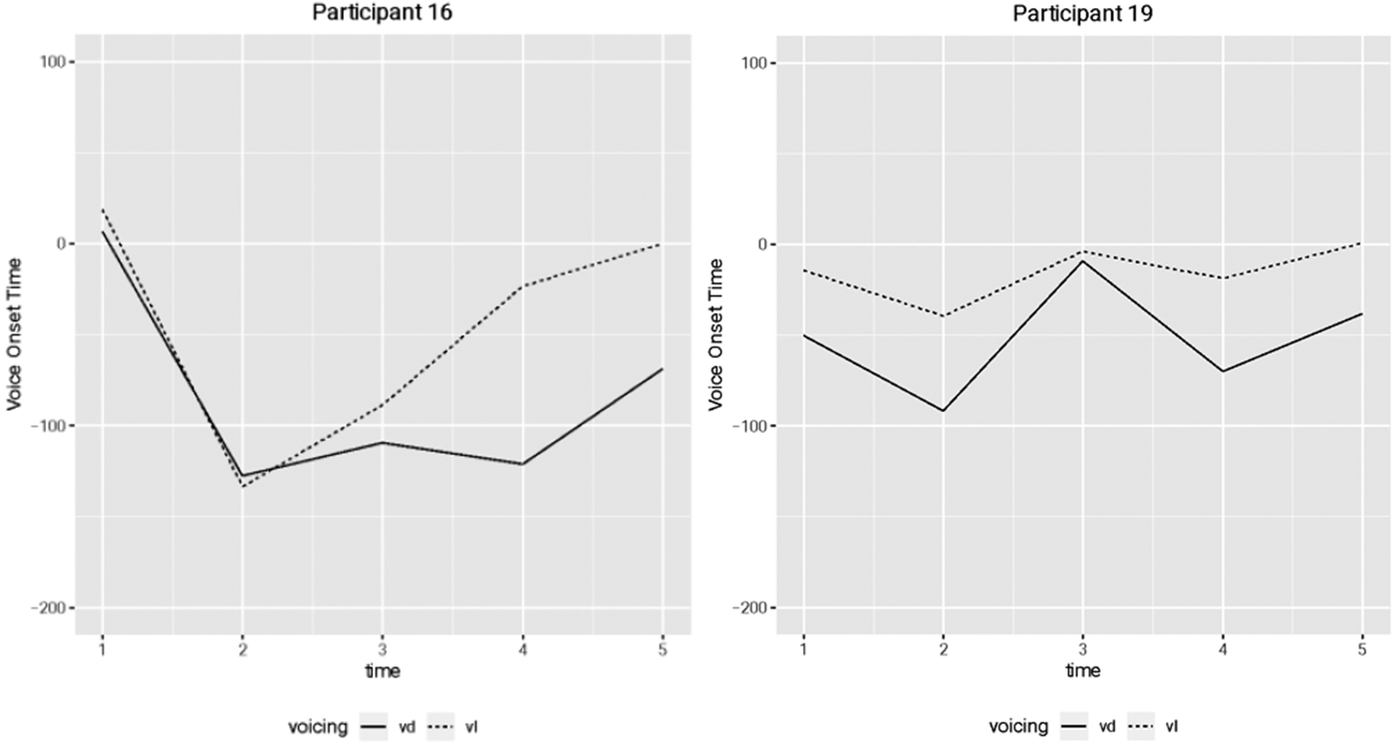
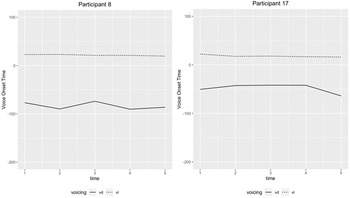

 Open access

