


1. Introduction
The simplified two-dimensional cylinder water entry has often been used as a basic model to describe the physics of the three-dimensional slamming problem on vertical piles. However, realistic three-dimensional waves which impact offshore structures do not have an idealized smooth and flat surface. Even for nominal two-dimensional waves, transverse instabilities are known to cause non-repeatable three-dimensional perturbations on the water surface shortly after they break (Perlin, He & Bernal Reference Perlin, He and Bernal1996). Despite this gap between realistic wave impact and idealized impact models, only a few studies have been done on cylinder impact on non-flat water surfaces. Understanding the effect of a non-flat surface on the slamming load is the focus of the present paper, where we study two-dimensional cylinder forced entry on perturbed water surfaces experimentally and numerically.
The origin of the transverse perturbations of a breaking wavefront is not fully understood. Longuet-Higgins (Reference Longuet-Higgins1995) described the stretching of the water jets formed on a breaking wavefront along the wave propagation direction and the highly reduced pressure gradient normal to the wave crest surface beneath the water surface as two sources of transverse perturbations on the breaking wavefront. Watanabe, Saeki & Hosking (Reference Watanabe, Saeki and Hosking2005) explained that the pressure gradient is caused by rotating pairs of vortices that develop during the initial stage of wave breaking. The interaction between these vortices and the primary streamwise vortices within the breaking wave roller creates several complex three-dimensional vortex structures that can initiate the formation of transverse perturbations on the wavefront surface. The perturbations can be normal or oblique to the wave propagation direction, and they cause local stochastic variations on the breaking wavefront shape (Taylor Reference Taylor1959). Random ambient disturbances, such as wind shear force, radiated waves from the cylinder, water surface depression caused by contracted airflow from the cylinder, downwash and air entrapment from previous impacts, can also perturb the wavefront surface. The spanwise and vertical perturbations cause a non-uniform wave impact, which can cause lateral pressure variability. Further, the perturbations may cause a larger air entrapment between the wavefront and the cylinder relative to flat water entry. The trapped air has high pressure and, during the impact, it may be subject to compressible oscillations (Wilson Reference Wilson1991). The radius of the entrapped air for impact of a rigid sphere on a flat water surface was studied by Hicks et al. (Reference Hicks, Ermanyuk, Gavrilov and Purvis2012), experimentally and analytically. Their results showed that an air pocket develops as the sphere approaches the initially still water. The oncoming body pushes the trapped air out, which causes a local depression of the water surface, and consequently the first touchdown point occurs further from the lowest point of the body. Through theoretical modelling, they could find an equilibrium between the radial pressure gradient and the viscous terms within the air, which established a relationship between the initial air pocket radius and the impact velocity, and the curvature of the sphere. The effect of air entrapment on the pressure impulse on a flat disc was studied by Jain, Vega-Martínez & Meer (Reference Jain, Vega-Martínez and Meer2021) experimentally. They found that the presence of the air pocket prolonged the pressure peak formation. For a disc diameter of 80 mm and a disc speed of 1 m s $^{-1}$ the first pressure peak occurred on the disc edge, where the disc for the first time reached the liquid. At $tV/D \simeq 1.25\times 10^{-3}$ after the first peak, the second peak at the centre of the disc occurred. Further, they observed that the air pocket retraction was much slower than the peak pressure buildup at the impact time. Due to the rapid pressurization of the air pocket, the central pressure impulse was dominated by the inertial length and time scale, and afterwards the dynamics of the problem was mainly governed by the water. For vertical wall impacts of coastal structures, Bullock et al. (Reference Bullock, Obhrai, Peregrine and Bredmose2007) reported strong variability of the impact pressures for breaking and near-breaking regular wave impact series. There was a strong sensitivity to the shape of the impacting wave and also examples of strong lateral variability. Air entrapment by the overturning wavefront and air entrainment from previous impacts led to oscillatory pressure histories with subatmospheric pressure during the pocket expansion. These observations for aerated impacts were confirmed by further numerical investigation of Bredmose, Peregrine & Bullock (Reference Bredmose, Peregrine and Bullock2009) and Bredmose, Bullock & Hogg (Reference Bredmose, Bullock and Hogg2015) for impacts with small air pockets and large air pockets in terms of a compressible flow model.
In the present paper, we study the effect of the wavefront spanwise perturbations in the simplified setting of a two-dimensional horizontal circular cylinder that impacts vertically on a perturbed water surface by forced motion, experimentally and numerically. The water surface is initialized by creating standing waves of different wavelengths and amplitudes. Standing waves are chosen because they create a quasi-static perturbation on the water surface at the instant of maximum crest or trough displacement, which represents the lateral perturbations found on a breaking wavefront. Through variation of the standing wave parameters, namely amplitude, wavelength and phase, the effect of the wavefront shape on the impact load history can be studied. For each experimental test case, a corresponding numerical simulation is set up and run. The numerical model allowed us to extend the investigation beyond laboratory limitations and study the impact in the small wavelength to diameter regime  $0.1<\lambda /D<0.35$. Further insight is obtained from the extension of the von Kármán (Reference von Kármán1929) and Wagner (Reference Wagner1932) models to include the impact on a curved water surface, which are also compared against the experimental results.
In § 2, the parameter space of the experimental and numerical tests is described. Further, the extension of the von Kármán (Reference von Kármán1929) and Wagner (Reference Wagner1932) methods is derived to estimate the slamming coefficient for the impact on a non-flat water surface. The experimental set-up along with a discussion of rig vibrations and wavelength limitations are provided in § 3. The numerical schemes along with a convergence study are presented in § 4. In § 5, the validity of using a two-dimensional numerical model to reproduce the three-dimensional experimental data is investigated by means of comparing two-dimensional and three-dimensional simulations. The effect of wave amplitude and wavelength on the slamming load is also studied. In § 6, the impact on short-wavelength standing waves and the effect of the air pockets and air compressibility on the impact force are studied using numerical modelling. Conclusions, remarks and suggestions for future work are provided in § 7.
2. Parameter space and analytical model
We study the impact force on a cylinder of a constant velocity  $V$, forced through a standing wave, as illustrated in figure 1. The slamming force on the cylinder can vary depending on the standing wave parameters, namely wavelength $\lambda$, wave period $T$, amplitude $A$ and phase. To define the physics of the slamming problem, we extend the simpler problem of cylinder flat water entry (figure 1a), which is equivalent to the impact on a standing wave of an infinitely small amplitude to wavelength ratio, to account for the water surface curvature. We thus consider a two-dimensional cylinder with a diameter $D$. The impact is assumed to be symmetric, and the cylinder reaches the water at the instant of maximum crest (figure 1b) or minimum trough (figure 1c) elevation where the fluid is temporally at rest at $x=0$ and $z=0$. We categorize the impact by defining a non-dimensional parameter $\phi _{\kappa } = -2 A D({\rm \pi} /\lambda )^2$, which is the ratio between the curvature of the water surface and the curvature of the cylinder. In the expression for $\phi _\kappa$, the sign of parameter $A$ distinguishes between crest and trough impacts, where $A>0$ corresponds to crest impacts and $A<0$ corresponds to trough impacts. The curvature of the cylinder, $\kappa _{cylinder}=2/D$, only depends on the cylinder diameter, while for the standing wave, the curvature of the water surface changes with the standing wave amplitude, wavelength and wave phase and can be approximated linearly by $\kappa _{water}=-A(2{\rm \pi} /\lambda )^2$. Figure 2 shows $\phi _{\kappa }$ for the different wavelengths and amplitudes for the trough impact. The dashed curve indicates $\phi _{\kappa }=1$. The cases in the vicinity of this curve are interesting since the close hit of the cylinder face and water surface will lead to an instantaneous large wetted area at initial impact and thus a large impact pressure. The points to the left of the $\phi _{\kappa }=1$ curve represent impacts on the short-wavelength range $0.05<\lambda /D<0.4$. In theory, for $\phi _{\kappa }>1$ air entrapment is expected to occur. But in reality, even for $\phi _{\kappa }\leq 1$, due to the initial depression of the liquid by the induced airflow from the cylinder, minor air entrapment can still occur. Due to the physical limitations in the wave tank, it was not possible to generate good-quality standing waves for any cases in the short-wavelength range, and the minimum wavelength that granted good quality was $\lambda /D=0.643$. Consequently, the only case at the left side of the curve for which an experimental test was conducted was the one with $\lambda /D=0.643$ and $A/D=0.025$. Our experiments thus cover $0.643\leq \lambda /D<0.9$ which we denote the intermediate-wavelength range. Nevertheless, we were able to study the impact for short wavelengths by means of numerical simulations. For these cases, air entrapment is expected to occur, and in § 6 we show that the oscillations induced by air compressibility affect significantly the slamming force time series. The corresponding standing wave period for each wavelength is presented in table 1. The standing wave periods are normalized by $0.15\times D/V$, which represents the normalized time interval from the peak of the slamming force during which the cylinder moves in the water.
Schematic of cylinder impact on (a) still water surface, (b) standing wave crest and (c) standing wave trough.

Parameter space for the experimental and numerical tests. The dashed curve shows  ${\phi _{\kappa }=1}$, where the cylinder curvature is equal to the water surface curvature. The number presented next to each marker is the value of $\phi _{\kappa }$ for that test. The test cases are classified into two groups: intermediate-wavelength range, $0.643<\lambda /D<0.9$, and short-wavelength range, $0.05<\lambda /D<0.4$. For the points in the intermediate-wavelength range, both experimental and numerical measurements are provided, while for the points in the short-wavelength range, only numerical measurements are presented. Dot marker points indicate the cases where numerical or experimental tests were completed, but whose outcome did not provide distinct information about the impact when compared with other cases, and hence they are not presented.

Corresponding standing wave period ratio to each standing wave wavelength. The standing wave period ratio is multiplied by 0.15, which is the normalized time duration at which the cylinder moves in the water after the slamming peak.

2.1. A simplified model to estimate the slamming coefficient
We now present two simplified methods to estimate the slamming coefficient for the cylinder entry on a non-flat water surface. For a cylinder with a constant downward velocity of  $V$ forced through the water surface, the submergence of the lowest point of the cylinder relative to the first contact point is $Vt$, where $t$ is the time variable. The wetted length of the cylinder can be calculated using the intersection of the body with the water surface, assuming that the cylinder submergence is small. This method was first introduced by von Kármán (Reference von Kármán1929). The cylinder wetted length calculated by the von Kármán method is represented on the left-hand side of figure 3. The wetted length due to the water spray is excluded since the pressure of the water spray is close to the atmospheric pressure. Assuming irrotational flow, inviscid and incompressible fluid, and neglecting gravity we can use potential flow theory to define the velocity field around the cylinder. Milne-Thomson (Reference Milne-Thomson1968) demonstrated that the velocity potential for the flow past a two-dimensional circular cylinder could be replaced by a flat-plate segment located at the first contact point $z=0$. We reconsider this validity for a curved water surface, as shown in figure 3. For the water-entry problem of the cylinder, we can write the out-pointing normal vector as $\boldsymbol {n}=(x/R,-(1-(x/r)^2)^{1/2})$ and the body velocity as $\boldsymbol {V}=(0,-V)$. Hereby the boundary condition at the body surface $\partial \phi /\partial n = \boldsymbol {n}\boldsymbol{\cdot } \boldsymbol {V}$ can be written as
 \begin{equation} \frac{x}{R}\phi_x(x,z_b,t)-\sqrt{1-(x/R)^2}[\phi_z(x,0,t)+z_b\phi_{zz}(x,0,t)] =\sqrt{1-(x/R)^2}V, \end{equation}
where  $z_b$ is the local $z$ coordinate of the cylinder surface and the square bracket is the Taylor expansion of $\phi _z$ from $z=0$. Due to symmetry, $\phi _x$ is $O(x)$ and from geometry, the maximum absolute value of $z_b$ is smaller than $x^2/(2R)$. Hence by neglecting terms that are $O(x^2)$, the simplified body condition reads
 \begin{equation} \left.\frac{\partial \phi}{\partial z}\right|_{z=0}={-}V, \end{equation}
which is valid for the case of both flat and curved water surfaces. Next, for the free surface, outside the impact region, we apply the standard impact condition:
 \begin{equation} 0=\phi(x,\eta_w+\Delta \eta,t)=\phi(x,0,t)+[\tfrac{1}{2}\kappa x^2 +\Delta \eta ]\phi_{z}(x,0,t), \end{equation}
where the last term is the Taylor expansion from  $z=0$. Further, $\Delta \eta$ is the rise up of water from the original surface position, $\eta _w$. Consistently with Wagner's theory for flat-water impact we neglect this term. Then, consistently with the former neglecting of terms of $O(x^2)$, the outer boundary condition reduces to $\phi (x,0,t)=0$. Hereby, we can use the same velocity potential as was used by von Kármán and Wagner. The complex velocity potential for the flat plate can be written as
 \begin{equation} F = \phi + {\rm i}\psi = {\rm i}V((x + {\rm i}z)^2 - c(t)^2)^{1/2}. \end{equation}
The pressure on the body can be calculated from the Bernoulli equation as
 \begin{equation} p={-}\rho \frac{\partial \phi}{\partial t}-\rho g z - \frac{\rho}{2}\left(\left(\frac{\partial \phi}{\partial x}\right)^{2}+\left(\frac{\partial \phi}{\partial z}\right)^{2}\right). \end{equation}
In (2.5) the hydrostatic term and spatial variation of  $\phi$ with respect to $x$ and $z$ are much smaller than the time variation of $\phi$, so they can be neglected from the pressure equation. Therefore, the hydrodynamic pressure yields
 \begin{equation} p={-}\rho \frac{\partial \phi}{\partial t}=\rho V \frac{c}{(c^{2}-x^{2})^{{1}/{2}}} \frac{\mathrm{d} c}{\mathrm{d} t}, \end{equation}
where  $\rho$ is the density of water. The corresponding vertical force on the cylinder can be calculated by integrating the pressure over the wetted length:
 \begin{equation} F=\int_{{-}c}^{c} p \,\mathrm{d}\kern0.06em x=\rho V c \frac{\mathrm{d} c}{\mathrm{d} t} \int_{{-}c}^{c} \frac{\mathrm{d}\kern0.06em x}{(c^{2}-x^{2})^{{1}/{2}}}=V \frac{\mathrm{d}}{\mathrm{d} t}\left(\rho \frac{\rm \pi}{2} c^{2}\right). \end{equation}
Definition of parameters in the analysis of slamming force. Here  $c_{K}(t)$ and $c_{W}(t)$ are the wetted length of the cylinder from the von Kármán (Reference von Kármán1929) and Wagner (Reference Wagner1932) methods, respectively. Further, $t$ is the time variable, $\lambda$ is the standing wave wavelength, $V$ is the cylinder downward velocity and $\eta _{w}(x)$ and $\eta _{b}(x)$ are the standing wave elevation and the water rise-up height with respect to the bottom of the cylinder.

The only unknown in (2.7) is the wetted length  $c(t)$. By modifying the von Kármán method that originally finds the wetted length for the cylinder flat water entry problem using geometry, we can calculate the wetted length for the cylinder non-flat water entry problem. The equation of the intersection of the cylinder with the standing wave can be written as follows:
 \begin{equation} (\eta_{w} - R - Vt)^2 + c_{K}^2 = R^2, \end{equation}
with
 \begin{equation} \eta_{w} = A(\cos(kx) - 1 ), \end{equation}
where  $A$ is the wave amplitude, $\eta _{w}$ is the standing wave elevation and $R$ is the cylinder radius. Solving (2.8) in time for $c_{K}$ where $x=c_{K}$ in (2.9) gives the wetted length time series. Substituting the wetted length $c_{K}(t)$ into (2.7), we can calculate the modified von Kármán slamming coefficient $C_s$:
 \begin{equation} C_{s} = \frac{F}{1/2 \rho V^{2} 2 R}. \end{equation}
 For the flat-water entry problem, the von Kármán method gives  $C_{\mathrm {s}}={\rm \pi}$, which is smaller than the experimental value of $C_{\mathrm {s}}=5.15$ (Campbell & Weijnberg Reference Campbell and Weijnberg1980).
Wagner (Reference Wagner1932) used an alternative approach to estimate the wetted length of the cylinder for the flat-water entry problem. On the right-hand side of figure 3, the wetted length of the Wagner method is sketched. The wetted length calculated by Wagner,  $C_W$, was $\sqrt {2}$ times larger than that derived by von Kármán in the initial stage just after impact. Also, the slamming coefficient was found to be $2{\rm \pi}$ at the initial time of the impact. This value is still higher than the experimental value for $C_s$, but it is more accurate than von Kármán's value. Therefore, modifying the Wagner method to consider the water surface curvature may give us a better approximation of the slamming coefficient for the impact on the non-flat water surface. The right-hand side of figure 3 shows the wetted length of the Wagner method $c_{W}(t)$ for a trough impact. To find $c_{W}(t)$ it is necessary to calculate the water rise-up $\eta _{b}$ relative to the bottom of the cylinder. The impact condition can hereby be expressed as
 \begin{equation} \eta_{b} = Vt+\eta_{w}+\int_{0}^{t} \phi_{z}(x,\eta_{w},t)\,{\rm d}t. \end{equation}
By Taylor expansion of  $\phi _{z}(x,\eta _w,t)$ from $z=0$ and $(\eta _b,\eta _w)(x)$ from $x=0$, we can write this as
 \begin{equation} \frac{1}{2R}x^2 = Vt+\frac{1}{2}\kappa x^2+\int_{0}^{t}\left[\phi_{z}(x,0,t) + \frac{1}{2}\kappa x^2\phi_{zz}(x,0,t)\right]\,{\rm d}t, \end{equation}
where  $\kappa =\eta _{w,xx}$ is the curvature of the water surface at initial impact at $(x,z)=(0,0)$. We neglect the second term inside the integral, consistently with the former approximation for the outer boundary condition. We now insert
 \begin{equation} \frac{\partial \phi(x,0,t)}{\partial z}=\frac{V x}{\sqrt{x^{2}-c_{W}^{2}(t)}}-V \quad \text{at} \ z=0,\ x>c_{W}(t) \end{equation}
and follow standard Wagner theory by changing the variable of the integral to the wetted length of the cylinder  $c_{W}$:
 \begin{equation} \frac{1}{2R}x^2 = \frac{1}{2}\kappa x^2+\int_{0}^{x} \frac{V x}{\sqrt{x^{2}-c_{W}^{2}(t)}}\mu(c_{W})\,{\rm d}c_{W}. \end{equation}
Here  $\mu (c_W)=V({{\rm d}t}/{{\rm d}c_W})$ is introduced as an unknown variable. An approximate solution of this integral can be found if we assume that
 \begin{equation} \mu(c_W)=A_{0}+A_{1}c_W, \end{equation}
where  $A_0$ and $A_1$ are unknown coefficients. Substituting (2.15) into (2.14) and performing the integration gives
 \begin{equation} \frac{1}{2R}x^2=A_{0}\frac{\rm \pi}{2}x + A_{1}x^2 + \frac{1}{2}\kappa x^2. \end{equation}
The left-hand side of (2.16) only has one quadratic term, which means  $A_0=0$ and
 \begin{equation} A_1=\frac{1}{2}\left(\frac{1}{R}-\kappa \right). \end{equation}
By using  $\mu (c)=V\,{\rm d}t/{\rm d}c$, the wetted length can be obtained:
 \begin{equation} \frac{1}{2} \left(\frac{1}{R}-\kappa\right) c \, {\rm d}c=V\,{\rm d}t\Longrightarrow c=2\sqrt{Vt\left(\frac{R}{1-R\kappa}\right)}. \end{equation}
The corresponding slamming coefficient on the cylinder for the modified Wagner wetted length (2.18) is thereby
 \begin{equation} C_{s}=\frac{F}{\frac{1}{2} \rho V^2 R}=\frac{2 {\rm \pi}}{1-R \kappa}. \end{equation}
For  $\kappa =0$, (2.19) recovers $C_s=2{\rm \pi}$ which is the classical Wagner result. For $\kappa < {1}/{R}$, this equation provides an approximation of the slamming coefficient value for non-flat water entry. In the limit that $\kappa \rightarrow {1}/{R}$, (2.19) predicts infinite initial pressure, related to flat-water impact of a plate where the initial wetted length is finite, and not infinitesimally small. The accuracy of the modified von Kármán method and the modified Wagner method is assessed in § 5.
3. Experimental set-up
In the experiments, a half-cylinder with a diameter of  $0.3\,$m and a length of 0.59 m was connected to a deployable platform (a wooden box and a triangular aluminium frame), as shown in figure 4. A ball–screw linear actuator with maximum stroke of $0.4$ m was used to move the cylinder vertically. To have a constant velocity during water entry, a prescribed motion signal was transmitted to the actuator, which provided a temporarily constant impact velocity of $V=0.7$ m s $^{-1}$ (figure 5). A potentiometer logged the position of the cylinder during each test. The cylinder was made of rigid polymer materials to keep the elastic deformation low. The experiment was conducted in a narrow wave flume with dimensions of $13\ {\rm m} \times 0.6\ {\rm m}\times 1.3\ {\rm m}$ at the Norwegian University of Science and Technology. The tank is provided with a single-flap-type wave generator. During the experimental campaign, this wavemaker could not generate low-amplitude and high-frequency waves with acceptable quality. To overcome this problem, we installed a new flap wavemaker with a lower draft in the flume. A movable cross-wall was installed downstream of the wavemaker to reflect the travelling waves and produce standing waves with different amplitudes and wavelengths.
Schematic of the experimental set-up.

(a) The input motion signal,  $X(t)$, to the actuator. The corresponding (b) velocity and (c) acceleration time series calculated from the motion are also presented.

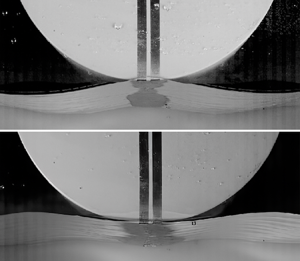
Seven wave probes were used to measure the wave amplitude at several locations. A force transducer (number 6 in figure 4) was connected to the rig and deployable platform, and it was used to measure the vertical force on the cylinder. Additionally, four inertia-based accelerometers were used to measure the dynamic response of the structure in the vertical direction. The accelerometers were attached to the force transducer, the inner surface of the cylinder close to the two ends and the deployable platform. The sampling frequency  $f_s$ for all the sensors was 2400 Hz. For visualization, we used a Photron FASTCAM SA-X2 high-speed camera, operating at 2000 fps, positioned in front of the half-cylinder base. All the images were recorded with $1024\times 1024$ pixel resolution and a 12 bit dynamic range. In the first and second rows of figure 6, the experimental visualization of the impact on the wave crest and wave trough, respectively, is presented. By visually comparing the snapshots at each time instant, we see that the wetted area size and wetted area growth rate in the trough impact are larger than in the crest impact. This difference affects the slamming coefficient significantly, as is shown later. Prior to the water entry tests, a hammer test was performed to find the natural frequencies of the rig and model. An example of such a test is shown in figure 7. Four peaks below the normalized frequency $f/\frac {1}{2}f_s$ = 0.08 are noticeable, from which the first peak at frequency $f/\frac {1}{2}f_s = 0.0208$ is related to the vibration of the ball–screw. The second, third and fourth peaks at $f/\frac {1}{2}f_s = 0.035$, 0.0433 and 0.0542 are related to the vibration of the aluminium frame, deployable frame and support structure, respectively. Finally, the vibration of the screws that connected the model to the ball–screw is responsible for the highest peak at $f/\frac {1}{2}f_s = 0.253$. Since the impact force excites the natural frequencies of the rig, the hydrodynamic load is estimated by subtracting the rig dynamic force contribution from the force transducer data. The dynamic force contribution for the rig acceleration ${\rm d}^2X/{\rm d}t^2$ is the product of the measured accelerometer data and the mass of all the components connected to the force transducer. The approach of extracting the hydrodynamic loads from the measured response and the filtering process is described in Appendix A. All the experimental data were filtered by a Butterworth filter with a normalized cut-off frequency of $f/\frac {1}{2}f_s = 0.2$.
Impact on (a–c) the wave crest and (d–f) the wave trough for three time instants.

(a) Time and (b) frequency response of the system.

4. Numerical simulations
Accurate calculation of the slamming coefficient for the impact of a rigid circular cylinder on a water surface is challenging. The physics of the impact problem involves the rapid transfer of momentum from the cylinder to the water and entrapped air, which makes the problem highly transient. Further, if air is entrapped between the rigid body and the water surface, it is necessary to include the effect of the air compressibility in the calculations. Several numerical models have been developed to estimate the slamming force. Mei, Liu & Yue (Reference Mei, Liu and Yue1999) generalized the Wagner (Reference Wagner1932) solution by keeping all the nonlinearities and formulating a boundary value problem within the assumptions of potential flow theory. They neglected the effects of gravity and surface tension and assumed no air entrapment between the cylinder and the water surface. From this generalized Wagner model, a slamming coefficient of  $C_s\approx 4.8$ was derived for the cylinder impact on a still water surface. Zhu (Reference Zhu, Faltinsen and Hu2005) used the constrained interpolation profile method to estimate the slamming coefficient for the impact on a still water surface with a constant velocity. However, this method has some difficulties regarding the convergence at the initial stages of the impact, due to the high rate of change of the wetted length, and cannot calculate the slamming force peak accurately. Boundary element methods are also commonly used to study the development of water jets around a cylinder after impact. However, a boundary element method is not valid for the initial instance of water entry (Hui Reference Hui2007). Computational fluid dynamics solvers are capable of including the surface tension and air compressibility effects in the simulations, and they have shown good accuracy compared with experimental estimations (Xiang, Wang & Guedes Soares Reference Xiang, Wang and Guedes Soares2020); however, they are time-consuming. In this paper, computational fluid dynamics is the option of choice for numerical simulations, given its high accuracy.
Thus for the present study, a numerical model for the cylinder impact on the curved water surface was established in OpenFOAM to aid the interpretation of the experimental results and extend the analysis beyond the experimental parameters. The OpenFOAM interIsoFoam solver is utilized for all numerical simulations in §§ 4 and 5. InterIsoFoam is an incompressible, isothermal, immiscible solver that uses the isoAdvector phase-fraction-based interface-capturing method (Roenby, Bredmose & Jasak Reference Roenby, Bredmose and Jasak2016). This phase-capturing method has a better performance in terms of volume conservation, boundedness and surface sharpness compared with the MULES interface compression method (Roenby et al. Reference Roenby, Bredmose and Jasak2016). To consider the effect of air compressibility for the simulations in § 6, the OpenFOAM compressibleInterIsoFoam solver is used. The effect of surface tension is included in all the simulations. According to Ross & Hicks (Reference Ross and Hicks2019), for a rigid symmetric body impacting a still water surface, capillary waves develop on the water surface before the impact, delay the instant of impact and change the location of the first touchdown on the water surface.
To simulate the cylinder motion, we use the sliding mesh method. In the sliding mesh, the cells do not deform, and the interpolation between sliding interfaces was made at a distance of two cylinder diameters from the vertical axis of the cylinder. These two characteristics avoid the numerical error caused by mesh deformation and interpolation on the liquid–gas interfaces at the location of water entry. The sliding mesh can be defined by a coupling condition between a pair of patches that share the same outer boundaries. For all the simulations, the sliding patch distance from the centre of the cylinder was equal to one cylinder diameter.
For every case, the initial position of the cylinder was set to 0.02 m above the first contact point from the water surface, which means a ratio between the gap and diameter of  $0.02\ {\rm m}/D = 1/15$. The gap prevents transient numerical effects at the beginning of the solution from affecting the results, and it lets the air flow field around the cylinder develop. The water surface was initialized by a linear standing wave profile. The phase of the standing wave was tuned so that the impact would occur at the maximum crest or trough. To prevent standing wave motion before the impact, a very high dynamic viscosity ( $10^3$ kg (m s) $^{-1}$) was defined for the water phase. Then the water dynamic viscosity was reset to the value of $10^{-3}$ kg (m s) $^{-1}$, at $0.0116 D/V=5$ ms before the impact. In all numerical simulations, the contribution of hydrostatic pressure is calculated and subtracted from the total force on the cylinder.
4.1. Mesh convergence study
A convergence study was performed to find an adequate mesh resolution and time step to obtain a consistent slamming coefficient time series while satisfying a Courant number (CFL) below one. The background mesh of hexahedral cells with a normalized size of  $\Delta x/D=3.34 \times 10^{-2}$ was defined, and it was refined by consecutive mesh division around the cylinder and free surface. The mesh cell aspect ratio ( $AR=\Delta x/\Delta y$) everywhere in the domain is one except for the cells on the cylinder, where it increases up to $AR=2.2$. For the initial and coarsest mesh, $\Delta x/D=8.32 \times 10^{-3}$ was chosen for the smallest cells with $AR=1$ in the main part of the domain. The criterion for the mesh convergence was chosen as $(C_{s_{i+1}}-C_{s_i})/C_{s_i}\leq 0.05$, where $C_s$ is the peak value of the slamming coefficient and $i$ is the counter for each refinement resolution. The sensitivity of the results to the CFL value was investigated by carrying out the study for ${\rm CFL}<1$ and ${\rm CFL}<0.5$. Adaptive time step refinement was activated to satisfy these limits.
The convergence study results for the flat water entry slamming coefficient time series are shown in figure 8. For  ${\rm CFL}<1$ four mesh resolutions were made, and acceptable convergence was achieved at the third resolution, where the difference between the fourth resolution, $\Delta x/D=1.04 \times 10^{-3}$, and the third resolution, $\Delta x/D=2.08 \times 10^{-3}$, at the slamming peak, is less than 2 %. The Campbell & Weijnberg (Reference Campbell and Weijnberg1980) experimental slamming curve is provided as a reference. The numerical slamming coefficient is most of the time above the Campbell slamming coefficient curve, and at the peak, i.e. $t=0$, it is about 8 % larger than the Campbell slamming coefficient. Tightening the time step criterion to ${\rm CFL}<0.5$ has a minor effect on the results and only reduces the overall noise on the force–time series. The figures for ${\rm CFL}<1$ and ${\rm CFL}<0.5$ show a peak at $tV/D \approx 0.05$, which is a numerical artefact brought on by noise in the estimated pressure in the cells at the alpha layer (the region where the volume fraction $\alpha$ is between 0 and 1) of the water jet growing on the cylinder side.
Spatial and temporal convergence study of the total force on the cylinder for the flat water entry for (a)  ${\rm CFL}<1$ and (b) ${\rm CFL}<0.5$.

Two additional convergence studies were carried out for the impacts on the standing wave crest and trough. Due to the opposite curvature of the water surface and the cylinder for the crest impacts, the velocity of the air and water jets around the cylinder is smaller than in the flat water entry case. Therefore, the solver can provide a consistent result with a mesh size of  $\Delta x/D=2.08 \times 10^{-3}$, which is the same mesh size as we found for the flat water entry case. Also, the CFL limit ${\rm CFL}<1$ is found to be sufficient to ensure a generally adequate time step for the simulation.
For the impact on the wave trough, the convergence study was accomplished for different wavelengths. The results for test cases  $\phi _{\kappa }=0.71$ and $\phi _{\kappa }=0.94$ (see figure 2), which correspond to $\lambda /D=0.833$ and $\lambda /D=0.725$, respectively, are considered. The force time series for $\lambda /D=0.833$ are presented in figure 9. For this case, the mesh is refined five times to achieve what we consider as acceptable convergence. The change of the slamming peak in the last two resolutions ( $\Delta x/D=5.02 \times 10^{-4}$ and $\Delta x/D=1.04 \times 10^{-3}$) is about 2 % for ${\rm CFL}<1$ (figure 9a), which implies that convergence was achieved in the fourth resolution. A secondary peak at $tV/D\approx 0.05$ is observed. This peak is a numerical artefact, and changing the ${\rm CFL}$ limit (see figure 8b) changes the timing and magnitude of it. For ${\rm CFL}<0.5$ the change of the slamming peak in the last two iterations is about 5 %, and the slamming peak in the fourth resolution is about 2 % smaller than the slamming peak at ${\rm CFL}<1$. Given the higher computational cost of ${\rm CFL}<0.5$ and its small effect on the accuracy of the result, we chose to use ${\rm CFL}<1$ for the subsequent trough impact slamming.
Spatial and temporal convergence study of the total force on the cylinder for the trough impact, with  $A/D=0.025$, $\lambda /D=0.833$, $0.15 D/VT = 0.161$ and $\phi _{\kappa }=0.71$ for (a) ${\rm CFL}<1$ and (b) ${\rm CFL}<0.5$.

The convergence study results for  $\lambda /D=0.725$ are presented in figure 10. For ${\rm CFL}<1$ (figure 10a), after five times of mesh refinement, the slamming peak in the last resolution is still about 35 % higher than in the fourth resolution. Further, decreasing the CFL limit to ${\rm CFL}<0.5$ does not help to achieve convergence; it just reduces the numerical oscillation on the slamming time series for the higher mesh resolution. This increasing behaviour of the slamming peak can be explained by the modified Wagner method, which predicts that when the water surface curvature to the cylinder curvature ratio is close to unity, the slamming load on the cylinder is expected to be very high. Here, each mesh refinement reduces the thickness of the phase fraction cross-section, where $0<\alpha <1$. Therefore, as the mesh resolution increases, the numerical solver can capture the sharp interface between the water and air better, i.e. $\phi _k$ gets closer to 1, which gives rise to a behaviour where the force on the cylinder increases with each refinement. In this situation, we suggest to also consider the time-integrated force (impulse) data to find an adequate mesh resolution. To calculate the impulse, all the force time series were shifted to locate the slamming peaks at $tV/D=0$. In figure 11 the impulse $I$ coefficient ( $I/0.5 \rho U D^2$) for each refinement is shown. At the instance of the slamming peak, the difference between the impulse value for $\Delta x/D=5.02 \times 10^{-4}$ and $\Delta x/D=1.04 \times 10^{-3}$ is about 12 %, which means that in comparison with the force time series, further mesh refinements have a smaller effect on the impulse time-series results. Although increasing the mesh resolution has the potential to reduce the impulse difference to below 5 %, it is observed that the refinements have only a minor effect on mitigating the growth of the slamming peak. Considering practical constraints, particularly CPU-time limitations, a mesh resolution of $\Delta x/D = 1.04 \times 10^{-3}$ was chosen for the subsequent simulation, specifically for an impact parameter of $\lambda /D = 0.725$.
Spatial and temporal convergence study of the total force on the cylinder for the trough impact, with  $A/D=0.025$, $\lambda /D=0.725$, $0.15 D/VT = 0.172$ and $\phi _{\kappa }=0.94$ for (a) ${\rm CFL}<1$ and (b) ${\rm CFL}<0.5$.

Non-dimensional impulse time series for trough impact, with  $\lambda /D=0.725$, $0.15 D/VT = 0.172$, $A/D=0.025$, $\phi _{\kappa }=0.94$ and ${\rm CFL}<0.5$.

For the impact on the short wavelength in § 6, air entrapment between the cylinder and the standing wave occurs, and the effects of air compressibility must be considered. Convergence studies were conducted to ensure adequate mesh resolution for consistency of the results from the compressible solver. From these studies,  $\Delta x/D=5.02\times 10^{-4}$ was found to be adequate to keep the change in the slamming coefficient peak less than 7 %.
5. Impact on intermediate wavelength
The cylinder impact on a curved water surface can result in a completely different slamming force in comparison with flat-water impact. In this section, we investigate the effect of water surface curvature on the slamming force by experimental modelling and numerical reproduction of the experiment. This study is carried out for the intermediate-wavelength range ( $0.643\leq \lambda /D<0.9$) and several standing wave amplitudes. In addition, the results from the modified Wagner and von Kármán theories presented in § 2 are compared with the experimental and numerical results.
5.1. Comparison between two-dimensional and three-dimensional impact
Although the focus of the study is two-dimensional impacts, the experimental results may contain three-dimensional effects including spanwise variations and end effects. To assess the influence of these effects on the measurements, a numerical three-dimensional simulation replicating the experimental model was carried out for both crest and trough impacts. The case of  $A/D=0.025$, $\lambda /D=0.833$ (corresponding to $\phi _{\kappa }=0.71$) was chosen for this study. To lower the computational cost of the three-dimensional simulations, only one quarter of the cylinder was modelled and symmetry boundary conditions were applied. To start, the three-dimensional water surface shape simulated by the numerical solver is compared with the snapshots of the water surface from the experiments. Figure 12 shows the synchronized experimental and three-dimensional numerical crest impact for four different instants of time. The first row represents the free-surface shape in the experiment, and the second represents the numerical isosurface of $\alpha =0.5$, where $\alpha$ is the phase fraction. To ease the comparison, the edges of the isosurface are overlaid on the experimental visualization for each time instant. By comparing the simulated water rise-up on the front face of the cylinder with the experiment, we can see that the numerical isosurface is in good agreement with the shape and level of the water surface in the experiment in all figures. The isosurface visualizes the water jet flow well on the cylinder sides; however, the details of the spray area are not captured in the numerical results. On the wetted surface of the cylinder, the numerical solver shows isosurfaces of $\alpha =0.5$ spanning the full lateral width. The edges of these surfaces are marked by isolines on the experimental snapshots (figure 12b–d). Although these thin isosurfaces may resemble air pockets, they are artificial numerical results caused by smoothing $\alpha$, the phase fraction for the mixture of gas and water at the free surface. This is supported by the fact that the experimental visualizations and force time series showed no evidence of air entrapment or pocket oscillations.
Visual comparison between the experimental and numerical results for the impact on the wave crest at different time steps: (a)  $\Delta tV/D=0.0117$, (b) $\Delta tV/D=0.0234$, (c) $\Delta tV/D=0.0351$ and (d) $\Delta tV/D=0.0468$. The camera angle is set to show the front and bottom of the cylinder. The light blue regions along the cylinder shell in the numerical results are the isolines. The light blue region indicated in (b) is water that is rising between the cylinder end and the tank wall at each time step. The relative standing wave amplitude, wavelength and period are $A/D=0.025$, $\lambda /D=0.833$ and $0.15 D/VT = 0.161$, respectively, and $\phi _{\kappa } = -0.71$.

The pressure variation along the three-dimensional cylinder was studied following the validation of the water surface shape. In figure 13(a) the non-dimensional pressure field at the instant of impact,  $tV/D=0.006$, is visualized for the crest impact, in which $y/L=0$ is the normalized coordinate of the middle of the cylinder and $y/L=0.5$ is the normalized coordinate of the cylinder tip. The pressure coefficient is defined as $C_p=p/0.5 \rho V^2$. At the central region of the cylinder, $y/L<0.3$, the pressure is uniformly distributed along the length, increasing from the centre ( $x/D=0$) to the water jet root ( $x/D \approx 0.08$). However, due to the normalized gap $\Delta l_{gap}/D=0.0167$ between the cylinder and the tank wall, the pressure decreases in the near vicinity of the cylinder tip. The pressure data along the centreline of the cylinder and water jet root show an abrupt decline of over $35\,\%$ in value for $y/L>0.45$. The effect of this low-pressure zone on the slamming force can be seen in the comparison of the slamming coefficient curves for the three-dimensional, two-dimensional and mid-section of the three-dimensional numerical models in figure 13(b). At the instant of the slamming peak the two-dimensional curve is about $8\,\%$ higher than the three-dimensional case. The pressure field in the middle section of the cylinder has a magnitude and profile closer to those for the two-dimensional model; the slamming coefficient for a section with one cell thickness at $y/L=0$ is only about $4\,\%$ smaller than the two-dimensional slamming coefficient.
(a) Simulated pressure distribution along the three-dimensional cylinder surface at  $tV/D=0.006$ for the crest impact and (b) comparison between the two-dimensional (2-D) and three-dimensional (3-D) force on the cylinder for impact on the wave crest for $\lambda /D=0.833$, $0.15 D/VT = 0.161$, $A/D=0.025$ and $\phi _{\kappa } = -0.71$.

The same analysis was repeated for the impact on the wave trough. In figure 14 the numerical isosurfaces are compared with snapshots of the experiment for four different time instants. The water surface from the experiments still does not reveal any indication of an air pocket, even though the local instantaneous water surface curvature at the point and moment of impact is closer to the cylinder. The numerical results, however, show more isolines that are separated by artificial zones parallel to the centreline of the cylinder in which  $0<\alpha <1$. These zones are two to three mesh cells in height, and refining the mesh resolution on them did not lead to a zone with a uniform $\alpha =0$ (gas phase). Therefore, these numerical visualizations also contain artificial numerical results and do not indicate a clear air pocket. The overlaid edges of the numerical simulations on the experimental snapshots in figure 14(a,b) show that the level of water rise-up on the front face of the cylinder agrees well the experiment at the initial stages of the impact. In the last two snapshots (figure 14c,d), however, it is clear that although the simulation reproduces the experiment qualitatively, there are quantitative differences which may indicate that the pressures are not entirely reproduced.
Visual comparison between the experimental (top) and numerical (bottom) results for the impact on the wave trough for different time-steps: (a)  $\Delta tV/D=0.0117$, (b) $\Delta tV/D=0.0234$, (c) $\Delta tV/D=0.0351$ (d) $\Delta t V/D=0.0468$. The camera angle is set to show the front and bottom of the cylinder. The light blue regions along the cylinder shell in the numerical results are the isolines. The light blue region indicated in (b) is water that is rising between the cylinder end and the tank wall at each time step. The relative standing wave amplitude, wavelength and period are $A/D=0.025$, $\lambda /D=0.833$ and $0.15 D/VT = 0.161$, respectively, and $\phi _{\kappa } = 0.71$.

The pressure for the trough impact shown in figure 15(a) shows the same decreasing trend from the centre of the cylinder to the tip. The pressure coefficient for  $0< y/L<0.3$ is almost constant along the cylinder centreline and jet root. However, for $y/L>0.4$, the pressure rapidly decreases at the jet root, where it tends to $C_p\approx 3$ at the cylinder tip. The pressure decline along the centreline of the cylinder is also noticeable, and for $y/L>0.48$ it is more than $40\,\%$ smaller than at the cylinder centre. As a result, at the instant of impact $tV/D \approx 0$ the slamming coefficient of the three-dimensional model is about $14\,\%$ lower than for the two-dimensional model. Further, the slamming coefficient for the mid-section of the three-dimensional model is about $7\,\%$ smaller than that of the two-dimensional model.
(a) Simulated pressure distribution along the three-dimensional cylinder surface at  $tV/D \approx 0$ for the trough impact and (b) comparison between the two-dimensional (2-D) and three-dimensional (3-D) force on the cylinder for impact on the wave trough for $\lambda /D=0.833$, $0.15 D/VT = 0.161$, $A/D=0.025$ and $\phi _{\kappa } = 0.71$.

Using these data, we can conclude that the overall slamming coefficient time series of the two- and three-dimensional models are consistent in general but the two-dimensional model can over-predict the slamming peak by about  $8\,\%$ to $14\,\%$ in comparison with the three-dimensional results. As a result, when comparing the two-dimensional numerical results with the experiments, the same range of error can be expected. It is worth recalling that although ten repetitions were carried out for each impact, the uncertainties regarding the experiments should also be taken into account, given that the experimental results are influenced by the rig vibrations. Therefore, the difference between measurements and numerical simulations would change if the experiments were reproduced with a stiffer set-up.
5.2. Flat water entry
As an initial reference test, experiments were carried out for water entry on flat free surface, where the water was at rest. Ten repetitions were carried out to obtain estimates of the variability on the slamming force. The results are provided in figure 16, where the solid line represents the mean of the ten repetitions and the shaded region represents the mean plus or minus one standard deviation. The mean of the peaks of the slamming coefficients is approximately  $C_s = 5.21$, and the coefficient of variation of the slamming coefficients peaks is approximately 4 %. The coefficient of variation is defined as the ratio of the standard deviation to the mean of the peaks. The mean slamming coefficient peak value is similar to $C_s = 5.15$ estimated by Campbell & Weijnberg (Reference Campbell and Weijnberg1980). After the slamming coefficient peak, large oscillations are noticeable in the experimental results, which are repeatable and related to the rig vibration. The trend of the averaged time series agrees qualitatively with the Campbell & Weijnberg (Reference Campbell and Weijnberg1980) results.
Experimental slamming coefficient time series for the ten repetitions of impact on the flat water surface. The solid line represents the mean and the shaded region represents the mean plus or minus one standard deviation. The dashed line presents the experimental result from Campbell & Weijnberg (Reference Campbell and Weijnberg1980) provided for comparison.

5.3. Effect of wave amplitude
We now turn to the effect of wave amplitude on the slamming load. For a fixed  $\lambda /D=0.833$, and three different ratios of wave amplitude to cylinder diameter, $A/D= 0.015$, $0.02$ and $0.025$, the experimental and numerical slamming coefficient curves are presented in figure 17 for both crest and trough impact. This set of parameters corresponds to $|\phi _{\kappa }|=0.43$, 0.57 and 0.71 in figure 2. The first and second rows of figure 17 show the results for the crest and trough impacts, respectively. Because of the relatively high frequency of the standing wave, impact at the exact wave crest or trough instant was hard to achieve experimentally. Therefore each experimental test was repeated ten times to increase the reliability of the results. The experimental slamming curve in all plots shows the mean plus or minus one standard deviation from the ten repetitions of each test. A normalized low-pass filter of $f_{cutoff}/\frac {1}{2}f_s=0.2$ was applied to all of the numerical results to treat the time series the same way as the experimental results. Further, to provide a reference comparison, the Campbell & Weijnberg (Reference Campbell and Weijnberg1980) flat water entry slamming curve is included for the crest and trough impacts.
The effect of the wave amplitude on the slamming coefficient. The impact on (a–c) the wave crest and (d–f) the wave trough. The solid black line shows the mean and the shaded region shows the standard deviation of the experimental slamming coefficient time series from the ten repetitions. The solid red line shows the numerical slamming coefficient time series presented for each experiment. The ratio of wavelength to diameter is constant and equal to  $\lambda /D=0.833$ (corresponds to $0.15 D/VT = 0.161$). Parameters: (a) ${A}/{D}=0.015$, $\phi _{\kappa }=-0.43$, (b) ${A}/{D}=0.02$, $\phi _{\kappa }=-0.57$, (c) ${A}/{D}=0.025$, $\phi _{\kappa }=-0.71$, (d) ${A}/{D}=0.015$, $\phi _{\kappa }=0.43$, (e) ${A}/{D}=0.02$, $\phi _{\kappa }=0.57$ and ( f) ${A}/{D}=0.025$, $\phi _{\kappa }=0.71$.

Figure 17(a–c) shows that increasing the wave crest amplitude slightly reduces the slamming peak at the impact time. As the standing wave gets steeper, the wetted length and the rate of change of the wetted length decrease on the cylinder. This implies that the cylinder must accelerate less water during initial water entry, which lowers the slamming force on the cylinder. This logic can be used to explain the significant difference of more than  $45\,\%$ between the flat-water impact value of $C_s=5.15$ and the mean of crest impacts at $tV/D=0$. Shortly after the slamming peak, there are significant fluctuations in all slamming curves. These fluctuations are related to the rig vibration, and as evident by the averaging process, they show strong repeatability, and are thus deterministic. To capture the effect of these oscillations on the experimental results, an accelerometer was attached to the bottom of the force transducer to measure the vibrations of the mechanical structure. Then, the motion derived by integration of the averaged accelerometer data twice in time was imported to the OpenFOAM solver. This process imposes the mechanical vibration of the rig into the numerical results and allows a more consistent comparison of the experimental and numerical results. The motion and velocity time series from the averaged acceleration data are available for each standing amplitude and wavelength in the DTU research database at https://doi.org/10.11583/DTU.22294075.
The numerical slamming time series corresponding to each standing wave amplitude shows that the slamming peak at  $tV/D=0$ is located in the error band of the experiment. Further, for $tV/D>0$ the numerical and experimental time series both have the same general trend. However, the oscillations in the mean experimental time series are not well replicated in the numerical solution.
Figure 17(d–f) shows the slamming coefficient time series for the impact on wave troughs. The peak of the slamming coefficient time series for the trough impact is significantly larger than for the flat and corresponding crest impacts. This is consistent with our prediction by the modified von Kármán and Wagner methods, in which we found that as the curvature of the cylinder gets closer to the water surface, the slamming force is expected to increase. Here, the slamming peak for  $A/D=0.025$ is more than twice the flat value and about four times the crest impact value. We can also see that the slamming peak increases by increasing the wave amplitude. From a geometric perspective, by increasing the amplitude for a fixed wavelength, the wave trough curvature approaches that of the cylinder ( $\phi _\kappa$ approaches unity). Consequently, the wetted length and the rate of change of the wetted length at the impact time get larger, which increases the slamming load. The numerical simulation results reproduce the general trend of the experiments in all three plots. The peak of the numerical slamming curve is about $10\,\%$, $12\,\%$ and $15\,\%$ larger than the mean of the experiments shown in the plots, respectively. The slight growth in error by increasing the wave amplitude can be related to the combination of the more extreme pressure drop on cylinder tips and the growth of instabilities on the crest and trough of the standing waves, which reduces the lengthwise uniformity of the impact and wetted surface in the experiment.
5.4. Effect of wavelength
We next investigate the effect of the wavelength on the slamming force on the cylinder. For a fixed wave amplitude,  $A/D=0.025$, the slamming coefficient time series for $\lambda /D= 0.646$, 0.725 and 0.833 (corresponding to $\phi _{\kappa }= 1.18$, 0.91 and 0.71, respectively) are shown in figure 18.
The effect of the wavelength on the slamming coefficient. The impact on (a–c) the wave crest and (d–f) the wave trough. The solid black line shows the mean and the shaded region shows the standard deviation of the experimental slamming coefficient time series from the ten repetitions. The solid red line shows the numerical slamming coefficient time series presented for each experiment. The wave amplitude is constant and equal to  $A/D=0.025$. The ratio of cylinder diameter to standing wave period times cylinder velocity is $0.15 D/VT=$ (a,d) $0.182$, (b,e) 0.172 and (c,f) 0.161. Parameters: (a) $\frac {\lambda }{D}=0.646$, $\phi _{\kappa }=-1.18$, (b) $\frac {\lambda }{D}=0.725$, $\phi _{\kappa }=-0.94$, (c) $\frac {\lambda }{D}=0.833$, $\phi _{\kappa }=-0.71$, (d) $\frac {\lambda }{D}=0.646$, $\phi _{\kappa }=1.18$, (e) $\frac {\lambda }{D}=0.725$, $\phi _{\kappa }=0.94$ and ( f) $\frac {\lambda }{D}=0.833$, $\phi _{\kappa }=0.71$.

For the impact on the wave crest, figure 18(a–c) shows that increasing the wavelength slightly increases the slamming peak at  $tV/D=0$. We explain this as follows. Shorter wavelengths make the wave steeper for a fixed amplitude. The steeper free surface causes a smaller wetted area and a slower rate of change of the wetted area at the impact time. As a result, the slamming force becomes smaller by decreasing the wavelength. This relationship between slamming force and wave steepness is consistent with the earlier results for the crest impact, where we found that decreasing wave amplitude for a fixed wavelength results in a smaller slamming force. For the shortest wavelength (figure 18a), the largest slamming load does not occur at the initial impact. Although the peak at the initial impact time ( $tV/D=0$) is smaller than for the flat water entry, for $tV/D>0.5$ the crest slamming coefficient reaches a higher level than for the flat-water case. This can be explained by the small amount of water in a steep wave crest, which requires a relatively small impulse at the initial impact.
When the wavelength is increased, the time history evolves towards a closer resemblance to the flat-water impact, such that at  $\lambda /D=0.833$ the initial slamming peak is again the largest. The numerical force predicted by our numerical simulations is in qualitative agreement with experiments. The numerically predicted slamming coefficient peak is higher than the mean experimental peak, but it falls within the random variation (grey shaded region) in all three tests. Although the experimentally measured acceleration at a single position of the model is used as input to the simulations, a majority of the oscillations with high frequency are not captured mechanically. However, the slowly varying parts of the time series are captured with reasonable agreement.
Figure 18(d–f) shows the experimental and numerical slamming curves for the trough impacts. As evident from the results, increasing the wavelength reduces the slamming peak. Once again, this trend can be explained by the wetted area and rate of change of the wetted area of the cylinder, which are smaller for the larger wavelengths. For  $\lambda /D=0.646$ (figure 18d) the nominal value of $\phi _{\kappa }=1.18$ would expectedly lead to air entrapment. However, no air pocket was observed in any repetition of the experiment for this specific test case. This absence of an air pocket can be explained by several factors. Firstly, the experimental waves employed in the test case have a second-order wave profile, characterized by a wider trough. Consequently, this results in a smaller value of $\phi _\kappa$, which reduces the likelihood of air entrapment. Further, it is possible that any airflow generated during the impact may escape through the gaps present at the ends of the cylinder, preventing the formation of an air pocket. Although it is preferable to use a compressible solver when air pockets can occur, using an incompressible solver is considered better for modelling. Because no air pocket was formed during the experiments, the effects of air compressibility were eliminated from the numerical results by using the incompressible solver. The numerical time series at $tV/D=0$ is roughly $35\,\%$ larger than the mean of the experimental slamming curve and nearly three times larger than that of flat-water impact. Despite the initial discrepancy, the experimental and numerical time series are in general in good agreement for $tV/D>0$. The high-frequency oscillations are not entirely captured; however, the low-frequency oscillations (i.e. $0.08< tV/D<0.15$) are well captured. For $\lambda /D=0.725$ (figure 18e), the local instantaneous water surface curvature at the point and moment of impact is almost equal to the curvature of the cylinder surface and the slamming force is expected to be the highest. However, the experimental time series is about $5\,\%$ larger than for $\lambda /D=0.833$ with $\phi _k=0.71$ and it is $32\,\%$ smaller than the corresponding numerical results. The main reason for the smaller slamming peak can be related to transverse instabilities of standing waves along the trough, which make the wave perturbed, and avoid a trough impact with a large instantaneous wetted surface along the cylinder length in the experiment.
5.5. Validity of the simplified analytical impact model
In the previous section, we have seen that the modified von Kármán and Wagner methods, presented in § 2, can be used to explain the variation of the slamming force peak with the standing wave parameters. Here, we evaluate the validity of these methods in identifying the trend and calculating the slamming force peak. For the modified Wagner and von Kármán methods, the water surface curvature is calculated from the second-order standing wave theory (Dalzell Reference Dalzell1999). The second-order standing wave is defined as
 \begin{align} \eta(x, t) & = \frac{H}{2}\cos (k x) \cos(\omega t) +\frac{-H^2 k}{4 \sinh (2 k h)}\nonumber\\ &\quad +\frac{H^2}{8} k \tanh (k h)(1+{\rm coth}^2(k h)) \cos (2 k x)\nonumber\\ &\quad +\frac{H^2}{8} k \,{\rm coth}(k h)(3\,{\rm coth}^2(k h)-1) \cos (2 k x) \cos (2 \omega t), \end{align}
where  $H=2 |A|$. From (5.1), the curvature of the second-order standing wave can be written as
 \begin{equation} \kappa_{water} ={-} A k^2 - \frac{A^2 k^3}{2} (1 + 3 \coth(k h)^4) \tanh(k h). \end{equation}
Here,  $A>0$ is associated with crest and $A<0$ with trough.
The slamming coefficients from the experiments, numerical simulations and modified theories are presented in figure 19. The experimental data show the mean plus or minus one standard deviation of the experimental slamming time series peak values at  $tV/D=0$, as presented in figures 17 and 18. The numerical slamming coefficients are determined from the numerical slamming time series at $tV/D=0$. The theoretical values show the results from the modified von Kármán and Wagner method slamming coefficient at $t=0$.
Slamming coefficient derived by modified von Kármán theory: (a) the effect of wavelength on  $C_{s}$ for fixed standing wave amplitude $A/D=0. 025$ for the impact on the standing wave crest and (b) the effect of amplitude on $C_{s}$ for fixed wavelength ${\lambda }/{D}=0.833$, $0.15 D/VT = 0.161$ for the impact on standing wave crest and trough. Here M denotes modified in the legend.

For the crest impacts, the slamming coefficients are shown in figure 19(a) for  $A/D=0.025$ and three wavelengths. The results from theories predict a slight increase in the experimental slamming coefficient with increasing wavelength. This is confirmed by the experimental results. For all the wavelengths, the Wagner method shows the largest value, and the von Kármán method gives the lowest value, while the values from the experiments and numerical simulations are in between, yet closest to the modified Wagner method. In the modified von Kármán's method, the additional wetted length caused by the water run-up is neglected; therefore the force on the cylinder becomes smaller. The methods do not include the three-dimensional effects that avoid a symmetry impact and reduce the pressure on the cylinder surface. This may explain the overestimated slamming coefficient that the Wagner method gives. The two theoretical methods clearly provide a lower and upper bound of the slamming coefficient, and although quite rough estimations, they are still useful on their own and also helpful in terms of explanation.
In figure 19(b) the slamming coefficients for a fixed ratio of  $\lambda /D=0.833$ and different amplitudes are shown. For the crest and trough impacts, the experimental and numerical slamming coefficients are bound between the modified von Kármán and Wagner estimations and all follow a similar trend as a function of the standing wave amplitude. The slamming coefficient is roughly estimated by both modified methods. When comparing the von Kármán method with the modified Wagner method, it is observed that the results obtained from the modified Wagner method show better agreement with the numerical results. The mean experimental results, however, are between the predictions of the two theories. The modified von Kármán and Wagner methods yield values of $C_s={\rm \pi}$ and $C_s=2 {\rm \pi}$ for flat water entry, $A/D=0$, which are equivalent to those obtained by the original methods.
For  $\lambda /D < 0.7$, the small wavelengths can make the main peak occur after the initial crest impact, as seen in figure 18(a,b). Our modified von Kármán model predicts this feature qualitatively, as illustrated in figure 20, where we present the slamming time series of the cases represented in figure 19(a). Using (2.7), this new trend can be related to the variation of $c \dot {c}$ with time, where $c$ is the wetted area and $\dot {c}$ is the rate of change of the wetted area. By decreasing the wavelength, both $c$ and $\dot {c}$ become initially smaller due to the higher steepness of the wave. As the cylinder submerges into the water, $c$ continues to increase; however, $\dot {c}$ initially increases, and then it decreases. For the impact on the shorter wavelengths, $\dot {c}$ holds its initially large value for a longer period of time; therefore $c \dot {c}$ and the corresponding slamming force increase after the initial impact. As a result, while the initial peak at $tV/D=0$ for $\lambda /D=0.646$ is the lowest, the main force peak of this wave is the highest in comparison with larger wavelengths shown in figure 20.
The slamming time series of the modified von Kármán method for fixed amplitude ratio of  $A/D=0.025$ and different wavelength to diameter ratios.

6. Impact on short wavelength
The physics of the impact becomes more complex when the standing wave wavelength is substantially smaller than the cylinder diameter, i.e.  $0.05<\lambda /D<0.4$. Air may be trapped by the standing waves and the cylinder. The trapped air can affect the pressure magnitude and distribution on the impacting side of the cylinder. In addition, the compressibility of air can cause pressure oscillation inside the air pockets, which induces fluctuation of the slamming load. Further complexity is added by subsequent impacts on multiple crests and the possible deformation of the water surface by the airflow. The limitations of the experimental set-up and the transverse instabilities of the standing waves did not allow physical tests in the short-wavelength range, so our study in the short-wavelength regime is limited to the numerical simulations. Due to the possible compressible effects, a compressible numerical solver of OpenFOAM (compressibleInterIsoFoam) was used to capture the effect of air compressibility on the slamming load for all simulations in this section. A constant downward velocity of $0.7$ m s $^{-1}$ is prescribed for the cylinder. The results provided here are for Froude number $u/\sqrt []{g D} = 0.4080$, where $u$ is the cylinder velocity, $g$ is the gravitational constant and $D$ is the cylinder diameter. For the smallest standing period considered, $T=0.125$ s, 20 % of a standing wave period corresponds to $TV/D=0.0583$. For the chosen impact velocity $V$, the effect of the standing wave motion can thus be considered small up to this limit. We do not expect a strong dependence on the hydrodynamic impact effect from the choice of $V$. For the air oscillation effects, however, we do note that the results in the scaled time $tV/D$ will depend on $V$ since the pocket oscillation frequency is independent of $V$.
$V$.
6.1. Single-air-pocket effect
Practically, the perturbations on a real breaking wavefront have a random shape, and their wavelength is far smaller than the offshore monopile diameter. The short wavelengths of the perturbations increase the possibility of air entrapment between the water and the cylinder. For a case of single-air-pocket entrapment, the slamming coefficient for a fixed  $\lambda /D=0.325$ and three different ratios of wave amplitude to cylinder diameter $A/D=0.015$, $0.02$ and $0.025$ is presented in figure 21 for the trough-centred impact. The ‘trough-centred impact’ is an implicit expression used in this section to show that the lowest point of the cylinder and the wave trough are aligned; however, the first contact point between the cylinder and water surface is at the region between the wave crest and the wave trough. Figure 21 shows that there is a periodic oscillation in all of the time series some time after the slamming peak. The oscillation frequencies for $tV/D>0.05$ are, respectively, 160, 140 and 120 Hz. These oscillations are related to the effect of air compressibility, which yields air pocket oscillation. The size of the air pocket affects the frequency of oscillation, which decreases as the air pocket volume grows due to an increase in wave amplitude. An analytical formula was presented in Abrahamsen & Faltinsen (Reference Abrahamsen and Faltinsen2012) to determine the natural frequency of air pockets trapped between a wave and a wall. For the situation where the air pocket has a quarter-elliptic shape and the water surface is tangent to the cylinder surface, the analytical natural frequency of the air pocket for $A/D=0.025$ is estimated to be $118\,$Hz. This value is about $2\,\%$ lower than our numerical result.
Cylinder impact on a wave trough for  $\lambda /D=0.325$ and $0.15 D/VT = 0.257$.

Figure 21 also shows that at the impact time, the slamming peak decreases by increasing the wave amplitude. We can relate this trend to the curvature of the water surface. The curvature of the smaller-amplitude wave is closer to the cylinder curvature at the impact time, so the wetted length and rate of change of the wetted length are higher. The pressure around the cylinder for four different time steps is presented in figure 22. At  $tV/D=-0.0019$ the maximum pressure is induced on the cylinder, as shown in figure 21(a). The air pocket distributes the pressure over the entire impact zone, so the integration of pressure over the cylinder surface causes a large initial force. After the impact ( $tV/D=0.006$) the pressure inside the air pocket drops due to the expansion of the air pocket. The negative (subatmospheric) pressure inside the air pocket causes a negative force on the cylinder. As the cylinder submerges more into the water, the air pocket oscillation slowly fades out, which consequently decays the force oscillations at a low rate (figure 21c,d).
Pressure field around the cylinder for different time instances  $tV/D$ of (a) $-0.0019$, (b) 0.006, (c) 0.0151 and (d) 0.023 for $\lambda /D=0.3255$, $0.15 D/VT = 0.257$ and $A/D=0.025$; single air pocket.

6.2. Impact on multiple air pockets
The shorter-wavelength perturbations can significantly change the time history of the slamming coefficient. During water entry, the cylinder may hit several local crests at different locations, which yields multiple impact peaks in the slamming force time series. Further, air pockets of different sizes and pocket oscillations may develop between each contact point. Here, we consider the slamming force in terms of an impact on a standing wave of short wavelength,  $\lambda /D=0.0814$.
In figure 23 the slamming coefficient time series for three different ratios of wave amplitude to cylinder diameter is presented for a crest-centred impact. When the cylinder hits the wave crest at  $tV/D \approx -1.5 \times 10^{-3}$, the initial force is very small due to the short wetted length (framed part of figure 23). However, right after the impact, at $tV/D \approx 0.0076$, the gap between the cylinder and the second wave crest becomes almost closed, causing a high pressure in the trapped air. This instant for $A/D=0.025$ is shown in figure 24(a). Visually, it is evident that the pressure inside the trapped air and over the wetted length is the highest, decreasing outward. However, to better understand the pressure on the cylinder surface, the pressure coefficients for the time instances in figure 24 are shown in figure 25. The colour bar is used to indicate the fluid phase in contact with the cylinder surface, in which $\alpha =1$ refers to water and $\alpha =0$ to gas. For $tV/D \approx 0.0076$, figure 25 shows that the trapped air evens out the pressure over the air pocket length, which causes a high pressure over the entire impact zone. Due to the smoothing of the interface between air and water, the pressure shows variation in the $\alpha$ layer ( $0<\alpha <1$). The pressure peak occurs on the wet surface of the cylinder, where the pressure from the impact on water superposes with the pressure of the trapped air. As a result of the wide high-pressure zone, the integrated pressure (force) on the cylinder gets a higher value relative to the initial impact. Figure 24(b) shows that after the slamming peak ( $a$), the pressure inside the pocket drops to atmospheric levels, resulting in a very small force acting on the cylinder ( $b$). The pressure drop happens due to the trapped air expansion that allows air to escape from the small gap between the cylinder and the water. Following the pressure cyclic behaviour, the pressure builds up and drops again, which causes the second slamming peak ( $c$) and force minima ( $d$). At $tV/D=0.0267$, the gap between the cylinder and the water completely closes, forming the first air pocket, and during the impact with the third wave crest the second air pocket begins to form, resulting in the highest slamming peak ( $e$). Figure 24(e) shows that the pressure over the entire impact region of the cylinder is high. This extended high-pressure region with a length of $x/D \approx 0.17$ is created by the air pockets according to figure 25. The pressure inside the first air pocket falls to a subatmospheric level at $tV/D=0.0349$. Water pressure decreases close to the air pocket as a result of the air pocket negative relative pressure. The length of the negative pressure region is about $x/D \approx 0.2$. As a result, the force on the cylinder becomes negative ( $\,f$). For $tV/D>0.0349$ the interaction with the further crests continues and the transient oscillations from the initial impact and oscillations of the smaller air pockets decay until, from $tV/D>0.1$, the time series mainly oscillates with the largest pocket natural frequency with decreasing amplitude. Pressure fields for time in this range are shown in figure 24(g–i).
Slamming coefficient time series for the impact on standing wave crest for  $\lambda /D=0.0814$, $0.15 D/VT = 0.514$ and three standing wave amplitudes.

Pressure field for the cylinder impact on a standing wave crest for  $\lambda /D=0.0814$, $0.15 D/VT = 0.514$ and $A/D=0.025$: (a) $tV/D=0.0076$, (b) $tV/D=0.0122$, (c) $tV/D=0.0133$, (d) $tV/D=0.0174$, (e) $tV/D=0.0267$, ( f) $tV/D=0.0349$, (g) $tV/D=0.1312$, (h) $tV/D=0.1398$ and (i) $tV/D=0.1475$.

Pressure distribution along the cylinder for the cylinder impact on a standing wave crest for  $\lambda /D=0.0814$, $0.15 D/VT = 0.514$ and $A/D=0.025$.

Figure 23 shows that the magnitude of the slamming peaks decreases as the wave amplitude increases. As for the intermediate crest impact, increasing the wave amplitude reduces the wetted length and the rate of change of the wetted length, which can explain this relationship between wave amplitude and the slamming peak magnitudes. Further, the frequency of the oscillations for  $tV/D>0.05$ is larger than that of the single air pocket. The frequency of the oscillations is 168, 157 and 147 Hz for each standing wave amplitude, and is the largest for the smallest wave amplitude. This can be explained by the smaller pocket size for the smaller wave amplitude. Therefore, larger standing wave amplitude leads to smaller-amplitude oscillations with lower frequency.
For the case of trough-centred impact on the same standing wave condition, the slamming coefficient time series is shown in figure 26. Unlike the crest impact, the first air pocket forms at the instant of the first touchdown, making the first slamming peak ( $a$) at $tV/D=-0.0015$ (figure 27a). Peak ( $b$), ( $\ast$) and the local minima ( $\ast\ast$) are created by pressure transient oscillations inside the air pocket in the same way as for the crest impact.
Slamming coefficient time series for the impact on standing wave trough for  $\lambda /D=0.0814$, $0.15 D/VT = 0.514$ and three standing wave amplitudes.

Pressure field for the cylinder impact on a standing wave trough for  $\lambda /D=0.0814$, $0.15 D/VT = 0.514$ and $A/D=0.025$ at different time instants: (a) $tV/D=-0.0015$, (b) $tV/D=0.0001$, (c) $tV/D=0.0171$, (d) $tV/D=0.0238$, (e) $tV/D=0.0359$, ( f) $tV/D=0.0445$, (g) $tV/D=0.1165$, (h) $tV/D=0.1258$ and (i) $tV/D=0.1345$.

At  $tV/D=0.0171$ the impact on the second wave crest and associated compression of the second air pocket lead to a large pressure (figure 27c). For this time instant figure 28 shows that the pressure is evenly distributed in the entire impact region ( $x/D<0.13$) and ramps up along the wetted length of the cylinder. The peak of the pressure coefficient is $C_p \approx 13$. Although this value is smaller than $C_{p} \approx 20$ at $tV/D=-0.0015$, the width of the high-pressure zone for $tV/D=0.0171$ is about three times that for $tV/D=-0.0015$. As a result, peak ( $c$) is larger than peak ( $a$). Another peak before ( $c$) is also visible in the time series, which is caused by the transient oscillations of the first air pocket. Peak ( $e$) and minima ( $\,f$) are analogous to the force peak ( $e$) and minima ( $\,f$) in the crest impact. Figures 27(e) and 28 show that at $tV/D=0.0359$, the pressure has an evenly high value over the entire impact zone when the second air pocket is fully closed and the third air pocket starts to form. This wide high-pressure zone creates a peak ( $e$), which is the highest peak in the slamming coefficient time series. The minimum slamming coefficient ( $\,f$) happens following the pressure oscillation inside the air pockets, which creates a subatmospheric pressure zone on the cylinder that causes a negative force on the cylinder. As the cylinder submerges more into the water, a new air pocket does not develop and the slamming coefficient time series mainly oscillates with the natural frequency of the largest air pocket trapped. The spectral analysis of the slamming time series for $A/D=0.025$ shows that the frequency of the oscillations for $tV/D>0.1$ is about $137$ Hz. For a simplified geometry of the air pocket to a quarter-elliptic shape, using the Abrahamsen & Faltinsen (Reference Abrahamsen and Faltinsen2012) method, the frequency of the air pocket is $145\,$Hz which is approximately $6\,\%$ larger than our numerical result. The relationship between the slamming peaks and standing wave amplitude is similar to that for the crest impact. The magnitude of the slamming peak decreases as the wave amplitude increases. The size of the air pockets, the rate at which it changes and the wetted length are all potential contributing factors.
Pressure distribution along the cylinder for the cylinder impact on a standing wave trough for  $\lambda /D=0.0814$, $0.15 D/VT = 0.514$ and $A/D=0.025$ at different time instants.

7. Conclusions
Inspired by lateral perturbations of nominal two-dimensional impacts on vertical cylinders, we have investigated the generic two-dimensional problem of cylinder entry on a non-flat water surface. This was achieved through physical experiments with impact on a standing wave for both crest and trough impacts for intermediate wavelength to cylinder diameter ratio  $0.643<\lambda /D<0.9$ and amplitude to diameter ratio $0.015< A/D<0.025$. The slamming wave load relative to the flat impact was found to be smaller for crests and larger for troughs. The largest slamming loads occurred at trough impact, where the surface curvature is close to that of the cylinder and noticeable air entrapment takes place. Under these conditions, we found a slamming coefficient up to $C_s=30$. For crest impacts, in the observed parameter range, the slamming coefficient is smaller than that for flat-water impact, and it can be as low as $C_s\approx 2.5$. The crest slamming coefficient increases with the relative $\lambda /D$ and decreases with the relative amplitude $A/D$. This finding was related to the spikiness of high crests, which lead to the smallest initial wetted length and a smaller growth rate of the wetted area. For the crests of large steepness, the maximum slamming load can occur after the initial impact, which is different from impacts on flat water.
The slamming coefficient for the trough impact in the observed parameter range was higher than that for the flat-water impact. As  $\lambda /D$ decreases or $A/D$ increases, the slamming coefficient increases. This relationship can be explained by the ratio between the local instantaneous water surface curvature at the point and moment of impact and the cylinder curvature, which becomes closer to one for shorter wavelengths and higher amplitudes. Consequently, the wetted length grows at a faster rate at the initial impact time.
These effects were successfully reproduced by a numerical model and an analytical extension of the von Kármán and Wagner methods for cylinder impacts on surfaces with curvature. Further, the numerical model was used to quantify the slamming peak reduction from the three-dimensional effect in the physical set-up.
As a last part of the study, the physical experiment was extended numerically to the short-wavelength range of  $0.05<\lambda /D<0.4$. Our numerical results here demonstrate how entrapment of air pockets can lead to oscillatory slamming loads with subatmospheric pressures. Further, for short wavelengths, the impact on subsequent crests during the cylinder entry can lead to multiple slamming peaks and the formation of multiple air pockets with a peak of up to $C_s\approx 10$, for our results. The amplitude and frequency of the oscillations were found to decrease for increasing standing wave amplitude, linked to the size of the trapped air pockets.
The effects reported in this work can lead to strong variability in real impacts where the lateral perturbations are stochastic. The study thereby links the generic effects of two-dimensional cylinder impact on standing waves to the strong variabilities of wave impacts, which is of high interest for engineering design.
Acknowledgements
This research was supported by a PhD grant (A.M.) in relation to the Nordic Offshore Wind Research and Innovation Centre (NOWRIC) at DTU, NTNU and SINTEF. This support along with the careful assistance of the technicians at the Ladertanken laboratory at NTNU is gratefully acknowledged.
Declaration of interests
The authors report no conflict of interest.
Appendix A
The force transducer output signals contain noise and structural vibration of the rig. To facilitate data processing, we subtracted the noise, the dynamic response of the rig and the hydrostatic force from the raw force time series. A potentiometer recorded the position of the cylinder at any time during the water entry. The position data were used to calculate the submerged volume and, subsequently, the hydrostatic force. The dynamic force associated with the rig mass can be determined by multiplying the acceleration data from the accelerometer attached to the force transducer by the rig mass. By subtracting these two time series from the raw force data, a residual time series consisting of noise and the hydrodynamic load remained. In figure 29(a) a sample raw force signal (blue time series) and residual force after processing (red time series) are shown. The residual time series has a wide range of frequencies, and it is evident that noise and structural vibrations significantly affect the quality of results. To remove the noise a filter with appropriate cut-off frequency must be applied on the results.
Pre-processing and filtering the experimental data, for flat-water impact. (a) Raw and residual force time series. (b) Spectrogram of force time series. (c) Effect of cut-off frequency on force time series.

In figure 29(b) the short-time Fourier transform of  $F_{res}$ is shown. Before the impact ( $tV/D<0$), there is a high-energy region with a normalized frequency of $0.2< f/\frac {1}{2} f_s<0.4$. Since no impact has happened yet, we can deduce that these frequencies are related to the higher modes of rig vibration. These vibration modes exist until $tV/D \approx 1$, when the cylinder is in parking mode. At the impact time ( $tV/D=0$), most of the impact energy is concentrated in the frequency range of $0< f/\frac {1}{2} f_s<0.2$. Since for $f/\frac {1}{2} f_s>0.4$ the impact energy is low, and for $0.2< f/\frac {1}{2} f_s<0.4$ the rig vibrates with its natural modes, we expect that a suitable filter should have a cut-off frequency $f/\frac {1}{2} f_s \approx 0.2$.
For this purpose, a low-pass Butterworth filter was chosen, and the effect of cut-off frequency on the force time series is studied in figure 29(c). The cut-off frequency was normalized as  $\tilde {f}_c=f_{cutoff}/\frac {1}{2}f_s$. For $\tilde {f}_c=0.4$ and 0.2, the filter is unable to remove the structural modes; however, the higher-frequency noise is filtered. Filter $\tilde {f}_c=0.2$ could successfully remove the structural mode contribution, although the slamming peak is reduced by about $16\,\%$ due to the filtering. The filters with a smaller cut-off frequency (i.e. $\tilde {f}_c=0.05$) would flatten the slamming peak and reduce the magnitude of the slamming. Therefore, a filter with a cut-off frequency of $\tilde {f}_c=0.2$ was chosen for the filtering of the experimental data in this paper.


 Open access