


I. Introduction
The rapid expansion of the options market, marked by explosive growth in contract volumes, underscores its increasing prominence in the financial landscape.Footnote 1 This surge in market activity has been paralleled by a growing academic interest in understanding the characteristics explaining the cross-section of individual equity option returns. Crucially, the options market offers a unique setting for analyzing cross-sectional return relationships. As outlined in the seminal work by Garleanu, Pedersen, and Poteshman (Reference Garleanu, Pedersen and Poteshman2009), the options market is characterized by market makers as central liquidity providers and the effects of end-user demand. Market makers’ inability to hedge their positions perfectly incurs risks that require compensation. At the same time, end-user demand leads to return anomalies when demand coincides with certain option characteristics and market makers adjust prices to counteract the effect of order imbalances (Muravyev (Reference Muravyev2016), Hollstein and Wese Simen (Reference Hollstein and Wese Simen2024)).
Based on these channels, a vast set of option return anomalies has been discovered, a phenomenon referred to as the “factor zoo” in the stock universe (Cochrane (Reference Cochrane2011)). Given the multitude of these candidate factors for the option stochastic discount factor (SDF), our study utilizes the Bayesian model averaging (BMA) approach introduced by Bryzgalova, Huang, and Julliard (Reference Bryzgalova, Huang and Julliard2023a) to estimate an SDF from a large cross-section of potentially relevant traded and non-traded factors. This approach is especially useful, as it addresses the traditional weak points of the generalized method of moments (GMM), namely the presence of weak and level factors, while efficiently selecting true pricing sources. For our empirical analysis over the sample period from 1996 to 2022, we assemble a broad collection of factors to price the cross-section of delta-hedged equity options, including 30 traded option factors proposed by the option literature, 15 non-traded factors, and six widely used stock market factors.
We identify several key option factors with high posterior probabilities of being included in the SDF that prices options. The BMA-SDF selects i) the difference between implied and realized volatility, ii) option return momentum, and iii) jump risk as the most important characteristics for all imposed levels of shrinkage. Nevertheless, we also provide evidence that the true SDF is dense rather than sparse. First, the average model dimension is large for the models chosen by the BMA approach. Second, no dominant model arises. Rather, there are many models with similar posterior probabilities. Third, when compared with low-dimensional factor models, the BMA-SDF approach demonstrates superior out-of-sample pricing performance, even though some benchmark models share the most likely to be included factors i) to iii), providing evidence that other factors exhibit relevant pricing information too. Only an SDF based on the principal components (PCs) of the set of assets yields comparable pricing performance. However, contrary to the results of Kozak, Nagel, and Santosh (Reference Kozak, Nagel and Santosh2020) for the stock market, cross-validation yields a dense SDF of latent option factors. Twenty-three out of 55 PCs are assigned non-zero risk prices. Our results for the pricing performance hold for different cross-sections of test assets and over time when we estimate the BMA-SDF using an expanding window approach and evaluate its pricing ability over the subsequent year.
Next, we extensively study the economic properties of the option BMA-SDF over time. The SDF exhibits a clear business cycle pattern, characterized by spikes and subsequent drops at the onset of economic downturns. This cyclical pattern is not as pronounced as in the corporate bond market but is more similar to the stock SDF. Crucially, the option BMA-SDF is noticeably more volatile during the 2020s, following the outbreak of the COVID-19 pandemic, than it was during the global financial crisis (GFC). We link this observation to the surge in retail activity and options volume overall, starting in 2020, which resulted in an unprecedentedly high variance risk premium (VRP) and return volatility of delta-hedged options. The relative emphasis of the 2020s by the Option BMA-SDF also appears to contribute to its superior pricing performance, as low-dimensional pricing models overly stress the relative importance of the GFC for the options market. Moreover, we demonstrate the strong explanatory power of factor returns using the BMA-SDF’s conditional measures. This finding suggests considerable predictability in some option risk premia related to dealers’ hedging risk, whereas factor returns more closely linked to mispricing tend to be less predictable.
In additional analyses, we construct a retail trading proxy using signed volumes from four NASDAQ exchanges. Thereby, we accommodate the trend of rising retail shares in the options market (see, e.g., Bryzgalova, Pavlova, and Sikorskaya (Reference Bryzgalova, Pavlova and Sikorskaya2023b), Bogousslavsky (Reference Bogousslavsky2021)). When estimated over the subsample of high-retail options, the BMA approach more clearly identifies factors as part of the SDF. This insight complements the notion that end-user demand, which has been more heavily driven by retail traders in recent years, impacts mispricing and potentially even dealer risk through order imbalances in the options market. Finally, to account for the high transaction costs of options compared to other asset classes (e.g., Muravyev and Pearson (Reference Muravyev and Pearson2020), Goyal and Saretto (Reference Goyal and Saretto2024)), we compute factor and test asset returns net of transaction costs. We thereby address the critique by Detzel, Novy-Marx, and Velikov (Reference Detzel, Novy-Marx and Velikov2023) of paper profits obscuring true risk premia. Our results indicate that option momentum and the difference between implied and realized volatility capture genuine risk premia beyond the limits to arbitrage. In contrast, the jump risk factor vanishes as a likely candidate of the true SDF due to trading on options with high transaction costs.
Related Literature
First and foremost, our article relates to Bryzgalova et al. (Reference Bryzgalova, Huang and Julliard2023a), who introduce a Bayesian method for model estimation, selection, and averaging of traded and non-traded factors, allowing for both weak and strong factors. The crucial result of the authors’ empirical analysis is that a dense space of factors characterizes the SDF for stock returns. Hence, the BMA-SDF serves as the optimal approach to aggregate factors and thereby spans the “true” SDF of equity returns characterized by a multitude of factors that proxy for similar risks. Dickerson, Julliard, and Mueller (Reference Dickerson, Julliard and Mueller2024) implement the BMA-SDF approach to jointly price corporate bonds and stocks and document a dense co-pricing SDF. To our knowledge, we are the first to apply Bayesian methods in the context of assessing linear factor models for individual equity options. In line with the findings for stocks and bonds, we find a dense factor structure of the SDF in the options market and a strong pricing performance by the BMA-SDF compared to reduced-form benchmark models. Thus, we also contribute to the emerging literature on complexity in empirical asset pricing. Kelly, Malamud, and Zhou (Reference Kelly, Malamud and Zhou2024) document the benefits of using complex models to predict the aggregate stock market return. Didisheim, Ke, Kelly, and Malamud (Reference Didisheim, Ke, Kelly and Malamud2024) extend the previous findings to stock factor models. Specifically, the latter authors find that stock returns are driven by a large number of factors, rather than a low-dimensional factor structure.
Our article also contributes to previous work on single characteristics related to the cross-section of option returns. Two primary categories of characteristics have been identified. First, characteristics related to market makers’ hedging capabilities and incurred risks drive option returns, as these liquidity providers require compensation for the higher hedging costs they incur. For instance, Cao and Han (Reference Cao and Han2013) document that options on stocks with high idiosyncratic volatility yield lower returns as market makers must more frequently adjust their delta-hedge positions. Likewise, Tian and Wu (Reference Tian and Wu2023) emphasize the importance of delta-hedging costs, volatility risk, and jump risk. Christoffersen, Goyenko, Jacobs, and Karoui (Reference Christoffersen, Goyenko, Jacobs and Karoui2018) find a positive liquidity premium for single-name options with high spreads to compensate market makers that are, on average, long in these contracts. On the other hand, characteristics linked to end-user demand also affect option prices. For instance, Frazzini and Pedersen (Reference Frazzini and Pedersen2022) show that investors’ willingness to pay a premium for options with greater embedded leverage leads to lower returns. Furthermore, behavioral factors—such as gambling preferences (Byun and Kim (Reference Byun and Kim2016)) and limited investor attention (Boulatov, Eisdorfer, Goyal, and Zhdanov (Reference Boulatov, Eisdorfer, Goyal and Zhdanov2022))—result in option mispricing.Footnote 2 Our contribution lies in consolidating these diverse option factors while avoiding fixing the model dimensionality of the SDF a priori or pre-selecting potential candidate factors. The Bayesian framework of Bryzgalova et al. (Reference Bryzgalova, Huang and Julliard2023a) relies exclusively on the data to select and aggregate candidate factors that most likely price the cross-section of equity options while discarding weak factors.
Lastly, this article contributes to recent work that aims to reduce the dimensionality of the option factor set. Horenstein, Vasquez, and Xiao (Reference Horenstein, Vasquez and Xiao2025) and Tian and Wu (Reference Tian and Wu2023) follow the long tradition established by Fama and French (Reference Fama and French1993) and attempt to explain the cross-section of option returns using low-dimensional, linear models of observable factors. In contrast, no pre-selection of factors is needed within the BMA approach. The BMA-SDF outperforms any of the proposed low-dimensional factor models, in line with our finding that the options factor space is dense. Closest to our work, Goyal and Saretto (Reference Goyal and Saretto2024) use an instrumented principal component analysis to reduce the dimensionality of the factor space and construct three latent factors that can explain the returns of 46 option trading strategies using an IPCA (instrumented principal component analysis) model. The BMA approach has three key advantages. First, it can handle non-traded factors, which are potentially relevant parts of the SDF. Second, risk prices are assigned to observable factors rather than latent ones, considerably facilitating economic interpretation. Finally, no choice needs to be made regarding the number of factors, as the SDF dimensionality follows from the data.
II. Methodology
We start by outlining the methodology of Bryzgalova et al. (Reference Bryzgalova, Huang and Julliard2023a) and Dickerson et al. (Reference Dickerson, Julliard and Mueller2024) to provide a Bayesian analysis of linear stochastic discount factor models in the single-name equity options market. For a detailed treatment, we refer the reader to Bryzgalova et al. (Reference Bryzgalova, Huang and Julliard2023a) and Dickerson et al. (Reference Dickerson, Julliard and Mueller2024).
To establish notation, let
$ \unicode{x1D53C}\left[X\right]\equiv {\mu}_X $
 be the unconditional expectation of a random variable
$ X $
be the unconditional expectation of a random variable
$ X $
 . Furthermore, let
$ {\mathbf{1}}_N $
. Furthermore, let
$ {\mathbf{1}}_N $
 (
$ {\mathbf{0}}_N $
(
$ {\mathbf{0}}_N $
 ) denote an
$ N $
) denote an
$ N $
 -dimensional vector of ones (zeros).
$ {\boldsymbol{R}}_t={\left({R}_{1,t},\dots, {R}_{N,t}\right)}^{\top}\in {\mathrm{\mathbb{R}}}^N $
-dimensional vector of ones (zeros).
$ {\boldsymbol{R}}_t={\left({R}_{1,t},\dots, {R}_{N,t}\right)}^{\top}\in {\mathrm{\mathbb{R}}}^N $
 represent the time
$ t $
represent the time
$ t $
 excess or long-short portfolio returns of
$ N $
excess or long-short portfolio returns of
$ N $
 test assets. Next, we consider a set of
$ K={K}_1+{K}_2 $
test assets. Next, we consider a set of
$ K={K}_1+{K}_2 $
 factors
$ {\boldsymbol{f}}_t $
factors
$ {\boldsymbol{f}}_t $
 , which consists of tradable (
$ {\boldsymbol{f}}_t^{(1)}\in {\mathrm{\mathbb{R}}}^{K_1} $
, which consists of tradable (
$ {\boldsymbol{f}}_t^{(1)}\in {\mathrm{\mathbb{R}}}^{K_1} $
 ) and non-tradable factors (
$ {\boldsymbol{f}}_t^{(2)}\in {\mathrm{\mathbb{R}}}^{K_2} $
) and non-tradable factors (
$ {\boldsymbol{f}}_t^{(2)}\in {\mathrm{\mathbb{R}}}^{K_2} $
 ). We consider a linear SDF defined as
$ {M}_t=1-{\left({\boldsymbol{f}}_t-\unicode{x1D53C}\left[{\boldsymbol{f}}_t\right]\right)}^{\top }{\boldsymbol{\lambda}}_{\boldsymbol{f}} $
). We consider a linear SDF defined as
$ {M}_t=1-{\left({\boldsymbol{f}}_t-\unicode{x1D53C}\left[{\boldsymbol{f}}_t\right]\right)}^{\top }{\boldsymbol{\lambda}}_{\boldsymbol{f}} $
 , where
$ {\boldsymbol{\lambda}}_{\boldsymbol{f}}\in {\mathrm{\mathbb{R}}}^K $
, where
$ {\boldsymbol{\lambda}}_{\boldsymbol{f}}\in {\mathrm{\mathbb{R}}}^K $
 is the vector of factor risk prices. Under no-arbitrage,
$ \unicode{x1D53C}\left[{M}_t{\boldsymbol{R}}_t\right]={\mathbf{0}}_N $
is the vector of factor risk prices. Under no-arbitrage,
$ \unicode{x1D53C}\left[{M}_t{\boldsymbol{R}}_t\right]={\mathbf{0}}_N $
 , and expected returns are expressed as
$ {\boldsymbol{\mu}}_{\boldsymbol{R}}\equiv \unicode{x1D53C}\left[{\boldsymbol{R}}_t\right]={\boldsymbol{C}}_{\boldsymbol{f}}{\boldsymbol{\lambda}}_{\boldsymbol{f}} $
, and expected returns are expressed as
$ {\boldsymbol{\mu}}_{\boldsymbol{R}}\equiv \unicode{x1D53C}\left[{\boldsymbol{R}}_t\right]={\boldsymbol{C}}_{\boldsymbol{f}}{\boldsymbol{\lambda}}_{\boldsymbol{f}} $
 with
$ {\boldsymbol{C}}_{\boldsymbol{f}} $
with
$ {\boldsymbol{C}}_{\boldsymbol{f}} $
 being the covariance matrix between
$ {\boldsymbol{R}}_t $
being the covariance matrix between
$ {\boldsymbol{R}}_t $
 and
$ {\boldsymbol{f}}_t $
and
$ {\boldsymbol{f}}_t $
 . Define
$ \boldsymbol{C}=\left({\mathbf{1}}_N,{\boldsymbol{C}}_{\boldsymbol{f}}\right),{\boldsymbol{\lambda}}^{\top }=\left({\lambda}_c,{{\boldsymbol{\lambda}}_{\boldsymbol{f}}}^{\top}\right) $
. Define
$ \boldsymbol{C}=\left({\mathbf{1}}_N,{\boldsymbol{C}}_{\boldsymbol{f}}\right),{\boldsymbol{\lambda}}^{\top }=\left({\lambda}_c,{{\boldsymbol{\lambda}}_{\boldsymbol{f}}}^{\top}\right) $
 with
$ {\lambda}_c $
with
$ {\lambda}_c $
 denoting scalar average mispricing, and
$ \boldsymbol{\alpha} \in {\mathrm{\mathbb{R}}}^N $
denoting scalar average mispricing, and
$ \boldsymbol{\alpha} \in {\mathrm{\mathbb{R}}}^N $
 being a vector of pricing errors in excess of
$ {\lambda}_c $
being a vector of pricing errors in excess of
$ {\lambda}_c $
 . Then, the market prices of risk,
$ {\boldsymbol{\lambda}}_{\boldsymbol{f}} $
. Then, the market prices of risk,
$ {\boldsymbol{\lambda}}_{\boldsymbol{f}} $
 , can be estimated by running the following cross-sectional regression:

We follow Bryzgalova et al. (Reference Bryzgalova, Huang and Julliard2023a) and Dickerson et al. (Reference Dickerson, Julliard and Mueller2024), specifying prior and posterior probabilities for factors, returns, and the average pricing error. Also, we require that the tradable factors price themselves. Hence,
$ {\boldsymbol{f}}_t^{(1)}\subset {\boldsymbol{R}}_t $
 and the union of factors and returns is given by
$ {\boldsymbol{Y}}_t\equiv {\left({\boldsymbol{R}}_t^{\top },{\boldsymbol{f}}_t^{(2),\top}\right)}^{\top },{\boldsymbol{Y}}_t\in {\mathrm{\mathbb{R}}}^{N+{K}_2} $
and the union of factors and returns is given by
$ {\boldsymbol{Y}}_t\equiv {\left({\boldsymbol{R}}_t^{\top },{\boldsymbol{f}}_t^{(2),\top}\right)}^{\top },{\boldsymbol{Y}}_t\in {\mathrm{\mathbb{R}}}^{N+{K}_2} $
 . We model
$ {\boldsymbol{Y}}_t $
. We model
$ {\boldsymbol{Y}}_t $
 as multivariate Gaussian with mean
$ {\boldsymbol{\mu}}_{\boldsymbol{Y}} $
as multivariate Gaussian with mean
$ {\boldsymbol{\mu}}_{\boldsymbol{Y}} $
 and variance matrix
$ {\varSigma}_{\boldsymbol{Y}} $
and variance matrix
$ {\varSigma}_{\boldsymbol{Y}} $
 . Using the conventional diffuse prior
$ \pi \left({\boldsymbol{\mu}}_{\boldsymbol{Y}},{\varSigma}_{\boldsymbol{Y}}\right)\propto {\left|{\varSigma}_{\boldsymbol{Y}}\right|}^{-\frac{p+1}{2}} $
. Using the conventional diffuse prior
$ \pi \left({\boldsymbol{\mu}}_{\boldsymbol{Y}},{\varSigma}_{\boldsymbol{Y}}\right)\propto {\left|{\varSigma}_{\boldsymbol{Y}}\right|}^{-\frac{p+1}{2}} $
 for the time-series parameters (
$ {\boldsymbol{\mu}}_{\boldsymbol{Y}},{\varSigma}_{\boldsymbol{Y}} $
for the time-series parameters (
$ {\boldsymbol{\mu}}_{\boldsymbol{Y}},{\varSigma}_{\boldsymbol{Y}} $
 ) yields normal-inverse Wishart posteriors (equations (6) and (7) in Bryzgalova et al. (Reference Bryzgalova, Huang and Julliard2023a)). Under the assumption of average pricing errors
$ \boldsymbol{\alpha} $
) yields normal-inverse Wishart posteriors (equations (6) and (7) in Bryzgalova et al. (Reference Bryzgalova, Huang and Julliard2023a)). Under the assumption of average pricing errors
$ \boldsymbol{\alpha} $
 following a normal distribution with mean-zero and variance matrix
$ {\sigma}^2{\varSigma}_{\boldsymbol{R}} $
following a normal distribution with mean-zero and variance matrix
$ {\sigma}^2{\varSigma}_{\boldsymbol{R}} $
 , the cross-sectional likelihood is given as

where the expected risk premia,
$ {\boldsymbol{\mu}}_{\boldsymbol{R}} $
 , and the factor loadings,
$ \boldsymbol{C}=\left({\mathbf{1}}_N,{\boldsymbol{C}}_{\boldsymbol{f}}\right) $
, and the factor loadings,
$ \boldsymbol{C}=\left({\mathbf{1}}_N,{\boldsymbol{C}}_{\boldsymbol{f}}\right) $
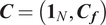 constitute “data” in equation (2). As our goal is to arrive at a posterior distribution for different SDF models, Bryzgalova et al. (Reference Bryzgalova, Huang and Julliard2023a) and Dickerson et al. (Reference Dickerson, Julliard and Mueller2024) specify the following prior for the risk prices. Let
$ {\boldsymbol{\gamma}}=\left({\gamma}_0,\dots, {\gamma}_K\right) $
constitute “data” in equation (2). As our goal is to arrive at a posterior distribution for different SDF models, Bryzgalova et al. (Reference Bryzgalova, Huang and Julliard2023a) and Dickerson et al. (Reference Dickerson, Julliard and Mueller2024) specify the following prior for the risk prices. Let
$ {\boldsymbol{\gamma}}=\left({\gamma}_0,\dots, {\gamma}_K\right) $
 , where
$ {\gamma}_j\in \left\{0,1\right\} $
, where
$ {\gamma}_j\in \left\{0,1\right\} $
 , be a vector of binary variables for denoting a selection of factors for the SDF (i.e.,
$ {\gamma}_j=1 $
, be a vector of binary variables for denoting a selection of factors for the SDF (i.e.,
$ {\gamma}_j=1 $
 if the
$ j $
if the
$ j $
 th factor is included in the SDF, otherwise
$ {\gamma}_j=0 $
th factor is included in the SDF, otherwise
$ {\gamma}_j=0 $
 ). Bryzgalova et al. (Reference Bryzgalova, Huang and Julliard2023a) propose to use a continuous spike-and-slab mixture prior instead of flat priors. They motivate this choice by the possible presence of weak factors, which can render the definition of posterior probabilities undefinable for flat priors. Specifically, the prior
$ \pi \left(\boldsymbol{\lambda}, {\sigma}^2,\boldsymbol{\gamma}, \boldsymbol{\omega} \right) $
). Bryzgalova et al. (Reference Bryzgalova, Huang and Julliard2023a) propose to use a continuous spike-and-slab mixture prior instead of flat priors. They motivate this choice by the possible presence of weak factors, which can render the definition of posterior probabilities undefinable for flat priors. Specifically, the prior
$ \pi \left(\boldsymbol{\lambda}, {\sigma}^2,\boldsymbol{\gamma}, \boldsymbol{\omega} \right) $
 is given as

where
$ {\lambda}_j\mid {\gamma}_j,{\sigma}^2\sim \mathcal{N}\left(0,r\left({\gamma}_j\right){\psi}_j{\sigma}^2\right) $
 . The term
$ r\left({\gamma}_j\right) $
. The term
$ r\left({\gamma}_j\right) $
 introduces the spike-and-slab prior: If the
$ j $
introduces the spike-and-slab prior: If the
$ j $
 th factor should be included in the SDF,
$ r\left({\gamma}_j=1\right)=1 $
th factor should be included in the SDF,
$ r\left({\gamma}_j=1\right)=1 $
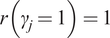 and the prior distribution for
$ {\lambda}_j $
and the prior distribution for
$ {\lambda}_j $
 is diffuse with mean zero. On the other hand, if the
$ j $
is diffuse with mean zero. On the other hand, if the
$ j $
 th factor should not be included in the SDF,
$ r\left({\gamma}_j=0\right)=r\ll 1 $
th factor should not be included in the SDF,
$ r\left({\gamma}_j=0\right)=r\ll 1 $
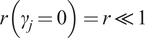 , and the prior is concentrated at zero.
$ {\psi}_j $
, and the prior is concentrated at zero.
$ {\psi}_j $
 penalizes factors that are likely caused by identification failure and is determined by
$ {\psi}_j=\psi \times {\tilde{\boldsymbol{\rho}}}_j^{\top }{\tilde{\boldsymbol{\rho}}}_j $
penalizes factors that are likely caused by identification failure and is determined by
$ {\psi}_j=\psi \times {\tilde{\boldsymbol{\rho}}}_j^{\top }{\tilde{\boldsymbol{\rho}}}_j $
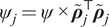 with
$ {\tilde{\boldsymbol{\rho}}}_j\equiv {\boldsymbol{\rho}}_j-\left(\frac{1}{N}{\sum}_{i=1}^N\;{\rho}_{i,j}\right)\times {\mathbf{1}}_N $
with
$ {\tilde{\boldsymbol{\rho}}}_j\equiv {\boldsymbol{\rho}}_j-\left(\frac{1}{N}{\sum}_{i=1}^N\;{\rho}_{i,j}\right)\times {\mathbf{1}}_N $
 . The vector
$ {\boldsymbol{\rho}}_j\in {\mathrm{\mathbb{R}}}^N $
. The vector
$ {\boldsymbol{\rho}}_j\in {\mathrm{\mathbb{R}}}^N $
 contains the correlation coefficients between factor
$ j $
contains the correlation coefficients between factor
$ j $
 and the test assets, and
$ \psi \in {\mathrm{\mathbb{R}}}_{+} $
and the test assets, and
$ \psi \in {\mathrm{\mathbb{R}}}_{+} $
 is a tuning parameter controlling the degree of shrinkage across all factors. Also,
$ \psi $
is a tuning parameter controlling the degree of shrinkage across all factors. Also,
$ \psi $
 economically relates to the expected prior Sharpe ratio (SR) achievable with all factors. It holds that
$ {\unicode{x1D53C}}_{\pi}\left[{SR}_{\boldsymbol{f}}^2|{\sigma}^2\right]=\frac{1}{2}{\psi \sigma}^2{\sum}_{k=1}^K\;{\tilde{\boldsymbol{\rho}}}_k^{\top }{\tilde{\boldsymbol{\rho}}}_k $
economically relates to the expected prior Sharpe ratio (SR) achievable with all factors. It holds that
$ {\unicode{x1D53C}}_{\pi}\left[{SR}_{\boldsymbol{f}}^2|{\sigma}^2\right]=\frac{1}{2}{\psi \sigma}^2{\sum}_{k=1}^K\;{\tilde{\boldsymbol{\rho}}}_k^{\top }{\tilde{\boldsymbol{\rho}}}_k $
 for
$ r\to 0 $
for
$ r\to 0 $
 . Finally,
$ \pi \left(\boldsymbol{\omega} \right) $
. Finally,
$ \pi \left(\boldsymbol{\omega} \right) $
 in equation (3) serves two purposes: It yields a way to sample across the space of all potential models, and it incorporates the prior on the sparsity of the true model. Bryzgalova et al. (Reference Bryzgalova, Huang and Julliard2023a) and Dickerson et al. (Reference Dickerson, Julliard and Mueller2024) use

where
$ {a}_{\omega } $
 and
$ {b}_{\omega } $
and
$ {b}_{\omega } $
 denote hyperparameters of the Beta distribution. This system yields well-defined posterior conditional distributions for all model parameters. We utilize Gibbs sampling to sample across the space of all models.Footnote
3 Averaging over sampled models and risk prices then yields the most likely SDF given the data, as well as posterior means and intervals for all other quantities of interest. (Bryzgalova et al. (Reference Bryzgalova, Huang and Julliard2023a)). We focus on the GLS formulations when performing the Bayesian estimations, let the Markov chain run for 500,000 steps in each setting, and calculate results after dropping the first 50,000 steps. Further, non-informative prior beliefs are employed about factor inclusion, drawing factor inclusion probabilities from a
$ Beta\left(1,1\right) $
denote hyperparameters of the Beta distribution. This system yields well-defined posterior conditional distributions for all model parameters. We utilize Gibbs sampling to sample across the space of all models.Footnote
3 Averaging over sampled models and risk prices then yields the most likely SDF given the data, as well as posterior means and intervals for all other quantities of interest. (Bryzgalova et al. (Reference Bryzgalova, Huang and Julliard2023a)). We focus on the GLS formulations when performing the Bayesian estimations, let the Markov chain run for 500,000 steps in each setting, and calculate results after dropping the first 50,000 steps. Further, non-informative prior beliefs are employed about factor inclusion, drawing factor inclusion probabilities from a
$ Beta\left(1,1\right) $
 distribution (i.e., setting
$ {a}_{\omega }={b}_{\omega }=1 $
distribution (i.e., setting
$ {a}_{\omega }={b}_{\omega }=1 $
 in equation (4)). This results in ex ante model probabilities of
$ {\frac{1}{2}}^{51}\sim 4.44\times {10}^{-16} $
in equation (4)). This results in ex ante model probabilities of
$ {\frac{1}{2}}^{51}\sim 4.44\times {10}^{-16} $
 . Further, we show our results for multiple levels of shrinkage
$ \psi $
. Further, we show our results for multiple levels of shrinkage
$ \psi $
 . We induce these levels by initiating the BMA-SDF estimation for different prior annualized SRs ranging from 5% to 95% of the ex post maximum SR achievable with the set of in-sample test assets.
III. Data
Our primary data source for option prices and characteristics is the OptionMetrics Ivy database, which contains historical option prices for U.S. single-name equity options. Our sample period is from January 1996 to December 2022. Underlying stock prices and returns are from CRSP. Additional characteristics for the underlying stocks are from Chen and Zimmermann (Reference Chen and Zimmermann2022) and Jensen, Kelly, and Pedersen (Reference Jensen, Kelly and Pedersen2023).Footnote 4 We match CRSP with OptionMetrics using the linking algorithm provided by WRDS. We take daily risk-free rates from Kenneth French’s online data library.Footnote 5 Monthly risk-free rates are from OptionMetrics. We retain only underlyings that are common stocks trading on the NYSE, AMEX, and NASDAQ stock exchanges. Additionally, we exclude stock-month observations if the underlying stock’s price is below USD 5.
We focus on at-the-money call options with the shortest maturity among options with more than 1 month until expiration. Most of the academic literature studies these contracts due to their high trading volume (see, e.g., Zhan et al. (Reference Zhan, Han, Cao and Tong2022), Vasquez and Xiao (Reference Vasquez and Xiao2024)). Moreover, calls tend to be more liquid than puts, and, generally, any predictive relation and factor structure established for call options is expected to be similar for puts due to put-call parity. We present baseline results for puts in Section VI.C. Moreover, Section A of the Supplementary Material outlines the necessary steps and data filters required to obtain option contract-level data from OptionMetrics, which is used throughout this article to construct option portfolios. We adopt common approaches in the literature (Bali, Beckmeyer, Moerke, and Weigert (Reference Bali, Beckmeyer, Moerke and Weigert2023)). Notably, we apply filters only at position initiation to avoid any forward-looking bias (Duarte, Jones, Mo, and Khorram (Reference Duarte, Jones, Mo and Khorram2025)).
A. Option Returns
Our primary units of analysis are monthly delta-hedged option returns. To calculate delta-hedged returns, we first compute delta-hedged call gains following Bakshi and Kapadia (Reference Bakshi and Kapadia2003). Let
$ T=\left\{t={t}_0<\dots <{t}_N=t+\tau \right\} $
 denote the partition of the interval from
$ t $
denote the partition of the interval from
$ t $
 to
$ t+\tau $
to
$ t+\tau $
 . The delta-hedged gain is the value of a self-financing portfolio consisting of a long option contract, hedged by a position in the underlying stock such that the sensitivity of the entire option and stock portfolio with respect to changes in the underlying stock price is locally zero. Following Bali et al. (Reference Bali, Beckmeyer, Moerke and Weigert2023), we choose a daily delta-hedging schedule. Tian and Wu (Reference Tian and Wu2023) document that delta-hedging at position initiation removes approximately 70% of the directional risks embedded in the option position, whereas daily delta-hedging yields a reduction of 90%. We model long option positions which are hedged discretely
$ N $
. The delta-hedged gain is the value of a self-financing portfolio consisting of a long option contract, hedged by a position in the underlying stock such that the sensitivity of the entire option and stock portfolio with respect to changes in the underlying stock price is locally zero. Following Bali et al. (Reference Bali, Beckmeyer, Moerke and Weigert2023), we choose a daily delta-hedging schedule. Tian and Wu (Reference Tian and Wu2023) document that delta-hedging at position initiation removes approximately 70% of the directional risks embedded in the option position, whereas daily delta-hedging yields a reduction of 90%. We model long option positions which are hedged discretely
$ N $
 times at each of the dates
$ {t}_n,n=0,\dots, N-1 $
times at each of the dates
$ {t}_n,n=0,\dots, N-1 $
 . Consequently, the discrete delta-hedged call gain over the period
$ \left[t,t+\tau \right] $
. Consequently, the discrete delta-hedged call gain over the period
$ \left[t,t+\tau \right] $
 is given by

where
$ {C}_t $
 denotes the call contract’s mid price at time
$ t $
denotes the call contract’s mid price at time
$ t $
 ,
$ {r}_n $
,
$ {r}_n $
 is the risk-free rate at
$ {t}_n $
is the risk-free rate at
$ {t}_n $
 ,
$ {a}_n $
,
$ {a}_n $
 is the number of calendar days between rehedging dates
$ {t}_n $
is the number of calendar days between rehedging dates
$ {t}_n $
 and
$ {t}_{n+1} $
and
$ {t}_{n+1} $
 and is set equal to 1, and
$ {\Delta}_{C,{t}_n} $
and is set equal to 1, and
$ {\Delta}_{C,{t}_n} $
 is the observed option delta provided by OptionMetrics. Following Cao and Han (Reference Cao and Han2013), we consider gains over an investment horizon of one calendar month to compute month-end to month-end option returns by dividing
$ \Pi \left(t,t+\tau \right) $
is the observed option delta provided by OptionMetrics. Following Cao and Han (Reference Cao and Han2013), we consider gains over an investment horizon of one calendar month to compute month-end to month-end option returns by dividing
$ \Pi \left(t,t+\tau \right) $
 by the absolute value of the securities involved (
$ {\Delta}_t{S}_t-{C}_t $
by the absolute value of the securities involved (
$ {\Delta}_t{S}_t-{C}_t $
 ). Each month, we winsorize the delta-hedged option returns at the 1% level in both tails to mitigate the impact of erroneous data.
B. Factors
We construct option factors by sorting month
$ t $
 delta-hedged option returns into equal-weighted decile portfolios based on contract-level or stock-level characteristics from month
$ t-1 $
delta-hedged option returns into equal-weighted decile portfolios based on contract-level or stock-level characteristics from month
$ t-1 $
 (sorted from the smallest value to the highest value of the respective characteristic). The option factor returns are given by the
$ 10-1 $
(sorted from the smallest value to the highest value of the respective characteristic). The option factor returns are given by the
$ 10-1 $
 portfolio return in month
$ t $
portfolio return in month
$ t $
 . Detailed descriptions of factor characteristics are in Section B of the Supplementary Material.
1. Traded Factors
For the in-sample estimation of BMA posterior probabilities and risk prices, we use prominent tradable factors published in the academic literature and shown to have explanatory power for the cross-section of (delta-hedged) option returns.Footnote
6 Our traded factor set comprises 29 long-minus-short factors constructed with sorts on characteristics such as the difference between implied and realized volatility (IVRV, Goyal and Saretto (Reference Goyal and Saretto2009)) or idiosyncratic volatility of the underlying stock returns (IVOL, Cao and Han (Reference Cao and Han2013)). Because we also construct an option momentum factor (OMOM) in the spirit of Heston et al. (Reference Heston, Jones, Khorram, Li and Mo2023) and Käfer et al. (Reference Käfer, Moerke and Wiest2025) by sorting on previous option returns from month
$ t-2 $
 to
$ t-12 $
to
$ t-12 $
 , the final sample period of our factor sample is from February 1997 to December 2022. Finally, we augment the list of factors by a proxy for the single-name options market return, which we construct following Horenstein et al. (Reference Horenstein, Vasquez and Xiao2025) as the equal-weighted return of the 290 deciles based on the 29 sorting characteristics (EW_RET). Table 1 provides an overview of all tradable factors and their monthly mean returns. In line with the option factor literature, most high-minus-low option factors (23 out of 30) yield statistically significant mean returns.

Table 1 Long description
The table contains four columns: Factor, Reference Paper, Mean Ret., and t-Stat.
* Embedded leverage (E M B E D L E V): Frazzini and Pedersen (2022), 0.45, (8.18).
* Delta-hedging costs (H C): Tian and Wu (2023), -0.87, (-7.13).
* Volatility risk (V R): Tian and Wu (2023), -1.04, (-8.93).
* Historical jump risk (J R): Tian and Wu (2023), -0.82, (-12.52).
* Volatility of implied volatility (V O V): Ruan (2020), -0.36, (-4.84).
* Option illiquidity (O P T S P R E A D): Christoffersen et al. (2018), 0.004, (0.06).
* Option momentum (O M O M): Heston et al. (2023); Käfer et al. (2025), 1.18, (12.14).
* Historical stock volatility (H V O L): Hu and Jacobs (2020), -0.68, (-4.72).
* Systematic volatility (S Y S V O L): Aretz, Lin, and Poon (2023), -0.09, (-0.66).
* Impl. A T M volatility term structure (I V T E R M): Vasquez (2017), -0.89, (-7.73).
* Stock return autocorrelation (A C): Jeon, Kan, and Li (2025), 0.03, (0.57).
* Average of 10 highest past returns (M A X 10): Bali, Cakici, and Whitelaw (2011), -0.58, (-4.04).
* Default risk (D E F R I S K): Vasquez and Xiao (2024), -0.20, (-1.45).
* Idiosyncratic skewness (I S K E W): Byun and Kim (2016), -0.06, (-1.18).
* Total skewness (T S K E W): Byun and Kim (2016), -0.11, (-1.69).
* Idiosyncratic volatility (I V O L): Cao and Han (2013), -0.83, (-6.71).
* Implied minus realized volatility (I V R V): Goyal and Saretto (2009), -2.33, (-10.94).
* Stock illiquidity (A M I H U D): Kanne et al. (2023), Zhan et al. (2022), -0.57, (-4.68).
* Short interest (R S I): Ramachandran and Tayal (2021), -0.21, (-2.94).
* 1-year new stock issues (I S S U E _ 1 Y): Zhan et al. (2022), -0.45, (-4.67).
* 5-year new stock issues (I S S U E _ 5 Y): Zhan et al. (2022), -0.58, (-6.07).
* Analyst dispersion (D I S P): Zhan et al. (2022), -0.32, (-4.72).
* Altman Z-score (Z S C O R E): Zhan et al. (2022), 0.23, (2.51).
* Cash-to-assets ratio (C A S H _ A T): Zhan et al. (2022), -0.86, (-8.00).
* Cash flow volatility (O C F Q _ S A L E Q _ S T D): Zhan et al. (2022), -0.92, (-10.65).
* Operating profits to book equity (O P E _ B E): Zhan et al. (2022), 0.83, (8.83).
* Profit margin (E B I T _ S A L E): Zhan et al. (2022), 0.92, (9.38).
* Net total issuance (N E T I S _ A T): Zhan et al. (2022), -0.54, (-5.16).
* Stock price (L O G _ P R I C E): Zhan et al. (2022); Boulatov et al. (2022), 1.01, (7.32).
* Option market factor (E W _ R E T): Horenstein et al. (2025), -0.14, (-1.13).
In addition to option factors, we also consider factors based on stock returns. The addition of stock factors is motivated by Dickerson et al. (Reference Dickerson, Julliard and Mueller2024), who assess the joint pricing power of bond and equity factors using Bayesian model averaging. Moreover, equity factors are frequently used to explain option return anomalies (e.g., Zhan et al. (Reference Zhan, Han, Cao and Tong2022), Boulatov et al. (Reference Boulatov, Eisdorfer, Goyal and Zhdanov2022)). For our analyses, we use the widely established equity factors included in the 5-factor model by Fama and French (Reference Fama and French2015) and the momentum factor by Carhart (Reference Carhart1997).
2. Non-Traded Factors
We supplement the tradable factors described in the Section III.B.1 with 15 non-traded factors. First, we use 10 of the non-traded factors in Bryzgalova et al. (Reference Bryzgalova, Huang and Julliard2023a) and Dickerson et al. (Reference Dickerson, Julliard and Mueller2024) related to potential risks affecting option prices, such as the economic uncertainty risk (Jurado, Ludvigson, and Ng (Reference Jurado, Ludvigson and Ng2015)) or aggregate volatility risk (Ang, Hodrick, Xing, and Zhang (Reference Ang, Hodrick, Xing and Zhang2006)). Second, we add five additional non-traded factors that proxy for risks relevant for explaining returns in the options market, such as correlation risk following Driessen, Maenhout, and Vilkov (Reference Driessen, Maenhout and Vilkov2009).
C. Test Assets
We require a set of in-sample and out-of-sample test assets to implement the BMA methodology outlined in Section II. The BMA approach uses the in-sample test assets to determine posterior factor inclusion probabilities and posterior mean factor risk premia. These risk prices serve as input for cross-sectional out-of-sample tests in which we evaluate the pricing performance of the BMA-SDF and benchmark models. Detailed descriptions of test asset characteristics are in Section B of the Supplementary Material.
1. In-Sample Test Assets
We include the 30 traded
$ option $
 factors described in Section B.1 in our set of in-sample test assets. The inclusion of the traded option factors ensures that factors included in a model can also price excluded candidate factors and themselves (Bryzgalova et al. (Reference Bryzgalova, Huang and Julliard2023a)). Crucially, we do not consider the traded
$ stock $
factors described in Section B.1 in our set of in-sample test assets. The inclusion of the traded option factors ensures that factors included in a model can also price excluded candidate factors and themselves (Bryzgalova et al. (Reference Bryzgalova, Huang and Julliard2023a)). Crucially, we do not consider the traded
$ stock $
 factors in the set of in-sample test assets as we are not interested in the option BMA-SDF pricing stock-level risk factors.Footnote
7 Furthermore, we include
$ 5\times 5 $
factors in the set of in-sample test assets as we are not interested in the option BMA-SDF pricing stock-level risk factors.Footnote
7 Furthermore, we include
$ 5\times 5 $
 independently double-sorted option portfolios in the spirit of the Fama–French portfolios formed on size and book-to-market. As an analogous option size characteristic, we sort on the option’s outstanding dollar-open interest in month
$ t-1 $
independently double-sorted option portfolios in the spirit of the Fama–French portfolios formed on size and book-to-market. As an analogous option size characteristic, we sort on the option’s outstanding dollar-open interest in month
$ t-1 $
 . As an option value characteristic, we use the implied minus realized volatility (IVRV) of the option contract. IVRV is similar to the book-to-market ratio of stocks because the Black–Scholes (Reference Black and Scholes1973) implied volatility can be interpreted as a measure of market value, and realized volatility can be seen as a measure of fundamental option value (Karakaya (Reference Karakaya2014)). In total, our set of in-sample test assets consists of 30 long-short and 25 long-only option portfolios.
2. Out-of-Sample Test Assets
For our set of cross-sectional out-of-sample test assets, we follow Dickerson et al. (Reference Dickerson, Julliard and Mueller2024) in sorting option returns into monthly
$ long $
 portfolios based on the 17 Fama–French industry classification (FF17). Sorting options by industry results in long portfolios with sufficient return variation across the cross-section. Moreover, we consider additional long-short (
$ 10-1 $
portfolios based on the 17 Fama–French industry classification (FF17). Sorting options by industry results in long portfolios with sufficient return variation across the cross-section. Moreover, we consider additional long-short (
$ 10-1 $
 ) option portfolios that are
$ not $
) option portfolios that are
$ not $
 included in our set of candidate option factors for the out-of-sample tests. We use option and stock-level characteristics in Goyal and Saretto (Reference Goyal and Saretto2024) that are not sorting characteristics for the traded factors in Section B.1. The procedure results in 26 additional return anomalies. Overall, our set of cross-sectional out-of-sample test assets consists of 43 option portfolios.
IV. Main Empirical Results
We split our baseline analysis into five parts. To determine which factors are most important in pricing the cross-section of our test assets, we first highlight the factors for which the BMA yields the highest posterior factor probabilities. Second, we assess the dimensionality, implied SRs, and model probabilities of the estimated BMA-SDFs. In the third part, we compare the pricing performance of the BMA-SDF estimations to previously proposed low-dimensional factor models and KNS, both in-sample and out-of-sample, for a different cross-section of test assets. Next, we analyze the out-of-sample performance of a reduced-form linear option factor model that includes factors based on BMA-implied posterior probabilities. In the fifth part, we assess the out-of-sample performance for a different time series of the same test assets used to estimate the BMA-SDF.
A. Posterior Factor Inclusion Probabilities and Risk Prices
We report posterior factor inclusion probabilities,
$ \unicode{x1D53C}[{\gamma}_j|\mathrm{data}] $
 , and posterior prices of risk,
$ \unicode{x1D53C}\left[{\lambda}_j|\mathrm{data}\right] $
, and posterior prices of risk,
$ \unicode{x1D53C}\left[{\lambda}_j|\mathrm{data}\right] $
 , for each factor
$ j $
, for each factor
$ j $
 and different prior beliefs about the maximum SR. Posterior probabilities as a function of prior SRs are shown in Figure 1. Posterior probabilities and risk prices in tabular form are provided in Section C of the Supplementary Material.
Figure 1 shows posterior factor probabilities
$ \unicode{x1D53C}\left[{\gamma}_j|\mathrm{data}\right] $
 estimated with the BMA approach outlined in Section II. The factor set includes returns of 30 traded long-short factors based on delta-hedged call returns as well as 21 non-traded factors from February 1997 to December 2022. Additional test assets are
$ 5\times 5 $
estimated with the BMA approach outlined in Section II. The factor set includes returns of 30 traded long-short factors based on delta-hedged call returns as well as 21 non-traded factors from February 1997 to December 2022. Additional test assets are
$ 5\times 5 $
 long portfolios based on independent monthly sorts on IVRV and DOI. Portfolio returns are calculated with equal option weighting. We use non-informative flat priors on factor inclusion probability drawn from a
$ Beta\left(1,1\right) $
long portfolios based on independent monthly sorts on IVRV and DOI. Portfolio returns are calculated with equal option weighting. We use non-informative flat priors on factor inclusion probability drawn from a
$ Beta\left(1,1\right) $
 distribution and different prior annualized Sharpe ratios ranging from 10% to 90% of the ex post maximum achievable Sharpe ratio.

Figure 1 Long description
The line graph plots Posterior probability on the Y axis, ranging from 20% to 80%, against the Prior Sharpe ratio as a percentage of maximum on the X axis, with increments at 5%, 20%, 35%, 50%, 65%, 80%, and 95%. All factors start at a central cluster around 50% probability at the 5% mark. As the Prior Sharpe ratio increases, most factors trend downward or remain in a dense horizontal band between 40% and 50%. Four distinct factors diverge upward as outliers. The highest trajectory is I V R V in green, peaking near 85% at the 80% mark before a slight dip. Closely following is O M O M in blue, also reaching above 80%. A third green line labeled J R peaks near 65% before declining sharply after the 80% mark. An orange line labeled C A S H underscore A T rises steadily to nearly 60%. At the 95% mark, there is a significant downward divergence for the majority of the factor set, with many lines dropping toward the 30% to 40% range.
Three factors stand out with a posterior inclusion probability higher than the prior probability of 50% and are thus likely to be included in the true SDF. These factors are IVRV, OMOM, and JR. The IVRV and JR factors show negative posterior risk prices under all prior maximum SRs, which is consistent with the findings of Goyal and Saretto (Reference Goyal and Saretto2009) and Tian and Wu (Reference Tian and Wu2023). After accounting for all other risks, IVRV might capture residual mispricing in options.Footnote 8 A high spread in implied versus realized volatility on average indicates overpricing, and, thus, such options earn lower consequent returns. On the other hand, JR captures the risks of market makers that demand a premium for options with high jump risk. The positive posterior risk price for OMOM is consistent with the findings of Heston et al. (Reference Heston, Jones, Khorram, Li and Mo2023) and Käfer et al. (Reference Käfer, Moerke and Wiest2025), who find that past performance predicts future performance in delta-neutral option positions. In this context, Tian and Wu (Reference Tian and Wu2023) point out that option momentum effects might be driven by persistent variations in exposure to underlying risk sources.Footnote 9 As in Bryzgalova et al. (Reference Bryzgalova, Huang and Julliard2023a), a large number of factors is assigned a posterior probability very close to the prior probability, indicating that these factors are weakly identified. However, for less shrinkage, most of these factors become unlikely candidates for the SDF. Interestingly, a group of correlated factors, including EBIT_SALE, OPE_BE, OCFQ_SALEQ_STD, and CASH_AT, are moderately likely candidates for priced risk with low model complexity. However, when less shrinkage is imposed, only CASH_AT is selected more times than expected. This finding points to a more pronounced role of model selection over model aggregation when regularization is limited. Notably, no non-traded factor reaches posterior inclusion probabilities above 51% under moderate to high shrinkage.
B. Model Dimensionality, Model Probabilities, and Implied SRs
Next, we discuss the model dimensionality, model probability, and implied SRs of our in-sample BMA-SDF estimation. In Graph A of Figure 2, we count the number of factors in each of the final 450,000 Markov chain elements for different prior maximum SRs and plot the distribution of model dimensionality. For high shrinkage, the distribution is centered on the expected number of factors
$ 0.5\times 51 $
 . Evidently, the data cannot sufficiently rule out that the true SDF is dense. Only for the largest prior SR does the average number of factors drop significantly. As described by Bryzgalova et al. (Reference Bryzgalova, Huang and Julliard2023a), this result is likely due to rather weakly identified factors driving out other factors when less shrinkage is applied. In that case, the BMA approach shifts more toward model selection than aggregation. Notably, there is no single dominant combination of factors. Six models arise 5 times, followed by more than 90 models that arise 4 times. Although these posterior model probabilities are significantly higher than the ex ante probability of
$ {\frac{1}{2}}^{51}\sim 4.44\times {10}^{-16} $
. Evidently, the data cannot sufficiently rule out that the true SDF is dense. Only for the largest prior SR does the average number of factors drop significantly. As described by Bryzgalova et al. (Reference Bryzgalova, Huang and Julliard2023a), this result is likely due to rather weakly identified factors driving out other factors when less shrinkage is applied. In that case, the BMA approach shifts more toward model selection than aggregation. Notably, there is no single dominant combination of factors. Six models arise 5 times, followed by more than 90 models that arise 4 times. Although these posterior model probabilities are significantly higher than the ex ante probability of
$ {\frac{1}{2}}^{51}\sim 4.44\times {10}^{-16} $
 , they indicate that there are no hugely dominant factor combinations but rather large sets of similarly probable models. Following Bryzgalova et al. (Reference Bryzgalova, Huang and Julliard2023a), we calculate the posterior maximum annualized SRs for the different risk price draws with
$ \sqrt{\left({\lambda}^{\prime }{C}_f\lambda \right)} $
, they indicate that there are no hugely dominant factor combinations but rather large sets of similarly probable models. Following Bryzgalova et al. (Reference Bryzgalova, Huang and Julliard2023a), we calculate the posterior maximum annualized SRs for the different risk price draws with
$ \sqrt{\left({\lambda}^{\prime }{C}_f\lambda \right)} $
 . We plot the densities in Graph B of Figure 2. As expected, lower prior SRs result in lower posterior SRs due to shrinking risk prices toward 0. For low shrinkage, the mean implied SRs are large but not excessive, considering the maximum SR of 8.11 that can be achieved with our full set of test assets. For example, using a prior SR of 80% of the maximum SR (6.48) leads to a mean implied SR of 5.47. While these numbers are high, they are not surprising. Our strongest factor, IVRV, yields an annualized SR of 3.93. Additionally, Goyal and Saretto (Reference Goyal and Saretto2024) report an in-sample SR of 5.8 for their IPCA-derived tangency portfolio of delta-hedged call option returns. In Section VI, we discuss the limits to arbitrage due to transaction costs, as well as the role of mispricing resulting from the demand of retail traders, to explain part of these large SRs.
Graph A of Figure 2 displays the density distribution of the number of factors in models chosen by the final 450,000 Markov chain elements of the BMA-SDF estimation for different prior Sharpe ratios. Graph B shows the density distribution of annualized Sharpe ratios implied by those models. All other specifications of the BMA follow those detailed in Figure 1.

Figure 2 Long description
A two-panel line graph.
Graph A, titled Model Dimensionality, plots Density on the y-axis from 0.00 to 0.09 against Number of Factors on the x-axis from 10 to 40. Seven bell-shaped curves represent different Prior S R (percent of max) levels: 5 percent, 20 percent, 35 percent, 50 percent, 65 percent, 80 percent, and 95 percent. As the Prior S R increases, the curves shift right. The 5 percent curve peaks near 20 factors, while the 95 percent curve peaks near 25 factors.
Graph B, titled Implied Sharpe Ratios, plots Density on the y-axis from 0 to 3 against Sharpe Ratio on the x-axis from 0.0 to 10.0. The same seven Prior S R levels are shown. The 5 percent curve is a tall, narrow peak concentrated near a Sharpe Ratio of 0.5. As the Prior S R percentage increases, the curves become shorter, wider, and shift significantly to the right. The 95 percent curve is a broad, low distribution peaking around a Sharpe Ratio of 7.0.
A shared legend at the bottom identifies the line colors and styles for the Prior S R percentages: 5 percent (solid pink), 20 percent (dashed gold), 35 percent (dotted teal), 50 percent (dashed light blue), 65 percent (dashed dark blue), 80 percent (dashed purple), and 95 percent (solid magenta).
Before turning to pricing, we compare the density of our BMA-SDFs to SDFs estimated following the methodology of Kozak et al. ((Reference Kozak, Nagel and Santosh2020), KNS). Using an elastic-net type of shrinkage, they find a dense SDF in stocks using characteristic-based factors, but a sparse representation when using the test assets’ principal components as latent factors. We fit their methodology using 55 principal components (PCs) derived from our 30 traded factors and 25 in-sample test assets, using a twofold cross-validation. We report the cross-validation
$ {R}_{ols}^2 $
 in Section D of the Supplementary Material. As in Kozak et al. (Reference Kozak, Nagel and Santosh2020), a higher prior belief about the maximum SR translates to lower
$ {L}^2 $
in Section D of the Supplementary Material. As in Kozak et al. (Reference Kozak, Nagel and Santosh2020), a higher prior belief about the maximum SR translates to lower
$ {L}^2 $
 -shrinkage, while
$ {L}^1 $
-shrinkage, while
$ {L}^1 $
 -shrinkage is induced by setting an increasing number of PCs’ risk prices exactly to zero. The black line illustrates the optimal number of PCs with nonzero coefficients for any given prior belief of the maximum SR. As expected, including more PCs requires a lower prior belief of the SR and, thus, more ridge-type shrinkage. The maximum
$ {R}_{ols}^2 $
-shrinkage is induced by setting an increasing number of PCs’ risk prices exactly to zero. The black line illustrates the optimal number of PCs with nonzero coefficients for any given prior belief of the maximum SR. As expected, including more PCs requires a lower prior belief of the SR and, thus, more ridge-type shrinkage. The maximum
$ {R}_{ols}^2 $
 is reached for a prior SR of 1.70 and 23 PCs with non-zero coefficients. Even for the highest prior SRs (lowest
$ {L}^2 $
is reached for a prior SR of 1.70 and 23 PCs with non-zero coefficients. Even for the highest prior SRs (lowest
$ {L}^2 $
 -shrinkage), the validation sample is best priced with seven PCs. These results provide further evidence that, even for a rotation of the option return space, the SDF representation is dense.
C. In-Sample and Cross-Sectional Out-of-Sample Asset Pricing
We benchmark the BMA-SDF against previously proposed low-dimensional factor models in terms of their cross-sectional pricing power. The benchmark models include the models of Horenstein et al. ((Reference Horenstein, Vasquez and Xiao2025), HVX), Zhan et al. ((Reference Zhan, Han, Cao and Tong2022), ZHCT), Tian and Wu ((Reference Tian and Wu2023), TW), and Agarwal and Naik ((Reference Agarwal and Naik2004), AN). The models are described in Section B of the Supplementary Material. Additionally, we include a model that encompasses all 51 factors. For all these benchmark models, we use GMM with a GLS weighting matrix to estimate risk prices. Finally, we use risk prices estimated over the whole sample by the KNS approach utilizing the optimal parameters from a twofold cross-validation. For the BMA-SDF, we use the posterior risk prices estimated with various prior maximum SRs reported in Section C of the Supplementary Material. All models include an intercept.
We calculate average in-sample pricing errors for the 30 traded factors and the 25 portfolios sorted on IVRV and DOI. All returns are standardized to an annual volatility of 100%. Following Bryzgalova et al. (Reference Bryzgalova, Huang and Julliard2023a), we report the root mean square error (RMSE), the mean absolute percentage error (MAPE), and R
2 values both without (
$ {R}_{ols}^2 $
 ) and with a weighting matrix (
$ {R}_{gls}^2 $
) and with a weighting matrix (
$ {R}_{gls}^2 $
 ). For out-of-sample tests, we utilize the same estimated risk prices but use them to price 26 long-short factors, proposed by Goyal and Saretto (Reference Goyal and Saretto2024), detailed in Section B of the Supplementary Material, as well as 17 long portfolios based on FF17 industry sorts. Pricing performance is reported in Table 2.

Table 2 Long description
The table is divided into two main sections.
Panel A: In-Sample Pricing with 51 Factors and 25 I V R V - D O I Portfolios.
For B M A - S D F, as the percentage threshold increases from 5% to 95%, R-squared O L S increases from 0.033 to 0.947, while R M S E decreases from 1.416 to 0.326.
Comparative models in Panel A include:
- 51 factors: R-squared O L S 0.998, R M S E 0.055.
- C A P M: R-squared O L S 0.006, R M S E 1.42.
- H V X: R-squared O L S 0.526, R M S E 0.982.
- Z H C T: R-squared O L S 0.298, R M S E 1.232.
- A N: R-squared O L S 0.267, R M S E 1.200.
- T W: R-squared O L S 0.766, R M S E 0.728.
- K N S - C V 2: R-squared O L S 0.906, R M S E 0.434.
Panel B: Out-of-Sample Pricing with 26 Factors and 17 Industry Portfolios.
For B M A - S D F, as the percentage threshold increases from 5% to 95%, R-squared O L S increases from 0.045 to 0.848, while R M S E decreases from 1.492 to 0.594.
Comparative models in Panel B include:
- 51 factors: R-squared O L S 0.323, R M S E 1.256.
- C A P M: R-squared O L S 0.035, R M S E 1.500.
- H V X: R-squared O L S 0.530, R M S E 1.047.
- Z H C T: R-squared O L S 0.490, R M S E 1.090.
- A N: R-squared O L S 0.337, R M S E 1.244.
- T W: R-squared O L S 0.686, R M S E 0.856.
- K N S - C V 2: R-squared O L S 0.835, R M S E 0.620.
Several notable observations can be drawn. First, the pricing performance of the BMA-SDFs improves for all four performance metrics as the amount of shrinkage applied decreases. Even for out-of-sample pricing, using a high prior maximum SR is beneficial. There appears to be no issue with overfitting in the BMA approach, even when allowing for high model complexity. Second, and in contrast to the lack of overfitting when using the BMA-SDF, the 51-factor model exhibits the highest in-sample pricing performance but performs poorly in the out-of-sample tests. On the other hand, the BMA-SDF estimations beat all low-dimensional benchmark models, both in-sample and out-of-sample, when the prior SR is higher than or equal to 50% of the ex post maximum SR. Again, this observation holds for all four performance metrics. For the highest considered prior SR, and therefore, the lowest level of shrinkage, the BMA-SDF achieves an extraordinarily high out-of-sample
$ {R}_{ols}^2 $
 of 0.85. The low-dimensional benchmark models perform significantly worse, even though some models include the factors with the highest posterior inclusion probability. For example, the factor model of Tian and Wu (Reference Tian and Wu2023) contains three of the four BMA-SDF stand-out factors—namely, IVRV, JR, and OMOM—but yields worse in-sample and out-of-sample results. This weaker performance can arise from both different risk price estimations for these factors in the GMM versus the BMA, or from other factors in the BMA-SDF that yield additional explanatory power in the cross-section of call option prices. Contrary to the results of Bryzgalova et al. (Reference Bryzgalova, Huang and Julliard2023a), the KNS approach yields a very good pricing performance, between that of the BMA-SDFs estimated with prior SRs of 80% and 95% of the ex post maximum SR. There are two possible explanations. First, the KNS-SDF in our analysis is much denser than the stock KNS-SDF, with coefficients of 23 PCs not set to 0. If both the stock and the option SDF are truly dense, then the better pricing performance in our analysis is due to a better parametrization in the cross-validation. Second, our in-sample test assets include long-only option portfolios, whereas Bryzgalova et al. (Reference Bryzgalova, Huang and Julliard2023a) use long-short anomalies only. Since the PCs are formed on all in-sample test assets, the KNS approach utilizes a different set of potential candidates for the SDF than our BMA approach. The KNS-SDF is in an advantageous position compared to the BMA-SDF in our setting if the long portfolios contain information that is not captured by the traded factors but relevant for the pricing of the out-of-sample test assets.
In Section G of the Supplementary Material, we show the out-of-sample pricing performance measures separately for the industry portfolios and the 26 long-short portfolios, and also add a third set of test assets, namely 25 long portfolios based on independent 5
$ \times $
 5 sorts on the book-to-market ratio (BE_ME) and the market capitalization (MCAP) of the options’ underlying stocks. Again, the BMA-SDFs with low shrinkage significantly reduce pricing errors for all three sets of test assets compared to the low-dimensional benchmark models and exhibit a similar pricing performance as the KNS model.
D. Pricing Performance of Reduced-Form Models Implied by the BMA-SDF
So far, we have reported significant improvements in the asset pricing performance of the BMA-SDF compared to previously proposed low-dimensional benchmark models. Together with the large average number of factors in the models identified by the BMA, this insight provides evidence that the true option SDF is dense. Nonetheless, in this section, we test whether the worse performance of the benchmark models is due to a lack of model dimensionality or a weaker selection of factors. To achieve this, we introduce new “best factor” models. Factors with the highest posterior inclusion probabilities, as yielded by the BMA-SDF estimation with a prior maximum SR of 80% of the ex post maximum SR, are chosen for these models. In Table 3, we show the out-of-sample pricing performance of four such models with 1, 4, 10, and 25 factors, respectively. Risk prices are not taken from the BMA-SDF but are estimated with GMM and a GLS weighting matrix.

Table 3 Long description
The table is divided into two side-by-side sections, each with columns for Model, R M S E, M A P E, R super 2 sub o l s, and R super 2 sub g l s.
Left Section Data:
* Best factor: R M S E 1.072, M A P E 0.862, R super 2 sub o l s 0.507, R super 2 sub g l s 0.205.
* Best 4 factors: R M S E 0.691, M A P E 0.506, R super 2 sub o l s 0.795, R super 2 sub g l s 0.014.
* Best 10 factors: R M S E 0.624, M A P E 0.438, R super 2 sub o l s 0.833, R super 2 sub g l s 0.382.
* Best 25 factors: R M S E 0.641, M A P E 0.435, R super 2 sub o l s 0.824, R super 2 sub g l s 0.434.
* 51 factors: R M S E 1.256, M A P E 0.925, R super 2 sub o l s 0.323, R super 2 sub g l s minus 2.650.
Right Section Data:
* C A P M: R M S E 1.500, M A P E 1.027, R super 2 sub o l s 0.035, R super 2 sub g l s minus 0.013.
* H V X: R M S E 1.047, M A P E 0.883, R super 2 sub o l s 0.530, R super 2 sub g l s 0.274.
* Z H C T: R M S E 1.090, M A P E 0.840, R super 2 sub o l s 0.490, R super 2 sub g l s 0.035.
* A N: R M S E 1.244, M A P E 1.035, R super 2 sub o l s 0.337, R super 2 sub g l s 0.046.
* T W: R M S E 0.856, M A P E 0.639, R super 2 sub o l s 0.686, R super 2 sub g l s 0.222.
Our results indicate that the “best factor” models with more than one factor outperform all low-dimensional benchmark models. Only the models of Horenstein et al. (Reference Horenstein, Vasquez and Xiao2025) and Tian and Wu (Reference Tian and Wu2023) yield better pricing than the single-factor model with IVRV as the sole factor. Interestingly, the “best 4 factor” model with IVRV, JR, and OMOM strongly outperforms even the model of Tian and Wu (Reference Tian and Wu2023), which shares those three factors. Adding CASH_AT as a fourth factor enhances the pricing performance of the model. Overall, our results suggest that, based on pricing performance, there is an optimal number of factors in this approach. While the 10-factor model improves upon the performance of the 4-factor model, there is no further improvement in out-of-sample pricing power when including the top 25 factors and a decline when using all factors. Nevertheless, we conclude that the BMA approach is useful, even if only for factor selection based on the posterior inclusion probabilities, as it appears to select relevant factors. Even without utilizing the posterior risk prices, we can construct models that beat previously proposed low-dimensional factor models in pricing the cross-section of options.
E. Sample Split and Time-Series Out-of-Sample Pricing
In this section, we analyze factor inclusion probabilities for different subperiods and the time-series pricing performance of the BMA-SDF. To do so, we first split the sample into two halves, namely from February 1997 to December 2009 and from January 2010 to December 2022. We then determine posterior factor probabilities for both subperiods analogous to the full-sample analysis in Figure 1.
Table 4 displays factor probabilities for the three most likely factors (for
$ \unicode{x1D53C}[{\gamma}_j|\mathrm{data}]>50\% $
 ). We exclude the strongest shrinkage level
$ \left(5\%\hbox{-} {SR}_{pr}\right) $
). We exclude the strongest shrinkage level
$ \left(5\%\hbox{-} {SR}_{pr}\right) $
 as inclusion probabilities tend to be centered around the prior of 50% for all factors. In parentheses, we denote the inclusion probabilities and their percentage point change relative to the baseline inclusion probabilities in Figure 1. During the first sub-estimation period, IVRV is generally the most likely factor to be included in the SDF. Other factors with a posterior probability of clearly above 50% are OMOM and the stock investment factor CMA, which gain importance for smaller degrees of shrinkage, becoming the most likely included factors for 95% of the ex post achievable SR. The increasing importance of the CMA factor may be due to the high return volatility of this factor during the tech bubble around the turn of the millennium, a period of high volatility in the options market (see also Section V). For the second subperiod, the overall insights from the posterior probabilities change slightly. Now, IVRV and OMOM are in a very close race for the most probable factor in the SDF, with IVRV emerging as the winner for the smallest imposed degree of shrinkage.

Table 4 Long description
The table is divided into two main sections: Panel A (February 1997 to December 2009) and Panel B (January 2010 to December 2022). The columns represent Rank and six percentage thresholds: 20%, 35%, 50%, 65%, 80%, and 95%.
Panel A. Estimation February 1997 to December 2009:
* Rank 1: I V R V is the top factor from 20% to 80% with probabilities increasing from 55% to 66%. At 95%, C M A becomes the top factor at 61%.
* Rank 2: O M O M is the second factor from 20% to 80% with probabilities from 52% to 59%. At 95%, I V R V is ranked second at 57%.
* Rank 3: J R is the third factor from 20% to 65%. At 80%, C M A is third at 57%. At 95%, S K E W is third at 51%.
Panel B. Estimation January 2010 to December 2022:
* Rank 1: O M O M is the top factor from 20% to 65% with probabilities from 53% to 65%. At 80% and 95%, I V R V takes the top rank at 69% and 70% respectively.
* Rank 2: I V R V is ranked second from 20% to 65%. At 80% and 95%, O M O M is ranked second at 68% and 65%.
* Rank 3: O C F Q _ S A L E Q _ S T D is third at 20%. J R is third from 35% to 80% with probabilities between 52% and 54%. The 95% column for Rank 3 is empty.
Next, we conduct time-series out-of-sample pricing tests using an expanding window approach. We start by estimating inclusion probabilities and risk prices over the first sample half and add returns to the estimation window in steps of 12 months. In total, this approach reestimates the BMA-SDF 13 times over the years 1997 to
$ 2009+n $
 ,
$ n\in \left[0,12\right] $
,
$ n\in \left[0,12\right] $
 : 1997 to 2009, 1997 to 2010,
$ \dots $
: 1997 to 2009, 1997 to 2010,
$ \dots $
 , 1997 to 2021. For each estimation step
$ n $
, 1997 to 2021. For each estimation step
$ n $
 , we price the traded factors and in-sample test assets over the subsequent year
$ 2009+n+1 $
, we price the traded factors and in-sample test assets over the subsequent year
$ 2009+n+1 $
 . Similarly, when assessing low-dimensional benchmark models, we first determine risk prices via GMM using the subperiod 1997 to
$ 2009+n $
. Similarly, when assessing low-dimensional benchmark models, we first determine risk prices via GMM using the subperiod 1997 to
$ 2009+n $
 and evaluate the pricing performance over the next year. For the KNS approach, we determine the optimal number of PCs and prior SR using twofold cross-validation over the expanding estimation window.
Figure 3 plots the RMSE for various option pricing models over each out-of-sample evaluation year starting in 2010. We present results for the BMA-SDF with moderate to high prior SRs of 65% and 80%, the low-dimensional model with the best cross-sectional pricing performance by Tian and Wu (Reference Tian and Wu2023), and the cross-validated KNS model. Overall, the BMA-SDF with a prior SR of 65% emerges as the model with the lowest (average) time-series out-of-sample RMSE. In particular, it is the most stable in terms of variation in RMSE across years and is close to the lowest RMSE values in every evaluation period. In addition, we observe a slightly improved and more stable pricing performance by the BMA-SDF as more data is used in the estimation window. However, pricing errors appear to have moderately increased around the outbreak of the COVID-19 pandemic in 2020.
Figure 3 displays the root mean squared errors (RMSE) for the out-of-sample time-series pricing performance of four option factor models. We include two BMA-SDFs for 65% and 85% of max.
$ {SR}_{pr} $
 , the Tian and Wu (Reference Tian and Wu2023) model, and an SDF estimation of Kozak et al. (Reference Kozak, Nagel and Santosh2020) (KNS-CV2) with twofold cross-validation for parameter tuning. We use an expanding window approach to determine model parameters and risk prices over the years 1997 to
$ 2009+n $
, the Tian and Wu (Reference Tian and Wu2023) model, and an SDF estimation of Kozak et al. (Reference Kozak, Nagel and Santosh2020) (KNS-CV2) with twofold cross-validation for parameter tuning. We use an expanding window approach to determine model parameters and risk prices over the years 1997 to
$ 2009+n $
 ,
$ n\in \left[0,12\right] $
,
$ n\in \left[0,12\right] $
 . We then evaluate the models based on their ability to price traded factors and in-sample test assets over the subsequent year (
$ 2009+n+1 $
. We then evaluate the models based on their ability to price traded factors and in-sample test assets over the subsequent year (
$ 2009+n+1 $
 ), from 2010 to 2022.

Figure 3 Long description
The x-axis is labeled Evaluation Period and ranges from 2010 to 2022. The y-axis is labeled R M S E and ranges from 1.0 to 4.0.
A legend at the top left identifies four models:
* Blue asterisk with a connecting line: B M A dash S D F, 65% dash S R sub pr (phi: 1.896).
* Red circle: B M A dash S D F, 80% dash S R sub pr (phi: 1.981).
* Yellow triangle: T W (phi: 2.025).
* Green square: K N S dash C V 2 (phi: 2.145).
The data shows a volatile trend for all models. The blue line (B M A dash S D F 65%) serves as a baseline, fluctuating between a low of approximately 1.1 in 2016 and a high of 2.6 in 2013.
Key observations include:
* In 2010, all models start clustered between 2.5 and 2.8.
* In 2016, all models reach their lowest R M S E, tightly clustered around 1.1 to 1.3.
* From 2017 to 2020, the K N S dash C V 2 (green squares) and T W (yellow triangles) models consistently show higher pricing errors than the B M A dash S D F models, with K N S dash C V 2 peaking above 3.0 in 2020.
* By 2022, all models converge again at a lower error rate between 1.5 and 1.8.
All in all, we conclude that the BMA-SDF yields robust results in time-series out-of-sample tests. The variation in factor inclusion probabilities and pricing performance over time underlines the importance of more detailed analyses of the BMA-SDF’s time-series properties, which we conduct in the following section.
V. Key Economic Properties of the Option BMA-SDF
We obtain the time series of the (posterior mean of the) option BMA-SDF by inserting the posterior risk prices,
$ \unicode{x1D53C}\left[{\lambda}_j|\mathrm{data}\right] $
 , into
$ {M}_t=1-{\left({\boldsymbol{f}}_t-\unicode{x1D53C}\left[{\boldsymbol{f}}_t\right]\right)}^{\top }{\boldsymbol{\lambda}}_{\boldsymbol{f}} $
, into
$ {M}_t=1-{\left({\boldsymbol{f}}_t-\unicode{x1D53C}\left[{\boldsymbol{f}}_t\right]\right)}^{\top }{\boldsymbol{\lambda}}_{\boldsymbol{f}} $
 . Figure 4 shows the time series of the option BMA-SDF in gray. Following Dickerson et al. (Reference Dickerson, Julliard and Mueller2024), we also depict the conditional mean of the BMA-SDF fitted using an ARMA(1,1) model. We determine the ARMA orders with the Bayesian information criterion (BIC). We report results for a prior SR set at 80% of the maximum ex post achievable SR. The BMA-SDF and its conditional mean exhibit a typical business cycle pattern, with spikes in and immediately before NBER recessions highlighted in light green shades, as well as before the burst of the dot-com bubble prior to the early-2000s recession.Footnote
10
. Figure 4 shows the time series of the option BMA-SDF in gray. Following Dickerson et al. (Reference Dickerson, Julliard and Mueller2024), we also depict the conditional mean of the BMA-SDF fitted using an ARMA(1,1) model. We determine the ARMA orders with the Bayesian information criterion (BIC). We report results for a prior SR set at 80% of the maximum ex post achievable SR. The BMA-SDF and its conditional mean exhibit a typical business cycle pattern, with spikes in and immediately before NBER recessions highlighted in light green shades, as well as before the burst of the dot-com bubble prior to the early-2000s recession.Footnote
10
Figure 4 shows the time series of BMA-SDFs’ posterior means. We depict the option BMA-SDF with its conditional mean fitted with a BIC-selected ARMA(1,1) model. We also include the co-pricing BMA-SDF’s conditional mean from Dickerson et al. (Reference Dickerson, Julliard and Mueller2024) (ARMA(3,1)). Shaded areas are NBER recessions. The sample period is from February 1997 to December 2022.

Figure 4 Long description
The line graph features a horizontal x-axis representing years from 2000 to 2020 and a vertical y-axis labeled B M A dash S D F ranging from negative 0.5 to 2.0. A horizontal dashed line is fixed at 1.0.
Three data series are plotted:
* Option B M A dash S D F: A light gray, highly volatile line showing frequent sharp peaks and troughs.
* Option B M A dash S D F (Cond. Mean): A smoother red line representing the conditional mean.
* Co-pricing B M A dash S D F (Cond. Mean): A smoother dark blue line.
Three vertical light-green shaded areas indicate N B E R recessions:
1. The first occurs around 2001, where the red line dips below 1.0 and the blue line reaches a local trough near 0.5.
2. The second, much wider, occurs between 2008 and 2009. During this period, the blue line drops sharply to approximately 0.5 while the red line fluctuates around 1.0 before dipping.
3. The third is a narrow band in 2020, coinciding with a sharp downward spike in the gray and red lines toward 0.5.
Overall, the red and blue lines exhibit distinct cyclical patterns, often diverging significantly between 2002 and 2010 before converging more closely between 2012 and 2018.
In general, these patterns are similar to the co-pricing BMA-SDF proposed by Dickerson et al. (Reference Dickerson, Julliard and Mueller2024), which jointly prices bonds and stocks. We plot its conditional ARMA(3,1) mean alongside its option counterpart in Figure 4.Footnote 11 The correlation between both mean series is positive at 31.1%. We also present the time series of conditional means for the standalone stock and bond BMA-SDF in Section E of the Supplementary Material. Interestingly, the conditional mean of the option BMA-SDF is much more correlated to the conditional mean of the standalone stock BMA-SDF (44.3%) compared to the bond BMA-SDF (9.7%). This insight suggests that options are more closely aligned with the underlying stocks in terms of commonality in the pricing kernel. Moreover, many of our option factors and test assets are constructed based on stock fundamentals (some of which constitute stock factor sorting variables), providing a further link between these two asset classes.
Despite evidence of positive comovement between the option and co-pricing BMA-SDF, a notable difference is the magnitude of the peak and subsequent drop around the Global Financial Crisis (GFC) and the outbreak of the COVID-19 pandemic. Whereas the co-pricing BMA-SDF exhibits a more pronounced peak and successive downswing during the GFC, the option BMA-SDF declines more sharply with the start of the 2020 pandemic. This disparity is even more pronounced when comparing the conditional volatility of the two pricing kernels in Figure 5, which were obtained by fitting a GARCH(1,1) process to the respective SDF. The annualized volatility of the option BMA-SDF increased significantly during the COVID-19 pandemic compared to the GFC, in contrast to the co-pricing BMA-SDF in blue, which experienced its highest volatility spike during the GFC.
Figure 5 shows the annualized conditional volatility of model-implied SDFs. The option BMA-SDF’s conditional volatility is fitted using an ARMA(1,1)-GARCH(1,1) model and plotted next to the co-pricing BMA-SDF’s volatility from Dickerson et al. (Reference Dickerson, Julliard and Mueller2024) (ARMA(3,1)-GARCH(1,1)). Additionally, we include the conditional volatility of the Tian and Wu (Reference Tian and Wu2023) SDF (GARCH(1,1) with BIC-selected ARMA(1,1) mean process). The graph also displays the ex post variance risk premium (VRP) measure, which is computed as the cross-sectional average of firm-level model-free implied variance at the month’s start minus the realized variance during the month. Shaded areas are NBER recessions. The sample period is from February 1997 to December 2022.

Figure 5 Long description
The x-axis represents time from 1997 to 2022. The left y-axis measures B M A dash S D F Volatility from 0.5 to 4.0. The right y-axis measures V R P from negative 1.5 to 0.5.
Four data series are plotted:
* Option B M A dash S D F (solid red line): Shows volatility fluctuating between 0.5 and 2.0, with major peaks around 2001, 2009, and 2020.
* Co-pricing B M A dash S D F (solid blue line): Generally tracks higher than the red line, reaching a peak near 3.0 during the 2008-2009 period.
* Tian and Wu 2023 S D F (dotted gold line): Follows a similar trend to the B M A models, often sitting between the red and blue lines.
* Average firm-level V R P ex-post (thin grey line): Plotted against the right y-axis, it remains relatively stable near the 0.0 dashed horizontal line but shows significant downward spikes during market stress periods.
Three vertical light-green shaded areas indicate N B E R recessions: the early 2000s dot-com bubble burst, the 2008 Great Recession, and the brief 2020 COVID-19 recession. During these shaded periods, all three volatility measures show sharp upward spikes while the V R P shows increased turbulence.
We also add the cross-sectional mean of the VRP to the SDF volatilities in Figure 5. The VRP is defined as the difference between the risk-neutral expected and the realized variance (Carr and Wu (Reference Carr and Wu2009), Bollerslev, Tauchen, and Zhou (Reference Bollerslev, Tauchen and Zhou2009)). Equivalent to a long variance swap position, delta-hedged options profit from higher realized than expected (implied) volatility over the holding period. Conversely, option returns are strongly negative if implied volatilities are excessive relative to future volatility. Hence, a highly positive (negative) VRP indicates a sizeable ex ante overvaluation (undervaluation) of options, leading to stark return volatility of delta-neutral investments. We focus on an ex post version of the VRP as in Kelly, Pástor, and Veronesi (Reference Kelly, Pástor and Veronesi2016) because it captures the market’s incorrect valuation of future, actually realized volatility. In addition, we compute the monthly, cross-sectional average of firm-level VRP instead of an index-implied VRP, as the asset returns inherent in our option BMA-SDF are also based on single-name options.Footnote 12
At the onset of recessions or market downturns, during which the ex post VRP tends to spiral downward following a realized high-volatility event and subsequently reverses to an elevated level, the option BMA-SDF is more volatile. Crucially, it is at the beginning of 2021 that the volatility of the option BMA-SDF and the VRP reaches its peak. At the beginning of this year, the options market experienced its strongest growth of the share in retail trading volume (see e.g., Bogousslavsky and Muravyev (Reference Bogousslavsky and Muravyev2024)), potentially leading to an amplified volatility overvaluation.Footnote 13 During the GFC, the VRP does not rise to unusually high levels after its initial sharp drop. Moreover, the final years of the tech bubble are characterized by generally high fluctuations in VRP in line with increased SDF volatility. Lastly, the clear relationship between the BMA-SDF and VRP also sheds light on the importance of IVRV, which is in itself an ex ante VRP measure.
Furthermore, we investigate whether the properties of the option BMA-SDF contribute to understanding its superior pricing power compared to low-dimensional benchmark models. Following Dickerson et al. (Reference Dickerson, Julliard and Mueller2024), we plot the conditional volatility of the Tian and Wu (Reference Tian and Wu2023) (TW) model-implied SDF together with the BMA-SDF in Figure 5. In contrast to bond and stock benchmark models in Dickerson et al. (Reference Dickerson, Julliard and Mueller2024), the volatility of the TW model is not characterized by overall lower volatility relative to the option BMA-SDF. For instance, the volatility of the TW-implied SDF during the COVID-19 pandemic is similar to that of the BMA-SDF, both in terms of magnitude and time-series pattern. Again, this result is not overly surprising, considering that three of the five factors included in the TW model—namely, IVRV, JR, and OMOM—constitute essential parts of the BMA-SDF. More importantly, there are also noteworthy differences between the BMA-SDF and TW-SDF volatilities. In particular, the volatility of the TW-SDF is considerably more pronounced during the GFC. Therefore, the distinct pattern of putting more emphasis on the post-2020s relative to the GFC is not merely a mechanical effect inherent in traded option factors. In particular, the explicit focus of the TW model on market maker risk is associated with higher SDF volatility during the GFC due to the return volatility and large GMM risk prices of these factors. The shrinkage inherent in the BMA approach mitigates the impact of these factors, although some of them remain among the most important factors selected by the BMA-SDF, regardless. Crucially, the BMA-SDF also incorporates other factors arguably linked to option mispricing. These factors were more important in the 2020s, resulting in a relatively higher emphasis on these years by the BMA-SDF. The ability of the dense BMA-SDF to incorporate various option factors with different implications provides a potential explanation for its strong pricing performance compared to a primarily risk-based model such as TW.
Next, we examine whether the conditional mean and volatility of the BMA-SDF can explain the option risk premia captured by the option factors used in our analyses. We follow Dickerson et al. (Reference Dickerson, Julliard and Mueller2024) in regressing log returns of tradable option factors
$ j $
 in
$ t $
in
$ t $
 on the conditional variance and its interaction with the conditional mean of the BMA-SDF,

This relation implies that absolute factor risk premia are higher when there is increased uncertainty regarding the future value of the SDF, and this relation is dependent on the expected level of the SDF. Figure 6 reports
$ {R}^2 $
 -values from the multivariate regressions in equation (6) of log factor returns on the previously fitted BMA-SDF means and volatilities that rely on time
$ t-1 $
-values from the multivariate regressions in equation (6) of log factor returns on the previously fitted BMA-SDF means and volatilities that rely on time
$ t-1 $
 information. Moreover, the column color shows the joint statistical significance, as indicated by the regressions’
$ F $
information. Moreover, the column color shows the joint statistical significance, as indicated by the regressions’
$ F $
 -tests. The analysis reveals that the BMA-SDF’s conditional measures can explain up to 25% of the variation in individual option risk premia over time. For 26 of 30 factors, the regression coefficients are jointly significant at the 5% level. With a median-
$ {R}^2 $
-tests. The analysis reveals that the BMA-SDF’s conditional measures can explain up to 25% of the variation in individual option risk premia over time. For 26 of 30 factors, the regression coefficients are jointly significant at the 5% level. With a median-
$ {R}^2 $
 of 6.4%, the predictability inherent in the BMA-SDF is economically large, especially compared to the co-pricing BMA-SDF (median below 2%). Generally, this high level of predictability aligns with previously documented strong autocorrelation and risk premium persistence in option factors (see, e.g., Käfer et al. (Reference Käfer, Moerke and Wiest2025)).
Figure 6 depicts the
$ {R}^2 $
 values of regressing (tradable) factor log returns on the option BMA-SDF’s conditional variance and conditional variance interacted with its conditional mean. The mean and variance are obtained by fitting an ARMA(1,1)-GARCH(1,1) process to the SDF and are thus based on the information from the previous month. Column colors indicate joint significance as indicated by the respective regression’s
$ F $
values of regressing (tradable) factor log returns on the option BMA-SDF’s conditional variance and conditional variance interacted with its conditional mean. The mean and variance are obtained by fitting an ARMA(1,1)-GARCH(1,1) process to the SDF and are thus based on the information from the previous month. Column colors indicate joint significance as indicated by the respective regression’s
$ F $
 -test. Hatched column areas denote that the sign of the correlation between the BMA-SDF’s conditional mean and factor is different for the two sample halves (February 1997 to December 2009 and January 2010 to December 2022).

Figure 6 Long description
A bar chart with the y-axis labeled R super 2 ranging from 0.00 to 0.25 in increments of 0.05. The x-axis lists 32 individual option factors.
* The bars are arranged in descending order of R super 2 value from left to right.
* The first four factors (h c, amihud, log_price, and embedlev) show the highest predictability with R super 2 values between 0.22 and 0.25.
* A horizontal dashed line indicates the Median R super 2 at approximately 0.065.
* Most bars are solid blue, indicating a p-value less than 5 percent.
* Three bars toward the right (cash_at, netis_at, and sysvol) are solid red, indicating a p-value greater than 5 percent.
* Several bars (rsi, issue_5y, ope_be, ivol, hvol, issue_1y, max10, and vov) feature diagonal hatching, which denotes a change in the sign of the risk premium between sample halves.
* The legend in the top right corner defines the three categories: blue square for p-value < 5 percent, red square for p-value > 5 percent, and a hatched square for Change in sign of risk premium.
Notably, we also observe heterogeneity in the BMA-SDF’s ability to explain factor returns. The key reason behind the subpar predictability of some option factors is the sign of their returns during periods of high BMA-SDF volatility: Some factors yield highly negative returns during the tech bubble and highly positive returns during the 2020 pandemic (or vice versa). We separately compute correlations between the BMA-SDF’s conditional mean and factor returns for each of the two sample halves to identify factors exhibiting such return behavior. If the correlation coefficient changes sign between the two subperiods, we indicate the respective factor with a hatched column pattern in Figure 6. Indeed, most factors among the lowest third of
$ {R}^2 $
 values display a change in sign of their risk premium. Notably, among these factors are some of the return anomalies documented by Zhan et al. (Reference Zhan, Han, Cao and Tong2022) as well as the behavioral factor MAX10 related to investors’ gambling preferences (Byun and Kim (Reference Byun and Kim2016)). Increased end-user and retail demand for specific options, especially after 2020, might have contributed to the change in the sign of these factor returns. On the other hand, hedging costs (HC) and the illiquidity of the underlying stock (AMIHUD) are the two factors best explained by the BMA-SDF conditional measures. Both factors are closely linked to the hedging activity by options market makers, with more illiquid underlying stocks incurring higher hedging costs (Kanne, Korn, and Uhrig-Homburg (Reference Kanne, Korn and Uhrig-Homburg2023), Tian and Wu (Reference Tian and Wu2023)). Consistent with increased dealer incentives to hedge their directional exposure during market turmoil, the risk premia of these factors exhibit a strong and consistent cyclical pattern similar to the option BMA-SDF.
VI. Additional Analyses
A. Impact of Retail Investors
Many option factors are based on the hypothesis that investors in the options market exhibit behavioral biases and preferences for certain option contracts. For instance, Byun and Kim (Reference Byun and Kim2016) demonstrate that investor preference for lottery-like options leads to overvaluation and subsequent lower returns. Hence, and in light of the previous section’s evidence of retail and end-user activity influencing the option SDF over time, this subsection assesses different implications for the composition of the SDF in the options market depending on the role of behavioral influences. For this purpose, we perform our empirical analysis for options with either high or low retail investor activity.
We utilize signed volume data from four U.S. options exchanges operated by NASDAQFootnote
14 with an equity options market share of roughly 30% in 2021 (OCC (2021)). The data provides signed volumes and the number of trades (open buy/sell; close buy/sell) by non-market makers, including professional customers, firm customers, and all other customers. The overall sample period is from May 2005 to February 2021. We only consider options with maturity between 30 and 70 days and a strike-to-spot ratio,
$ K/S $
 , between 0.8 and 1.2, which yields a sample of signed volumes that closely matches the time to expiration and moneyness of the short-maturity ATM options considered in our baseline analyses. To measure the activity of retail clients in the options market, we compute the share of “Customer-Volume of small trades” over the total call end-user volume on the four exchanges during a month
$ t $
, between 0.8 and 1.2, which yields a sample of signed volumes that closely matches the time to expiration and moneyness of the short-maturity ATM options considered in our baseline analyses. To measure the activity of retail clients in the options market, we compute the share of “Customer-Volume of small trades” over the total call end-user volume on the four exchanges during a month
$ t $
 .
.
We split our contract-level option data based on the median of
$ RetailShare $
 at factor construction and rebuild option factors (and test assets) for both subsamples. The average median
$ RetailShare $
at factor construction and rebuild option factors (and test assets) for both subsamples. The average median
$ RetailShare $
 is 56.7%. Next, we compute posterior factor inclusion probabilities separately for factors constructed using either high or low-
$ RetailShare $
is 56.7%. Next, we compute posterior factor inclusion probabilities separately for factors constructed using either high or low-
$ RetailShare $
 options in Section F of the Supplementary Material. We show the percentage point change in inclusion probability relative to a baseline estimation over the full sample of options data from 2005 to 2021, when signed volume data is available.
For factors constructed based on options with higher retail activity, the familiar important factors IVRV, JR, CASH_AT, and OMOM are among the most likely factors to be included in the SDF. Notably, both IVRV and CASH_AT increase significantly compared to the full cross-sectional baseline, with a close to 20 percentage point increase for the lowest degree of shrinkage. This change in relative posterior probability suggests that general mispricing, as reflected by IVRV, is more relevant for explaining the returns of options that are more heavily influenced by retail trading. The results may also indicate that the Zhan et al. (Reference Zhan, Han, Cao and Tong2022) anomaly CASH_AT is driven by retail demand for firms with high cash holdings. Finally, the high posterior probability of JR might reflect market makers’ compensation for hedging risk when retail investors exhibit strong demand for options with high underlying jump risk. Remarkably, the low retail subsample does not as clearly identify individual factors of being included in the SDF. This insight may suggest that retail activity amplifies general mispricing (IVRV), return anomalies (CASH_AT), and market-making risk (JR). Finally, as also presented in Section F of the Supplementary Material, the BMA-SDF yields strong cross-sectional pricing performance in both the high and low retail splits.
B. Accounting for Transaction Costs
Detzel et al. (Reference Detzel, Novy-Marx and Velikov2023) find that some stock market factors with the highest returns also incur the highest trading costs. The authors argue that if an asset pricing model is estimated from factor returns without subtracting transaction costs, the resulting SDF cannot distinguish between true sources of risk premia, which inform the implementable optimal portfolio, and unattainable paper profits that vanish after accounting for trading frictions.
Given this motivation to estimate the BMA-SDF net of transaction costs to identify likely sources of true and attainable risk premia, we follow Goyal and Saretto (Reference Goyal and Saretto2024) and Zhan et al. (Reference Zhan, Han, Cao and Tong2022), among others, in using expiration-date-to-expiration-date returns. More precisely, we initiate option positions and construct factors each Monday after the third Friday of the month. The daily delta-hedged options are then held until maturity. Thus, no transaction costs are incurred when closing the positions. In line with Muravyev and Pearson (Reference Muravyev and Pearson2020) and Heston et al. (Reference Heston, Jones, Khorram, Li and Mo2023), we subtract only 20.3% of the quoted half spread at position initiation when calculating the option profit/loss in equation (5).
To construct factors, we assign long and short positions in the low and high decile portfolios such that the factor yields positive returns before transaction costs. Therefore, if a factor yields negative returns after accounting for transaction costs, it is not a viable strategy (Goyal and Saretto (Reference Goyal and Saretto2024)). As reported in Section F of the Supplementary Material, some factors yield extremely negative SRs after accounting for transaction costs because they are trading highly illiquid options. Since factors must be able to price themselves when estimating the BMA-SDF, including these paper-profit factors in the sample will lead to distortions in identifying relevant (and attainable) sources of risk premia. Therefore, we exclude long-short factors from the factor set as test assets if the mean factor returns net of transaction costs are significantly negative at the 5% level using Newey and West (Reference Newey and West1987) standard errors (lag length 4). In total, we filter out four factors of the factor set and six long-short out-of-sample test assets.
When accounting for transaction costs in Section F of the Supplementary Material, IVRV and OMOM remain the two factors with the highest inclusion probability in the option BMA-SDF. Combined with their high SRs after transaction costs, the results indicate that these factors capture compensated risks. On the other hand, the third important factor, JR, yields substantially lower returns after transaction costs, indicating that its performance gross of transaction costs reflects trading frictions and limits to arbitrage, but not necessarily risk premia.Footnote 15 We also report the cross-sectional pricing performance of the BMA-SDF in Section F of the Supplementary Material. We do not exclude any factors in the low-dimensional benchmark models, even if returns are significantly negative. Again, the BMA-SDF with low shrinkage yields lower pricing errors than any of the low-dimensional benchmark models.
C. Additional Robustness Tests
In Section G of the Supplementary Material, we present various robustness tests. First, our main results also apply to put options. IVRV, OMOM, and JR remain the most likely factors to be included in the BSDF, with IVOL becoming a likely candidate for the lowest level of shrinkage. Cross-sectional pricing performance remains superior over low-dimensional benchmark models. Next, instead of assigning equal weights to single option returns, we value-weight returns by the option’s market capitalization of the underlying stock at the time of portfolio formation. Most notably, IVRV, OMOM, and JR are the most relevant factors based on their posterior probabilities. The out-of-sample pricing performance vis-à-vis the benchmark factors remains robust. Finally, we follow Dickerson et al. (Reference Dickerson, Julliard and Mueller2024) and conduct the main analysis with more conservative prior beliefs about model dimensionality, drawing initial factor inclusion probabilities from a
$ Beta\left(3,12\right) $
 distribution, which translates to an expected inclusion of 20% of factors. Again, the same factors that emerged as likely SDF candidates in the main analysis reappear. The posterior probabilities for the other factors are around or below the initial 20%, which reflects the prior assumption of sparsity. However, while still beating the low-dimensional benchmark models with low regularization, out-of-sample pricing performance is worse than when drawing factor inclusion probabilities from a
$ Beta\left(1,1\right) $
distribution, which translates to an expected inclusion of 20% of factors. Again, the same factors that emerged as likely SDF candidates in the main analysis reappear. The posterior probabilities for the other factors are around or below the initial 20%, which reflects the prior assumption of sparsity. However, while still beating the low-dimensional benchmark models with low regularization, out-of-sample pricing performance is worse than when drawing factor inclusion probabilities from a
$ Beta\left(1,1\right) $
 distribution, providing further evidence that the true SDF for equity options is dense.
VII. Conclusion
Using the Bayesian method proposed by Bryzgalova et al. (Reference Bryzgalova, Huang and Julliard2023a), we estimate posterior risk prices and probabilities of factors included in the SDF that prices the cross-section of delta-hedged option returns. We find that the difference between implied and realized volatility, option return momentum, and jump risk are included in the SDF with high probability. Similar to the results for the stock and bond market, we observe that the SDF is dense in the space of observable option factors.
We demonstrate that the estimated Bayesian model averaging SDF (BMA-SDF) outperforms reduced-form option benchmark models in terms of cross-sectional out-of-sample pricing performance. A reduced-form 4-factor model based on the exterior probability implied by the BMA method also outperforms existing benchmark models out of sample. Only the latent factor model by Kozak et al. (Reference Kozak, Nagel and Santosh2020) closely competes with the option BMA-SDF in terms of pricing performance. However, the high number of non-zero risk prices of PCs provides further evidence of a dense factor structure. We further show that the option BMA-SDF captures distinct time-series patterns, such as the surge in volatility during the option trading boom following the outbreak of the 2020 pandemic.
Our article contributes to the literature on factors explaining the cross-section of option returns. Our empirical results verify the relevance of factors such as the difference between implied and realized volatility, jump risk, and option momentum in previously proposed models. At the same time, the dense model dimensionality implied by the option BMA-SDF highlights the benefits of including more than three to four factors in linear option factor models to account for multiple imperfectly identified sources of risk.
Supplementary Material
To view supplementary material for this article, please visit http://doi.org/10.1017/S0022109025102251.


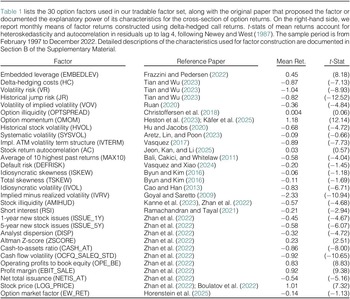


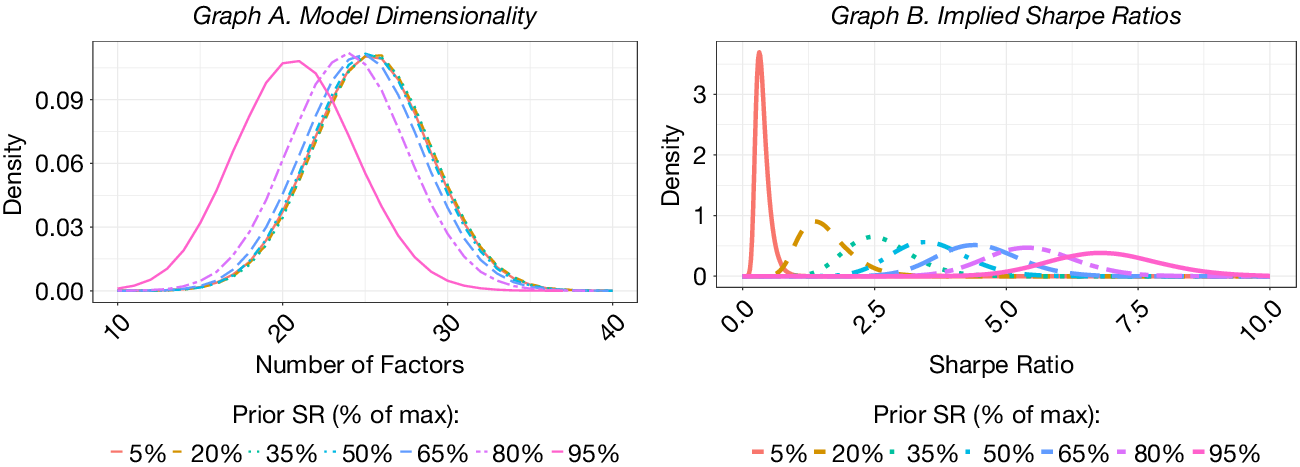
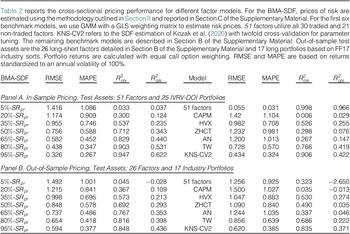
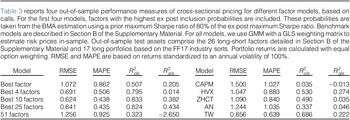
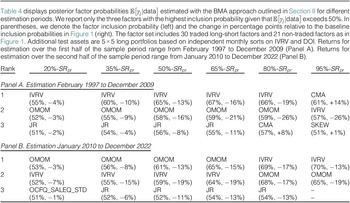
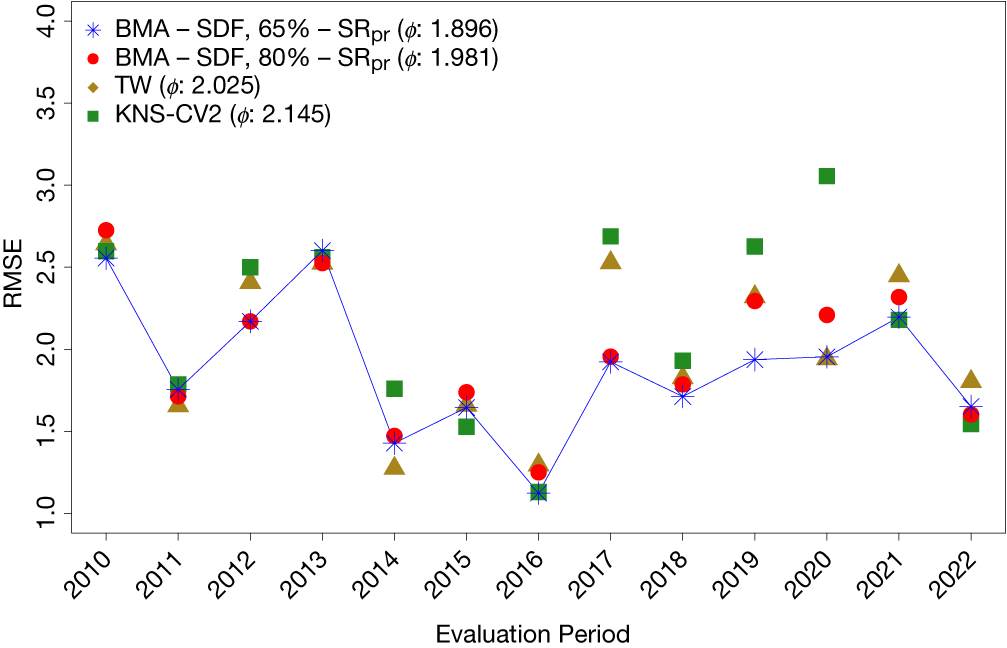


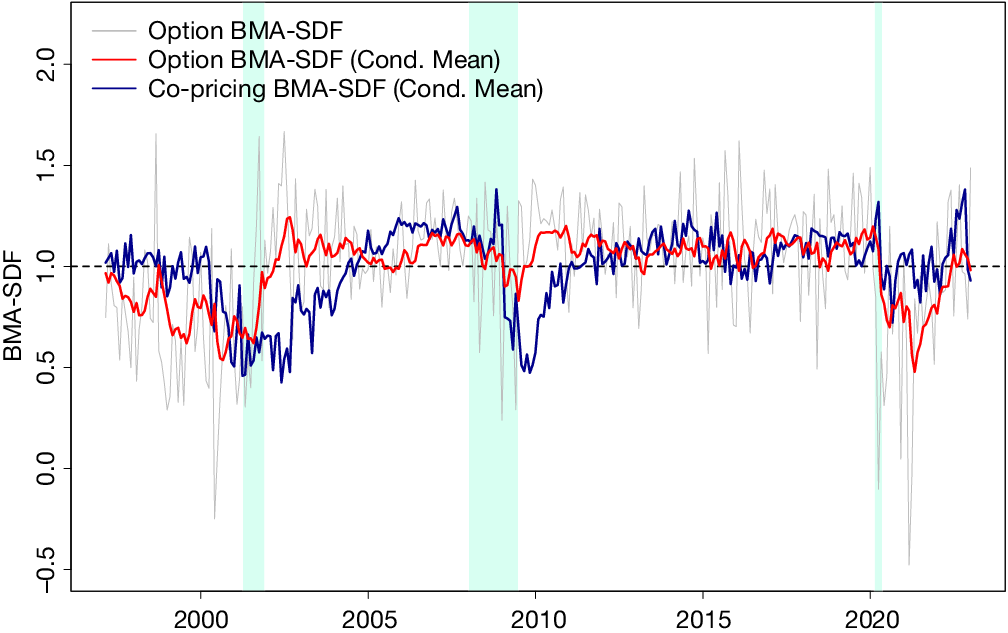
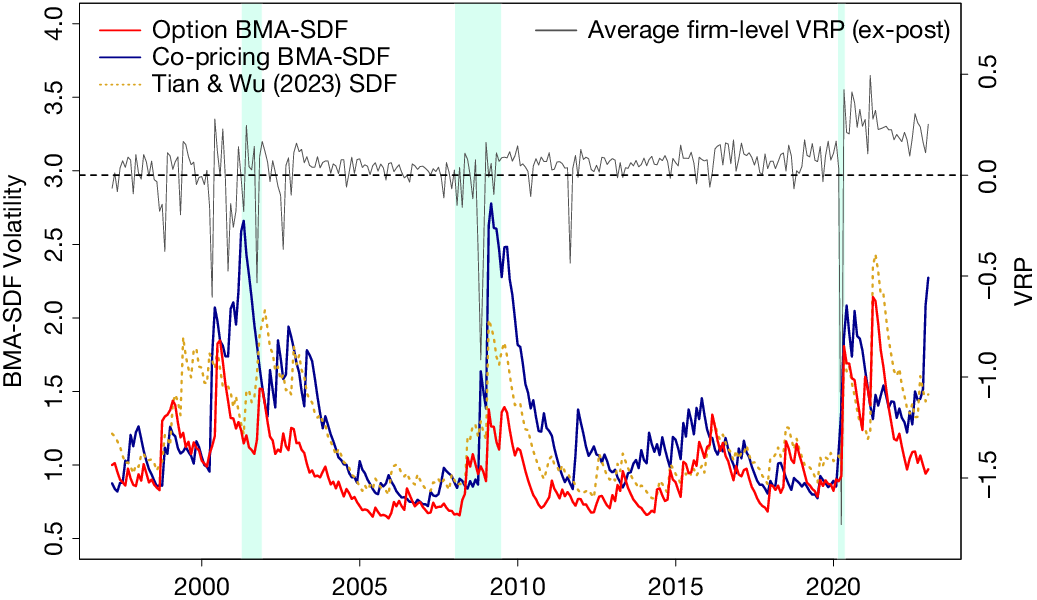
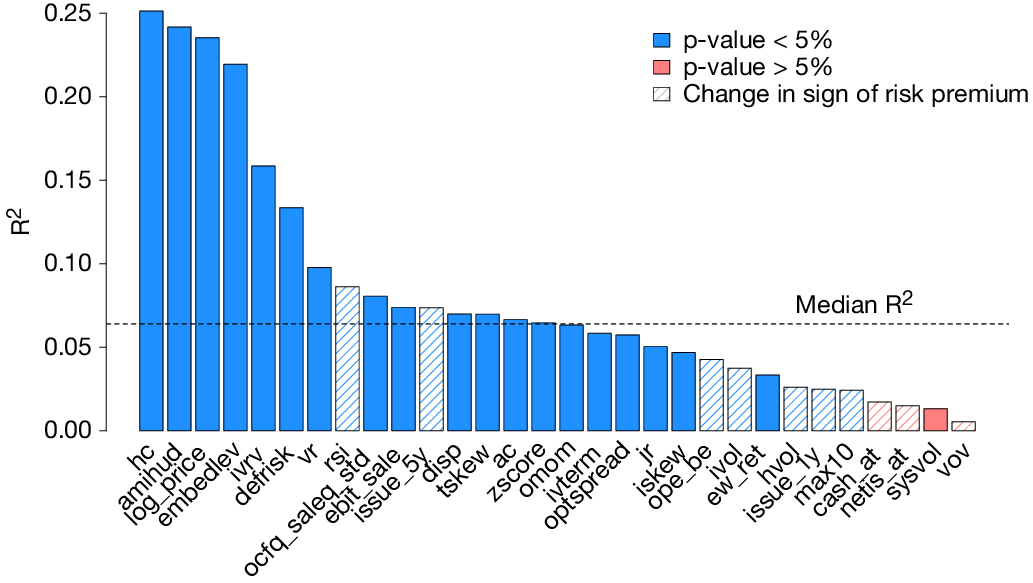


 Open access

