

Introduction
The precision and accuracy of the techniques used to derive information on the concentrations of soluble ions and gases in ice cores are remarkable. By coupling this information with annual-layering and stable-isotope data, researchers have produced depth–age correlated data on the concentrations of particles, trace gases and soluble impurities for several polar ice cores (Reference Legrand and MayewskiLegrand and Mayewski, 1997). Although there are still some questions about how accurately the impurity and gas concentrations measured in ice cores reflect the concentrations in freshly deposited snow – due to snow/firn interactions with the atmosphere prior to pore closure and to possible subsequent migration or diffusion in the ice – ice-core studies have contributed greatly to our understanding of paleoclimate and, hence, to foreseeing future climate change.
By comparison, the microstructural location of impurities in ice has only recently been the focus of research (see, e.g., Reference Fukazawa, Sugiyama, Mae, Narita and HondohFukazawa and others, 1998; Reference Wolff, Mulvaney and OatesWolff and others, 1988; Reference Baker, Cullen and IliescuBaker and others, 2003; Reference Barnes, Wolff, Mallard and MaderBarnes and others, 2003). The concentration and microstructural location of impurities in ice cores are both important since both can have significant impacts on the mechanical properties, recrystallization, grain growth, electrical conductivity, diffusion and texture (fabric) development of ice. The microstructural location of impurities could also very well influence the post-depositional movement of the impurities in ice cores, affecting the interpretation of the ice-core record.
In previous studies, we used energy-dispersive spectroscopy (EDS) in a scanning electron microscope (SEM) to examine a number of ice-core specimens from the Greenland Ice Sheet Project 2 (GISP2) core and found that although impurities were located throughout the ice, Na and Cl segregation occurred (occasionally with other elements) to the grain boundaries (GBs) and triple junctions (Reference Cullen and BakerCullen and Baker, 2001; Reference Baker and CullenBaker and Cullen, 2003; Reference Baker, Cullen and IliescuBaker and others, 2003; Reference Obbard, Iliescu, Cullen and BakerObbard and others, 2003). While EDS is useful for identifying the elements present in ice, it cannot identify compounds. For example, we commonly see sodium, potassium and chlorine X-ray fluorescence peaks in the same spectra, but we cannot tell whether they indicate NaCl, KCl or dissociated Na+ and Cl– ions. And, while EDS can reveal magnesium, sulfur and oxygen peaks together in ice, it is not possible to determine from EDS that MgSO4 (rather than MgS) is present, partially due to the ubiquity of the oxygen peak in ice. Further, it is not possible to detect ammonium ions or nitrates in ice using EDS since the X-ray fluorescence yields of light elements, such as nitrogen, are low, and the nitrogen X-ray peak sits adjacent to the omnipresent large oxygen X-ray fluorescence peak from ice, and is easily obscured by it (Reference Cullen and BakerCullen and Baker, 2001; Reference Obbard, Iliescu, Cullen and BakerObbard and others, 2003).
This paper presents preliminary observations of impurities in GISP2 ice using Raman spectroscopy on a confocal scanning optical microscope. Unlike EDS, Raman spectroscopy can identify ammonium, nitrates and sulfates as well as other molecules and chemical species. Further, it is possible to determine whether the Raman shift peaks, for example, arise from nitric acid, sodium nitrate or potassium nitrate.
In addition, we demonstrate the use of two SEM methods, selected area channeling patterns (SACPs) and electron backscatter patterns (EBSPs), for determining the orientations of grains and, hence, for determining the misorientations across GBs in ice. Apart from their higher spatial and angular resolution, one advantage of obtaining crystal orientations in ice using SACPs and EBSPs, compared to the traditional Rigsby universal stage, is that all three crystallographic axes are determined, whereas the Rigsby stage only allows the c axis to be determined. The latter is insufficient for distinguishing between the three main types of recrystallization in ice, i.e. rotational recrystallization, nucleation and growth of new grains, and strain-induced boundary migration (SIBM). Polygonization or rotational recrystallization, the formation of low-angle sub-boundaries by dislocations undergoing recovery, leads to only small changes in texture or fabric. Nucleation and growth of new grains changes the texture significantly, while SIBM may change the microstructure locally, but does not generally affect the overall texture (Reference JackaJacka, 1984; Reference Jacka and MaccagnanJacka and Maccagnan, 1984; Reference Budd and JackaBudd and Jacka, 1989; Reference De La Chapelle, Castelnau, Lipenkov and Duvalde la Chapelle and others, 1998). Using SACPs and EBSPs, it will be possible to clearly distinguish between these phenomena.
The ultimate goal of the work is to develop and use techniques to determine the microstructural location of all impurities in natural ice and, if the impurities have segregated to the GBs, determine if there are preferences for the impurities to segregate to some GBs and not to others.
Specimen Preparation
Specimens were prepared using previously established procedures (Reference Cullen and BakerCullen and Baker, 2000), i.e. the ice was carefully shaved with a razor blade, at −20˚C under a High Efficiency Particle Air (HEPA)-filtered, laminar-flow hood following standard clean-room practices, into thin plates typically 30 mm × 15 mm x 2 mm thick, which are flat, smooth and free of scratches. Specimens were then frozen onto a brass mount and transported at temperatures below -20˚C.
Raman spectroscopic analysis of the ice specimens utilized a Thermo Electron Nicolet Almega XR dispersive Raman spectrometer with a 532 nm frequency doubled Nd:YVO diode-pumped solid-state laser coupled to a confocal scanning optical microscope. The system has an integrated video camera that can be used to image the ice specimens which are mounted on a home-built, Peltier module-based, cold stage and held at −20˚C in a dry nitrogen gas environment. Care has to be taken so that light from the microscope objective does not cause localized melting of the ice. The sampling volume for Raman spectroscopy is roughly 1 × 1 × 2 μm, i.e. similar to that for EDS of ice.
Two different SEM techniques were used for analysis of the uncoated ice specimens, which were maintained at -70 to -120˚C using home-made cold stages. First, SACPs were obtained using backscattered electrons on a Zeiss DSM 962 SEM operated at 15 kV. Second, EBSPs were obtained using either a Zeiss SEM operated at 15 kV or an environmental FEI field emission gun (FEG) XL30 SEM operated at either 15 or 20 kV. For the EBSP work, the cold stage had a movable sled with a face inclined at 70˚ on which the ice was mounted; the 70˚ angle is needed to maximize the backscattered electron yield. EBSPs were acquired and automatically indexed using a HKL, Inc. Channel 5 Orientation Imaging System. It is worth noting that while the Zeiss SEM was run at high vacuum (5 × 10⁻⁴ Pa), the FEI FEG SEM was run in low-vacuum mode at a pressure of 13 Pa.
In acquiring both SACPs and EBSPs, the topography of the specimen surface is critical. While sublimation is desired because it reduces or even eliminates surface charging, it also has the adverse effect of roughening the surface of the ice. Hence, all the results below were obtained by very carefully balancing temperature, probe current and exposure time.
Results
Microchemical analysis
Figure 1 shows a Raman spectrum from a triple junction in 1551 m GISP2 ice. NaNO3 was found, for the first time, in both the GBs and triple junctions. As noted above, it would not have been possible to identify NaNO3 using EDS. A downside of Raman spectroscopy is that it is impossible to identify dissociated ions of elements such as Na, K, Ca, Al and Cl, which are easily identified with EDS. Thus, EDS and Raman spectroscopy can be viewed as complementary techniques for examining the microstructural location of impurities in ice.
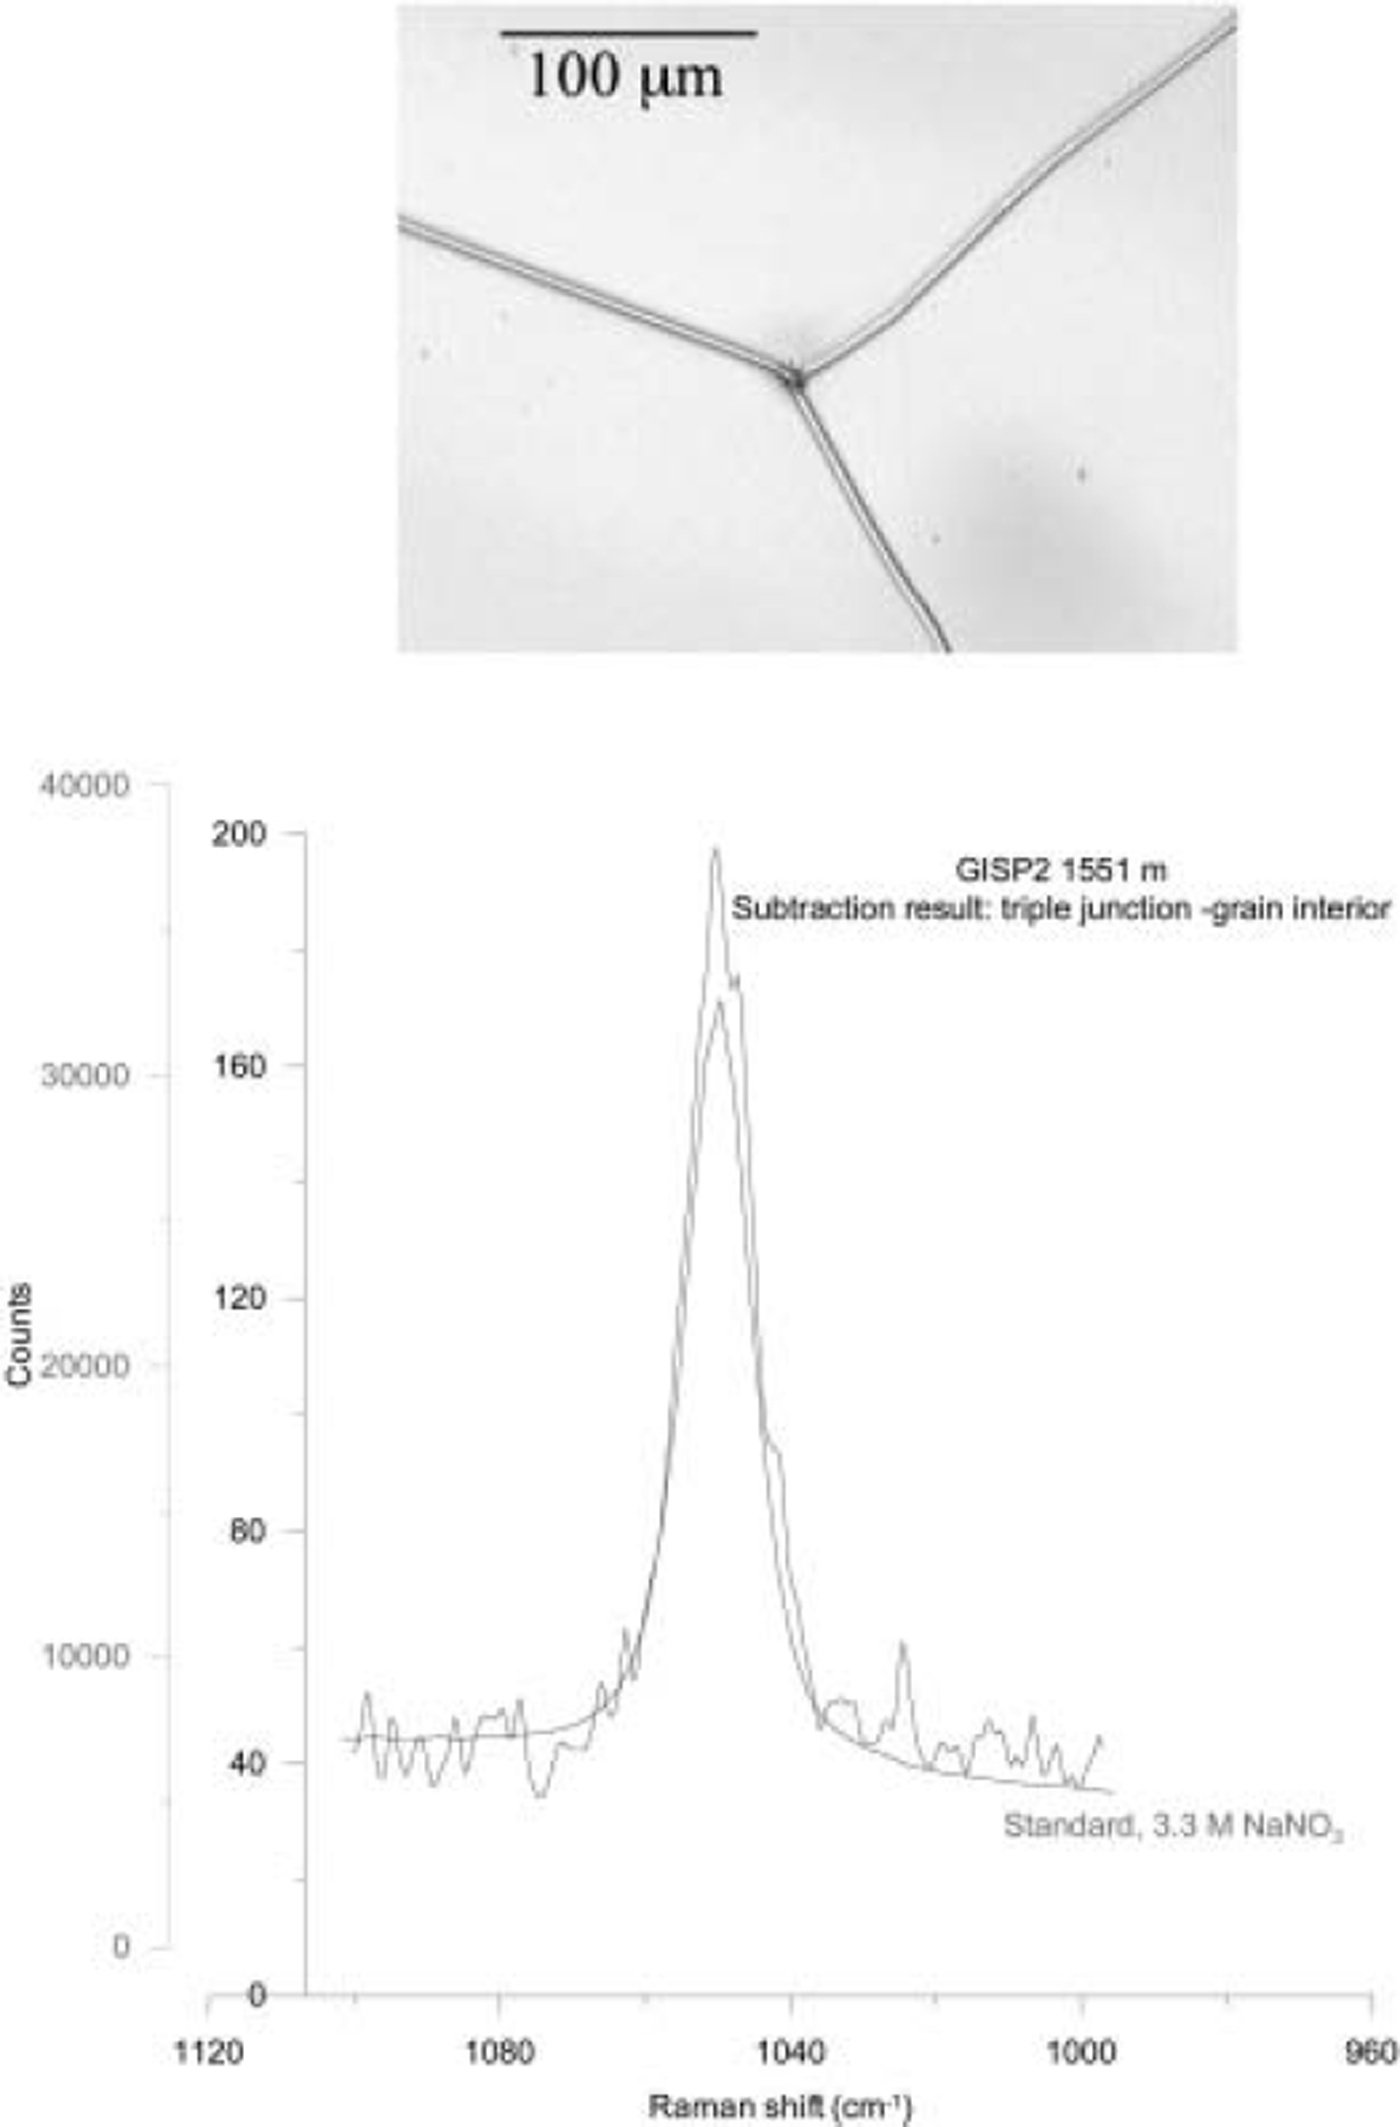
Fig. 1. Raman spectrum from the triple junction shown from 1551 m GISP2 ice, showing the presence of NaNO3. The ‘library’ NaNO3 spectrum is shown for comparison.
Orientation determination
SEM images are formed by rastering a focused electron probe over a specimen and, typically, collecting either the backscattered, secondary or absorbed electron signal and using it either to modulate the intensity of the electron beam in a cathode ray tube that is rastered in synchronization with the electron beam on the specimen, or after digitization, to form an electronic image. SACPs are obtained in a SEM by adjusting the lens currents so that the crossover from the second condenser lens is in the back focal plane of the objective lens (see Fig. 2a). This results in a parallel electron beam emerging from the objective lens, rather than the focused probe used for imaging. In addition, the first set of scan coils is turned off so that instead of a focused electron probe scanning the specimen (as in imaging), a parallel electron beam rocks, in a specified solid angle, about a selected area of 20-50 μm diameter on the specimen surface (see Fig. 2a). In the Zeiss DSM 962 SEM used here, and some other SEMs, these two actions occur automatically by switching to ‘SACP mode’. As the electron beam is rocked back and forth, the number of backscattered electrons captured by a detector located above the specimen fluctuates with the angle of incidence. For a particular set of lattice planes that are close to parallel to the incident beam direction, the backscattered signal exhibits a higher, almost-constant value for angles between –9B
and +6B, where 0
B
is the Bragg angle, and sharp drops when the inclination of the beam becomes slightly larger than |θB| (Reference Joy, Newbury and DavidsonJoy and others, 2006). In the latter orientations, the electrons are channeled into the specimen, traveling parallel to the lattice planes with little scattering, and consequently the electron backscatter signal exhibits a minimum. Even small deviations of the rocking beam from this channeling condition cause the number of backscattered electrons to increase. It is the difference between this weak channeling signal and the stronger signal within the 29B
range that produces the Kikuchi band. The Kikuchi bands can be envisioned as being rigidly attached to the crystalline lattice of the specimen, so they move if the specimen is tilted or rotated, but not if it is translated. Figure 3 shows an example of a pattern from ice. Note that second-order, i.e. (
![]() ), Kikuchi lines can be seen outside the
), Kikuchi lines can be seen outside the
![]() Kikuchi lines, indicating good pattern quality. Indexing is performed using the fact that the width of each band is proportional to (double) the Bragg angle for the appropriate set of planes, while the angle between the bands matches the angle between the corresponding lattice planes. The ice crystal from which the pattern was obtained had its [001] direction inclined at 3.2˚ to the incident electron beam.
Kikuchi lines, indicating good pattern quality. Indexing is performed using the fact that the width of each band is proportional to (double) the Bragg angle for the appropriate set of planes, while the angle between the bands matches the angle between the corresponding lattice planes. The ice crystal from which the pattern was obtained had its [001] direction inclined at 3.2˚ to the incident electron beam.
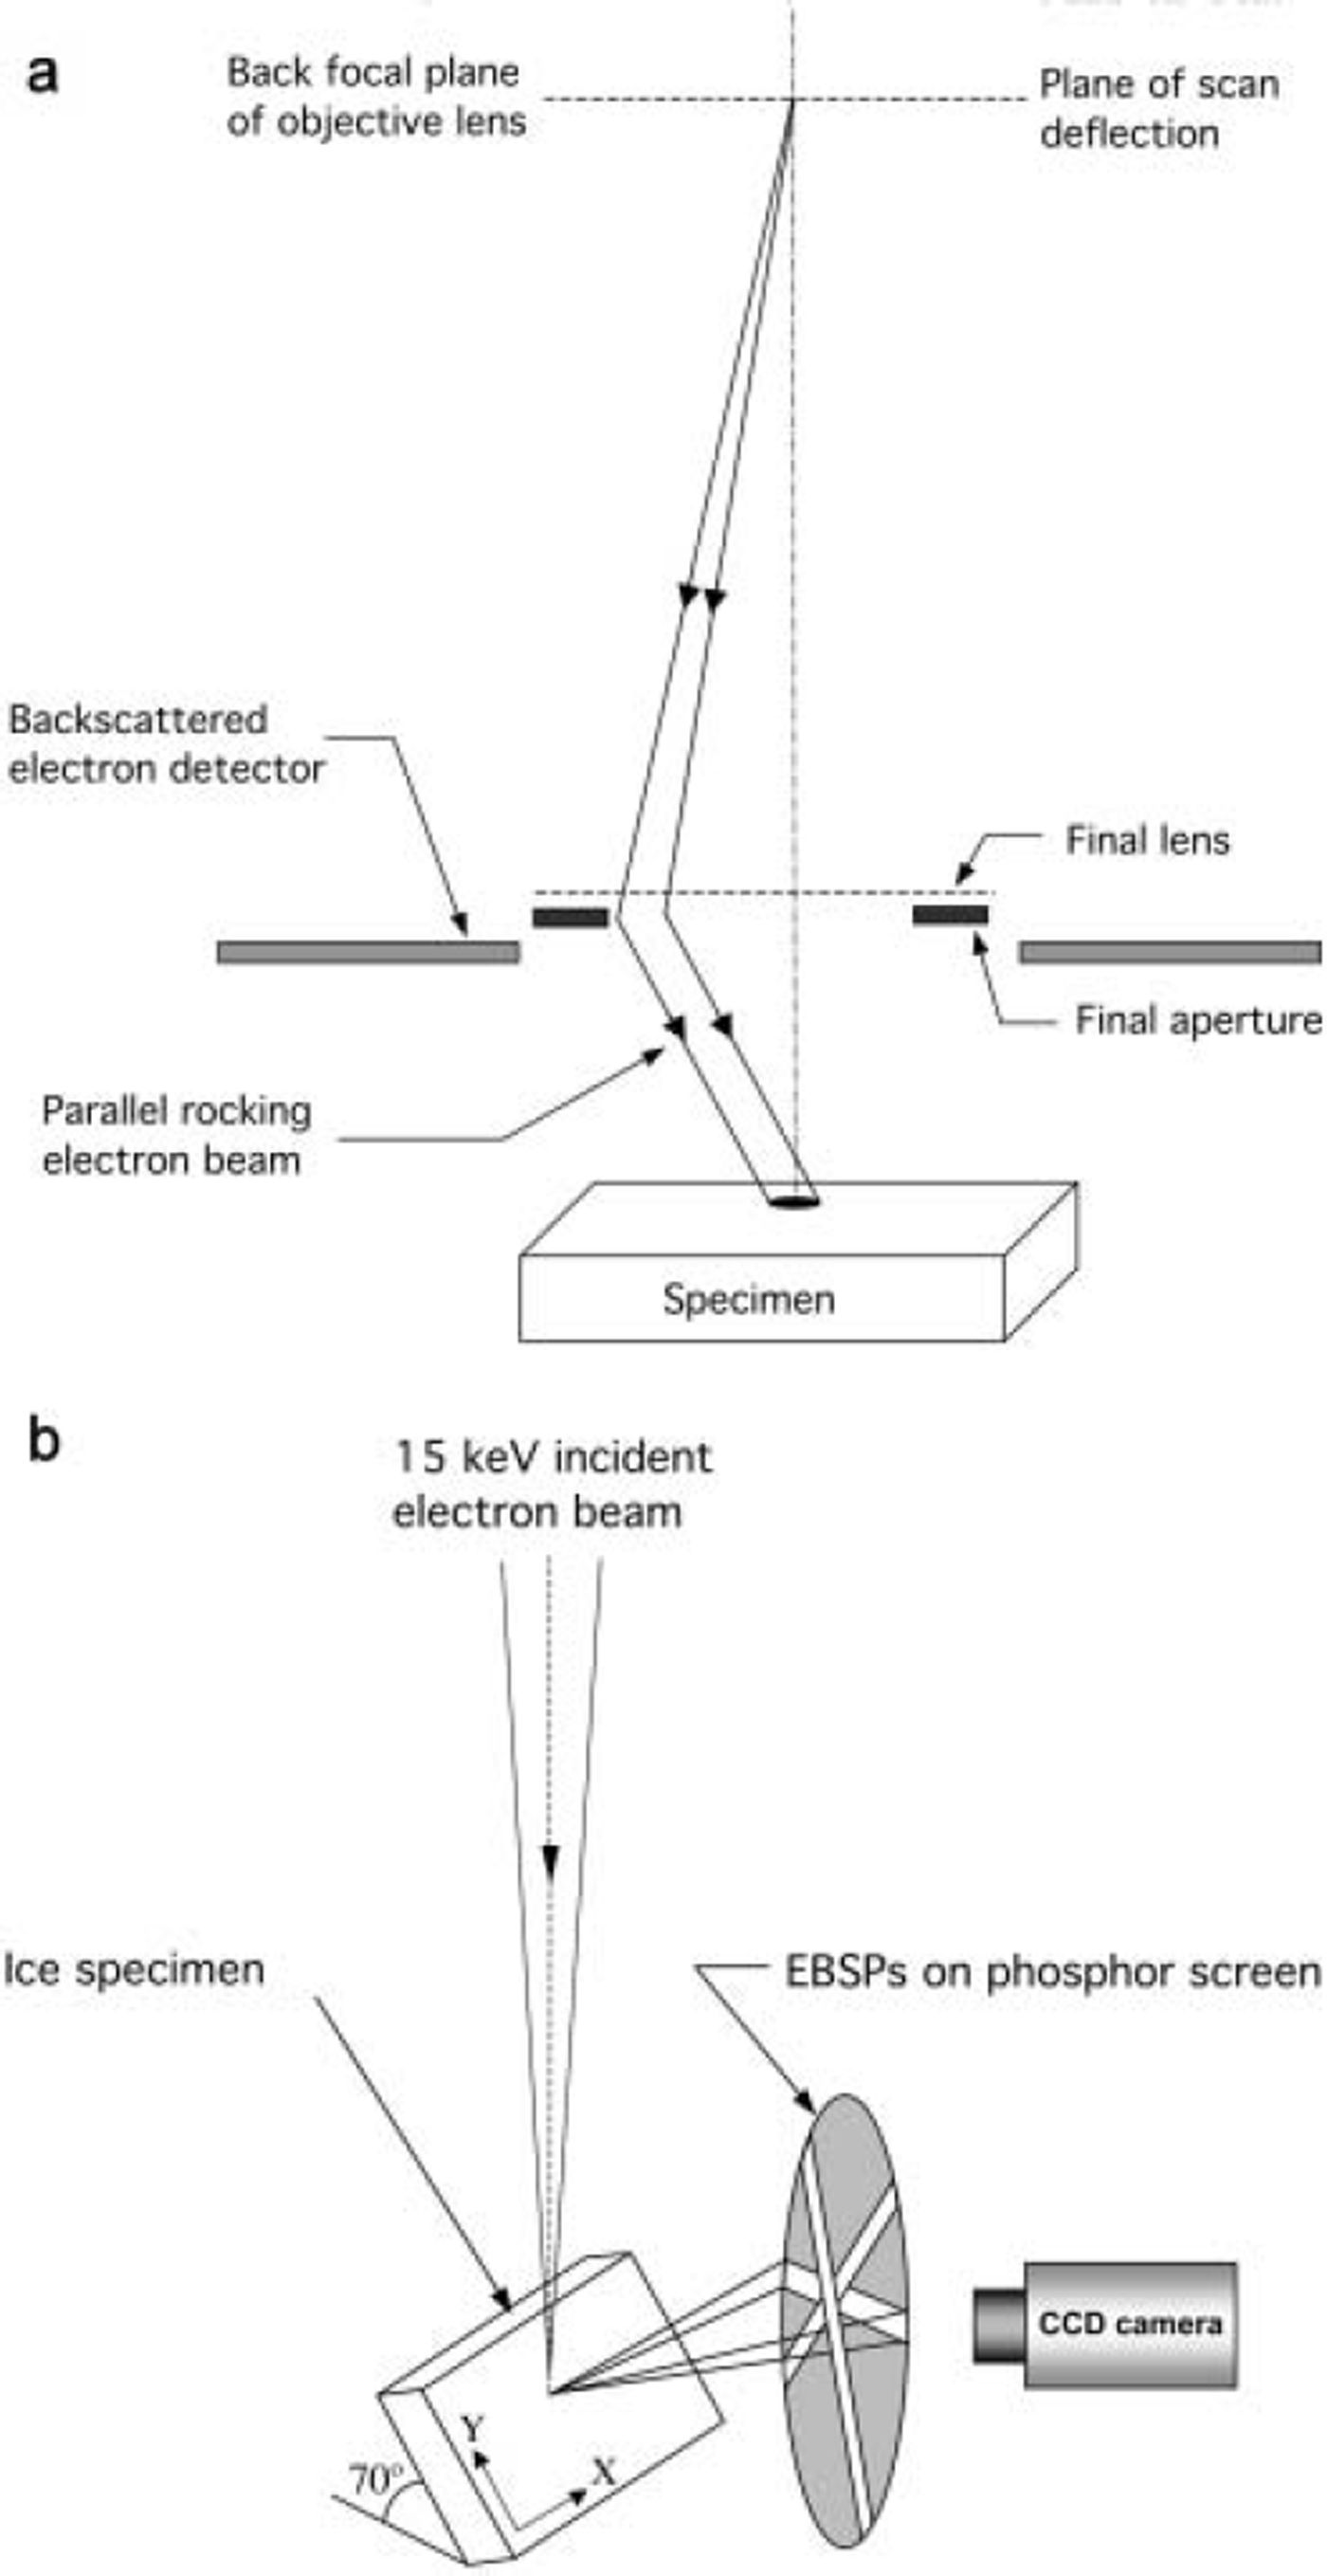
Fig. 2. Set-up for (a) SACP collection and (b) EBSP collection.
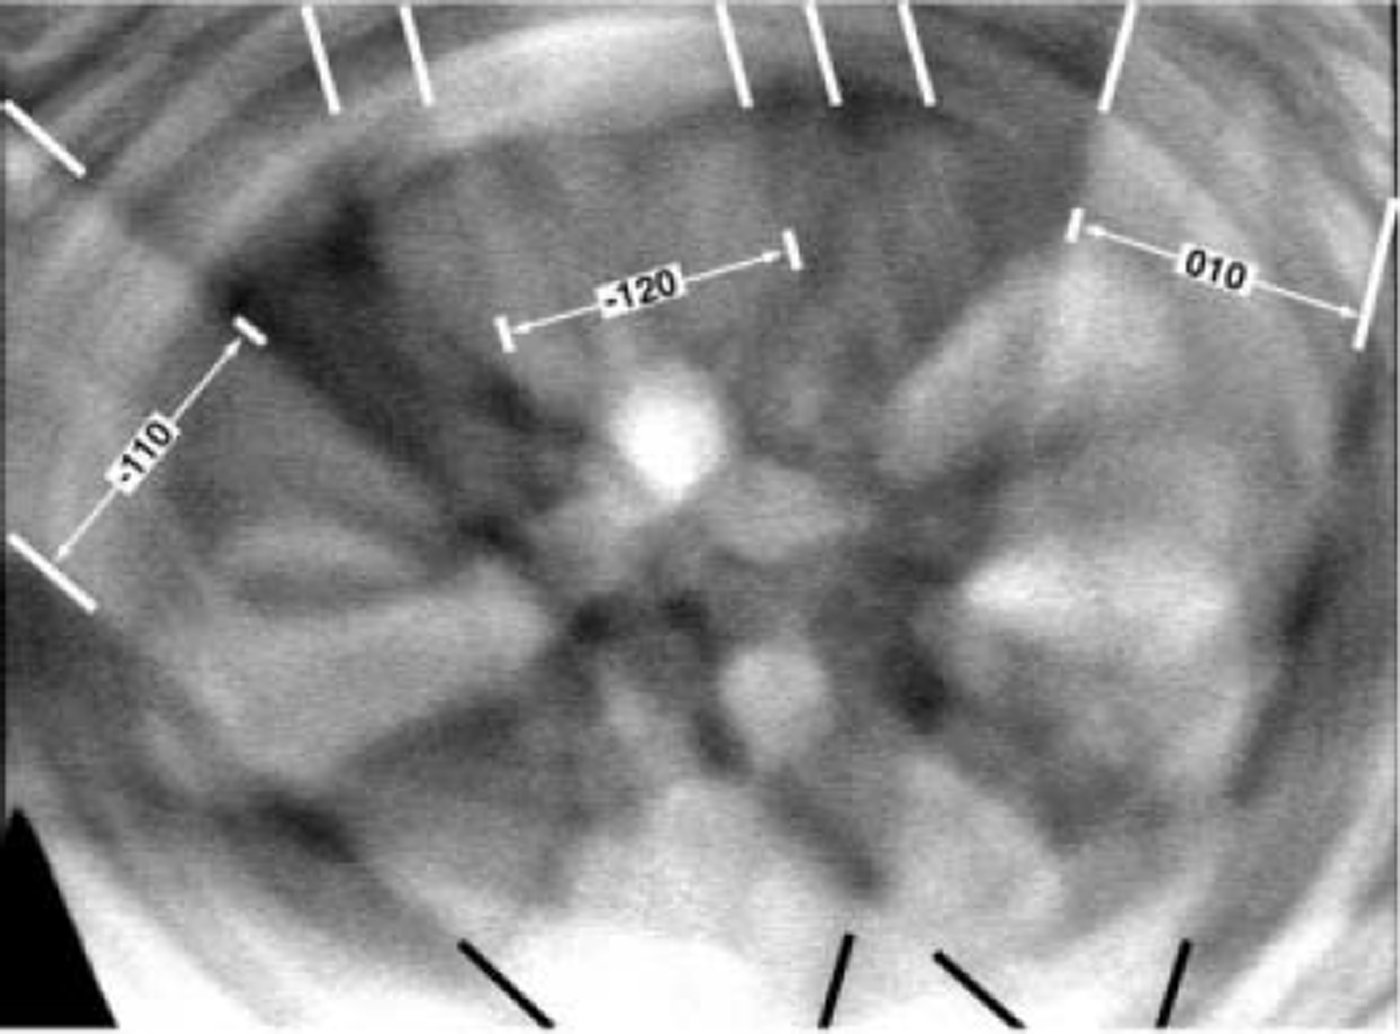
Fig. 3. SACP obtained from an ice single crystal in a SEM operated at 15 kV. The black and white lines were added to help the eye pick out the indexed Kikuchi bands. The orientation of the crystal is such that its [001] direction is inclined at 3.2˚ to the incident electron beam.
EBSP formation is also straightforward. The convergent scanning electron probe, used in imaging mode, is simply stopped at a point of interest on the highly tilted ice specimen. The electrons are inelastically scattered in all directions and subsequently diffracted by crystal planes according to Bragg’s law. For each set of planes that satisfy Bragg’s law, the diffracted electrons form a pair of opposite wide-angle cones that intersect a phosphor screen in front of the specimen as parallel pairs of Kikuchi lines. The resulting EBSP on the phosphor screen is recorded using a charge-coupled device (CCD) camera (see Fig. 2b). Figure 4 shows examples from ice.
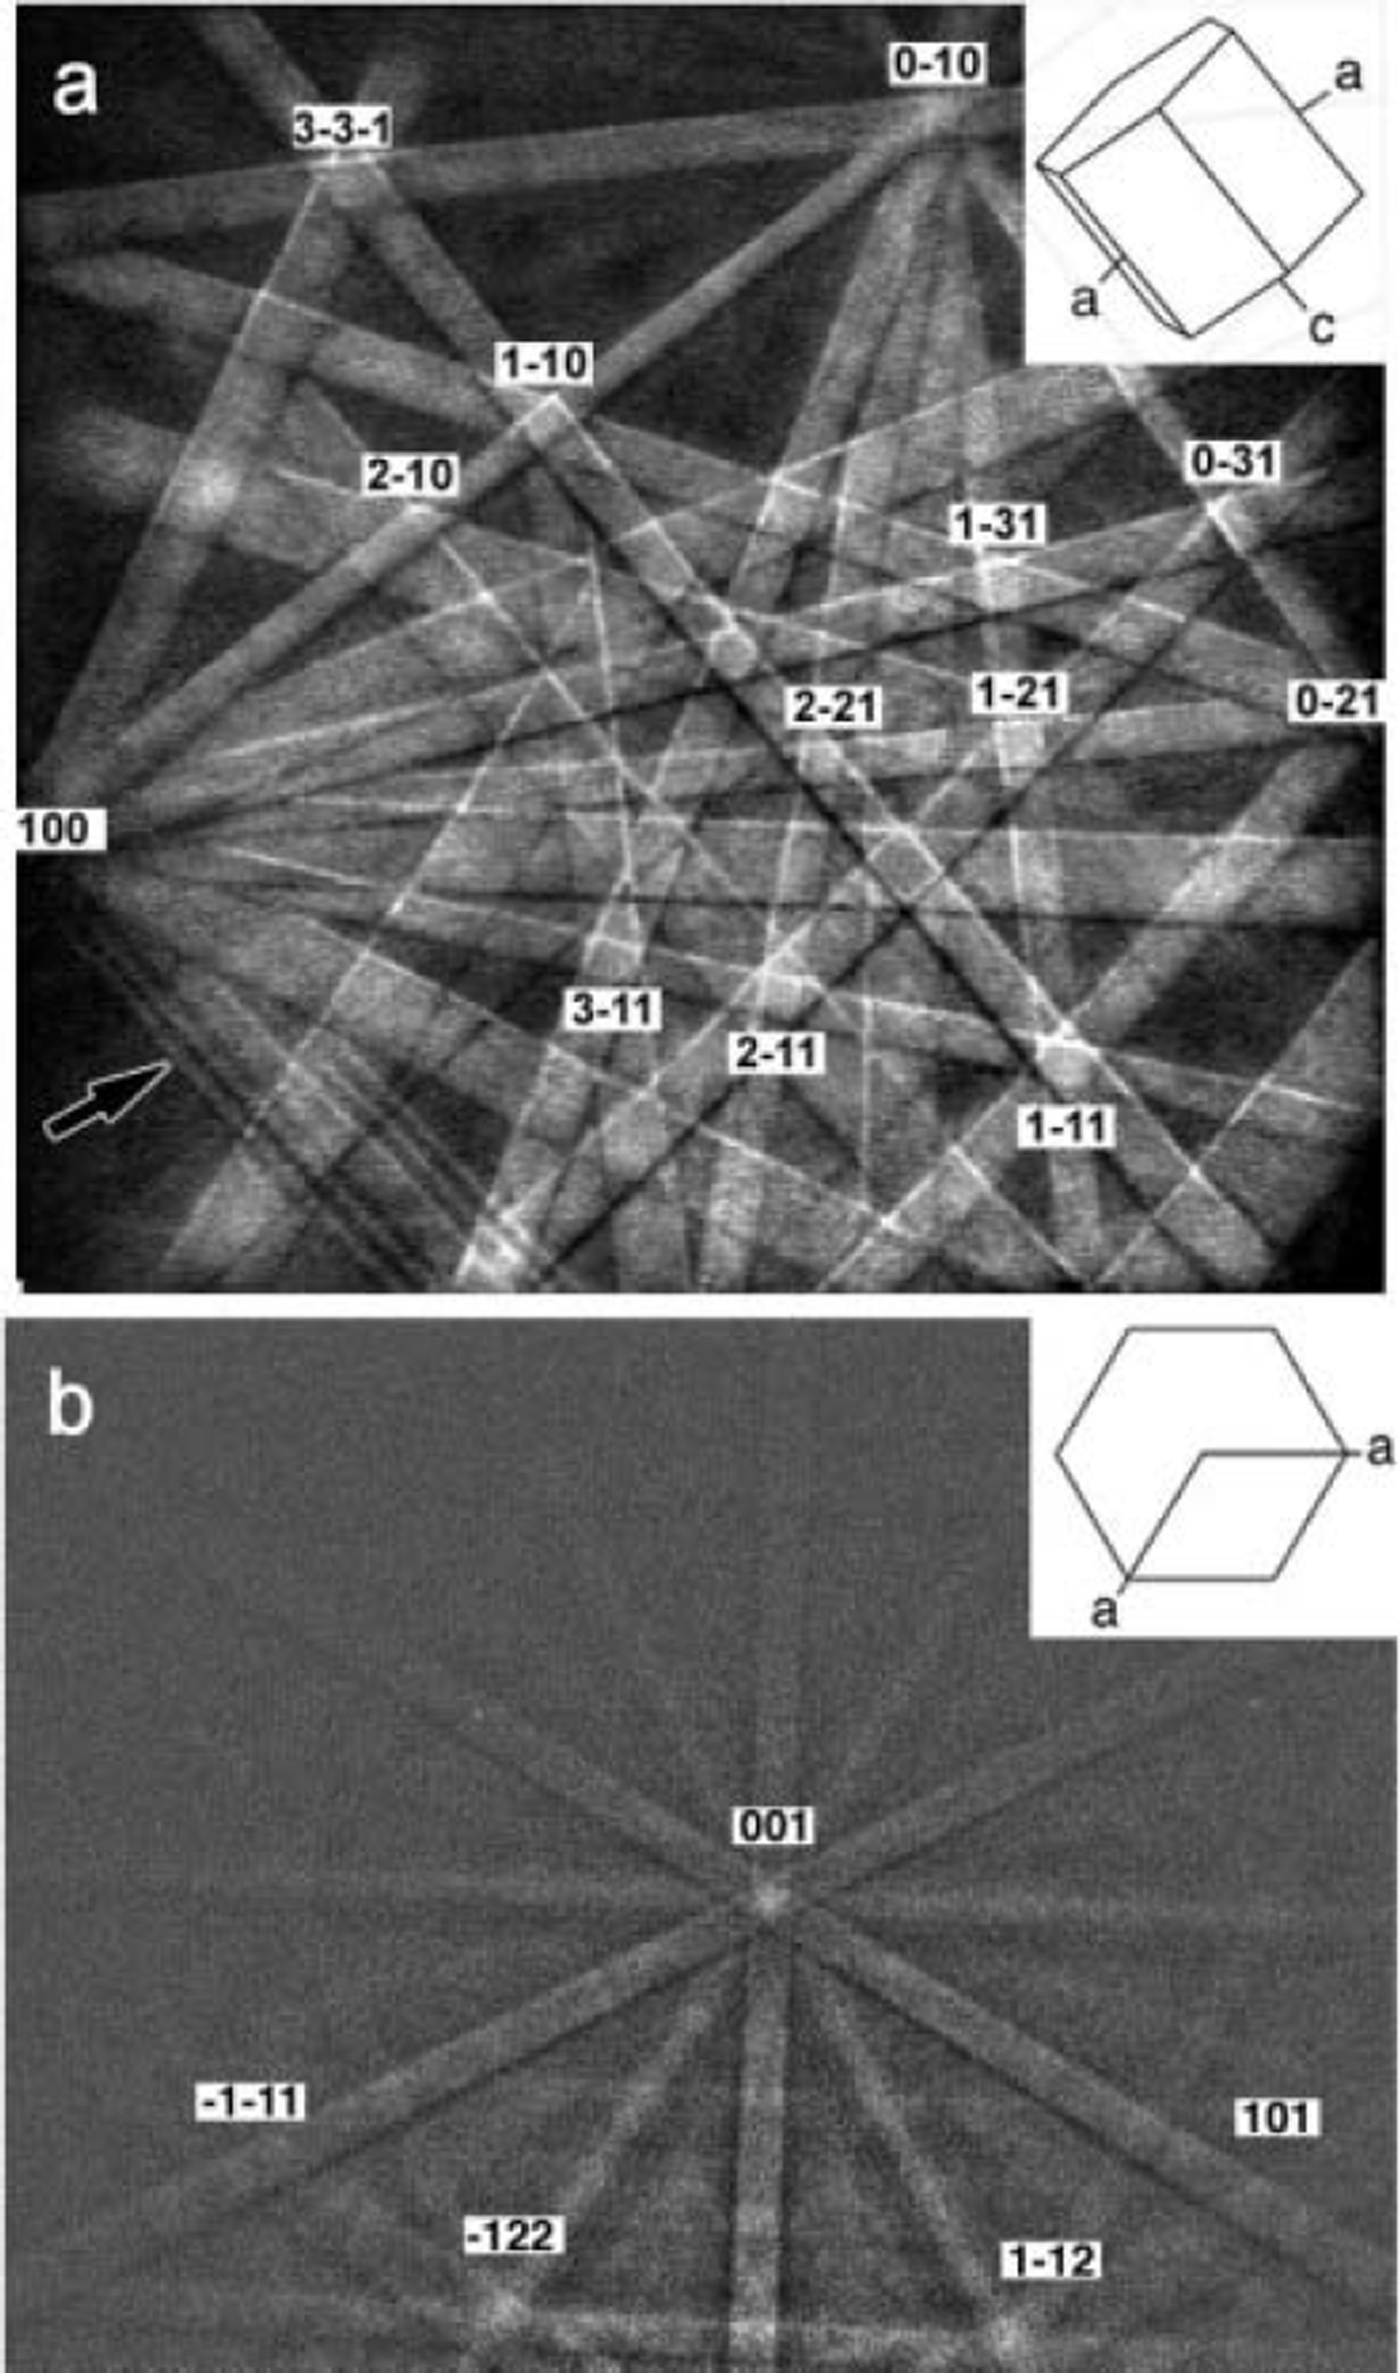
Fig. 4. EBSPs obtained from individual grains in polycrystalline ice using 15 keV electrons. The indices indicate the major poles where the Kikuchi lines intersect. The inset schematics show the orientations of the grains from which the patterns were obtained. Pattern (a) was obtained in conventional SEM at a vacuum of 5×10⁻⁴ Pa, while (b) was obtained in a FEG SEM run in environmental mode at a chamber vacuum of 13 Pa. Note the third-order lines on some Kikuchi bands (arrowed).
Figure 4a was obtained using the Zeiss SEM, which has a tungsten filament and operates at a chamber vacuum of 5 × 10⁻⁴ Pa. Note the high quality of the pattern: third-order lines can be observed on some Kikuchi lines (see the examples arrowed). Figure 4b was obtained using the FEI FEG SEM run in environmental mode at a chamber vacuum of 13 Pa. The lateral resolution on the Zeiss SEM is ≤ 0.5 μm, whereas the Nordlys detector on the FEI FEG SEM provides a lateral resolution of ∼20 nm. The pattern quality on the FEG SEM under the low vacuum, while worse than the EBSPs obtained at high vacuum, is still remarkable. The patterns are indexed using the same approach as for SACPs, i.e. using the fact that the width of each band is proportional to the Bragg angle for the appropriate set of planes, while the angle between the bands matches the angle between the corresponding lattice planes. Practically, a computer automatically indexes the EBSPs once the crystallographic parameters of the material being studied have been input. The orientations of the two ice grains from which the EBSPs in Figure 4 were obtained are shown as hexagons on the EBSPs. The orientations can, of course, be shown on a stereogram, presented as Euler angles, Miller indices or in any other form.
With the Nordlys detector on the FEI FEG SEM, up to 100 patterns can, in principle, be acquired and indexed per second. This allows orientation image maps to be constructed by obtaining and indexing several tens of thousands of EBSPs and color-coding the grains in a constructed image based on their orientation (Reference Iliescu, Baker and ChangIliescu and others, 2004).
Both SACPs and EBSPs enable grain orientations to be determined to an angular resolution of ∼0.1˚, hence the misorientations across GBs can be determined to high accuracy. This will allow the segregation behavior at GBs to be related to their misorientation. The advantage of using SACPs is that the specimen is horizontal during pattern collection, which is the specimen orientation used for EDS collection. On the other hand, a problem with obtaining SACPs from ice is that sublimation leads to surface roughening, resulting in out-of-focus topographic contrast embedded in the Kikuchi lines, which can be observed in Figure 3 as the bright features in the pattern background. This is not a problem in EBSP formation, but a disadvantage of EBSPs compared with SACPs is that the specimen is tilted to 70˚ for EBSP collection but has to be returned to horizontal for EDS data collection.
Summary
For the first time, we have found NaNO3, using confocal optical microscopy coupled with Raman spectroscopy, at the GBs and triple junctions in ice from GISP2. We have also shown that it is possible to use two SEM-based techniques, SACPs and EBSPs, to determine the complete crystallographic orientations of grains in ice to both higher angular and spatial resolution compared to the traditional Rigsby stage technique.
Acknowledgements
This research was supported by US National Science Foundation (NSF) grant 0221120 and Army Research Office (ARO) grant DAAD 19-03-1-0110. The views and conclusions contained herein are those of the authors and should not be interpreted as representing official policies, either expressed or implied, of the NSF, ARO or the US Government. The authors would like to thank the three anonymous reviewers for their efforts.


