

Metabolomics has been used in healthy companion animal research to investigate aspects of the individual, breed and sex and, in cats, changes that occur with sexual development and neutering(Reference Viant, Ludwig and Rhodes1–Reference Lloyd, Beckmann and Wilson5). Metabolomics has also been applied to characterise nutritional interventions, comparing adaptations to glucose supplementation between cats and dogs(Reference Allaway, Kamlage and Gilham6) and characterising the effect of varied diets on the plasma metabolome in either dogs(Reference Lloyd, Beckmann and Wilson5, Reference Forster, Heuberger and Broeckling7) or cats(Reference Deng, Jones and Swanson8). Nutritional metabolomics can also be applied to investigate long-term responses to dietary changes (macronutrient and micronutrient), and has been used to investigate differences in the dynamic postprandial state in human subjects(Reference Pellis, van Erk and van Ommen9). Here, metabolomics was applied to characterise consequences of feeding diets differing in micronutrient content on the plasma metabolome over an extended time and describe the influence of the individual and dynamic change across a postprandial time course.
Reports of unexpected linearity in, and high proportionality of, Ca absorption responses in dogs following short-term consumption of diets high in Ca(Reference Mack, Alexander and Morris10) led to a long-term study (40 weeks) and detailed evaluation across a range of relevant measures, such as renal function and bone mineral analysis(Reference Stockman, Watson and Gilham11). Using a parallel design, with dietary Ca fed near to the current minimum and maximum recommended intakes(12, 13), Ca absorption proportionally decreased in those dogs fed a high-Ca diet long term with no adverse effect of long-term exposure to raised Ca identified across a range of parameters most likely to be affected. However, evidence from a meta-analysis had been presented to suggest that the dog does not regulate Ca as expected based on analyses of some other characterised species(Reference Mack, Alexander and Morris10) and under such circumstances it is appropriate to consider alternative data-driven approaches that may identify unforeseen effects. Metabolomics is one such approach that may not only provide evidence of unexpected differences in response to different diets but also provide interpretable insights into companion animal metabolic responses to consuming diets per se (i.e. postprandial effects)(Reference Allaway14).
Previously, the effect of high v. adequate Ca intake on the plasma metabolome in growing piglets(Reference Metzler-Zebeli, Ertl and Klein15) highlighted postprandial changes in plasma metabolites (glucose, lipid and amino acid metabolism) associated with dietary Ca, indicative of changes in nutrient uptake or whole-body energy metabolism. The physiological data from the effect of dietary Ca on juvenile pigs are consistent with a proposal that Ca regulates energy metabolism, with obesity being inversely correlated with Ca intake(Reference Sun and Zemel16). To our knowledge, three other metabolomic studies have considered the role of dietary Ca(Reference Pilvi, Seppanen-Laakso and Simolin17–Reference Wang, Yang and Wang19), all are human studies and all indicate changes in energy metabolism and various phenotypes in response to Ca. These reports provide evidence to support the use of metabolomics to investigate potential consequences of dietary Ca at higher levels than the National Research Council minimum in dogs. In addition to profiling fasted plasma samples, different aspects of metabolic health may be identified in the postprandial response to diet(Reference Pellis, van Erk and van Ommen9). To determine acute and adaptive physiological responses to increased dietary Ca we also compared the postprandial time course after 1 d and after 24 weeks of adaptation to a diet with Ca near the maximum recommended in commercial diets with that of the baseline diet, offering an opportunity for the first detailed study of the postprandial metabolome in the dog. The primary objective was to determine whether feeding a high-Ca diet caused statistically significant changes in plasma metabolite pools in the fasted and/or postprandial state and, if so, interpret any implications. In addition, the study provided an opportunity to investigate other factors driving difference in the canine metabolome, such as time (repeated measures within individuals across 40 weeks), or following meal consumption.
Materials and methods
Animals
A total of eighteen healthy, adult Labrador retriever dogs (aged 2·3–7·3 years, median 3·2 years) were randomly assigned to one of two diet groups (test diet group, n 10 and control diet group, n 8), balanced by sex (nine male neutered, nine female spayed), age, body weight (BW), litter mates and individual energy requirements to maintain an ideal body condition score (kJ kg BW0·75) to minimise potential confounding. Dogs were housed with other dogs on the same diet in purpose-built, environmentally enriched housing at the WALTHAM Centre for Pet Nutrition.
Diets
Diets were formulated to differ in the amounts of Ca provided (1·7 g Ca/4184 kJ and 7·1 g Ca/4184 kJ for the basal and high-Ca diets, respectively, with additional dietary P to maintain the Ca:P). The two diets were similar in formulation except as consequences of the need for different Ca content in the pre-mix, resulting in higher Fe content in the high-Ca diet. Nutritional analysis (Mars Petcare Europe Central Laboratory) indicated that fat and protein also differed (for nutritional composition, see Supplementary Table S1). Both diets were compliant with minimum requirements(12, 13) following supplementation to diets with ionic Se (as liquid sodium selenate; Metabolic Ltd) and riboflavin (powder; Solgar Ltd) on a daily or weekly basis, respectively (Se 120 µg/4184 kJ; riboflavin 1·8 mg/4184 kJ). Individuals were fed once daily (accessible for 30 min) to maintain their ideal body condition score, reviewed weekly.
Study design
The research protocol was reviewed and approved by the WALTHAM Animal Welfare and Ethical Review Body and carried out under the authority of the Animals (Scientific Procedures) Act 1986. The design was powered to have at least a 80 % chance to detect a 6 % reduction, from a baseline of 12 %, in the percentage difference in percentage retention of Ca(Reference Stockman, Watson and Gilham11). The group sizes, similar to other metabolomics studies reported in dogs from the same environment(Reference Viant, Ludwig and Rhodes1, Reference Beckmann, Enot and Overy2, Reference Allaway, Kamlage and Gilham6), provided confidence in undertaking a metabolomics analysis. All dogs were fed the control diet (basal Ca) for 60 d prior to the baseline fasted blood samples (T1). After a further 6 d, the test dogs were moved on to the test diet. Fasted blood samples for metabolomics analysis were taken at 8-week intervals for 40 weeks for all dogs (for a schematic of sampling occasions, see Supplementary Fig. S1). In addition, to determine effects of feeding a high-Ca diet on the postprandial plasma metabolome, blood samples were collected hourly (1–4 h post-meal) on three occasions for those dogs that transitioned to the test diet (control diet (T1), following exposure to the test diet for 1 d (T2) and following exposure for 24 weeks (T5)). In all cases, blood (1 ml) was sampled from a cephalic catheter, and transferred to LiHep tubes on ice until centrifugation. Subsequent plasma samples (500 µl) were stored at −80°C (except when transported on dry ice to Metanomics Health).
Metabolic profiling
Plasma metabolites were measured on the MxP® Global Profiling Platform (Metanomics Health GmbH). This incorporated gas chromatography-MS and liquid chromatography-MS/MS(Reference Allaway, Kamlage and Gilham6, Reference Mutch, Fuhrmann and Rein20). An aliquot of each sample was used to provide a pooled reference sample. This was then used in every batch of samples analysed together and used to compensate for batch-to-batch variation, with data normalised against the median of the pool per batch (semi-quantitative data). Quality control was performed on peak, analyte and sample levels. As part of the quality control process, metabolites were required to meet specific a priori quality criteria, such as limit of detection, dynamic range, signal:noise ratio and standard deviation from the internal standard. Outliers were manually checked and corrected and only those metabolites that were above the limit of quantification in the majority of samples were used for further statistical analyses. To illustrate changes in related metabolites, compounds were grouped in ontology groups according to similar overall structural and/or biochemical characteristics. They were further sorted into sub-groups according to common metabolic pathways or biochemical features.
Data analysis
Data were log10 transformed prior to analyses. Univariate analyses were performed separately on the postprandial data from the test diet group and on the fasted data for both diet groups via mixed-effects ANOVA models. ANOVA models were set up with diet group, sampling time point, sampling type (fasted v. postprandial samples), sex, age and energy intake as fixed factors and dog as random factor. Pairwise contrasts were made; between the fasted samples of the two diet groups at each corresponding time point (T1, T3–T7; Supplementary Fig. S2(a)); comparing the changes between the fasted samples at each time point (T3–T7) and the fasted baseline (T1) between the two diet groups (Supplementary Fig. S2(b)); between the fasted samples at each time point (T2–T7) and the fasted baseline (T1) for each diet group (Supplementary Fig. S2(c)); comparing the changes between each postprandial time point and the corresponding fasted sample (for T2 and T5) to those at baseline (T1) (Supplementary Fig. S2(d)); between postprandial samples at each hourly time point (T2 and T5) to the same hourly time point at baseline (T1) (Supplementary Fig. S2(e)) and between each postprandial time point and the corresponding fasted sample at T1, T2 and T5 (Supplementary Fig. S2(f)). The false-discovery rates were adjusted for multiple comparisons at 5 %(Reference Benjamini and Hochberg21).
Variance components analysis was performed per metabolite using only the fasted data. Each metabolite was modelled using a mixed-effect ANOVA model with the metabolite measure, on the log10 scale, as the response and sampling occasion as a fixed effect. The log10 scale was implemented after the residual v. fitted comparison showed non-normal residual variance. The model random effect was dog and the estimated dog and residual variances (inter-animal and intra-animal, respectively) were extracted and used to identify metabolites varying the most between dogs by calculating the proportion of the total variance accounted for by the inter-animal variance.
Cluster analysis was performed by extracting the means from 0 to 4 h postprandial and using these vectors to create the postprandial profiles to be clustered separately for control diet and test diet measurements. Only metabolites with at least two significant changes from the baseline measurements at 1, 2, 3 or 4 h following meal consumption were selected. The clustering was performed using complete linkage hierarchical clustering analysis with Pearson correlation as the distance measure. ANOVA, variance components analysis and cluster analysis were performed in R (version 2.8.1(22)) with either package nlme(22, Reference Pinheiro, Bates and DebRoy23) or package lme4(Reference Bates, Maechler and Bolker24). Both packages fit the same models. For multivariate statistical analyses data were log10 transformed, centred and scaled to unit variance. Multivariate analyses were performed using Simca version 13 (MKS Data Analytics Solutions).
Results and discussion
General health data have been reported in detail(Reference Stockman, Watson and Gilham11) but in brief, BW and energy intake were not significantly different between the groups at any time. Following the baseline period (T1), Ca intake across the study was 200 (sd 26) mg·kg BW0·75/d for the control diet group and 881 (sd 145) mg kg BW0·75/d in the test diet group. In addition, all health-related measures (e.g. haematology, serum biochemistry) remained within normal ranges throughout the study and none showed consistent significant differences between the groups (P > 0·05).
Metabolite profiling data consisted of samples from all eighteen dogs. One dog from the test diet group was removed from the study due to a non-trial-related health issue after time point 5, resulting in two missing fasted samples for this group. Additionally, two fasted samples from dogs in the control diet group (both from the T5 time point) were also not taken because behavioural assessment indicated that the dogs could not be sampled without causing unnecessary stress. Therefore, the study consisted of 234 plasma samples. A total of 180 metabolites (146 known/thirty-four unknown) met the quality criteria for statistical analysis and interpretation.
Univariate analysis indicated a very limited effect of feeding a high-calcium diet on the fasted or postprandial plasma metabolome
Univariate analysis comparing the fasted plasma samples from the two diet groups at each time point (for a schematic, see Supplementary Fig. S2(a)) found no metabolite to be significantly different. Also, when comparing the change from baseline between diets (schematic in Supplementary Fig. S2(b)), only one metabolite (ethanolamine plasmalogen C39 : 5 (additional: choline plasmalogen (C36 : 5)) was significantly different, higher in the control diet group at time points T5 and T6 (fold changes of 1·16 (95 % CI 1·06, 1·26) and 1·19 (95 % CI 1·09, 1·3)). However, when comparing fasted samples with the baseline within group (schematic in Supplementary Fig. S2(c)), the number of significant differences was greater than expected by chance in the test diet group at T6 and T7 (32 and 40 weeks, respectively), whilst the number observed in the control diet group never exceeded the significance threshold (Supplementary Table S2). Of those metabolites (Table 1), ten were related to amino acid metabolism, with only ornithine also being significantly different in the control dogs over the same time span. Except for tryptophan, other amino acids had an increased pool in the fasted state. These differences were not significant enough to see in comparisons between diets over time because of a time-dependent effect observed in both groups.
Metabolites with significant fold changes (ratios) between the T6 and T7 time points and T1 (control diet)
(Mean values and standard deviations)

Significant, relative to T1: * P <0·05, ** P <0·01.
† Tryptophan was also included (though significant only at T6) as it is relevant to the discussion of amino acid metabolism.
As the purpose of the main study was to identify potential risks of long-term exposure to a high-Ca diet it was considered prudent to investigate the time effect with a lower threshold. Metabolites that differed from baseline in the fasted state within group were selected using cut-off criteria of unadjusted P value <0·05 and at least a 20 % change from baseline on at least three of six possible occasions (for the test diet group) or two of five possible occasions (for the control diet group) (Supplementary Table S3). Twenty-three metabolites met these criteria: twelve in the test diet group (ten already noted in Table 1 and, in addition, citrulline and taurine) and thirteen in the control diet group, with only citrulline meeting the criteria in both. Including all data in the table, this approach indicated a potential influence of an interaction of diet change over time on S-amino acid metabolism (elevated serine, taurine and methionine) and altered deamination cycle (elevated asparagine and ornithine, reduced urea). However, as dietary protein differed by 10 % (Supplementary Table S1), these effects might not be attributable to dietary Ca per se nor did the dogs show any adverse health effects to suggest a health concern(Reference Stockman, Watson and Gilham11).
All of these analyses suggest that feeding a high-Ca diet had very little consequence to the individuals in the fasted state. In the test group, when comparing the postprandial change from fasted between the baseline (T1) and test group; T2 (acute) and T5 (chronic) (for a schematic, see Supplementary Fig. S2(d)), only ‘phosphate (inorganic and organic)’ was different at both T2 and T5 (fold change 1·35–1·44 between 2 and 4 h post-meal). This is readily explained by the fact that dietary phosphate was also supplemented in the test Ca diet to maintain the Ca:P ratio. The only other metabolites identified as being significantly different between the two diets in the comparison of postprandial time points with the fasted sample were lysine and tyrosine. Both were different between the control diet and following 1 d consumption of the test Ca diet (T2) and only at 3 h post-meal.
Comparing the two diet groups' data at each time point and also the postprandial data on the two diets, they indicate only a marginal effect of feeding a high-Ca diet on the plasma metabolome. Whilst diet-associated changes in metabolite pools were significantly different from the control diet at 32 and 40 weeks, these metabolites and their fold-change responses were not indicative of any health concern. The minimal effect of these diets on the canine plasma metabolome (based on significant differences in metabolites), alongside the findings from the physiological measures taken in the same study, provide no justification for reducing the current Ca maximum level for adult large breed dogs. In addition, the absence of an effect of diet on lipid and amino acid levels across the postprandial time course data did not support the suggestion that high-Ca diets may result in chelation of dietary fats in the lumen and reduce their absorption(Reference Appleton, Owen and Williamson25) or reduce protein digestibility in dogs(Reference Dobenecker, Kasbeitzer and Flinspach26) and are consistent with the digestibility data reported for these dogs(Reference Stockman, Watson and Gilham11). Additionally, the postprandial time course data here do not provide support for reports that dietary Ca may delay gastric emptying or increase intestinal motility, with no significant effect except ‘phosphate (inorganic and organic)’ observed at these hourly sampling time points.
Variability in the fasted plasma metabolome of adult Labrador retrievers is dominated by the individual
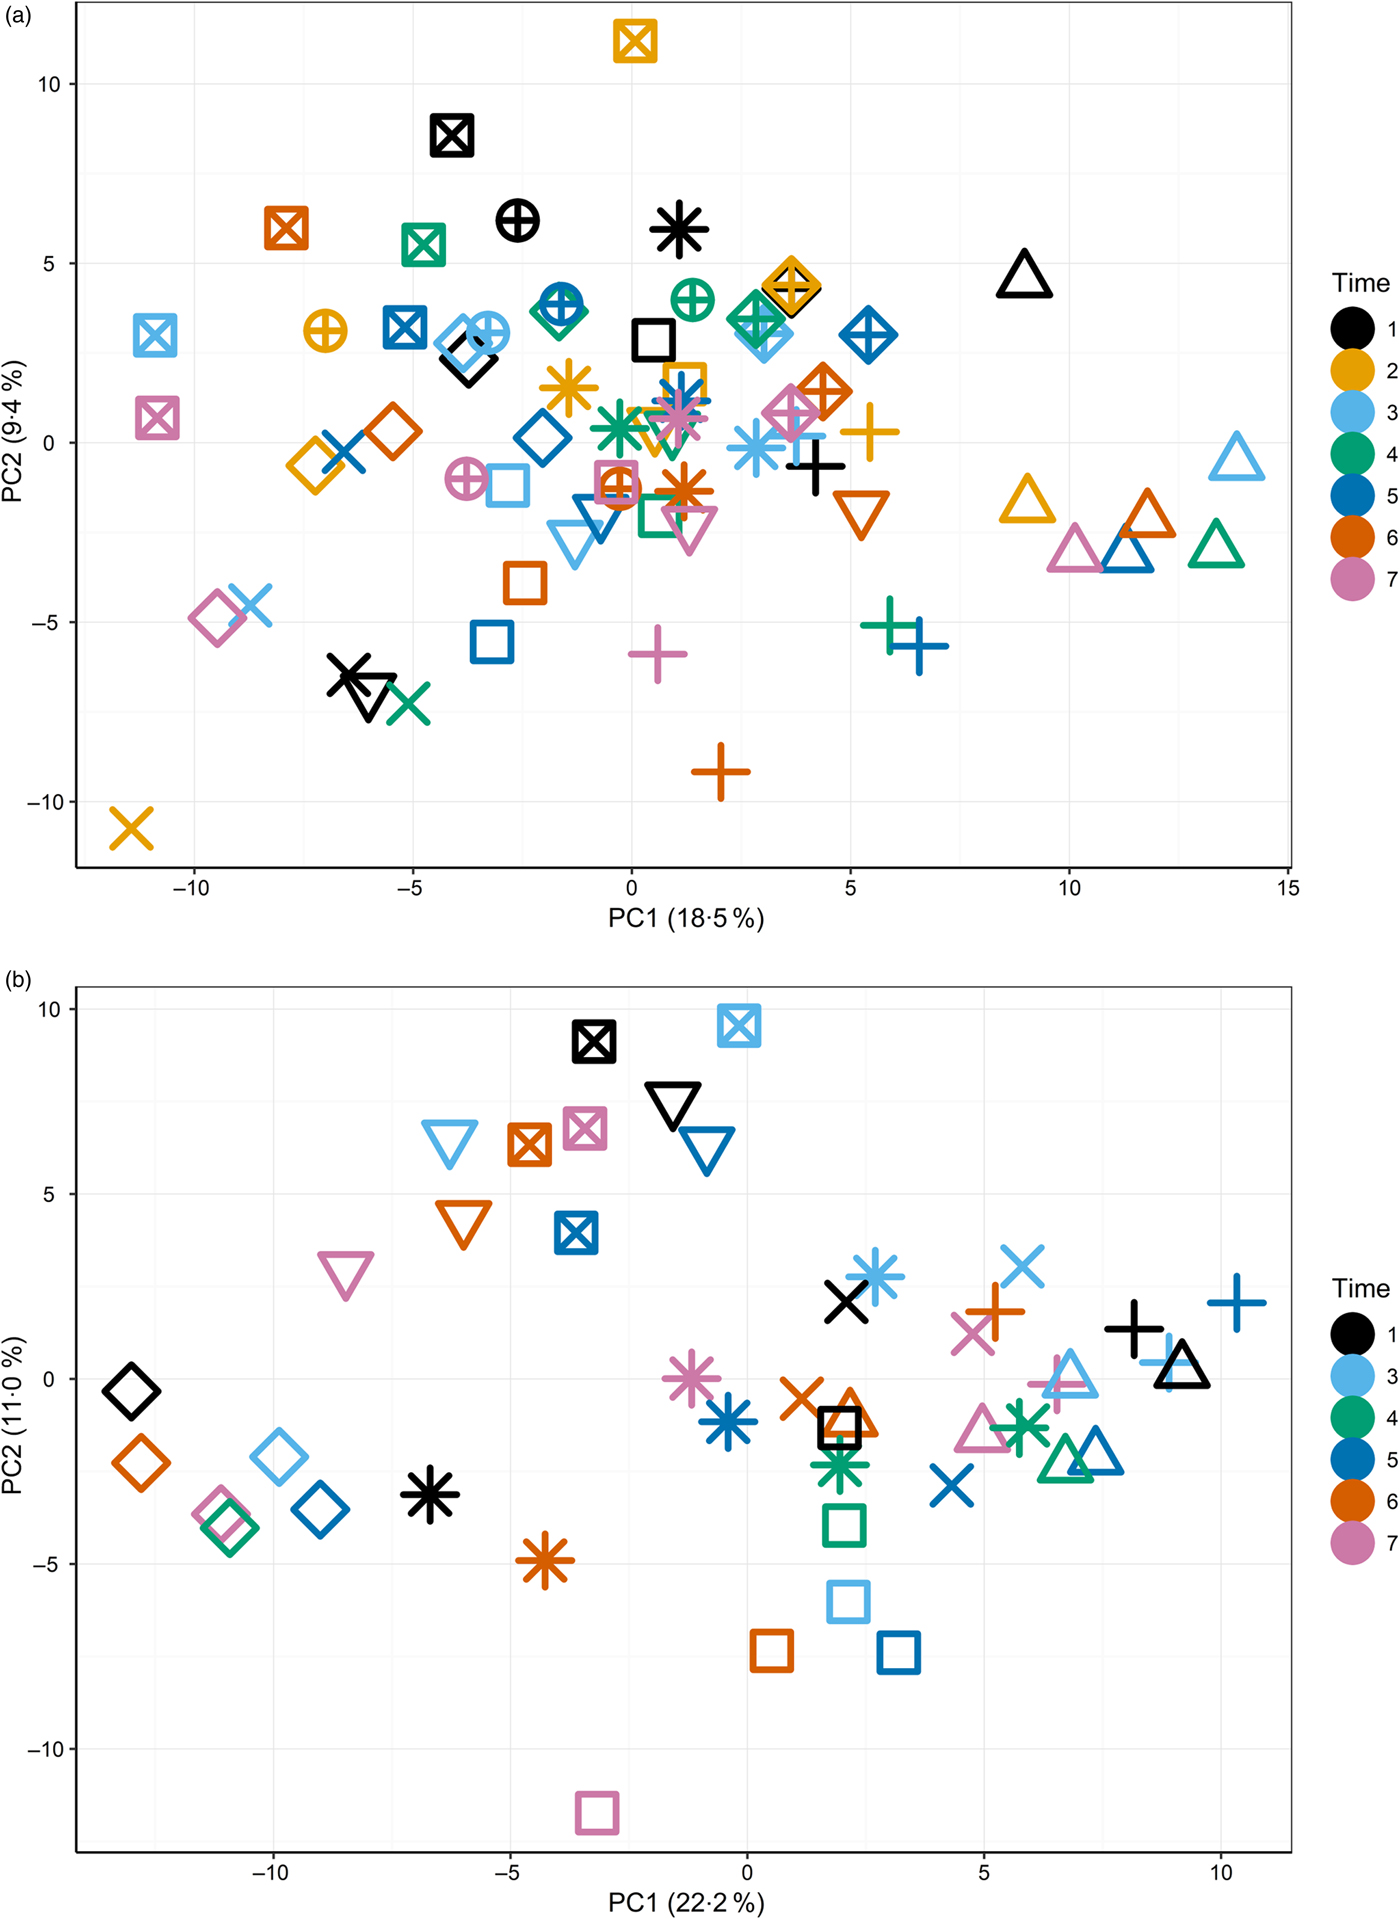
The primary purpose of the study was to determine changes in the plasma metabolome in response to feeding a high-Ca diet. Principal components analysis (Supplementary Fig. S3) of fasted plasma samples indicated no observable effect of diet or time (T1–T7) on variability in the first two principal components. Instead, fasted samples collected across the study from individuals clustered together (Fig. 1(a) and (b)), suggesting both a degree of individual stability in the fasted plasma metabolome and also that individuals' differences dominated any responses to diet type (Fig. 1(a)).
Principal components (PC) analysis (PCA) visualisation of PC1 and PC2 of fasted samples from all sampling time points in the test diet group (a) (T1–T7) and control diet group (b) (T1, T3–T7), with individuals represented by unique symbols and sampling occasions represented by unique colours. PCA calculated on original data (i.e. not corrected for random factor dog).
A data-driven characterisation of the canine plasma metabolic profile
Whilst the primary aim of the study was to determine metabolite changes in response to feeding a high-Ca diet, the use of metabolic profiling enabled an interrogation of the data that drove variability in the canine plasma metabolome, irrespective of dietary Ca. The next section describes our data analysis approach to provide insights into canine metabolism, the dynamics of digestion and other, unanticipated effects of undertaking long-term nutritional studies.
Metabolites associated with differences between individuals
The initial principal components analysis (Fig. 1(a) and (b)) provided evidence that a primary driver of variance over this extended time course was the individual. It was therefore considered appropriate to analyse the data by identifying the metabolites that best described the metabolome of the individual and to analyse the metabolite profiles in the postprandial time course.
Previously, plasma metabolites were reported that had a high proportion of inter-individual to intra-individual variability(Reference Allaway, Kamlage and Gilham6, Reference Colyer, Gilham and Kamlage27). Some of these were common to both cats and dogs, had good inter-metabolite correlations and, although significantly altered in levels in response to a simple dietary intervention (glucose supplementation), retained a low intra-individual variance and high inter-metabolite correlations. These observations supported the view that individual differences in plasma metabolite pools may be a consequence of a common regulated system, such as cholesterol transport. To determine whether the metabolites observed here were similar to those reported previously the fasted sample data were analysed using the same approach. Metabolites that had the highest proportion of inter-individual:intra-individual deviation are ranked in Table 2. Many metabolites in this table belong to the metabolic group ‘Complex lipids, fatty acids and related’ previously identified in Labrador retriever dogs as having high inter:intra-individual variance(Reference Allaway, Kamlage and Gilham6, Reference Colyer, Gilham and Kamlage27). Those reports identified positive correlations among them and included cholesterol. To determine whether the metabolites here that provided the individual ‘metabolite signature’ also correlated with each other, the metabolites with greater than 80 % of the variance coming from the inter-individual comparisons were compared in pair-wise scatter plots (Supplementary Fig. S4). The scatter plots show a good correlation between six of the seven members of the ‘Complex lipids, fatty acids and related’ ontology group except for ethanolamine plasmalogen, which had slightly negative correlations with members of this group. Ethanolamine plasmalogen is a common component of lipid membranes and so may not correlate with lipoprotein components whilst still being consistent within individuals over this time frame.
Metabolites with >2-fold percentage standard deviation related to inter-individual difference

* Metabolites previously identified with high inter:intra-individual variance(Reference Allaway, Kamlage and Gilham6, Reference Dobenecker, Kasbeitzer and Flinspach26).
Other metabolites associated with the individual included kynurenic acid, a tryptophan metabolite; 3-hydroxybutyrate, a ketone body that may accumulate in the fasted state; and scyllo-inositol, a sugar alcohol. The largest negative correlation (−0·49) between all ten ‘signature’ metabolites was between kynurenic acid and 3-hydroxybutyrate. It is therefore of note that there is a body of work indicative of a metabolic relationship between ketogenic diets and kynurenic acid in a variety of neurological conditions(Reference Maciejak, Szyndler and Turzyńska28, Reference Zarnowski, Tulidowicz-Bielak and Zarnowska29). Whilst speculative, it remains a possibility that the individual's ability to optimise fatty acid oxidation could be reflected in ketone body accumulation with consequences on kynurenic acid production.
Metabolites associated with the postprandial time course
Principal components analysis visualisation of all samples showed that variability in the metabolome was dominated by the postprandial time points (Supplementary Fig. S5). This is not unexpected and was confirmed by the univariate analysis which identified that the contrasts with the highest number of significant metabolites were in the comparison between the postprandial time points and the fasted sample (Supplementary Table S2).
To characterise the postprandial dynamics of dogs following feeding of complete and balanced diets, the postprandial responses of the two diets were analysed separately and only at times when the diet had been fed for at least 60 d previously (T1 and T5). The rationale for not combining the diets' data was that the aim was to establish correlations between metabolites and the diets varied in nutritional content, including fat and protein content.
Hierarchical clustering analysis was used to identify metabolites that behaved in a similar way post-feeding. The small number of metabolites grouping at high levels of correlation indicate that few metabolites behave in a similar way in the postprandial state. Using a correlation coefficient cut-off of 0·5, it was possible to cluster sixty-three metabolites in both groups into a visually manageable number of clusters (twelve (Supplementary Fig. S6(a)) and eleven (Supplementary Fig. S6(b)) clusters for the control and test diets, respectively), with a maximum of thirteen and seventeen members for the control and test diets, respectively. These postprandial profiles (Fig. 2(a) and (b), for the control and test diets, respectively) show a range of response curves varying in rates of increase or decrease over the 4 h time frame. In human subjects, a similar approach identified six clusters(Reference Pellis, van Erk and van Ommen9) across a 6 h time course following consumption of a standardised fat-load test consisting of a 500 ml milkshake containing high-fat dairy products. Although both research groups used a subjective manual cut-off, the profiles obtained in the human study were also probably fewer because the challenge shake was less nutritionally complex than the commercially based diets used in this study. Further, the diet was fed in a single meal and met the dogs' entire nutritional needs and energy requirements whilst the shake provided about 28 % of the recommended energy requirement (58·7 % from fat).
Postprandial profiles for metabolites within clusters, identified where the correlation coefficient >0·5. ----, Average of the cluster. (a) On control diet (T1, 60 d); (b) on test diet (T5, 169 d). Note that the cluster numbers are not comparable between diets.

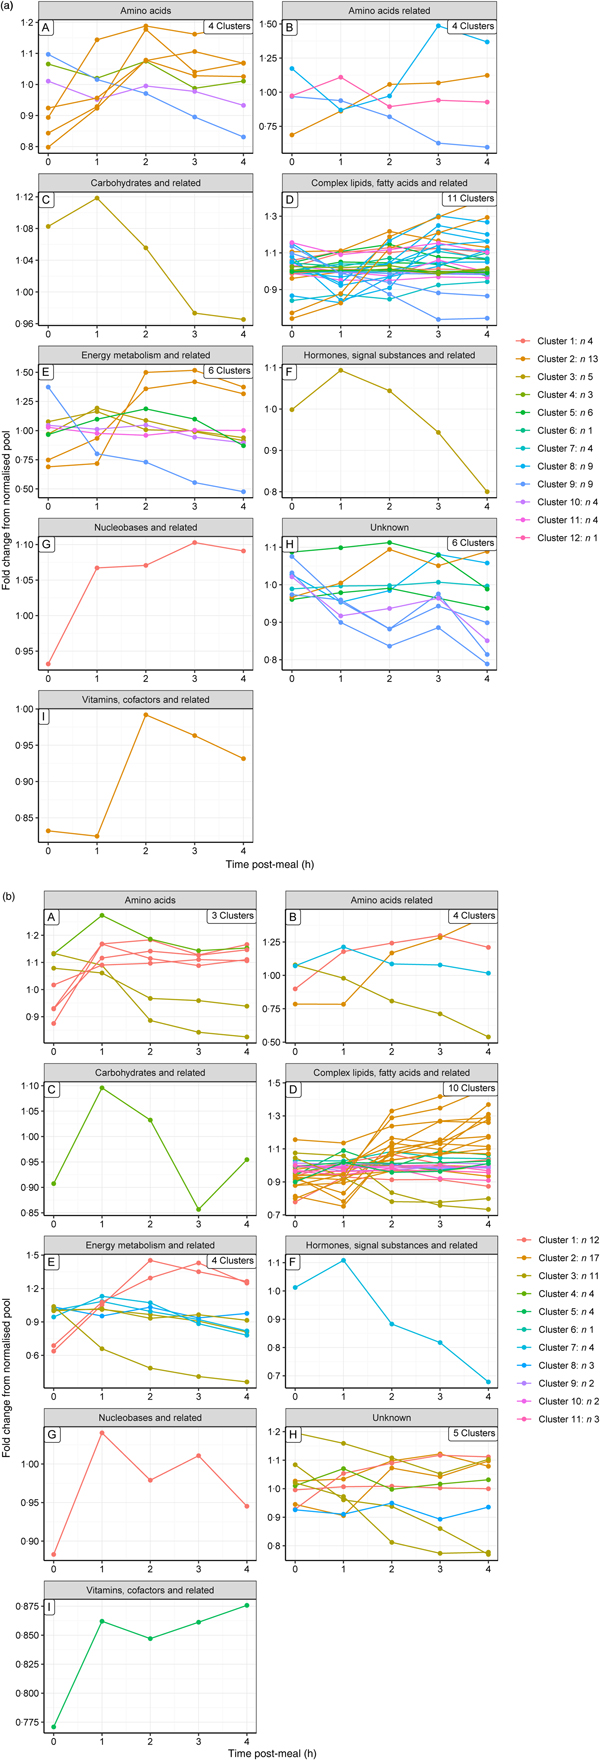
To gain a complementary insight into these clusters, metabolites were grouped by their metabolic ontology (level 2) to determine the number and type of responses observed for each metabolic group, presented visually (Fig. 3(a) and (b) for the control and test diets, respectively). The main insight from this was that members of the same metabolic groups, for example amino acids or complex lipids, show a range of postprandial profiles, dependent on role, dietary source and regulation.
Postprandial profiles for metabolites within ontology group, coloured by clusters identified where the correlation coefficient >0. (a) On control diet; (b) on test diet. Note that the colour codes for clusters are not comparable between diets.

Further characterisation identified a small number of metabolites that had a consistent and large postprandial response, using selection criteria of at least three sampling occasions of a two-fold-change and observed in both diets (Fig. 4). Five metabolites had consistent increases across the postprandial time course of at least 2-fold (Fig. 4(a)). All were amino acids or related to amino acids (trans-4-hydroxyproline, sarcosine, glycine, proline and methionine). Trans-4-hydroxyproline is considered to be a marker of collagen turnover. Glycine and sarcosine may reflect some aspect of choline oxidation and be associated with the methionine cycle. The larger fold changes in glycine, sarcosine, proline and methionine when other amino acids appear to be buffered to about 20 % of fasted levels may suggest that these are better tolerated, or intracellular pools need to be tightly regulated or their systemic increase provides some function. Four metabolites showed a late, but >2-fold increase over the time course (pyruvate, glycerol from complex lipids, TAG (C16 : 0, C16 : 1) and TAG (C16 : 0, C18 : 1, C18 : 3) (additional: TAG (C16 : 0, C18 : 2, C18 : 2), TAG (C16 : 1, C18 : 1, C18 : 2)); Fig. 4(b)) whilst a further three metabolites show a gradual decline over the time course (cholesterylester C20 : 4, mannose and 3-hydroxybutyrate; Fig. 4(c)). Some of these metabolite responses are consistent with known responses, for example, 3-hydroxybutyrate, a ketone body and likely to accumulate in the fasted state and decline following transition from fatty acid oxidation to glycolysis. The increase in plasma pyruvate is also consistent with increased glucose availability as plasma pyruvate has been reported to increase after a glucose ingestion in humans(Reference Hagström, Arner and Ungerstedt30). The postprandial decrease in mannose is consistent with previous reports in dog serum(Reference Sato, Katayama and Arai31), whilst this was not observed in humans where it was reported to increase about 4–6 h after a postprandial challenge test(Reference Pellis, van Erk and van Ommen9). This difference may be because, unlike humans, in dogs mannose has been identified as an insulin-responsive sugar(Reference Mori, Sato and Lee32).
Metabolites consistently showing significant fold-changes >2 from fasted in postprandial state (baseline (–○–, T1, control diet), following 1 d from diet change (--□--, T2, acute) and following long-term feeding (--Δ--, T5, chronic)). (a) Metabolites achieving a 2-fold increase with increases within the first hour; (b) metabolites achieving a 2-fold increase with delayed rise (after 1 h); (c) metabolites decreasing >2-fold across the postprandial time course. Values are means, with 95 % confidence intervals represented by vertical bars.

In a study comparing consumption of yoghurt, milk or a high-fat meal, 36, 43 and 48 % of the metabolites showed a postprandial response (2 and 6 h postprandial time points) in human serum(Reference Pimentel, Burton and von Ah33). Here, 66 % of the 180 metabolites had at least one occasion differing significantly from fasted over a 4 h time course. The authors of the human study suggested that metabolites that alter and return to the fasted level within the 6 h might be metabolites with the potential to be indicative of metabolic flexibility, whilst metabolites that do not return to the fasted value in that time window may indicate poorly digested metabolites that may accumulate over time. In our shorter 4 h time window we identified 35, 32 and 41 % of metabolites that were significantly different 4 h after being fed (T1, T2 and T5, respectively), with 6 % (n 10) having a significantly higher level in the fasted state in week 40. However, none was a poorly digestible metabolite, so not supporting this as a potential concern for long-term feeding of the diet.
Limitations
Despite the diets representing the dietary range of Ca found in commercial diets, the diets do not represent all possible diet formulations that vary in organic and inorganic sources of Ca. In addition, the two extruded diets were produced to simulate commercial formulations using raw materials rather than supplementing a single diet with Ca and P. They therefore varied in other nutrients, which may be responsible for some of the observed changes over time. The study was also conducted in healthy adult Labrador retrievers and may not reflect responses to dietary Ca based on life stage, breed or individual health. These may be important considerations because studies in growing dogs(Reference Dobenecker, Kasbeitzer and Flinspach26, Reference Nap and Hazewinkel34) have documented that the effects of high-Ca diets vary in dogs of different breed sizes and there are some implications of high mineral load, such as urolithiasis, that are more common in certain breeds(Reference Ling, Franti and Ruby35). In addition, the interpretation is based on statistical analysis of semi-quantitative data rather than quantitative data and cannot be directly related to biologically significant differences. To improve interpretation of metabolic features in plasma, metabolic profiling rather than metabolite fingerprinting was used. This, with the quality criteria, constrained the statistical analysis to 180 metabolites. Using metabolite fingerprinting may have identified other features that changed with diet, but the reduced confidence in their identity would have reduced interpretability.
Summary
Metabolite profiling was used as an untargeted approach to determine whether there was any evidence to indicate that feeding of a diet near to the upper level of Ca inclusion could be a concern across a 40-week study. No such evidence was found using univariate statistical analysis. Principal components analysis showed that the major impact on the fasted plasma metabolite profile was the individual, potentially indicating that individual adult dogs may have a ‘metabolite signature’ that is consistent and regulated. When compared with a previous study using the same profiling method the metabolites showing the highest individual signatures were similar in type and indicative of differences in lipoprotein transport regulation, probably a consequence of an individual's genetics. The postprandial responses to the two diets were determined to unveil aspects of metabolic health not detectable in the fasted, ‘homeostatic’ state. Only postprandial phosphate differed consistently, and was readily explained by the additional phosphate provided to ensure that the Ca:P remained similar. Postprandial changes in plasma metabolite pools were the major drivers of difference in the plasma metabolome. Correlation analysis indicated that the regulation of metabolite pools in the postprandial state is complex and metabolite-specific, with few metabolites behaving similarly or in accordance with metabolite class.
Supplementary material
The supplementary material for this article can be found at https://doi.org/10.1017/jns.2019.12
Acknowledgements
We would like to thank all colleagues at WALTHAM for their care and expertise in training, welfare and sampling the dogs used in this study
The work was funded by Mars Petcare. The WALTHAM Centre for Pet Nutrition is a fundamental research centre for Mars Petcare.
Author contributions were as follows: conception and design of the study, D. A., A. C. and J. S.; data acquisition, D. A., M. G., J. S. and A. W.-G.; data analysis, D. A., A. W.-G., S. G. M. and R. H.; interpretation and writing the article, D. A. and P. W.
D. A., M. G., R. H., A. C., J. S. and P. W. were employees of Mars Petcare UK at the time of the study.


 Open access