

DHA (22 : 6n3) is a 22-carbon n-3 PUFA with critical tissue-specific roles throughout the lifespan(Reference Richard and Calder1). Current recommendations emphasise the consumption of preformed DHA in the diet, particularly during pregnancy and lactation, to ensure an adequate supply to the developing neonate(Reference Koletzko, Cetin and Brenna2). Following consumption, dietary DHA can be incorporated into three major physiological pools available for tissue uptake from the plasma(Reference Brossard, Croset and Normand3,Reference Chen, Kitson and Hopperton4) : (i) complexed with albumin as an unesterified fatty acid, (ii) esterified within lipoproteins to phospholipids, lysophospholipids, cholesteryl esters and/or TAG, and (iii) complexed with albumin as a component of lysophosphatidylcholine (LPC). This latter form of DHA (LPC-DHA) was noted to be a putative DHA source for the brain(Reference Lagarde, Bernoud and Brossard5); however, it received limited attention until the major facilitator superfamily domain 2a (MFSD2A) protein was identified as a LPC symporter with high affinity for LPC-DHA(Reference Nguyen, Ma and Shui6,Reference Wong, Chan and Cazenave-Gassiot7) . Preclinical in vivo evidence from knock-out mouse studies has since demonstrated that genetic loss of MFSD2A expression results in impaired accretion of DHA in the fetal brain and eye, suggesting that LPC-DHA is a critical form of DHA for transport across the placenta and/or the fetal blood–brain barrier and retinal epithelium(Reference Wong, Chan and Cazenave-Gassiot7). Notably, evidence from kinetic studies in adult rats showed only 10 % of brain DHA is derived from LPC-DHA, with 90 % derived from free fatty acid transport, suggesting that MFSD2A and LPC-DHA’s contribution to DHA status is of particular importance during development(Reference Chen, Kitson and Hopperton4), though some evidence suggests that dietary LPC-DHA in adulthood modifies brain DHA content(Reference Sugasini, Thomas and Yalagala8). Consistent with a critical role during development, recent studies in humans have demonstrated distinct localisation and expression of MFSD2A in the human placenta(Reference Ferchaud-Roucher, Kramer and Silva9), and that individuals affected by a mutant MFSD2A allele exhibited a lethal microcephaly syndrome linked to inadequate early-life brain uptake of LPC lipids(Reference Alakbarzade, Hameed and Quek10).
Circulating LPC-DHA dynamics during different reproductive states in humans (i.e. pregnancy and lactation), when the developing brain’s DHA levels are established, remain uncharacterised. Reproductive state, namely pregnancy and lactation, may influence circulating LPC-DHA through both enhanced synthesis and/or enhanced partitioning of DHA towards the developing neonate, either in utero or via breast-feeding. Pregnancy, for example, is associated with increased circulating oestrogen levels, a positive regulator of the phosphatidylethanolamine N-methyltransferase (PEMT) pathway of phosphatidylcholine (PC) biosynthesis(Reference Schock, Zeleniuch-Jacquotte and Lundin11,Reference Resseguie, Song and Niculescu12) . The PEMT pathway produces PC molecules enriched in DHA at the sn-2 position(Reference Samborski, Ridgway and Vance13–Reference DeLong, Shen and Thomas15), a direct precursor of LPC-DHA following phospholipase A1 or lecithin-cholesterol acyltransferase (LCAT) activity.
In addition to DHA, choline is another dietary precursor that may influence LPC-DHA metabolism by serving as a methyl group donor for PC synthesis through the PEMT pathway(Reference Zeisel, Klatt and Caudill16). We have shown that a higher dietary choline intake increased the synthesis of DHA-enriched PC species by facilitating greater PEMT activity among women of child-bearing age(Reference Yan, Jiang and West17–Reference Yan, Wang and Gregory19). By serving as substrate, choline may increase the production of PC-DHA and, in turn, increase LPC-DHA supply. LPC synthesised through the choline-dependent CDP–choline pathway also may undergo re-esterification in tissues or plasma and contribute to the total LPC-DHA pool.
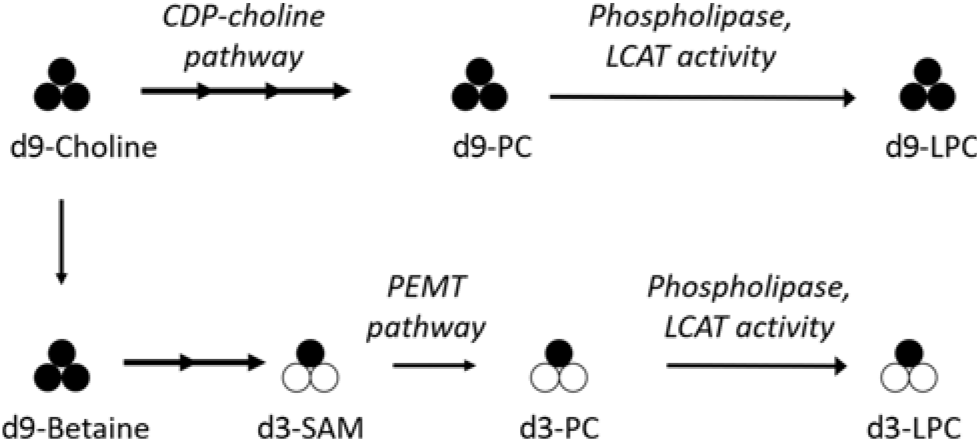
To assess the effect of reproductive state and dietary choline on LPC-DHA metabolism in humans, we measured total and 2H-labelled LPC-DHA in samples previously collected from a controlled feeding study conducted in non-pregnant, third-trimester pregnant, and lactating women consuming a methyl-d9-choline tracer(Reference Yan, Jiang and West17). The isotopic labelling scheme generated by the consumption of the tracer enabled discrimination between PEMT pathway-derived PC-DHA species containing the d3-labelled methyl group (e.g. d3-PC-DHA) and CDP–choline pathway-derived LPC-DHA species containing the intact d9-choline molecule (e.g. d9-LPC-DHA) (Fig. 1)(Reference Yan, Wang and Gregory19–Reference Ganz, Cohen and Swersky22).
Simplified diagram of the metabolism of orally consumed 2H-labelled methyl-d9-choline and its relationship to CDP–choline and phosphatidylethanolamine N-methyl transferase (PEMT)-derived phosphatidylcholine (PC) and lysophosphatidylcholine (LPC). 2H-labelled methyl groups are represented by black circles; unlabelled methyl groups are represented by white circles. The administered methyl-d9-choline can enter the CDP–choline pathway to produce d9-PC, and undergo further metabolism via phospholipase or lecithin-cholesterol acyl transferase (LCAT) activity to d9-LPC; alternatively, methyl groups from d9-choline can enter one-carbon metabolism and ultimately be donated by S-adenosylmethionine (SAM), the universal methyl donor, for use by the PEMT enzyme to generate d3-PC, and subsequently d3-LPC, via analogous phospholipase/LCAT activity.
Methods
Study design and participant characteristics
This investigation includes samples sourced from available data through 10 weeks of a 10–12-week randomised controlled feeding study, wherein women of differing reproductive states consumed two different levels of dietary choline; the trial design has been previously described(Reference Yan, Jiang and West17,Reference West, Yan and Jiang18,Reference Davenport, Yan and Taesuwan23) . Briefly, healthy non-pregnant women (n 24), pregnant women entering their third trimester (n 26), and lactating women 5 weeks postpartum (n 28) were recruited from the Greater Ithaca, New York area (see Table 1). Eligibility was assessed by complete blood count, blood chemistry profile and health history questionnaires. Women were enrolled and randomised to either 480 or 930 mg choline per d, which was provided by the study diet (380 mg/d of dietary choline), and either 100 or 550 mg/d as supplemental choline chloride (Balchem). During weeks 6–10 (lactating cohort) or 6–12 (pregnant and non-pregnant cohorts), women consumed 22 % of their total choline intake as 2H-labelled choline (trimethyl deuterium; d9-choline; Cambridge Stable Isotopes). In addition to the study diets and supplemental choline, all participants consumed a daily prenatal multivitamin (Pregnancy Plus; Fairhaven Health) containing 600 µg folic acid, a daily 200 mg DHA supplement (Neuromins; Nature’s Way) and a thrice-weekly Mg and K supplement (General Nutrition). Women consumed one study meal per d along with the nutritional supplements at the Human Metabolic Research Unit (HMRU) at Cornell University, with carry-out meals provided for off-site consumption. Empty containers were returned at the next HMRU visit and used to assess compliance. The present study was conducted according to the guidelines laid down in the Declaration of Helsinki, and all procedures involving human subjects were approved by the Institutional Review Boards at Cornell University and Cayuga Medical Center. All participants provided written informed consent prior to enrolment in the study. The study was registered at ClinicalTrials.gov (NCT01127022).
Baseline characteristics of non-pregnant (n 21), pregnant (n 26) and lactating (n 24) women assigned to consume 480 or 930 mg choline per d
(Mean values with their standard errors; numbers of subjects)
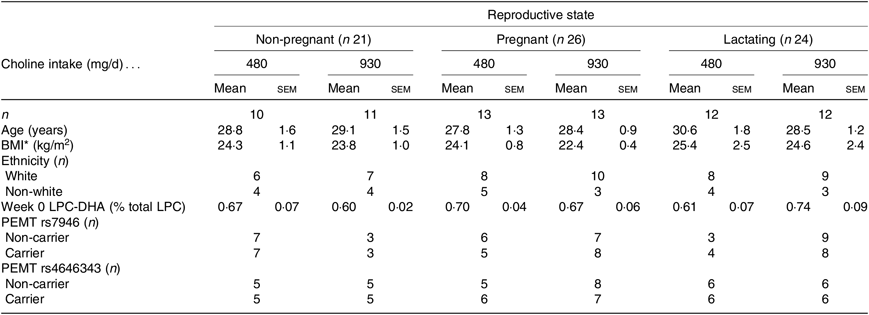
LPC, lysophosphatidylcholine; PEMT, phosphatidylethanolamine N-methyltransferase.
* Refers to prepregnancy BMI for the pregnant and lactating groups.
Sample collection
Fasting blood samples were collected as previously described(Reference Yan, Jiang and West17,Reference West, Yan and Jiang18) . Briefly, blood was collected into EDTA-coated tubes at study weeks 0, 3, 6, 9, 10 and placed on ice. Following centrifugation (2200 rpm at 4°C for 15 min), the plasma and buffy coat (for genotyping) were dispensed into 1·5-ml centrifuge tubes and stored at –80°C. The present study utilised available samples collected at study baseline (week 0), week 6 and week 10.
Measurements of unlabelled and labelled lysophosphatidylcholine and lysophosphatidylcholine-DHA
Unlabelled LPC (d0-LPC), unlabelled LPC-DHA (d0-LPC-DHA), trideuterated-LPC (d3-LPC), trideuterated-LPC-DHA (d3-LPC-DHA), nonadeuterated-LPC (d9-LPC) and nonadeuterated-LPC-DHA (d9-LPC-DHA) were measured by LC/MS/MS using Q-Exactive MS (QE-MS; ThermoFisher Scientific). Extraction of all unlabelled and labelled LPC from plasma was done by adapting the method of Koc et al.(Reference Koc, Mar and Ranasinghe24). Briefly, 100 µl of plasma was homogenised in 400 µl 2:1 methanol–chloroform. The samples were incubated overnight (18 h minimum) at –20°C. Homogenates were centrifuged at 14 000 rpm for 5 min. The organic phases were pipetted off and transferred into new tubes. The remaining solid plasma residues were washed with 250 µl of 2:1:0·8 methanol–chloroform–water, vortexed and centrifuged (14 000 rpm for 5 min). The organic phase was transferred into the tube containing the previous fraction. About 100 µl of chloroform and 200 µl of water were added to each tube to separate lipid and water-soluble phases. Following centrifugation, the lipid soluble fraction was collected and dried in Savant SpeedVac. Extracts were reconstituted in 100 µl of 6:1 methanol–chloroform.
The extract (10 µl) was injected on an UPLC-MS system containing an UltiMate 3000 Dionex autosampler and pump, and QE-MS with ESI probe (ThermoFisher Scientific). Total PC was separated from sphingomyelin and LPC using a Syncronis silica column (2·1 × 150 mm, 5 μm; ThermoFisher Scientific). The mobile phase contained two buffers: buffer A (acetonitrile 400 ml, water 127 ml, ethanol 68 ml, 3 ml 1 M-ammonium acetate, 2 ml glacial acetic acid) and buffer B (acetonitrile 250 ml, water 250 ml, ethanol 42 ml, 13·5 ml 1 M-ammonium acetate, 9 ml glacial acetic acid). The gradient elution was run at 0·4 ml/min in the following buffer mixtures: from 0 to 3 min, an isocratic mix with 5 % buffer B; from 3 to 10 min, a linear gradient from 5 % to 30 % buffer B; from 10 to 14 min, a linear gradient from 30 % to 60 % buffer B; from 14 to 16 min, 100 % buffer B; from 16 to 17 min, held for 1 min at 100 % buffer B; from 17 to 19 min, a linear gradient from 100 % to 5 % buffer B; and from 19 to 21 min, the column was equilibrated to the starting condition (5 % buffer B). Samples were kept at 5°C, and column temperature was held at 30°C. The MS was operated in positive full scan and MS2 modes with the following settings: sheath gas pressure 40; auxiliary gas 10; spray voltage 5 kV; capillary temperature 350°C; S-lens RF level 50; and heater temperature 30°C. The MS2 mode was used for the detection and quantification of LPC and LPC-DHA, where resolution was set at 35 000; AGC target 2e5; isolation window 1 m/z; HCE 20. Inclusion list contained 568·34, 571·36, 574·38, and 577·39 m/z, which represented molecular ions for d0-LPC-DHA, d3-LPC-DHA, d6-LPC-DHA and d9-LPC-DHA, respectively. Full scan mode (AIF) was used to detect total LPC. Resolution was set at 35 000; AGC target 3e6; scan range 80–950; HCE 20. Data analysis was performed using XCalibur software (ThermoFisher Scientific).
Total and labelled lysophosphatidylcholine-DHA enrichment calculations
Total LPC-DHA in plasma was expressed as a percentage of total LPC signal (a measure of all individual LPC species), calculated as the total peak area of d0 + d3 + d9 LPC-DHA divided by the total area of d0 + d3 + d9-LPC and multiplied by 100 %. Enrichments of d3-LPC, d9-LPC, d3-LPC-DHA and d9-LPC-DHA were calculated by dividing the amount of each isotopically labelled LPC (e.g. d3-LPC) by the total amount of all isotopologues (d0-LPC + d3-LPC + d9-LPC) and multiplying by 100 to derive percentage enrichment.
Statistical analysis
Differences in baseline characteristics for reproductive state were assessed using two-way ANOVA with Tukey’s post hoc corrections for continuous variables and χ 2 test for categorical variables. Independent t tests were used to assess the difference between baseline characteristics for choline intake groups.
Mixed linear models were used to assess the impact of reproductive state on total LPC molecules. For each model, participant ID was included as a random effect, while reproductive state, time, choline intake arm, baseline BMI (or prepregnancy BMI for pregnant and lactating women), age, ethnicity and the reproductive × time interaction term were included as fixed effects. For assessing the effect of reproductive state on labelled LPC molecules, a general linear model was employed. This model included all the factors described in the mixed linear model, except it did not include time.
Mixed linear models were also used to examine the effect of choline intake on total LPC molecules. For each model, participant ID was included as a random effect, while choline intake arm, time, reproductive state, baseline BMI (prepregnancy BMI for pregnant and lactating women), age, ethnicity and baseline concentrations of the outcome variable, as well as the interaction terms for choline intake arm × time, and choline intake arm × reproductive state were included as fixed effects. For assessing the effect of choline intake on labelled LPC molecules, a generalised linear model was employed, which included all of the factors described in the mixed linear model except it did not include time or baseline concentrations.
Additional models were generated to assess the impact of common genetic variants in the PEMT gene (i.e. rs7946 and rs4646343), as well as their interactions with reproductive state and choline intake, on total and labelled LPC metabolites.
We also used our stable isotope data to determine the relative contributions of the PEMT v. CDP–choline pathways to plasma LPC-DHA enrichments. The outcome variable for this analysis was percentage enrichment of labelled metabolites within its total pool (e.g. percentage enrichment of d3-LPC-DHA within the total LPC-DHA pool). Fixed effects included PC biosynthesis pathway (CDP–choline v. PEMT), reproductive state, choline intake arm, BMI, ethnicity and age.
All statistical analyses and graphs were performed using the R statistical package, version 3.4.4. Graphs were developed using ‘ggplot2’ and/or the output of the emmeans package (emmip function). All graphs report least square means; bar graphs report standard errors of the mean, and line graphs report CI. The present analysis utilised a post hoc design and is intentionally hypothesis-generating; thus, no power calculations were performed for the present analysis. The original controlled feeding trial sample size was based on the estimated ability to detect differences in the primary outcome (biomarkers of maternal choline status). Given our goal of hypothesis generation, correction for multiple tests was applied in all comparisons utilising Tukey’s HSD post hoc corrections.
Results
Participant characteristics and baseline values
Seventy-one women were included in the final analyses. Twenty-one non-pregnant, twenty-six pregnant, and twenty-four lactating women had samples available at weeks 0, 6 and 10 of the study for analysis. No significant differences in age, BMI (prepregnancy), ethnicity, baseline LPC-DHA concentrations or PEMT genotype frequencies were observed between the reproductive states or choline intake groups (Table 1).
Effect of reproductive state
Total plasma lysophosphatidylcholine-DHA
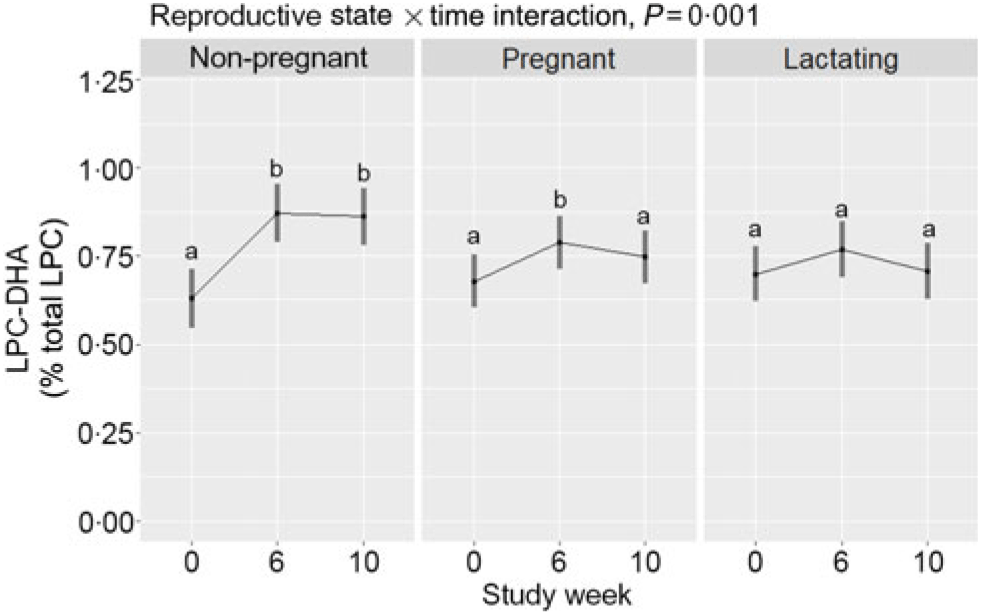
Within-reproductive-state statistical comparisons are shown in Fig. 2. Reproductive state interacted with time (P = 0·001) to influence plasma total LPC-DHA response throughout the study period. Among non-pregnant women, total LPC-DHA was higher at weeks 6 and 10 relative to week 0 (P < 0·0001). In contrast, study-end (week 10) total LPC-DHA did not differ from baseline values among pregnant and lactating women, although a small increase was detected at week 6 relative to baseline among pregnant women. Summary statistics of the peak areas for LPC-DHA and total LPC across reproductive states can be found in online Supplementary Tables 1 and 2.
Plasma total lysophosphatidylcholine (LPC)-DHA enrichment across the 10-week study period among non-pregnant (n 21), pregnant (n 26), and lactating (n 24) women who consumed supplemental DHA (200 mg/d) under controlled dietary conditions. Statistical analyses were performed with mixed linear models; significant interactive effects of reproductive state and time were observed. Plotted data are predicted means with 95 % confidence intervals represented by vertical bars, derived from the statistical model. a,b Mean values within a reproductive state with unlike letters were significantly different (P < 0·05). All pairwise comparisons among the reproductive states can be found in Table 2.
Predicted means derived from the mixed model for the effect of reproductive state on plasma total LPC-DHA are presented in Table 2. Pairwise P-values indicate differences between reproductive states at study end (week 10) with lower (P = 0·02) plasma total LPC-DHA enrichments among lactating women relative to non-pregnant women; total LPC-DHA among pregnant women also tended to be lower (P = 0·10) compared with non-pregnant women. No significant differences (P = 0·72) in total LPC-DHA were observed at week 10 between pregnant and lactating women, or among any of the reproductive groups at weeks 0 and 6.
Relationship between reproductive state and total plasma lysophosphatidylcholine (LPC)-DHA across the study period
(Mean values with their standard errors)
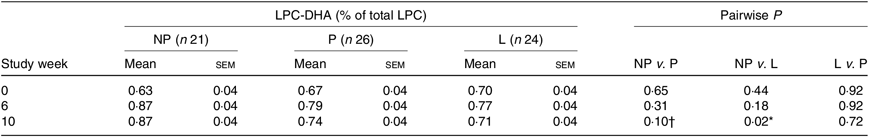
NP, non-pregnant; P, pregnant; L, lactating.
* P < 0·05.
† Trend (P ≤ 0·10).
2H-labelled lysophosphatidylcholine-DHA
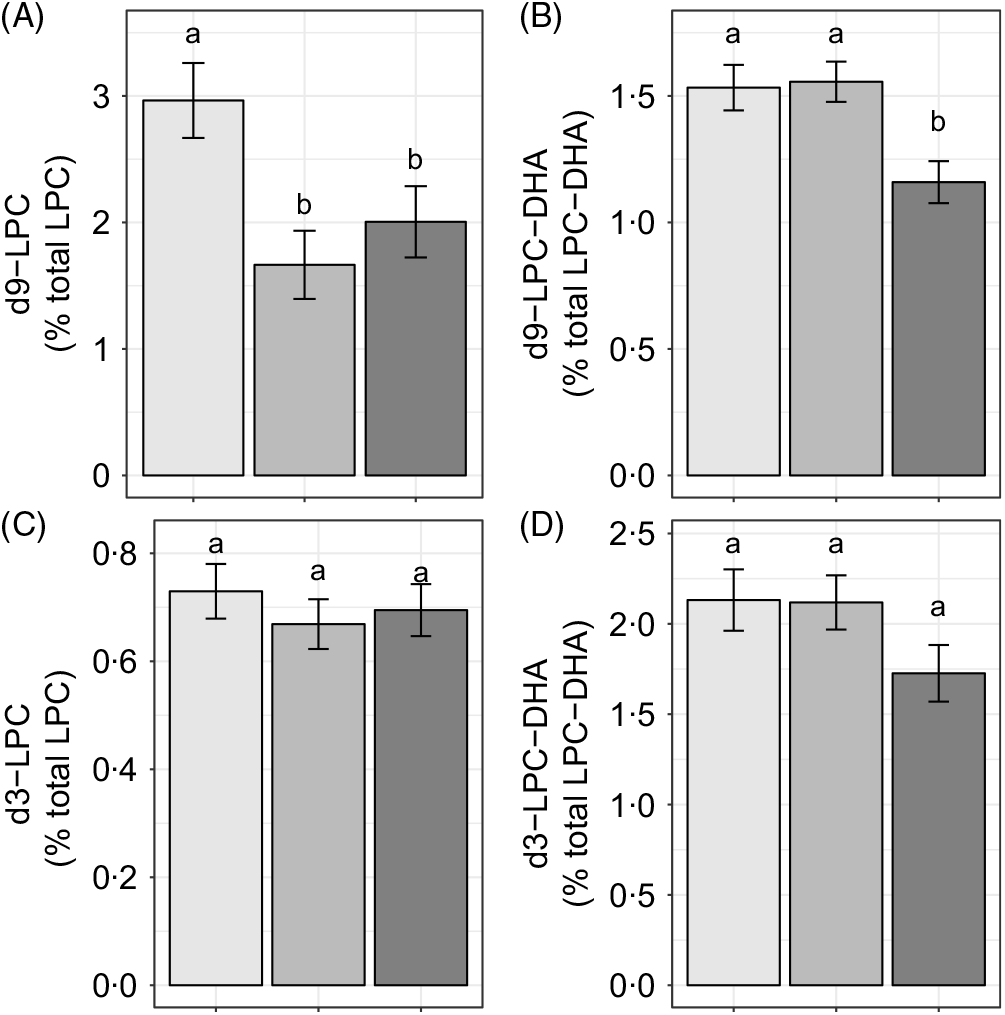
Reproductive state influenced d9-LPC (P < 0·005) and d9-LPC-DHA (P < 0·005) enrichments, whereas no effects of reproductive state (P > 0·1) were observed on d3-LPC or d3-LPC-DHA enrichments (Fig. 3(A)–(D)). Non-pregnant women had higher d9-LPC compared with pregnant (P = 0·005) and lactating (P = 0·05) women (Fig. 3(A)). In addition, non-pregnant (P = 0·008) and pregnant (P < 0·005) women exhibited higher d9-LPC-DHA relative to lactating women but did not differ from each other (P = 0·85).
Study-end (week 10) plasma 2H-labelled lysophosphatidylcholine (LPC) (A, C) and LPC-DHA (B, D) as a percentage of the total LPC pool in non-pregnant (n 21), pregnant (n 26) and lactating (n 24) women who consumed supplemental DHA (200 mg/d) under controlled dietary conditions. Statistical analyses were performed with generalised linear models; significant main effects of reproductive state were observed. Plotted data are predicted means with their standard errors represented by vertical bars, derived from the statistical model. a,b Mean values with unlike letters were significantly different (P < 0·05). Reproductive state: ![]() , non-pregnant;
, non-pregnant; ![]() , pregnant;
, pregnant; ![]() , lactating.
, lactating.
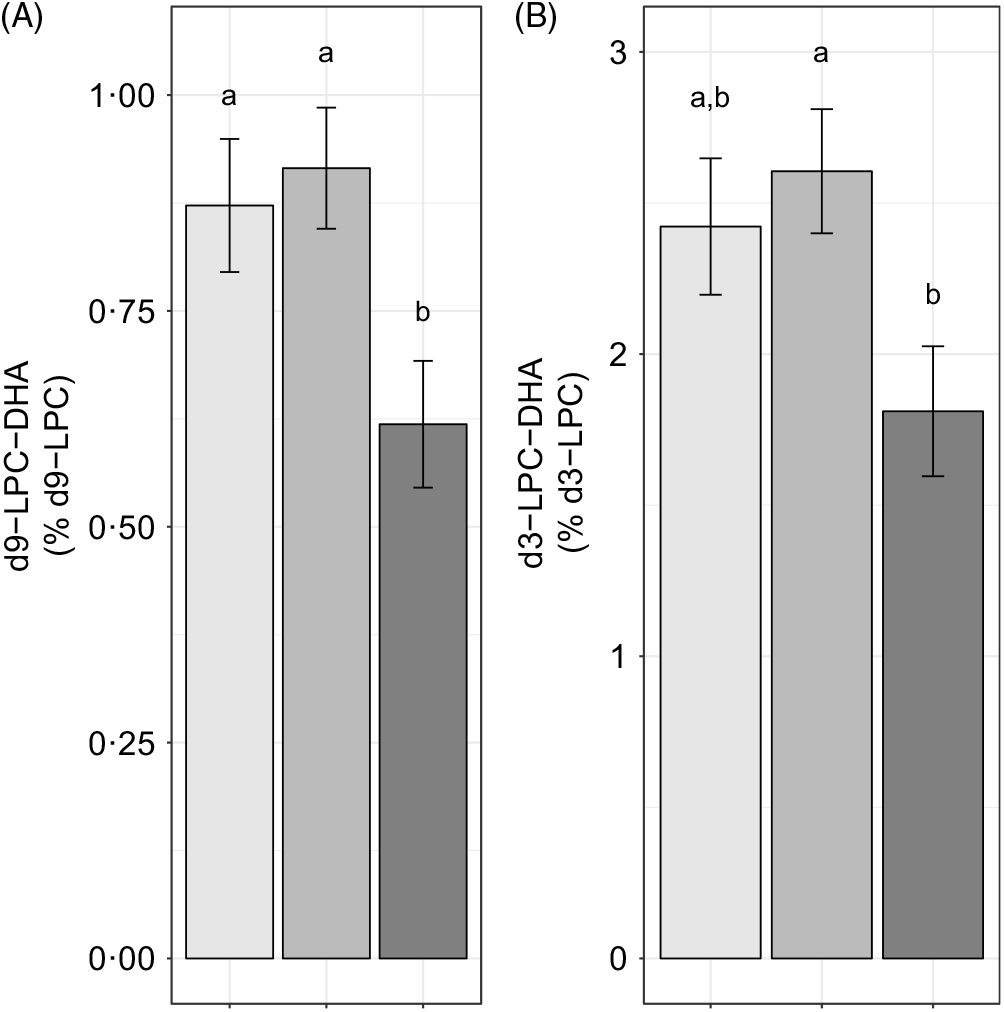
We further evaluated the effect of reproductive state on labelled LPC-DHA expressed as a percentage of the labelled LPC pool size (as opposed to the total LPC pool size) to assess the potential for alterations in DHA metabolism within the d3- and d9-LPC pools. Non-pregnant (P = 0·049) and pregnant women (P = 0·011) had higher d9-LPC-DHA (as a percentage of total d9-LPC) relative to lactating women (Fig. 4(A)). d3-LPC-DHA (as a percentage of total d3-LPC) was also higher among pregnant women relative to lactating women (P = 0·022), but did not differ significantly between non-pregnant and lactating women (P = 0·12), or between non-pregnant and pregnant women (P = 0·81) (Fig. 4(B)).
Study-end (week 10) plasma d9-lysophosphatidylcholine (LPC)-DHA (A) and d3-LPC-DHA (B) as a percentage of the labelled LPC pool in non-pregnant (n 21), pregnant (n 26) and lactating (n 24) women who consumed supplemental DHA (200 mg/d) under controlled dietary conditions. Statistical analyses were performed with generalised linear models; significant main effects of reproductive state were observed. Plotted data are predicted means with their standard errors represented by vertical bars, derived from the statistical model. a,b Mean values with unlike letters were significantly different (P < 0·05). Reproductive state: ![]() , non-pregnant;
, non-pregnant; ![]() , pregnant;
, pregnant; ![]() , lactating.
, lactating.
Effect of choline intake
Total plasma lysophosphatidylcholine-DHA
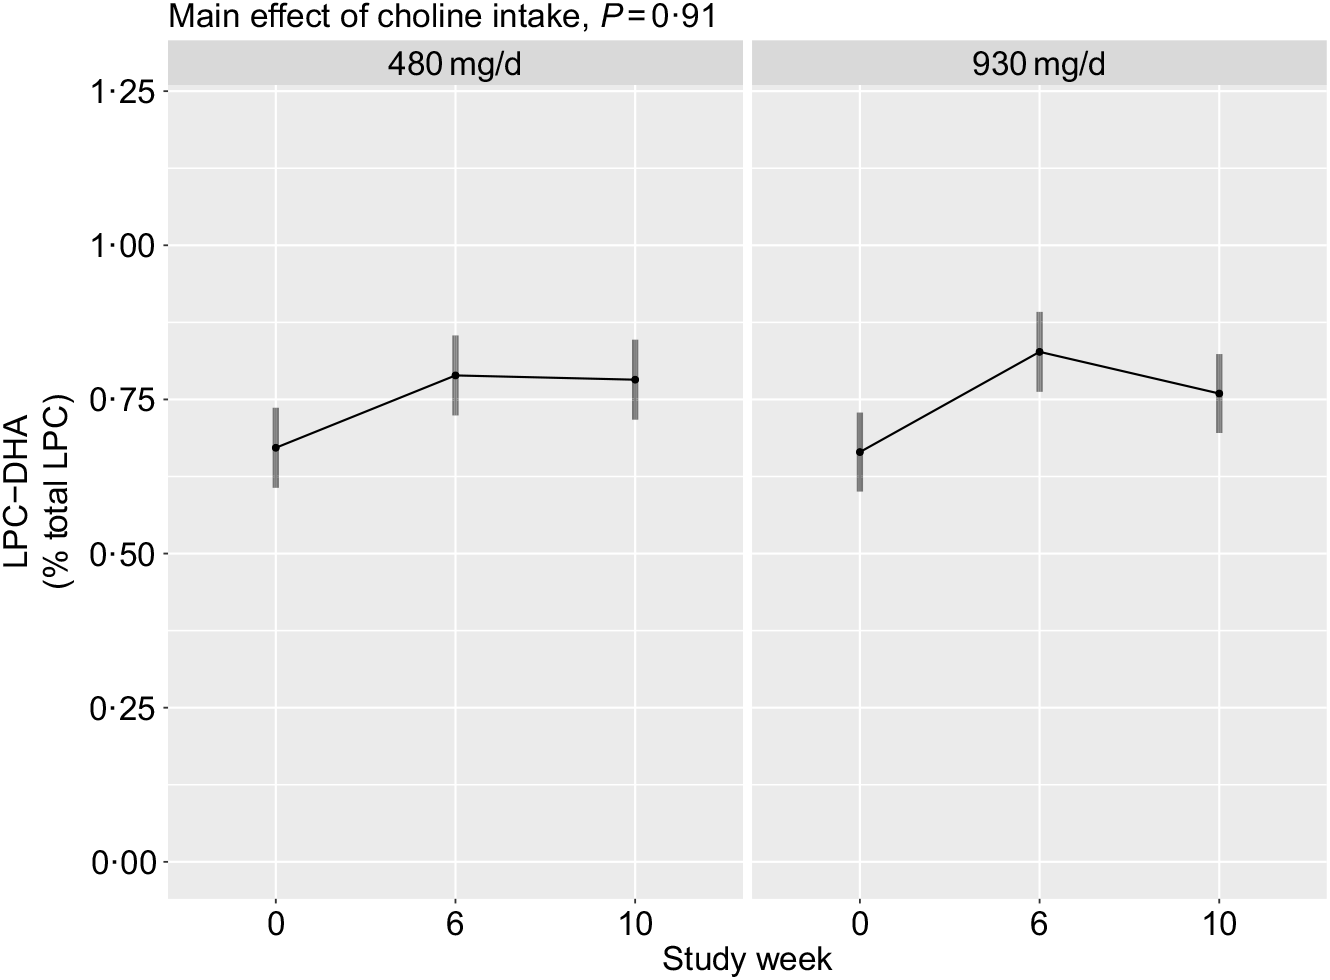
No main effects of choline intake (P = 0·91), or its interaction with time (P = 0·35), on plasma total LPC-DHA were observed (Fig. 5). Additionally, no interaction between choline intake and reproductive state (P = 0·80) was detected.
Plasma total lysophosphatidylcholine (LPC)-DHA across the 10-week study period among participants who consumed 480 (n 35) or 930 (n 36) mg choline per d in addition to supplemental DHA (200 mg/d) under controlled dietary conditions. Statistical analyses were performed with mixed linear models; no significant main effects of choline were observed. Plotted data are predicted means with 95 % confidence intervals represented by vertical bars, derived from the statistical model.
2H-labelled lysophosphatidylcholine-DHA
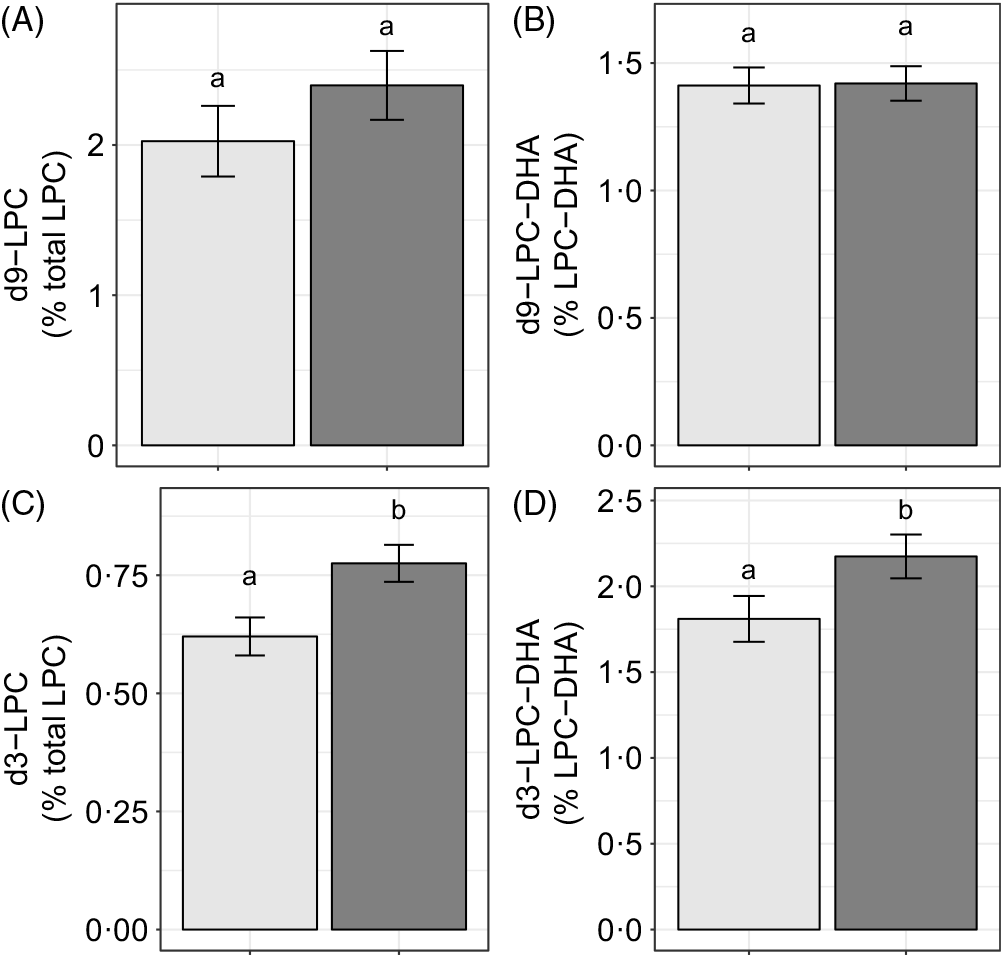
Choline intake influenced d3-LPC (P < 0·006) and d3-LPC-DHA (P < 0·002) enrichments. Higher d3-LPC and d3-LPC-DHA were observed among women consuming 930 v. 480 mg choline per d (Fig. 6(C) and (D)). No effects of choline intake on d9-LPC (P = 0·34) or d9-LPC-DHA (P = 0·65) enrichments were observed (Fig. 6(A) and (B)). In addition, no effects of choline intake on labelled LPC-DHA expressed as a percentage of the labelled LPC pool size (as opposed to the total LPC pool size) were detected: d3-LPC-DHA (as a percentage of total d3-LPC; P = 0·55) and d9-LPC-DHA (as a percentage of total d9-LPC; P = 0·99).
Study-end (week 10) plasma 2H-labelled lysophosphatidylcholine (LPC) (A, C) and LPC-DHA (B, D) as a percentage of the total LPC pool among participants who consumed 480 (n 35) or 930 (n 36) mg choline per d in addition to supplemental DHA (200 mg/d) under controlled dietary conditions. Statistical analyses were performed with generalised linear models; significant main effects of choline intake were observed for d3 metabolites. Plotted data are predicted means with their standard errors represented by vertical bars, derived from the statistical model. a,b Mean values with unlike letters were significantly different (P < 0·05). Choline intake: ![]() , 480 mg/d;
, 480 mg/d; ![]() , 930 mg/d.
, 930 mg/d.
Effect modification by genotype
We initially hypothesised that common loss-of-function genetic variants in the PEMT gene would impact circulating total and labelled LPC-DHA by limiting the production of precursor PC enriched with DHA. However, contrary to our hypotheses, we observed no significant main effect of these variants, or their interactions with reproductive state and choline intake arm, on total or labelled LPC-DHA (P > 0·05) (data not shown).
Production of lysophosphatidylcholine-DHA through phosphatidylethanolamine N-methyltransferase v. CDP–choline pathways
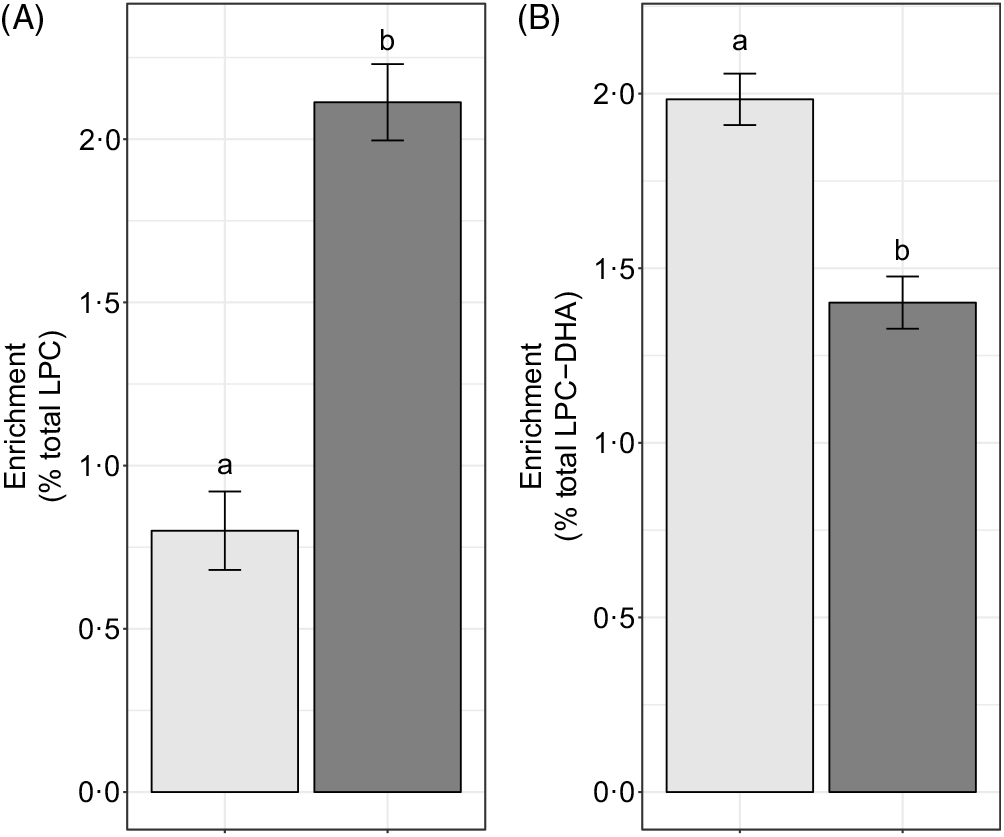
We hypothesised that the majority of LPC-DHA circulating in plasma would be derived from the PEMT pathway of PC synthesis (as opposed to the CDP–choline pathway), consistent with previous observations that PEMT produces PC species enriched in DHA(Reference Ferchaud-Roucher, Kramer and Silva9,Reference Alakbarzade, Hameed and Quek10 , Reference Yan, Jiang and West20). Consistent with this hypothesis, we observed that significantly more of the plasma LPC-DHA was d3-LPC-DHA (P < 1·0 × 10–7) (Fig. 7(B)), despite preferential incorporation of labelled choline into d9-LPC (as opposed to the d3-LPC pool) (P < 1·0 × 10–12) (Fig. 7(A)).
Study-end (week 10) plasma d3-lysophosphatidylcholine (LPC) and d9-LPC (A) and d3-LPC-DHA and d9-LPC-DHA (B) as a percentage of the total LPC and LPC-DHA pool, respectively. Plotted data are predicted means with their standard errors represented by vertical bars, derived from the statistical model. a,b Mean values with unlike letters were significantly different (P < 0·05). (A) 2H enrichment: ![]() , d3-LPC;
, d3-LPC; ![]() , d9-LPC; (B) 2H enrichment:
, d9-LPC; (B) 2H enrichment: ![]() , d3-LPC-DHA;
, d3-LPC-DHA; ![]() , d9-LPC-DHA.
, d9-LPC-DHA.
Discussion
Lysophosphatidylcholine-DHA response to DHA supplementation is attenuated in pregnant and lactating women
Only non-pregnant women experienced a significant rise in total LPC-DHA by study end (week 10) in response to the dietary regimen, which included 200 mg/d supplemental DHA. Moreover, at study end, lactating women had significantly lower total LPC-DHA compared with non-pregnant women, while total LPC-DHA tended to be lower among pregnant women (compared with non-pregnant women). One explanation for the blunted response of LPC-DHA among pregnant and lactating women to the dietary regimen may be enhanced uptake of LPC-DHA by the placenta and mammary gland(Reference Angers, Uldry and Kong25), both of which express the MFSD2A LPC symporter. Alternatively, our total LPC-DHA data could suggest that pregnancy and lactation are physiological states associated with altered phospholipid and DHA metabolism, favouring reduced hydrolysis and/or partitioning of DHA towards non-phospholipid pools, such as TAG, respectively.
To better understand the observed total LPC-DHA dynamics, we examined the relationship between reproductive state and 2H-labelled LPC-DHA. The labelling scheme allows for distinguishing between LPC-DHA derived from the CDP–choline pathway (e.g. d9-labelled metabolites) and that derived from the PEMT pathway (e.g. d3-labelled metabolites). Of note, we observed discordance between the pattern of 2H-labelled plasma LPC-DHA when comparing pregnancy and lactation (Fig. 3(B), (D) and 4(A), (B)), despite concordance in plasma total LPC-DHA between these groups (Fig. 2). These data strongly suggest that different underlying mechanisms are responsible for the similarities in total LPC-DHA pools between these two reproductive states. One likely scenario is that the reduction in d3- and d9-LPC-DHA enrichments in the lactating state (as compared with both the pregnant and non-pregnant states) may reflect reduced DHA incorporation into phosphatidylethanolamine pools (which provide substrate for the PEMT pathway) as well as alterations in CDP–choline-derived PC acyl remodelling, respectively. This scenario could result in a decreased supply of d3- and d9-derived-PC-DHA species for LPC-DHA production via phospholipase and/or LCAT activity. Both mechanisms (reduced availability of DHA containing phosphatidylethanolamine and reduced PC hydrolysis) may be at play in the lactating state(Reference Davenport, Yan and Taesuwan23). For example, we observed reductions only in d9-LPC, but not d3-LPC, while observing reductions in both d9- and d3-LPC-DHA; reduced hydrolysis of d9-PC to d9-LPC would result in lower d9-LPC and d9-LPC-DHA, while reduced DHA-containing phosphatidylethanolamine would result only in reduced d3-LPC-DHA. The latter scenario is consistent with DHA being partitioned towards non-phospholipid pools, such as TAG or NEFA (the primary forms of DHA in human breastmilk(Reference Liu, Cocks and Rochfort26–Reference Koletzko28)). Conversely, a lower total LPC-DHA in pregnant women is not likely due to a reduction in substrate availability (i.e. PC-DHA), as we previously showed that both PEMT activity and PC-DHA generation increased in this cohort of pregnant women compared with non-pregnant women(Reference Yan, Jiang and West20). While we cannot entirely rule out the contribution of reduced hydrolysis of PC to LPC in the pregnant state resulting in lower LPC-DHA enrichments, it is likely that a lower total LPC-DHA is at least partially attributable to LPC-DHA serving as a source of DHA for the developing fetus. In pregnant women, it is notable that d9-LPC-DHA enrichments were higher relative to non-pregnant women, whereas d9-LPC enrichment did not differ between the pregnant and non-pregnant states (indicating that pregnancy is a physiological state that prioritises DHA availability) (Fig. 3). However, these inferences from our labelled data should not preclude additional preclinical and clinical investigations into LPC-DHA metabolism and its contribution to fetal and mammary compartments in both physiological states.
Higher dietary choline intakes are associated with increases in phosphatidylethanolamine N-methyltransferase-derived lysophosphatidylcholine-DHA
Although we did not observe an association between choline intake and total plasma LPC-DHA (Fig. 5), our labelled LPC and LPC-DHA data suggest that dietary choline intake influences the generation of PEMT-derived LPC and LPC-DHA. Specifically, higher plasma enrichments of d3-LPC and d3-LPC-DHA were observed in 930 v. 480 mg choline per d intake group across the duration of the study. This effect of a higher dietary choline intake was observed in all three reproductive life stages and is likely related to choline’s role as a source of methyl groups for PEMT activity. We did not observe any effects of choline on d3-LPC-DHA in the d3-LPC pool (data not shown), indicating that dietary choline does not influence the relative amount of DHA incorporated into the d3 pool but rather increases all PEMT-derived LPC species.
It is noteworthy that we observed discordant effects of dietary choline on PEMT-derived v. CDP–choline-derived LPC, observing no relationship between higher dietary choline intakes with d9-LPC or d9-LPC-DHA (Fig. 6). This relationship is notably inconsistent with our prior finding of greater production of d9-PC and d3-PC in pregnant women who consumed higher dietary choline in this cohort(Reference Yan, Jiang and West20). Collectively, these observations are suggestive of differential metabolism of d9 v. d3-PC and LPC species in response to higher dietary choline intakes. One explanation for these differences is potentially greater specificity of phospholipases and LCAT activity for PEMT-derived PC species (as opposed to CDP–choline-derived PC species), consistent with their positional specificity as previously noted by others(Reference Liu, Subramanian and Subbaiah29,Reference Abe, Hiraoka and Shayman30) . Additional studies examining the impact of choline intake on PC and LPC handling utilising dual isotopic approaches, as well as assessing total DHA status in maternal, placental, fetal, mammary and milk compartments, is required for further contextualisation of our data presented herein.
Lysophosphatidylcholine-DHA is derived primarily from phosphatidylcholines produced by the phosphatidylethanolamine N-methyltransferase-pathway
Previous in vitro and animal model evidence indicate that the PEMT pathway of PC biosynthesis is a major contributor to circulating plasma DHA pools(Reference Watkins, Zhu and Zeisel14,Reference DeLong, Shen and Thomas15) . Our findings of LPC-DHA primarily being d3-labelled are consistent with this body of work. It is noteworthy, however, that a substantial fraction of d9-LPC-DHA was observed in the plasma in each reproductive state. This suggests that either (i) the CDP–choline pathway of PC synthesis utilises some amount of diacylglycerol containing DHA, or (ii) acyl chain remodelling of synthesised PC occurs resulting in d9-LPC-DHA. Further inquiry into these two possible explanations for d9-LPC-DHA in plasma is warranted, as the former suggests that the CDP–choline pathway is capable of producing DHA-enriched phospholipids, and may be an important compensatory pathway for exporting DHA from the liver during times of compromised PEMT activity (e.g. loss-of-function PEMT variants).
Strengths and limitations
There are several strengths and limitations in our analysis. Important strengths include the use of a controlled feeding trial and our use of stable isotopes to enable inferences about the underlying metabolic processes that influence plasma LPC-DHA production and clearance during critical reproductive states, which may inform issues related to women’s health. Weaknesses to note include: (i) the correlative nature of data, given the inability to randomise to reproductive life stage and the post hoc nature of our choline intake analyses, and (ii) the lack of absolute LPC-DHA concentrations, which precludes our ability to assess factors that influence LPC-DHA and total LPC concentrations concomitantly. In addition, while our data support the expected observation that much of the LPC-DHA fraction exhibited a pattern of d3-labelling consistent with synthesis through the PEMT pathway, we cannot discount the possibility that a small fraction of d3-LPC-DHA was derived from the CDP–choline pathway, following hydrolysis of PEMT-derived PC to d3-choline.
Conclusions
Collectively, our results suggest that the production and/or clearance of LPC-DHA are modified in response to reproductive state and choline intake. These data provide further rationale for exploring the contribution of LPC-DHA to DHA status, especially during the reproductive states of pregnancy and lactation where LPC-DHA may be an important source of DHA for the developing neonate while in utero and during lactation. Furthermore, our data support the importance of PEMT for maintaining plasma LPC-DHA, and of choline in supplying methyl groups for LPC-DHA production.
Acknowledgements
The original research was supported by the Egg Checkoff, through the Egg Nutrition Center; the Beef Checkoff, through the National Cattlemen’s Beef Association and the Nebraska Beef Council; the USDA Cooperative State Research, Education, and Extension Service, special research grant 00444528; and the Affinito-Stewart Grants Program, through the President’s Council of Cornell Women. Salary for K. C. K. was provided from a National Institute of Health Training Grant (T32HD087137). The funding sources had no role in the study design, interpretation of the data or publication of results.
The authors’ responsibilities were as follows: M. A. C. designed and conducted the original research. M. A. C., K. C. K., O. V. M. and M. Q. M. analysed the data; K. C. K. and M. Q. M. wrote the manuscript with significant input from M. A. C., J. T. B. and M. S. R. M. A. C. had primary responsibility for the final content. All authors read and approved the final manuscript.
The authors report no conflicts of interest.
Supplementary material
For supplementary materials referred to in this article, please visit https://doi.org/10.1017/S0007114519002009


