

1 Introduction
The importance of the plasma interactions with the first wall in fusion devices was acknowledged early in the work on magnetic fusion (Tamm & Sakharov Reference Tamm, Sakharov and Leontovich1961). The problems of the plasma recycling and impurities coming from the wall have always been a concern for experimentalists in the race for better core plasma parameters. When the first comprehensive designs of the magnetic fusion reactors (e.g. INTOR Group 1988) started to appear and issues such as heat removal and erosion and lifetime of the plasma-facing components (PFC), as well as the compatibility of the edge and core plasmas, became critical for the whole project, the importance of the plasma–wall interactions became widely appreciated.
In order to reduce the pollution of the core plasma by impurities coming from the wall, a magnetic divertor concept was suggested by L. Spitzer in 1951, at the dawn of the fusion era. The main idea was to add special magnetic coils in order to create a magnetic separatrix that would separate the regions of the ‘closed’ and ‘open’ magnetic flux surfaces, see figure 1. The closed magnetic surfaces would confine the fusion-grade core plasma that has no direct contact with the material surfaces. The open ones intersect the material surfaces, but do this in a well-baffled divertor, far from the core. Given the fast plasma transport along the magnetic field, it was envisioned that, with a sufficient distance between the closed magnetic surfaces and the first wall, such a magnetic configuration would be able to reduce significantly the pollution of the core plasma with impurities originating from the plasma–material contact. Early experiments on the B-65 stellarator with a divertor (Burnett & Grove Reference Burnett, Grove, Palladino, Stix and Wakefield1958) have indeed demonstrated a significant reduction of the impurity content in the core plasma.
Divertor design suggested by L. Spitzer for a stellarator. Taken from Spitzer (Reference Spitzer1958).

However, the Spitzer’s idea was brought in for application of the divertor concept to a stellarator device (Spitzer Reference Spitzer1958) that is not toroidally symmetric. As a result, such a divertor configuration, as shown in figure 1, can only be formed by reversing at some locations the full magnetic field, which requires high currents in the divertor coils.
The situation is very different in a toroidally symmetric tokamak device, which in 1970s became the leading concept in the world fusion research program. In a tokamak, the magnetic flux surfaces are formed by the poloidal component of the magnetic field, the magnitude of which, $B_{p}$
, is usually much smaller than the magnitude,
$B_{p}$
, is usually much smaller than the magnitude, $B_{t}$
, of the toroidal component. Therefore, by adding toroidal coils that produce a poloidal magnetic field only, it is possible to form a magnetic separatrix that separates the closed and open magnetic flux surfaces and to create the so-called poloidal magnetic divertor, see figures 2 and 3. Some more exotic designs were also suggested (see e.g. figure 4). Such poloidal divertors are used in the current tokamaks and are envisioned for the future tokamak reactors including ITER.
$B_{t}$
, of the toroidal component. Therefore, by adding toroidal coils that produce a poloidal magnetic field only, it is possible to form a magnetic separatrix that separates the closed and open magnetic flux surfaces and to create the so-called poloidal magnetic divertor, see figures 2 and 3. Some more exotic designs were also suggested (see e.g. figure 4). Such poloidal divertors are used in the current tokamaks and are envisioned for the future tokamak reactors including ITER.
Schematic view of a poloidal divertor in an elliptically elongated tokamak. Taken from Artsimovich & Shafranov (Reference Artsimovich and Shafranov1972).

Schematic view of a poloidal divertor in the ASDEX tokamak. Taken from Keilhacker et al. (Reference Keilhacker, Lackner, Behringer, Murmann and Niedermeyer1982).

Divertor configuration suggested for the Reference Design Tokamak Reactor. Taken from Tenney (Reference Tenney1974).

In the mid 1970s through early 1980s, magnetic configurations with poloidal divertors were implemented in many tokamaks (DIVA, ASDEX, PDX, DIII, etc.). At about the same time, two unexpected discoveries were made on tokamaks with the poloidal divertors: the H-mode with improved core plasma confinement (Wagner et al. Reference Wagner1982) and the high-recycling regime of divertor plasma performance (see Keilhacker et al. (Reference Keilhacker, Lackner, Behringer, Murmann and Niedermeyer1982), Lackner et al. (Reference Lackner, Chodura, Kaufman, Neuhauser, Rauh and Schneider1984) and the references therein), both of which became phenomena of prime interest for the magnetic fusion scientists.
In the high-recycling regime, the loop of plasma ion neutralization on the targets and ionization, in the divertor volume, of the newly born neutrals that arrive back to the target as the ions occurs many times before the neutrals penetrate into the core plasma, are pumped out or get absorbed by the wall material. As a result, the high-recycling regime is characterized by a large plasma flux to the target and a relatively low plasma temperature in front of the divertor targets, which reduces the physical sputtering yield of the PFC material envisioned for the reactor. At about the same time, the initial indications of what is now called the detached divertor regime were also observed (Shimomura et al. Reference Shimomura, Kaufman, Lackner and Murman1983).
Further studies of high-recycling regime lead, in the early 1990s, to the discovery of the detached divertor regime where the plasma is nearly extinguished before reaching the divertor targets and fluxes of both heat and the plasma particles to the target drop (see figures 5 and 6) in comparison with the standard high-recycling case (see e.g. Matthews Reference Matthews1995, and the references therein).
Reduction of the power loading of the outer divertor target in DIII-D after transition to the detached regime (red curve). Taken from ITER Physics Basis (1999).

Rollover of the plasma flux to the targets in JET with increasing the line averaged density in the discharge. Taken from Loarte et al. (Reference Loarte1998).

These observations, together with the need to reduce the heat load on the divertor targets in ITER down to an acceptable level, triggered intense theoretical and experimental studies of the physics of divertor plasma detachment. The energy flux associated with plasma recombination on the surface, accompanied by the release of 13.6 eV of the potential energy per ion, for the reactor conditions can easily exceed the tolerable limit of ${\sim}5$
–10 MW
${\sim}5$
–10 MW $\text{m}^{-2}$
(ITER Physics Basis 1999). Therefore, in a reactor, the plasma flux to the target needs to be maintained at a rather low level. After these findings, both the H-mode confinement and the detached divertor became the main operational scenario for ITER (ITER Physics Basis 1999) and virtually all the future magnetic fusion reactors considered to date.
$\text{m}^{-2}$
(ITER Physics Basis 1999). Therefore, in a reactor, the plasma flux to the target needs to be maintained at a rather low level. After these findings, both the H-mode confinement and the detached divertor became the main operational scenario for ITER (ITER Physics Basis 1999) and virtually all the future magnetic fusion reactors considered to date.
We note that in recent years the meaning of ‘detachment’ has become somewhat fuzzy. In some cases, it is used just as a synonym of a strongly radiative divertor where most of the heat flux is radiated by impurity. To emphasize that we are interested in the reduction of both the heat and plasma particle fluxes to the divertor targets, we will call this regime ‘ultimate divertor detachment’. The ‘full (or complete) detachment’ and ‘partial (or semi-) detachment’ terms that appear often in the literature refer to the cross-field profiles of the detachment state of the divertor plasma, whereas we are interested in the physical mechanisms of detachment, which are local to the magnetic surfaces.
As we will see, the main players in establishing the detached divertor regime are the impurity radiation loss, the plasma–neutral interactions and volumetric recombination of the plasma. (In the text below, ‘recombination’ means ‘volumetric recombination’.) Ultimate detachment is only possible if some special conditions are satisfied by the heat flux coming into the scrape-off layer (SOL) plasma from the core, $Q_{\text{SOL}}$
, the impurity radiation loss in the SOL and divertor regions and the upstream plasma parameters (note that these conditions can be affected by the magnetic configuration and divertor geometry). However, in H-mode the magnitude of
$Q_{\text{SOL}}$
, the impurity radiation loss in the SOL and divertor regions and the upstream plasma parameters (note that these conditions can be affected by the magnetic configuration and divertor geometry). However, in H-mode the magnitude of $Q_{\text{SOL}}$
can vary strongly in time due to violent bursts of energy and particle loss from the core associated with excitation of the so-called edge localized modes (ELMs) driven by magnetohydrodynamic instabilities (ITER Physics Basis 1999). As a result, high
$Q_{\text{SOL}}$
can vary strongly in time due to violent bursts of energy and particle loss from the core associated with excitation of the so-called edge localized modes (ELMs) driven by magnetohydrodynamic instabilities (ITER Physics Basis 1999). As a result, high $Q_{\text{SOL}}$
can ‘burn through’ the detached plasma, causing significant damage to the divertor targets during ELMs. Even though in future reactors everything will be done to suppress ELMs, some remnants of them will probably remain. Therefore, one area of current research is focused on evaluation of the maximum size of the ELM which the detached divertor plasma can survive. Another research area is related to the stability of the detached divertor conditions. Since the detached plasma is usually associated with a strong impurity radiation loss, it is conceivable that some radiation-driven thermal instabilities or bifurcations of the edge plasma parameters can occur.
$Q_{\text{SOL}}$
can ‘burn through’ the detached plasma, causing significant damage to the divertor targets during ELMs. Even though in future reactors everything will be done to suppress ELMs, some remnants of them will probably remain. Therefore, one area of current research is focused on evaluation of the maximum size of the ELM which the detached divertor plasma can survive. Another research area is related to the stability of the detached divertor conditions. Since the detached plasma is usually associated with a strong impurity radiation loss, it is conceivable that some radiation-driven thermal instabilities or bifurcations of the edge plasma parameters can occur.
Note that the ideas resembling the main features of the high-recycling and detached divertor regimes were discussed in the literature long before these regimes were found experimentally. For example, multiple ionization and neutralization of plasma streaming in a magnetic bottle to the end wall (which is now called a high-recycling condition!) was considered by Lehnert (Reference Lehnert1968) and the recombination of such plasma (leading to plasma detachment!) was discussed by Tenney (Reference Tenney1974) and Krasheninnikov & Pigarov (Reference Krasheninnikov and Pigarov1987). Experiments on linear divertor simulators also demonstrated a reduction of the plasma energy and particle fluxes to the end plate with increasing the gas pressure in the working chamber (Hsu, Yamada & Barret Reference Hsu, Yamada and Barret1982; Schmitz et al. Reference Schmitz, Lehmer, Chevalier, Tynan, Chia, Doerner and Conn1990). However, the reduction of the plasma particle flux to the end plate in these experiments was attributed to plasma diffusion to the side wall, which is not relevant to the detached divertor regime where most of the plasma flux associated with neutral ionization in the divertor volume does not reach the material surfaces.
The goal of this review paper is to present a compelling physical picture of detachment of a tokamak divertor plasma, which is based on the analysis of the results of simplified analytic models, comprehensive numerical simulations and available experimental data. We focus on the trends and qualitative dependencies rather than on matching some particular experimental data. The physics of the edge and divertor plasma is very complex and multifaceted and we still have no complete understanding of all the processes involved, such as: anomalous and classical transport of multi-species plasmas; dynamics of the neutral particles; atomic physics including multi-step processes and radiation transport; erosion of the PFCs and absorption and desorption of the ion and neutral species, which involve the physics of the PFCs material evolution; etc. The analysis of the processes at the tokamak plasma edge is further complicated by a large variation of the parameters of the plasma and neutrals there. For example, the plasma temperature can vary from hundreds of eV to the sub-eV range and the plasma and neutral transport varies from semi-collisional to strongly collisional regimes. Nonetheless, even though we are not yet able to describe from the first principles all the processes that occur in the edge plasma, we have basic understanding of the physics of divertor plasma detachment.
The paper is organized as follows. In § 2, we give a short review of the basic physics of the processes playing the most important role in divertor plasma detachment. Section 3 is devoted to the description of the two-dimensional (2-D) transport codes for edge plasma modelling, which are widely used now to address different issues of the edge plasma physics, to reproduce the experimental data and to verify our understanding of edge plasma phenomena. In § 4, we consider the processes leading to ultimate divertor plasma detachment, transition to and stability of the detached regime and discuss the impact of the magnetic configuration and divertor geometry on detachment. In § 5, we summarize our main conclusions.
We want to emphasize again that we are presenting here only the essentials needed to describe the broad picture of the ultimate detachment of the divertor plasma. For further details one should refer to the corresponding books, reviews and journal publications cited herein.
2 Basic physics of the divertor plasma
Here we briefly discuss the basic physical processes playing an important role in divertor plasma detachment, as well as the terminology used in the studies of the edge plasma.
2.1 Terminology
A schematic view of a toroidally symmetric magnetic configuration with a poloidal divertor is shown in figure 7. As we can see from this figure, separation of the core plasma from the plasma in contact with the material surfaces is achieved by a specific magnetic configuration formed, in particular, by electric currents flowing in the same direction through the plasma and additional toroidal coils. As a result, some magnetic flux surfaces are closed and have no contact with the PFCs, whereas some others (open) intersect the material surfaces. The separatrix separates the regions of the open and closed magnetic surfaces. Shown in figure 7 is the case where the separatrix has one X-point (a single-null configuration), although in some experiments, configurations having more than one null are used.
Schematic view of different plasma regions in a single-null divertor configuration.

We note that there is no exact definition of the region occupied by the edge plasma. Often it is assumed that the edge plasma starts ‘somewhere’ inside the separatrix and extends all the way to the PFCs. The region outside the separatrix and above X-point is usually called the scrape-off layer, while the region below the X-point is called ‘divertor’. For the case of a simple single null, the divertor region is usually sub-divided into the outer (larger major radius R) and inner (smaller R) divertors. The separatrix branches connecting the X-point and the divertor targets, together with the plasma volumes surrounding them, are called ‘divertor legs’ and the points where these branches cross the targets are called the ‘strike points’. The region of the SOL around and above the mid-plane is usually called the ‘upstream’ region.
Apart from different magnetic configurations, divertors can have different geometries of the PFCs (see figure 8). Even though the PFC geometry does not affect the plasma dynamics per se, it can strongly affect the neutral transport and hence, through the neutral–plasma interactions, greatly influence the divertor plasma conditions.
Divertor geometries that have been realized in different tokamaks. (Taken from ITER Physics Basis (1999)).

2.2 Plasma recycling
Plasma recycling, which in high-recycling conditions occurs close to the divertor targets, involves (i) neutralization of the plasma on the material surfaces of the targets and volumetric plasma recombination, (ii) ionization of the resulting neutrals and (iii) providing the power necessary to sustain the ionization processes.
The neutrals coming into the plasma volume from the material surfaces have different ‘histories’. Some of them are just the reflected neutrals and neutralized ions impinging onto the surface. The others are the neutrals released from the targets in the course of either stimulated or thermal (at relatively high surface temperature) desorption. The reflected neutrals return to the plasma volume practically instantaneously, correlated with the flux of the impinging ions. However, the neutrals originating from stimulated or thermal desorption can have some time delay with respect to the time-varying particle flux to the targets. In addition, in many cases not all the particles impinging onto the surface return to the plasma volume. Some (although in most cases, a small fraction) of them become trapped in the target material and a continuous particle input into the tokamak is needed to sustain the desired plasma density and composition. As we already mentioned in the introduction, the reflection, absorption and desorption processes depend not only on the PFC material itself, but also on saturation of the material with the plasma species (both the hydrogen isotopes and impurities), the surface morphology and the temperature, all of which can be affected by the plasma–material interactions. At present, our understanding of all these processes is rather rudimentary. Fortunately, in many cases – in particular, in steady-state conditions – the detail of plasma recycling can be ignored. However, it can be crucial for the analysis of bursty ELMs (Pigarov et al. Reference Pigarov, Krasheninnikov, Rognlien, Lasnier and Unterberg2015).
Historically, the recycling conditions in the divertor were described with the ratio of the total plasma flux to the PFCs of the first wall and divertors, $\unicode[STIX]{x1D6E4}_{w}$
, to the plasma flux entering the SOL from the core across the separatrix,
$\unicode[STIX]{x1D6E4}_{w}$
, to the plasma flux entering the SOL from the core across the separatrix, $\unicode[STIX]{x1D6E4}_{\text{SOL}}$
. Whereas in the so-called ‘low-recycling’ regime
$\unicode[STIX]{x1D6E4}_{\text{SOL}}$
. Whereas in the so-called ‘low-recycling’ regime $\unicode[STIX]{x1D6E4}_{w}\,\tilde{{>}}\,\unicode[STIX]{x1D6E4}_{\text{SOL}}$
, the ‘high-recycling’ conditions are characterized by a very large plasma flux to the PFCs, such that
$\unicode[STIX]{x1D6E4}_{w}\,\tilde{{>}}\,\unicode[STIX]{x1D6E4}_{\text{SOL}}$
, the ‘high-recycling’ conditions are characterized by a very large plasma flux to the PFCs, such that $\unicode[STIX]{x1D6E4}_{w}\gg \unicode[STIX]{x1D6E4}_{\text{SOL}}$
. The reason for this is predominant ionization of the neutrals leaving the divertor targets inside the divertor volume, close to the targets. This is accompanied by ‘fast’ plasma transport along the open magnetic field lines, which brings the plasma back to the divertor targets where it is neutralized again. Obviously, such a regime is only possible in the case where the divertor plasma is ‘opaque’ for the neutrals (that is, the neutrals are ionized mostly in the divertor), which, for a given divertor geometry, implies a sufficiently high plasma density.
$\unicode[STIX]{x1D6E4}_{w}\gg \unicode[STIX]{x1D6E4}_{\text{SOL}}$
. The reason for this is predominant ionization of the neutrals leaving the divertor targets inside the divertor volume, close to the targets. This is accompanied by ‘fast’ plasma transport along the open magnetic field lines, which brings the plasma back to the divertor targets where it is neutralized again. Obviously, such a regime is only possible in the case where the divertor plasma is ‘opaque’ for the neutrals (that is, the neutrals are ionized mostly in the divertor), which, for a given divertor geometry, implies a sufficiently high plasma density.
The high-recycling conditions do not only result in a significant increase of the plasma flux to the divertor targets, but have also a very profound effect on both the upstream and downstream SOL plasma parameters and the energy transport from upstream to the recycling region.
Indeed, since practically all the neutrals are ionized in the recycling region, in the rest of the edge plasma there is virtually no neutral ionization source and, therefore, no strong plasma flow (we ignore here both the impact of the ELMs and strong cross-field blobby transport, see our discussion in § 2.7). As a result, the plasma pressure along the magnetic field lines remains almost constant and equal to the upstream plasma pressure, $P_{\text{up}}$
, all the way from upstream to the recycling region. This implies that an effective pressure,
$P_{\text{up}}$
, all the way from upstream to the recycling region. This implies that an effective pressure, $P_{\text{recyl}}$
, of the plasma–neutral mixture in the recycling region, which includes both the static and dynamic pressure of the plasma and neutrals, as well as the momentum flux to the PFCs associated mainly with a neutral drag force or viscosity effects, builds up to counterbalance this pressure. Therefore, one can say that in the high-recycling conditions, the upstream plasma equilibrium is maintained by the plasma recycling processes powered by the heat flux coming from upstream. This issue will be further discussed in § 2.5.
$P_{\text{recyl}}$
, of the plasma–neutral mixture in the recycling region, which includes both the static and dynamic pressure of the plasma and neutrals, as well as the momentum flux to the PFCs associated mainly with a neutral drag force or viscosity effects, builds up to counterbalance this pressure. Therefore, one can say that in the high-recycling conditions, the upstream plasma equilibrium is maintained by the plasma recycling processes powered by the heat flux coming from upstream. This issue will be further discussed in § 2.5.
The increase of the plasma flux to the divertor targets, $\unicode[STIX]{x1D6E4}_{w}$
, causes a reduction of the plasma temperature near the targets,
$\unicode[STIX]{x1D6E4}_{w}$
, causes a reduction of the plasma temperature near the targets, $T_{d}$
. One can easily see this from the following arguments. Taking into account the radiation and ionization energy losses, we find that the heat flux to the targets,
$T_{d}$
. One can easily see this from the following arguments. Taking into account the radiation and ionization energy losses, we find that the heat flux to the targets, $Q_{w}$
, must be lower than the heat flux coming across the separatrix into the SOL,
$Q_{w}$
, must be lower than the heat flux coming across the separatrix into the SOL, $Q_{\text{SOL}}$
. Since the energy of the particles impinging onto the surface is proportional to
$Q_{\text{SOL}}$
. Since the energy of the particles impinging onto the surface is proportional to $T_{d}$
, we should have the following balance between the energy flux leaving the plasma and that deposited to the target:
$T_{d}$
, we should have the following balance between the energy flux leaving the plasma and that deposited to the target: $Q_{w}=\unicode[STIX]{x1D6FE}_{R}T_{d}\unicode[STIX]{x1D6E4}_{w}$
, where
$Q_{w}=\unicode[STIX]{x1D6FE}_{R}T_{d}\unicode[STIX]{x1D6E4}_{w}$
, where $\unicode[STIX]{x1D6FE}_{R}$
is a form factor that takes into account accommodation of the particle energy by the wall, so that
$\unicode[STIX]{x1D6FE}_{R}$
is a form factor that takes into account accommodation of the particle energy by the wall, so that $T_{d}=Q_{w}/\unicode[STIX]{x1D6FE}_{R}\unicode[STIX]{x1D6E4}_{w}<Q_{\text{SOL}}/\unicode[STIX]{x1D6FE}_{R}\unicode[STIX]{x1D6E4}_{w}$
. We see that at a given
$T_{d}=Q_{w}/\unicode[STIX]{x1D6FE}_{R}\unicode[STIX]{x1D6E4}_{w}<Q_{\text{SOL}}/\unicode[STIX]{x1D6FE}_{R}\unicode[STIX]{x1D6E4}_{w}$
. We see that at a given $Q_{\text{SOL}}$
,
$Q_{\text{SOL}}$
, $T_{d}$
decreases with increasing
$T_{d}$
decreases with increasing $\unicode[STIX]{x1D6E4}_{w}$
. This is not surprising since intense neutral ionization results in production of a large amount of the newly ionized, cold electron–ion pairs. Coulomb interactions of the ‘old’, hot plasma and the ‘new’, cold one dilute the energy of the hot charged particles in the recycling region.
$\unicode[STIX]{x1D6E4}_{w}$
. This is not surprising since intense neutral ionization results in production of a large amount of the newly ionized, cold electron–ion pairs. Coulomb interactions of the ‘old’, hot plasma and the ‘new’, cold one dilute the energy of the hot charged particles in the recycling region.
Finally, taking into account the virtually stagnated plasma further upstream the recycling region and a strong source of the cold particles in the divertor, one can notice that the way the plasma energy is transported from the SOL to divertor changes from predominantly convective in the low-recycling regimes to predominantly conductive in the high-recycling ones (Mahdavi et al. Reference Mahdavi, Deboo, Hsieh, Ohyabu, Stambaugh and Wesley1981). Such a change becomes particularly clear if we recall that heat conduction implies the exchange of a hot particle with a cold one, but no mass transfer. This means that for heat conduction we need permanent generation of the cold particles. In the low-recycling conditions, ionization of the neutrals in the divertor volume is negligible. In this case there is no generation of the cold particles in the divertor and, therefore, practically no effect of heat conduction (although secondary electron emission from the target could be a source of the cold electrons (Hobbs & Wesson Reference Hobbs and Wesson1967)). The situation is completely different in the high-recycling regime, where the strong ionization source provides plenty of the cold particles in the divertor and electron heat conduction becomes the dominant mechanism of the energy transport from the SOL to the divertor.
2.3 Plasma flow to the divertor targets
As mentioned above, one of the reasons for establishing the high-recycling regime is a ‘fast’ plasma flow along the magnetic field lines to the divertor targets, which promotes recirculation of the plasma and neutrals in the divertor.
It is widely known that an electrostatic potential forms close to the material surface (this region is called a ‘sheath’) to balance the ion and electron fluxes and to maintain ambipolarity of the plasma flow or to sustain continuity of the electric current through the plasma and the material of the PFC. In addition, the plasma flow at the sheath entrance must satisfy the so-called Bohm condition (see e.g. (Riemann Reference Riemann1991) and the references therein). For example, in the cold ion approximation, the plasma flow velocity, $V_{p}^{(\infty )}$
, at the sheath entrance must satisfy the inequality
$V_{p}^{(\infty )}$
, at the sheath entrance must satisfy the inequality
 $$\begin{eqnarray}\displaystyle & \displaystyle V_{p}^{(\infty )}>\sqrt{T_{e}/M_{i}}, & \displaystyle\end{eqnarray}$$
where $T_{e}$
is the electron temperature that is assumed constant and
$T_{e}$
is the electron temperature that is assumed constant and $M_{i}$
is the ion mass. It appears that only when
$M_{i}$
is the ion mass. It appears that only when $V_{p}^{(\infty )}$
satisfies (2.1) is there a smooth, non-oscillatory progression of the plasma parameters further away from the wall. One can easily derive the expression (2.1) for a collisionless plasma by adopting the Boltzmann relation between the electrostatic potential,
$V_{p}^{(\infty )}$
satisfies (2.1) is there a smooth, non-oscillatory progression of the plasma parameters further away from the wall. One can easily derive the expression (2.1) for a collisionless plasma by adopting the Boltzmann relation between the electrostatic potential, $\unicode[STIX]{x1D711}$
, and the electron density,
$\unicode[STIX]{x1D711}$
, and the electron density, $n_{e}$
,
$n_{e}$
, $n_{e}=n_{\infty }\exp (e\unicode[STIX]{x1D711}/T_{e})$
(here we assume that
$n_{e}=n_{\infty }\exp (e\unicode[STIX]{x1D711}/T_{e})$
(here we assume that $\unicode[STIX]{x1D711}\rightarrow 0$
far away from the surface;
$\unicode[STIX]{x1D711}\rightarrow 0$
far away from the surface; $n_{\infty }$
is the plasma density there and
$n_{\infty }$
is the plasma density there and $e$
is the elementary charge). Taking into account the ion energy conservation, the continuity of the ion flux and the plasma quasi-neutrality far from the surface, one obtains the expression for the ion density,
$e$
is the elementary charge). Taking into account the ion energy conservation, the continuity of the ion flux and the plasma quasi-neutrality far from the surface, one obtains the expression for the ion density, $n_{i}(\unicode[STIX]{x1D711})=n_{\infty }\sqrt{1+2e\unicode[STIX]{x1D711}/M_{i}(V_{p}^{(\infty )})^{2}}$
. Substituting the expressions for the electron and ion densities into the Poisson equation and considering asymptotic behaviour
$n_{i}(\unicode[STIX]{x1D711})=n_{\infty }\sqrt{1+2e\unicode[STIX]{x1D711}/M_{i}(V_{p}^{(\infty )})^{2}}$
. Substituting the expressions for the electron and ion densities into the Poisson equation and considering asymptotic behaviour $\unicode[STIX]{x1D711}\rightarrow 0$
, we have
$\unicode[STIX]{x1D711}\rightarrow 0$
, we have
 $$\begin{eqnarray}\displaystyle & \displaystyle \unicode[STIX]{x1D706}_{D}^{2}\frac{\text{d}^{2}\unicode[STIX]{x1D711}}{\text{d}z^{2}}=\{1-T_{e}/M_{i}\left(V_{p}^{(\infty )}\right)^{2}\}\unicode[STIX]{x1D711}, & \displaystyle\end{eqnarray}$$
where $z$
is the coordinate normal to the surface and
$z$
is the coordinate normal to the surface and $\unicode[STIX]{x1D706}_{D}=\sqrt{T_{e}/4\unicode[STIX]{x03C0}e^{2}n_{\infty }}$
is the Debye length. As one sees from (2.2), a non-oscillatory evolution of the electrostatic potential with the distance from the material surface is only possible when the inequality (2.1) is satisfied. Moreover, it follows from (2.2) that the characteristic scale of the sheath region is determined by
$\unicode[STIX]{x1D706}_{D}=\sqrt{T_{e}/4\unicode[STIX]{x03C0}e^{2}n_{\infty }}$
is the Debye length. As one sees from (2.2), a non-oscillatory evolution of the electrostatic potential with the distance from the material surface is only possible when the inequality (2.1) is satisfied. Moreover, it follows from (2.2) that the characteristic scale of the sheath region is determined by $\unicode[STIX]{x1D706}_{D}$
.
$\unicode[STIX]{x1D706}_{D}$
.
Strictly speaking, such a mono-energetic ion velocity distribution combined with the nearly Maxwellian electrons is a source of plasma instability caused by relative motion of the electrons and ions. However, this rather week instability having the growth rate ${\sim}\sqrt{m_{e}/M_{i}}\unicode[STIX]{x1D714}_{pi}$
, where
${\sim}\sqrt{m_{e}/M_{i}}\unicode[STIX]{x1D714}_{pi}$
, where $\unicode[STIX]{x1D714}_{pi}$
is the ion Langmuir frequency, is stabilized even by relatively modest ‘warming’ of the ions (Mikhailovskii Reference Mikhailovskii1974) and can hardly have any effect in the tokamak plasma.
$\unicode[STIX]{x1D714}_{pi}$
is the ion Langmuir frequency, is stabilized even by relatively modest ‘warming’ of the ions (Mikhailovskii Reference Mikhailovskii1974) and can hardly have any effect in the tokamak plasma.
By treating the ‘warm’, but still collisionless, ions kinetically and taking into account only the linear correction to the ion distribution function at $\unicode[STIX]{x1D711}\rightarrow 0$
, Harrison & Thompson (Reference Harrison and Thompson1959) have shown that the ‘Bohm condition’ can be written as
$\unicode[STIX]{x1D711}\rightarrow 0$
, Harrison & Thompson (Reference Harrison and Thompson1959) have shown that the ‘Bohm condition’ can be written as
 $$\begin{eqnarray}\displaystyle & \displaystyle \int _{0}^{\infty }\text{d}vf_{i}(v)/v^{2}<M_{i}/T_{e}, & \displaystyle\end{eqnarray}$$
where $f_{i}(v)$
is the ion distribution function normalized to 1 and
$f_{i}(v)$
is the ion distribution function normalized to 1 and $v$
is the velocity component perpendicular to the material surface. In the derivations of both (2.1) and (2.3) it was assumed that no charged particles are emitted by the wall. As we see, (2.3) cannot be written anymore as a condition just for the ion flow velocity unless we assume the mono-energetic ions; in this case, (2.3) can be written in the form of (2.1). The collisional case, considered by Riemann (Reference Riemann1989), largely confirms (2.3). An extension of the Bohm condition to the non-Maxwellian electrons can be found in Allen (Reference Allen2009).
$v$
is the velocity component perpendicular to the material surface. In the derivations of both (2.1) and (2.3) it was assumed that no charged particles are emitted by the wall. As we see, (2.3) cannot be written anymore as a condition just for the ion flow velocity unless we assume the mono-energetic ions; in this case, (2.3) can be written in the form of (2.1). The collisional case, considered by Riemann (Reference Riemann1989), largely confirms (2.3). An extension of the Bohm condition to the non-Maxwellian electrons can be found in Allen (Reference Allen2009).
Chodura (Reference Chodura1982) has shown that the condition (2.1) can also be applied for the plasma flow along the magnetic field oblique to the material surface, which is the standard case in a tokamak. However, in this case, (i) one should treat $V_{p}^{(\infty )}$
in (2.1) as the plasma flow velocity along the magnetic field lines and (ii) the characteristic scale of the quasi-neutral magnetic presheath is determined by the effective ion gyro-radius, which is usually larger than the Debye length. The latter still determines the characteristic scale of the region adjacent to the material surface where the quasi-neutrality is broken. Similarly, in the presence of the oblique magnetic field one can use (2.3), where
$V_{p}^{(\infty )}$
in (2.1) as the plasma flow velocity along the magnetic field lines and (ii) the characteristic scale of the quasi-neutral magnetic presheath is determined by the effective ion gyro-radius, which is usually larger than the Debye length. The latter still determines the characteristic scale of the region adjacent to the material surface where the quasi-neutrality is broken. Similarly, in the presence of the oblique magnetic field one can use (2.3), where $f_{i}(v)$
is the ion distribution function in the velocity
$f_{i}(v)$
is the ion distribution function in the velocity $v$
along the magnetic field.
$v$
along the magnetic field.
The potential drop between the plasma beyond the sheath and the wall, $\unicode[STIX]{x0394}\unicode[STIX]{x1D711}_{\text{sh}}$
, can be found from the Poisson equation by taking into account the electric current flowing through the sheath. For the case where there is no current and the magnetic field lines are not too oblique to the material surface, it is often assumed that
$\unicode[STIX]{x0394}\unicode[STIX]{x1D711}_{\text{sh}}$
, can be found from the Poisson equation by taking into account the electric current flowing through the sheath. For the case where there is no current and the magnetic field lines are not too oblique to the material surface, it is often assumed that $\unicode[STIX]{x0394}\unicode[STIX]{x1D711}_{\text{sh}}\sim 3T_{e}$
.
$\unicode[STIX]{x0394}\unicode[STIX]{x1D711}_{\text{sh}}\sim 3T_{e}$
.
A rather strong electric field can often exist in the edge plasma, which, in particular, results in the $\boldsymbol{E}\times \boldsymbol{B}$
drift of the charged particles. Such a drift near the target modifies the Bohm condition. The simplest way to find how the Bohm condition is modified by the presence of the electric field was suggested by Hutchinson (Reference Hutchinson1996). Consider the case where the magnetic field has both the parallel,
$\boldsymbol{E}\times \boldsymbol{B}$
drift of the charged particles. Such a drift near the target modifies the Bohm condition. The simplest way to find how the Bohm condition is modified by the presence of the electric field was suggested by Hutchinson (Reference Hutchinson1996). Consider the case where the magnetic field has both the parallel, $\boldsymbol{B}_{||}$
, and perpendicular,
$\boldsymbol{B}_{||}$
, and perpendicular, $\boldsymbol{B}_{\bot }$
, (with respect to the material surface) components, while the electric field,
$\boldsymbol{B}_{\bot }$
, (with respect to the material surface) components, while the electric field, $\boldsymbol{E}$
, is parallel to the material surface, but
$\boldsymbol{E}$
, is parallel to the material surface, but $\boldsymbol{E}\boldsymbol{\cdot }\boldsymbol{B}_{||}=0$
. By changing the frame of reference from the laboratory one to the one moving with a velocity
$\boldsymbol{E}\boldsymbol{\cdot }\boldsymbol{B}_{||}=0$
. By changing the frame of reference from the laboratory one to the one moving with a velocity $\boldsymbol{V}_{f}$
parallel to the material surface, we have the following non-relativistic (we assume that
$\boldsymbol{V}_{f}$
parallel to the material surface, we have the following non-relativistic (we assume that $|\boldsymbol{V}_{f}|\ll c$
, where
$|\boldsymbol{V}_{f}|\ll c$
, where $c$
is the speed of light) transformation of the particle velocity,
$c$
is the speed of light) transformation of the particle velocity, $\boldsymbol{V}$
, and electric and magnetic fields
$\boldsymbol{V}$
, and electric and magnetic fields
 $$\begin{eqnarray}\displaystyle & & \displaystyle \displaystyle \boldsymbol{B}^{\prime }=\boldsymbol{B},\quad \boldsymbol{E}^{\prime }=\boldsymbol{E}+\frac{1}{c}(\boldsymbol{V}_{f}\times \boldsymbol{B}).\end{eqnarray}$$
By choosing $\boldsymbol{V}_{f}=c(\boldsymbol{E}\times \boldsymbol{B}_{\bot })/B_{\bot }^{2}$
so that
$\boldsymbol{V}_{f}=c(\boldsymbol{E}\times \boldsymbol{B}_{\bot })/B_{\bot }^{2}$
so that $\boldsymbol{E}^{\prime }=0$
, we arrive at the standard problem of the plasma flow to the material surface with no ‘external’ electric field. In this frame we should have the plasma flow velocity
$\boldsymbol{E}^{\prime }=0$
, we arrive at the standard problem of the plasma flow to the material surface with no ‘external’ electric field. In this frame we should have the plasma flow velocity $(\boldsymbol{V}_{p}^{(\infty )})^{\prime }=V_{B}\boldsymbol{B}/B$
, where
$(\boldsymbol{V}_{p}^{(\infty )})^{\prime }=V_{B}\boldsymbol{B}/B$
, where $V_{B}$
satisfies, in the cold ion approximation, the inequality (2.1). Going back to the laboratory frame, we find
$V_{B}$
satisfies, in the cold ion approximation, the inequality (2.1). Going back to the laboratory frame, we find
 $$\begin{eqnarray}\displaystyle & & \displaystyle \displaystyle \boldsymbol{V}_{p}^{(\infty )}=V_{B}\boldsymbol{B}/B+c\left(\boldsymbol{E}\times \boldsymbol{B}_{\bot }\right)/B_{\bot }^{2}.\end{eqnarray}$$
We note that the component of $\boldsymbol{V}_{p}^{(\infty )}$
perpendicular to the material surface remains the same for the cases with and without the electric field.
$\boldsymbol{V}_{p}^{(\infty )}$
perpendicular to the material surface remains the same for the cases with and without the electric field.
In the plasma literature, the conditions (2.1), (2.3) are often considered as something unique and specific for the plasma only. However, this is not the case. For example, an analysis of a gas flow condensing on a fully absorbing plane results in the following ‘Bohm’ condition for the gas flow velocity, $V_{g}^{(\infty )}$
, far from the absorbing surface (see e.g. Aoki, Sone & Yamada Reference Aoki, Sone and Yamada1990, and the references therein)
$V_{g}^{(\infty )}$
, far from the absorbing surface (see e.g. Aoki, Sone & Yamada Reference Aoki, Sone and Yamada1990, and the references therein)
 $$\begin{eqnarray}\displaystyle & \displaystyle V_{g}^{(\infty )}>\sqrt{\unicode[STIX]{x1D6FE}T_{g}^{(\infty )}/M_{g}}, & \displaystyle\end{eqnarray}$$
where $\unicode[STIX]{x1D6FE}$
is the specific heat,
$\unicode[STIX]{x1D6FE}$
is the specific heat, $T_{g}^{(\infty )}$
is the gas temperature far from the surface and
$T_{g}^{(\infty )}$
is the gas temperature far from the surface and $M_{g}$
is the mass of the gas atoms or molecules.
$M_{g}$
is the mass of the gas atoms or molecules.
As we see, there is a striking similarity between the inequalities (2.1) and (2.6), even though the one is related to the plasma flow velocity and the other to the flow of the neutral gas. This suggests that the inequalities (2.1), (2.3), and (2.6) are just manifestation of a more general phenomenon. Indeed, both the plasma and neutral gas flows on absorbing targets can be considered as the flow into a shock wave. Then, according to the Landau criterion on the stability of the shock wave (Landau & Lifshitz Reference Landau and Lifshitz1986), the velocity of the incoming gas flow should be higher than the sound speed in the incoming gas. In other words, all the waves should be advected towards the shock. In the case of a gas, this immediately leads to the inequality (2.6). For a collisionless plasma it was shown by Allen (Reference Allen1976) that the inequality (2.3) simply means that the ion acoustic waves cannot travel away from the absorbing surface, which again goes along with the Landau criterion (we recall that (2.1) is just a limiting expression of (2.3) for mono-energetic ions). Therefore, we see that all the ‘Bohm’ conditions we considered here follow from the Landau criterion of the shock wave stability.
However, even though the Bohm condition for the plasma flow onto an absorbing material surface is derived, in practice it is difficult to use it because in the most general case (2.3) it is written in terms of the one-sided ion distribution function near the target. Meanwhile, in most cases the theoretical and numerical studies of the edge plasma use the Braginskii-like fluid equations (with some ad hoc corrections related to anomalous cross-field transport), which implies that the ion distribution function is close to the shifted Maxwellian, which, however, is incompatible with (2.3). Therefore, some additional analysis, dealing with the transition from the collisional fluid plasma flow relatively far from the target to the collisionless plasma flow close to the target, should be made to express the Bohm condition in terms of the fluid plasma parameters. Another important point that follows from the analysis of this transition region is related to the energy flux from the plasma to the targets, which can be considered as the boundary condition for the plasma electron and ion temperatures at the targets.
In analytic and semi-analytic treatments of the edge plasma it is often assumed that the electron and ion temperatures near the divertor targets are the same, $T_{d}$
, and the plasma flows along the magnetic field lines to the target with velocity,
$T_{d}$
, and the plasma flows along the magnetic field lines to the target with velocity, $V_{d}$
, carrying the energy flux,
$V_{d}$
, carrying the energy flux, $q_{d}$
, where,
$q_{d}$
, where,
 $$\begin{eqnarray}\displaystyle & & \displaystyle \displaystyle V_{d}=\sqrt{2T_{d}/M_{i}},\quad \text{and}\quad q_{d}=\unicode[STIX]{x1D6FE}_{d}T_{d}V_{d}n_{d},\end{eqnarray}$$
where $\unicode[STIX]{x1D6FE}_{d}\sim 8$
is the so-called sheath transmission factor and
$\unicode[STIX]{x1D6FE}_{d}\sim 8$
is the so-called sheath transmission factor and $n_{d}$
is the plasma density near the target.
$n_{d}$
is the plasma density near the target.
However, the expressions (2.7) have some caveats: they do not allow for the $\boldsymbol{E}\times \boldsymbol{B}$
drifts effects, nor for the impact of the electric current and electron emission from the surface. Meanwhile, the electron emission that seems to be observed in tokamaks (see e.g. Gunn (Reference Gunn2012) and the references therein) can significantly change the expression (2.7) for the energy flux to the targets (Hobbs & Wesson Reference Hobbs and Wesson1967).
$\boldsymbol{E}\times \boldsymbol{B}$
drifts effects, nor for the impact of the electric current and electron emission from the surface. Meanwhile, the electron emission that seems to be observed in tokamaks (see e.g. Gunn (Reference Gunn2012) and the references therein) can significantly change the expression (2.7) for the energy flux to the targets (Hobbs & Wesson Reference Hobbs and Wesson1967).
More discussions on all these effects can be found in Chankin & Stangeby (Reference Chankin and Stangeby1994), Ryutov (Reference Ryutov1996), Cohen & Ryutov (Reference Cohen and Ryutov2003), Loizu et al. (Reference Loizu, Ricci, Halpern and Jolliet2012) and Geraldini, Parra & Militello (Reference Geraldini, Parra and Militello2017).
2.4 Impurities
Impurities play a vital role in both the core and edge plasmas. In the central part of the core, the impurities (in particular, the high-Z impurities like tungsten) are ‘unwanted guests’, since their accumulation and corresponding radiation losses can cool down the core plasma and kills the fusion reaction. However, at the edge, the plasma impurity radiation, in particular for the high power discharges in current tokamaks and in future reactors, is indispensable for the reduction of the heat flux on the divertor targets and for divertor detachment. Thus, one of the dreams of the fusion plasma physicists is to have a discharge with a strong impurity radiation at the edge and minimal core contamination with impurities. However, the core and edge plasmas are coupled and since the impurities (both intentionally seeded to enhance the radiation loss or originated from erosion of the PFC material) in most cases appear in the SOL and divertor volumes, impurity transport in these regions plays a very important role in impurity penetration further into the core. Here we just outline the main processes affecting impurity radiation and transport in the SOL and divertor.
One of the most complete sets of the fluid equations for classical transport of a multicomponent plasma relevant for the conditions in the edge of the fusion devices can be found in Zhdanov (Reference Zhdanov2002). These 3-D equations, derivation of which is based on the Grad approach (Grad Reference Grad1949), can potentially describe both the edge plasma turbulence and transport of both the background plasma and impurities. However, they are so cumbersome that in practice, it is very difficult (if possible at all) to use them even numerically. Besides this, for 2-D modelling of the edge plasma transport, one needs to implement into these equations the effects of anomalous transport, which can only be done ad hoc. Therefore, 2-D transport of the background edge plasma and impurity is usually modelled with use of the classical Zhdanov-like equations in the direction parallel to the magnetic field combined with the cross-field classical drifts and ad hoc terms describing anomalous cross-field transport of the density, energy and parallel momentum of all species (Schneider et al. Reference Schneider, Bonnin, Borrass, Coster, Kastelewicz, Reiter, Rozhansky and Braams2006; Rozhansky et al. Reference Rozhansky2009).
Just as an illustration of the major effects affecting the impurity ion dynamics, we consider the equation for the parallel momentum of impurity ions, assuming that the temperatures of all species are equal and neglecting, for simplicity, all the cross-field terms and the impurity–impurity interactions (the so-called ‘trace impurity approximation’, see e.g. Zhdanov (Reference Zhdanov2002)):
 $$\begin{eqnarray}\displaystyle & & \displaystyle \displaystyle M_{I}n_{I}^{z}\left(\frac{\unicode[STIX]{x2202}V_{I,||}^{z}}{\unicode[STIX]{x2202}t}+\boldsymbol{V}_{I}^{z}\boldsymbol{\cdot }\unicode[STIX]{x1D735}V_{I,||}^{z}\right)\nonumber\\ \displaystyle & & \displaystyle \displaystyle \quad =-\unicode[STIX]{x1D735}_{||}P_{I}^{z}+\unicode[STIX]{x1D6FC}_{I}^{z}n_{I}^{z}\unicode[STIX]{x1D735}_{||}T+eZE_{||}n_{I}^{z}-\unicode[STIX]{x1D707}_{iI}n_{I}^{z}\unicode[STIX]{x1D708}_{Ii}^{z}(V_{I,||}^{z}-V_{i})+\unicode[STIX]{x03C0}_{I,||}^{z}+S_{I,||}^{z},\end{eqnarray}$$
where $E_{||}$
is the parallel component of the electric field,
$E_{||}$
is the parallel component of the electric field, $Z$
,
$Z$
, $M_{I}$
and
$M_{I}$
and $\unicode[STIX]{x1D707}_{iI}$
are the charge number, the mass of the impurity ion of kind
$\unicode[STIX]{x1D707}_{iI}$
are the charge number, the mass of the impurity ion of kind $I$
and the reduced mass of the impurity and background ions and
$I$
and the reduced mass of the impurity and background ions and $V_{i}$
is the parallel velocity of the background plasma.
$V_{i}$
is the parallel velocity of the background plasma. $n_{I}^{z}$
,
$n_{I}^{z}$
, $V_{I,||}^{z}$
,
$V_{I,||}^{z}$
, $\boldsymbol{V}_{I}^{z}$
,
$\boldsymbol{V}_{I}^{z}$
, $P_{I}^{z}=n_{I}^{z}T$
,
$P_{I}^{z}=n_{I}^{z}T$
, $\unicode[STIX]{x1D6FC}_{I}^{z}$
and
$\unicode[STIX]{x1D6FC}_{I}^{z}$
and $\unicode[STIX]{x1D708}_{Ii}^{z}$
are the density, the parallel and total velocities, the pressure, the thermal force coefficient and the frequency of the collisions of the impurity ions having charge state Z with the background ions, respectively. The
$\unicode[STIX]{x1D708}_{Ii}^{z}$
are the density, the parallel and total velocities, the pressure, the thermal force coefficient and the frequency of the collisions of the impurity ions having charge state Z with the background ions, respectively. The $\unicode[STIX]{x03C0}_{I,||}^{z}$
and
$\unicode[STIX]{x03C0}_{I,||}^{z}$
and $S_{I}^{z}$
terms describe the viscosity effects and the momentum source associated with the ionization (recombination) of the impurity of the same kind but of the charge state
$S_{I}^{z}$
terms describe the viscosity effects and the momentum source associated with the ionization (recombination) of the impurity of the same kind but of the charge state $Z-1$
(
$Z-1$
( $Z+1$
). Note that
$Z+1$
). Note that $\unicode[STIX]{x1D708}_{Ii}^{z}\propto Z^{2}n_{i}$
, where
$\unicode[STIX]{x1D708}_{Ii}^{z}\propto Z^{2}n_{i}$
, where $n_{i}$
is the density of the background ions, and
$n_{i}$
is the density of the background ions, and $\unicode[STIX]{x1D6FC}_{I}^{z}=\unicode[STIX]{x1D6FC}_{0}Z^{2}$
(where
$\unicode[STIX]{x1D6FC}_{I}^{z}=\unicode[STIX]{x1D6FC}_{0}Z^{2}$
(where $\unicode[STIX]{x1D6FC}_{0}\approx 2.2$
) even for relatively low
$\unicode[STIX]{x1D6FC}_{0}\approx 2.2$
) even for relatively low $Z$
.
$Z$
.
Analysing (2.8) for the average impurity charge state, $\bar{Z}>few$
, and taking into account that
$\bar{Z}>few$
, and taking into account that $eE_{||}\propto -\unicode[STIX]{x1D735}_{||}T$
, as follows from the electron momentum balance equation, we find that in the resulting force,
$eE_{||}\propto -\unicode[STIX]{x1D735}_{||}T$
, as follows from the electron momentum balance equation, we find that in the resulting force, $F_{I}^{\bar{z}}$
, acting on the impurity ions, the force imposed by the electric field (proportional to
$F_{I}^{\bar{z}}$
, acting on the impurity ions, the force imposed by the electric field (proportional to $\bar{Z}$
), which pushes the impurities towards the divertor target, plays no significant role in comparison with the thermal force (proportional to
$\bar{Z}$
), which pushes the impurities towards the divertor target, plays no significant role in comparison with the thermal force (proportional to $\bar{Z}^{2}$
). Therefore, if the background plasma velocity is low and the effects of cross-field impurity transport are not important, we would have the impurity equilibrium condition
$\bar{Z}^{2}$
). Therefore, if the background plasma velocity is low and the effects of cross-field impurity transport are not important, we would have the impurity equilibrium condition $F_{I}^{\bar{z}}=-T\unicode[STIX]{x1D735}_{||}n_{I}^{z}+\unicode[STIX]{x1D6FC}_{I}^{z}n_{I}^{z}\unicode[STIX]{x1D735}_{||}T=0$
, which gives a very strong impurity accumulation in the regions of high temperature
$F_{I}^{\bar{z}}=-T\unicode[STIX]{x1D735}_{||}n_{I}^{z}+\unicode[STIX]{x1D6FC}_{I}^{z}n_{I}^{z}\unicode[STIX]{x1D735}_{||}T=0$
, which gives a very strong impurity accumulation in the regions of high temperature
 $$\begin{eqnarray}\displaystyle & & \displaystyle \displaystyle n_{I}^{\bar{z}}\propto T^{\unicode[STIX]{x1D6FC}_{I}^{\bar{z}}},\end{eqnarray}$$
similar to what the neoclassical transport model predicts for the impurity distribution in the core plasma (Hirshman & Sigmar Reference Hirshman and Sigmar1981).
However, already a rather weak flow of the background plasma towards the target results in the background ion–impurity drag force larger than the thermal force and prevents the impurity accumulation at high temperature. A rough estimate based on (2.8) gives the inequality for the Mach number, $\text{Mach}_{i}$
, of the background ion flow sufficient to prevent the impurity accumulation
$\text{Mach}_{i}$
, of the background ion flow sufficient to prevent the impurity accumulation
 $$\begin{eqnarray}\displaystyle & & \displaystyle \displaystyle \text{Mach}_{i}~\tilde{{>}}~\unicode[STIX]{x1D6FC}_{0}\unicode[STIX]{x1D706}_{C}(\text{div})/L_{||}\sim 0.1,\end{eqnarray}$$
where $\unicode[STIX]{x1D706}_{C}(\text{div})$
is the Coulomb mean free path of the ion–ion collisions for hydrogenic ions in the divertor and
$\unicode[STIX]{x1D706}_{C}(\text{div})$
is the Coulomb mean free path of the ion–ion collisions for hydrogenic ions in the divertor and $L_{||}$
is the distance along the magnetic field from the targets to the X-point (in our estimates we assumed
$L_{||}$
is the distance along the magnetic field from the targets to the X-point (in our estimates we assumed $L_{||}\sim 10^{2}~\text{cm}$
, the plasma density
$L_{||}\sim 10^{2}~\text{cm}$
, the plasma density ${\sim}10^{14}~\text{cm}^{-3}$
and the temperature
${\sim}10^{14}~\text{cm}^{-3}$
and the temperature ${\sim}25~\text{eV}$
).
${\sim}25~\text{eV}$
).
Neither experimental data nor 2-D numerical simulations of impurity transport in the edge plasma show such a catastrophic accumulation of the impurity ions in the high temperature region in the high-recycling regime, predicted by (2.9), although some numerical simulations with the thermal force turned off demonstrate a drastic reduction of the impurity density at the separatrix (Smirnov et al. Reference Smirnov, Krasheninnikov, Pigarov and Rognlien2016a ).
As we mentioned already, impurity radiation, related to electron impact excitation of the different electronic states followed by emission of the photons, plays a very important role in the reduction of the heat load onto the targets and divertor detachment. However, the impurity ions have also different charge states and besides excitation, the electrons participate also in the processes of both ionization and recombination of impurity, which increase or decrease the charge state Z. The rate of the radiation loss depends not only on the kind of impurity (e.g. nitrogen, neon, etc.), but also on the charge state. Therefore, to find the impurity radiation loss, one should also consider evolution of the distribution of the impurity ions in the charge state, allowing for different excitation, ionization and recombination processes. Two simplifications can be made for the usual case where the impurity concentration in the fusion plasma is low ( ${\sim}$
1 %), so that the impurity radiation is not trapped in the edge plasmas, and the equilibration of the excited states of each charge state of the impurity ion is virtually instantaneous. These assumptions result in the so-called collisional–radiative model (see e.g. Summers et al. (Reference Summers, Dickson, O’Mullane, Badnell, Whiteford, Brooks, Lang, Loch and Griffin2006), Ralchenko (Reference Ralchenko2016) and the references therein). Such a model is implemented in the ADAS database (Summers et al.
Reference Summers, Dickson, O’Mullane, Badnell, Whiteford, Brooks, Lang, Loch and Griffin2006), which is often used for calculation of the impurity radiation loss in the fusion plasmas. To calculate the total radiation loss, one should follow transport of each charge state of the impurity ion and simultaneously take into account the ionization/recombination processes. This is a significant complication for numerical modelling of the impact of impurities on the edge plasma performance.
${\sim}$
1 %), so that the impurity radiation is not trapped in the edge plasmas, and the equilibration of the excited states of each charge state of the impurity ion is virtually instantaneous. These assumptions result in the so-called collisional–radiative model (see e.g. Summers et al. (Reference Summers, Dickson, O’Mullane, Badnell, Whiteford, Brooks, Lang, Loch and Griffin2006), Ralchenko (Reference Ralchenko2016) and the references therein). Such a model is implemented in the ADAS database (Summers et al.
Reference Summers, Dickson, O’Mullane, Badnell, Whiteford, Brooks, Lang, Loch and Griffin2006), which is often used for calculation of the impurity radiation loss in the fusion plasmas. To calculate the total radiation loss, one should follow transport of each charge state of the impurity ion and simultaneously take into account the ionization/recombination processes. This is a significant complication for numerical modelling of the impact of impurities on the edge plasma performance.
For the case where equilibration over the ionization states, relevant to the current plasma parameters, occurs faster than the impurity ion transfer to the region with significantly different plasma parameters, a further simplification is possible. For this case, the distribution of the impurity ions in the charge states $n_{I}^{z}$
, the average charge number
$n_{I}^{z}$
, the average charge number $\bar{Z}$
, and the radiation loss are determined by the local plasma parameters. By ignoring the effects of the metastable excited electronic states of the impurity ions, one can express the volumetric radiation loss,
$\bar{Z}$
, and the radiation loss are determined by the local plasma parameters. By ignoring the effects of the metastable excited electronic states of the impurity ions, one can express the volumetric radiation loss, $R_{I}$
, in the so-called coronal approximation:
$R_{I}$
, in the so-called coronal approximation:
 $$\begin{eqnarray}\displaystyle & & \displaystyle \displaystyle R_{I}=n_{I}n_{e}L_{I}(T_{e}),\end{eqnarray}$$
where $n_{I}$
is the kind
$n_{I}$
is the kind $I$
impurity density summed over all the charge states
$I$
impurity density summed over all the charge states $n_{I}^{z}$
of this impurity ion and
$n_{I}^{z}$
of this impurity ion and $L_{I}(T_{e})$
is a cooling function depending only on the electron temperature. The cooling functions for some impurities are shown in figure 9 (ITER Physics Basis 1999). The minima on
$L_{I}(T_{e})$
is a cooling function depending only on the electron temperature. The cooling functions for some impurities are shown in figure 9 (ITER Physics Basis 1999). The minima on $L_{I}(T_{e})$
correspond to the cases where the most representative charge state in the
$L_{I}(T_{e})$
correspond to the cases where the most representative charge state in the $n_{I}^{z}$
distribution corresponds to a closed outer electronic shell.
$n_{I}^{z}$
distribution corresponds to a closed outer electronic shell.
Cooling functions $L_{I}(T_{e})$
for some impurities. (Taken from ITER Physics Basis (1999)).
$L_{I}(T_{e})$
for some impurities. (Taken from ITER Physics Basis (1999)).

However, in practice, the assumption justifying the coronal approximation is often violated. The comparison of the coronal approximation with the full transport model shows that for the high density, ITER-like plasma, the most significant radiation excess over the coronal approximation occurs at the minima of $L_{I}(T_{e})$
. This is understandable, since any addition of the charge states with the incomplete outer electronic shell, which happens due to ion transport, will strongly enhance the radiation loss.
$L_{I}(T_{e})$
. This is understandable, since any addition of the charge states with the incomplete outer electronic shell, which happens due to ion transport, will strongly enhance the radiation loss.
Finally we should make some remarks about a very simplistic model of impurity transport and radiation, the so-called ‘fixed fraction model’, which some authors (e.g. Hutchinson Reference Hutchinson1994; Umansky et al.
Reference Umansky, LaBombard, Brunner, Rensink, Rognlien, Terry and Whyte2016) apply. It assumes that the $n_{I}/n_{i}$
ratio is fixed and the radiation loss is determined by (2.11). But the relevance of this model is very questionable. For example, the fixed fraction model predicts that the major impurity radiation loss occurs in the high temperature SOL plasma (Post et al.
Reference Post, Putvinskaya, Perkins and Nevins1995, see), whereas both the experimental data and 2-D simulations show that most of the impurity radiation comes from the relatively cold divertor plasma volume. Therefore, the conclusions made in the papers, where such a model was used, should be verified with approximations that are more reliable.
$n_{I}/n_{i}$
ratio is fixed and the radiation loss is determined by (2.11). But the relevance of this model is very questionable. For example, the fixed fraction model predicts that the major impurity radiation loss occurs in the high temperature SOL plasma (Post et al.
Reference Post, Putvinskaya, Perkins and Nevins1995, see), whereas both the experimental data and 2-D simulations show that most of the impurity radiation comes from the relatively cold divertor plasma volume. Therefore, the conclusions made in the papers, where such a model was used, should be verified with approximations that are more reliable.
2.5 Recycling region
As we already noted, in the high-recycling regime, the whole upstream divertor and SOL plasma is sustained by the processes related to the plasma recycling. Therefore, the recycling region is the cornerstone of the SOL and divertor plasma. This region has a very complex physics, which comprises plasma and neutral transport; ion–neutral and neutral–neutral collisional coupling; the atomic physics (excitation, dissociation and ionization of the hydrogenic species and impurities, plasma recombination, etc.); hydrogen radiation transport (due to the relatively high neutral density in the recycling region, the latter can become opaque for some hydrogen lines), which alters the rates of the atomic processes; and the interactions of the plasma and neutrals with the material surfaces. The complexity, diversity, and, what is most important, synergy of the processes in the recycling region make it very difficult to produce reliable estimates based on the simple models. The best that such models can do is to show some trends, which, however, must be verified with sophisticated numerical codes.
One of the main issues related to the processes in the recycling region is the physics behind the effective pressure $P_{\text{recyl}}$
that counter-balances the upstream plasma pressure
$P_{\text{recyl}}$
that counter-balances the upstream plasma pressure $P_{\text{up}}$
. Since both the neutral and plasma pressures in the vicinity of the targets in the high-recycling regime are significantly lower than
$P_{\text{up}}$
. Since both the neutral and plasma pressures in the vicinity of the targets in the high-recycling regime are significantly lower than $P_{\text{up}}$
, it is widely assumed that
$P_{\text{up}}$
, it is widely assumed that $P_{\text{recyl}}$
is related to the effective ion–neutral drag force. This idea is usually illustrated by the results following from the paper by Self & Ewald (Reference Self and Ewald1966), where an isothermal plasma flow to a material surface through a cloud of a cold, stationary neutral gas was analysed. This model is based on the balance equations of the plasma momentum and particle fluxes:
$P_{\text{recyl}}$
is related to the effective ion–neutral drag force. This idea is usually illustrated by the results following from the paper by Self & Ewald (Reference Self and Ewald1966), where an isothermal plasma flow to a material surface through a cloud of a cold, stationary neutral gas was analysed. This model is based on the balance equations of the plasma momentum and particle fluxes:
 $$\begin{eqnarray}\displaystyle & & \displaystyle \displaystyle \frac{\text{d}}{\text{d}\ell }\left(2Tn+MnV^{2}\right)=-MnV\unicode[STIX]{x1D708}_{iN},\quad \frac{\text{d}(MnV)}{\text{d}\ell }=Mn\unicode[STIX]{x1D708}_{\text{ion}},\end{eqnarray}$$
where $\ell$
is the coordinate along the magnetic field,
$\ell$
is the coordinate along the magnetic field, $T=\text{const}$
. is the electron and ion temperature (
$T=\text{const}$
. is the electron and ion temperature ( $T_{e}=T_{i}=T$
),
$T_{e}=T_{i}=T$
), $M$
and
$M$
and $V$
are the ion mass and velocity along the magnetic field,
$V$
are the ion mass and velocity along the magnetic field, $\unicode[STIX]{x1D708}_{iN}=NK_{iN}(T)$
and
$\unicode[STIX]{x1D708}_{iN}=NK_{iN}(T)$
and $\unicode[STIX]{x1D708}_{\text{ion}}=NK_{\text{ion}}(T)$
are the effective frequencies of the ion–neutral momentum transfer collisions and ionization (
$\unicode[STIX]{x1D708}_{\text{ion}}=NK_{\text{ion}}(T)$
are the effective frequencies of the ion–neutral momentum transfer collisions and ionization ( $N$
is the neutral density,
$N$
is the neutral density, $K_{iN}(T)$
and
$K_{iN}(T)$
and $K_{\text{ion}}(T)$
are the rate constants of ion–neutral collisions and ionization). From (2.12) we find
$K_{\text{ion}}(T)$
are the rate constants of ion–neutral collisions and ionization). From (2.12) we find
 $$\begin{eqnarray}\displaystyle & & \displaystyle \displaystyle \frac{\text{d}\ell n(n)}{\text{d}\ell }=-\frac{1+\unicode[STIX]{x1D6FC}}{2(\unicode[STIX]{x1D707}^{2}+\unicode[STIX]{x1D6FC})}\frac{\text{d}\unicode[STIX]{x1D707}^{2}}{\text{d}\ell },\end{eqnarray}$$
 $$\begin{eqnarray}\displaystyle & & \displaystyle \displaystyle \frac{\text{d}\unicode[STIX]{x1D707}}{\text{d}\ell }=\frac{\unicode[STIX]{x1D708}_{\text{ion}}+\unicode[STIX]{x1D708}_{iN}}{C_{s}}\frac{\unicode[STIX]{x1D6FC}+\unicode[STIX]{x1D707}^{2}}{1-\unicode[STIX]{x1D707}^{2}},\end{eqnarray}$$
where $C_{s}=\sqrt{2T/M}$
,
$C_{s}=\sqrt{2T/M}$
, $\unicode[STIX]{x1D707}=V/C_{s}$
is the Mach number, and
$\unicode[STIX]{x1D707}=V/C_{s}$
is the Mach number, and
 $$\begin{eqnarray}\displaystyle \unicode[STIX]{x1D6FC}(T)=\frac{K_{\text{ion}}(T)}{K_{\text{ion}}(T)+K_{iN}(T)}. & & \displaystyle\end{eqnarray}$$
As we see from (2.14), $\text{d}\unicode[STIX]{x1D707}/\text{d}\ell$
goes to infinity when the flow velocity approaches the sound barrier. Therefore, it is assumed that
$\text{d}\unicode[STIX]{x1D707}/\text{d}\ell$
goes to infinity when the flow velocity approaches the sound barrier. Therefore, it is assumed that $\unicode[STIX]{x1D707}$
reaches unity at the sheath entrance:
$\unicode[STIX]{x1D707}$
reaches unity at the sheath entrance: $\unicode[STIX]{x1D707}_{t}=1$
, (which is consistent with the results of our discussion of the plasma flow in the vicinity of a material surface in § 2.3). Assume that plasma recycling in the gas cloud completely sustains the upstream plasma (no plasma flow into the gas cloud from upstream,
$\unicode[STIX]{x1D707}_{t}=1$
, (which is consistent with the results of our discussion of the plasma flow in the vicinity of a material surface in § 2.3). Assume that plasma recycling in the gas cloud completely sustains the upstream plasma (no plasma flow into the gas cloud from upstream, $\unicode[STIX]{x1D707}_{\text{up}}=0$
). Then from (2.13), (2.14) we find the plasma density (pressure) difference between the upstream region and the target, the plasma flux along the magnetic field to the target,
$\unicode[STIX]{x1D707}_{\text{up}}=0$
). Then from (2.13), (2.14) we find the plasma density (pressure) difference between the upstream region and the target, the plasma flux along the magnetic field to the target, $j_{t}$
, and the thickness of the cloud,
$j_{t}$
, and the thickness of the cloud, $L_{\text{crit}}$
, which are necessary for complete sustainment of the upstream plasma. After some algebra we find (see e.g. Pitcher & Stangeby Reference Pitcher and Stangeby1997)
$L_{\text{crit}}$
, which are necessary for complete sustainment of the upstream plasma. After some algebra we find (see e.g. Pitcher & Stangeby Reference Pitcher and Stangeby1997)
 $$\begin{eqnarray}\displaystyle & & \displaystyle \displaystyle \left.\begin{array}{@{}c@{}}\displaystyle \frac{n_{\text{up}}}{n_{t}}=\left(\frac{1+\unicode[STIX]{x1D6FC}}{\unicode[STIX]{x1D6FC}}\right)^{(1+\unicode[STIX]{x1D6FC})/2},\quad \frac{j_{t}}{C_{s}n_{\text{up}}}=\left(\frac{\unicode[STIX]{x1D6FC}}{1+\unicode[STIX]{x1D6FC}}\right)^{(1+\unicode[STIX]{x1D6FC})/2},\\ \displaystyle L_{\text{crit}}\frac{\unicode[STIX]{x1D708}_{\text{ion}}+\unicode[STIX]{x1D708}_{iN}}{C_{s}}=\frac{1+\unicode[STIX]{x1D6FC}}{\sqrt{\unicode[STIX]{x1D6FC}}}\arctan \left(\frac{1}{\sqrt{\unicode[STIX]{x1D6FC}}}\right)-1.\end{array}\right\}\end{eqnarray}$$
For a low plasma temperature, $K_{\text{ion}}(T)\ll K_{iN}(T)$
(see figure 10) and
$K_{\text{ion}}(T)\ll K_{iN}(T)$
(see figure 10) and $\unicode[STIX]{x1D6FC}\ll 1$
. For this case the expressions (2.16) can be presented as
$\unicode[STIX]{x1D6FC}\ll 1$
. For this case the expressions (2.16) can be presented as
 $$\begin{eqnarray}\displaystyle & & \displaystyle \displaystyle \left.\begin{array}{@{}c@{}}\displaystyle \frac{n_{\text{up}}}{n_{t}}=\left(\frac{K_{iN}}{K_{\text{ion}}}\right)^{1/2}\gg 1,\quad \frac{j_{t}}{C_{s}n_{\text{up}}}=\left(\frac{K_{\text{ion}}}{K_{iN}}\right)^{1/2}\ll 1,\\ \displaystyle L_{\text{crit}}=\frac{\unicode[STIX]{x03C0}}{2}\frac{C_{s}}{\unicode[STIX]{x1D708}_{iN}}\left(\frac{K_{iN}}{K_{\text{ion}}}\right)^{1/2}\gg \unicode[STIX]{x1D706}_{iN},\end{array}\right\}\end{eqnarray}$$
where $\unicode[STIX]{x1D706}_{iN}=C_{s}/\unicode[STIX]{x1D708}_{iN}$
is the ion mean free path before a collision with a neutral. As we see from (2.17), for
$\unicode[STIX]{x1D706}_{iN}=C_{s}/\unicode[STIX]{x1D708}_{iN}$
is the ion mean free path before a collision with a neutral. As we see from (2.17), for $K_{\text{ion}}(T)\ll K_{iN}(T)$
,
$K_{\text{ion}}(T)\ll K_{iN}(T)$
, $j_{t}$
is much smaller than the free-streaming plasma flux calculated with the upstream plasma density,
$j_{t}$
is much smaller than the free-streaming plasma flux calculated with the upstream plasma density, $C_{s}n_{\text{up}}$
. In addition, the upstream plasma density (pressure) is much higher than that at the target. We should note that since
$C_{s}n_{\text{up}}$
. In addition, the upstream plasma density (pressure) is much higher than that at the target. We should note that since $L_{\text{crit}}\gg \unicode[STIX]{x1D706}_{iN}$
, one can obtain (2.17) by using diffusive approximation for the plasma flux,
$L_{\text{crit}}\gg \unicode[STIX]{x1D706}_{iN}$
, one can obtain (2.17) by using diffusive approximation for the plasma flux, $nV=-(2T/M)\unicode[STIX]{x1D708}_{iN}^{-1}(\unicode[STIX]{x2202}n/\unicode[STIX]{x2202}\ell )$
, in the plasma continuity equation, instead of using the full balance equation of the plasma momentum flux (2.12).
$nV=-(2T/M)\unicode[STIX]{x1D708}_{iN}^{-1}(\unicode[STIX]{x2202}n/\unicode[STIX]{x2202}\ell )$
, in the plasma continuity equation, instead of using the full balance equation of the plasma momentum flux (2.12).
The ionization and ion–neutral collision rate constants as functions of the temperature. Data are from the Eirene code database Reiter (Reference Reiter2017).

The expression (2.16) for the upstream to downstream plasma density ratio is often used to compare with the experimental data. However, we should keep in mind that the Self and Ewald model assumes a constant plasma temperature and stationary cold neutrals, which result in a strong ion–neutral drag force. In practice, the plasma temperature varies along the magnetic field, which, for the most important case of low $T$
, results in a strong variation of the ionization rate constant and, hence, the
$T$
, results in a strong variation of the ionization rate constant and, hence, the $\unicode[STIX]{x1D6FC}$
parameter. In addition, the divertor plasma density in the high-recycling regime reaches
$\unicode[STIX]{x1D6FC}$
parameter. In addition, the divertor plasma density in the high-recycling regime reaches ${\sim}10^{15}~\text{cm}^{-3}$
, which makes the mean free path of neutrals
${\sim}10^{15}~\text{cm}^{-3}$
, which makes the mean free path of neutrals ${\sim}1~\text{mm}$
(see e.g. Krstic & Schultz Reference Krstic and Schultz1999a
), which is shorter than the characteristic cross-field width of the divertor plasma. For this case, the neutrals and ions are strongly coupled, so that their average velocities along the magnetic field are almost equal. As the result, the effective ion–neutral friction force is determined not by the direct drag (see the first equation in (2.12)), but by much weaker neutral cross-field viscosity effects (see e.g. Helander, Krasheninnikov & Catto Reference Helander, Krasheninnikov and Catto1994). Correspondingly, the plasma pressure variation along the magnetic field caused by the plasma–neutral interactions should be smaller than that predicted by the Self & Ewald model. The experimental data do indeed support this effect (see e.g. Lipschultz et al. (Reference Lipschultz, LaBombard, Terry, Boswell and Hutchinson2007) and the references therein).
${\sim}1~\text{mm}$
(see e.g. Krstic & Schultz Reference Krstic and Schultz1999a
), which is shorter than the characteristic cross-field width of the divertor plasma. For this case, the neutrals and ions are strongly coupled, so that their average velocities along the magnetic field are almost equal. As the result, the effective ion–neutral friction force is determined not by the direct drag (see the first equation in (2.12)), but by much weaker neutral cross-field viscosity effects (see e.g. Helander, Krasheninnikov & Catto Reference Helander, Krasheninnikov and Catto1994). Correspondingly, the plasma pressure variation along the magnetic field caused by the plasma–neutral interactions should be smaller than that predicted by the Self & Ewald model. The experimental data do indeed support this effect (see e.g. Lipschultz et al. (Reference Lipschultz, LaBombard, Terry, Boswell and Hutchinson2007) and the references therein).
In some papers, the fact that for low plasma temperatures, the effective ion–neutral drag force results in the inequality $j_{t}\ll C_{s}n_{\text{up}}$
is interpreted as this drag being the cause of the reduction of the plasma flux to the target and plasma detachment. However, we will see in next sections that it is the impurity radiation loss and plasma recombination that are responsible for the reduction of the plasma flux to the divertor targets, although ion–neutral coupling is crucial to balance the high plasma pressure further upstream from the recycling region.
$j_{t}\ll C_{s}n_{\text{up}}$
is interpreted as this drag being the cause of the reduction of the plasma flux to the target and plasma detachment. However, we will see in next sections that it is the impurity radiation loss and plasma recombination that are responsible for the reduction of the plasma flux to the divertor targets, although ion–neutral coupling is crucial to balance the high plasma pressure further upstream from the recycling region.
Therefore, the hydrogen-related atomic physics effects play a very important role in the recycling region. They include the elastic and charge-exchange collisions of the protons (deutons, tritons) with atomic and molecular hydrogen, excitation, dissociation and ionization of atoms and molecules. These processes determine both neutral and, to a large extent, plasma transport in the recycling region, as well as the plasma particle source and the hydrogen-related radiation/ionization loss. Unlike the impurity, the hydrogen atom has only one electron, so that ionization effectively terminates hydrogen radiation at the edge. Therefore, for simplified estimates it is very convenient to introduce the so-called hydrogen ionization cost, $E_{\text{ion}}$
, which allows for the total loss of the plasma energy related to one hydrogen atom from the time it appears in the plasma until its ionization (see Janev et al.
Reference Janev, Post, Langer, Evans, Heifetz and Weisheit1984). For the plasma parameters of interest,
$E_{\text{ion}}$
, which allows for the total loss of the plasma energy related to one hydrogen atom from the time it appears in the plasma until its ionization (see Janev et al.
Reference Janev, Post, Langer, Evans, Heifetz and Weisheit1984). For the plasma parameters of interest, $E_{\text{ion}}\sim 30/40~\text{eV}$
. For the temperatures
$E_{\text{ion}}\sim 30/40~\text{eV}$
. For the temperatures ${\sim}1~\text{eV}$
, recombination becomes very important in plasma and neutral particle balance.
${\sim}1~\text{eV}$
, recombination becomes very important in plasma and neutral particle balance.
In most cases, the cross-sections of these processes are rather well known (see e.g. Janev (Reference Janev1995), Post (Reference Post1995) and Krstic & Schultz (Reference Krstic and Schultz1999a ,Reference Krstic and Schultz b ) and the references therein). However, in the high-recycling conditions some effects make calculation of the required rate constants extremely difficult. First, the divertor plasma density in the high-recycling regime is so high that the radiative decay of the electronically excited states is no longer faster than the electron impact excitation/de-excitation/ionization of these states. As the result, the multi-step processes must be taken into account, see figure 11 taken from Post (Reference Post1995). This is usually done in the framework of the collisional–radiative model (see e.g. Janev et al. Reference Janev, Post, Langer, Evans, Heifetz and Weisheit1984; Sawada & Fujimoto Reference Sawada and Fujimoto1995), similar to that used for impurities. Secondly, the hydrogen neutral density becomes so high that the divertor volume becomes opaque (see e.g. Post (Reference Post1995) and the references therein) for the radiation in some lines (e.g. the Lyman series). Such radiation trapping, seen in experiments Terry et al. (Reference Terry, Lipschultz, Pigarov, Krasheninnikov, LaBombard, Lumma, Ohkawa, Pappas and Umansky1998), strongly modifies the rate constants of the hydrogen-related atomic processes and, due to the radiation transport, makes them non-locally dependent on the plasma parameters. Therefore, the most sophisticated collisional–radiative models for the hydrogen-related processes include the effects of the radiation transport (e.g. Reiter et al. Reference Reiter, Kotov, Börner, Sawada, Janev and Küppers2007). Finally, usually all the rate constants in the collisional–radiative models are based on the assumption of Maxwellian distribution functions of the particles involved in the processes. However, in practice this assumption may fail. For example, in the high-recycling regimes, where the upstream plasma temperature is significantly higher than that in the divertor, the electron distribution function in the divertor volume has a well-pronounced non-Maxwellian tail (see e.g. Batishchev et al. Reference Batishchev1997), which can significantly enhance the rate constants of the processes with a high energy threshold (e.g. ionization) in comparison with those calculated with the Maxwellian distribution. These effects can be taken into account only by considering edge plasma transport kinetically. At the moment, there is virtually no 2-D code that can do this job.
Ionization and recombination rate constants with the impact of multi-step processes. Post (Reference Post1995).
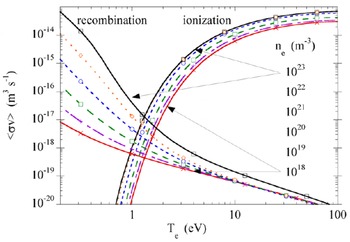
We conclude this section with a discussion of the plasma recombination processes, which, as we will see in the next sections, play key roles in divertor plasma detachment. In relatively cold divertor plasma, there are several types of processes leading to plasma recombination. The most known are the recombination processes involving only electrons, ions and radiation: the so-called radiative and three-body recombination (see e.g. Post Reference Post1995). We will term them electron–ion recombination (EIR). For the high plasma density typical for the high-recycling regime and ${\sim}$
eV range of the plasma temperature, the three-body recombination dominates in EIR and, as a crude estimate, the rate constant of the EIR,
${\sim}$
eV range of the plasma temperature, the three-body recombination dominates in EIR and, as a crude estimate, the rate constant of the EIR, $K_{\text{EIR}}$
, has a very strong temperature dependence
$K_{\text{EIR}}$
, has a very strong temperature dependence $K_{\text{EIR}}\propto T^{-9/2}$
(note that the multi-step processes and radiation trapping effects do also contribute to
$K_{\text{EIR}}\propto T^{-9/2}$
(note that the multi-step processes and radiation trapping effects do also contribute to $K_{\text{EIR}}$
), so that EIR becomes important only for a low plasma temperature 1 eV.
$K_{\text{EIR}}$
), so that EIR becomes important only for a low plasma temperature 1 eV.
However, the presence of hydrogenic and other molecules in the divertor plasma can activate other recombination channels, the so-called molecular activated recombination (MAR), which include both charge exchange and dissociative molecular recombination (Krasheninnikov, Pigarov & Sigmar Reference Krasheninnikov, Pigarov and Sigmar1996). These processes are typical for plasma recombination in weakly ionized gas discharges (see e.g. Lieberman & Lichtenberg Reference Lieberman and Lichtenberg1994). In the divertor plasma, the processes leading to formation of both the molecular ion $\text{H}_{2}^{+}$
and the negative ion
$\text{H}_{2}^{+}$
and the negative ion $\text{H}^{-}$
are endothermic and can only proceed if the H
$\text{H}^{-}$
are endothermic and can only proceed if the H $_{2}$
molecule is vibrationally excited to a certain energy. The vibrational excitation of molecules occurs by electron impact, although some fraction of the molecules formed at the surface might come vibrationally excited as well. For the
$_{2}$
molecule is vibrationally excited to a certain energy. The vibrational excitation of molecules occurs by electron impact, although some fraction of the molecules formed at the surface might come vibrationally excited as well. For the $^{1}$
H isotope, once H
$^{1}$
H isotope, once H $_{2}$
is vibrationally excited to
$_{2}$
is vibrationally excited to ${\sim}$
4th vibrational level, the following reactions result in the recombination of the positive plasma ion (data on MAR involving other isotopes of hydrogen can be found in the atomic data package of the EIRENE code, see Reiter (Reference Reiter2017)):
${\sim}$
4th vibrational level, the following reactions result in the recombination of the positive plasma ion (data on MAR involving other isotopes of hydrogen can be found in the atomic data package of the EIRENE code, see Reiter (Reference Reiter2017)):
 $$\begin{eqnarray}\displaystyle \text{H}_{2}(\text{v})+\text{H}^{+}\rightarrow \text{H}_{2}^{+}+\text{H},\quad \text{H}_{2}^{+}+\text{e}\rightarrow \text{2H}, & & \displaystyle\end{eqnarray}$$
and
 $$\begin{eqnarray}\displaystyle \text{H}_{2}(\text{v})+\text{e}\rightarrow \text{H}^{-}+\text{H},\quad \text{H}^{-}+\text{H}^{+}\rightarrow 2\text{H}. & & \displaystyle\end{eqnarray}$$
The collisional–radiative model that describes MAR involving hydrogen molecules was developed in Pigarov & Krasheninnikov (Reference Pigarov and Krasheninnikov1996). Since other reactions destroying the molecular ions with formation of $\text{H}^{+}$
or consuming the negative ions before they can recombine with H
$\text{H}^{+}$
or consuming the negative ions before they can recombine with H $^{+}$
compete with the last reactions of the chains (2.18), (2.19), the net recombination effect is sensitive to the plasma parameters and to the hydrogen species involved (Kukushkin et al.
Reference Kukushkin, Krasheninnikov, Pshenov and Reiter2017). These days, MAR is routinely taken into account in major edge plasma codes. Some authors separate the processes (2.18), (2.19), which lead to effective recombination of plasma, from the competing processes, introducing the ‘molecular activated dissociation’ (MAD) and ‘molecular activated ionization’ (MAI) terms (see e.g. Fantz et al.
Reference Fantz, Reiter, Heger and Coster2001). We find this separation unnecessary since the processes in question are included in the collisional–radiative model describing MAR.
$^{+}$
compete with the last reactions of the chains (2.18), (2.19), the net recombination effect is sensitive to the plasma parameters and to the hydrogen species involved (Kukushkin et al.
Reference Kukushkin, Krasheninnikov, Pshenov and Reiter2017). These days, MAR is routinely taken into account in major edge plasma codes. Some authors separate the processes (2.18), (2.19), which lead to effective recombination of plasma, from the competing processes, introducing the ‘molecular activated dissociation’ (MAD) and ‘molecular activated ionization’ (MAI) terms (see e.g. Fantz et al.
Reference Fantz, Reiter, Heger and Coster2001). We find this separation unnecessary since the processes in question are included in the collisional–radiative model describing MAR.
The reactions similar to (2.18), (2.19) can go with other available molecular ions. For example, the impact of hydrocarbons on plasma recombination was considered in Janev, Kato & Wang (Reference Janev, Kato and Wang2000).
2.6 Drifts and electric currents
Drifts ( $\boldsymbol{E}\times \boldsymbol{B}$
as well as
$\boldsymbol{E}\times \boldsymbol{B}$
as well as $\unicode[STIX]{x1D735}B$
and curvature drifts) and electric currents play an important role in the SOL and divertor physics (see e.g. Chankin Reference Chankin1997; Rozhansky Reference Rozhansky2014), contributing, in particular, to poloidal non-uniformity of the edge plasma parameters. As an example we can recall that
$\unicode[STIX]{x1D735}B$
and curvature drifts) and electric currents play an important role in the SOL and divertor physics (see e.g. Chankin Reference Chankin1997; Rozhansky Reference Rozhansky2014), contributing, in particular, to poloidal non-uniformity of the edge plasma parameters. As an example we can recall that $\boldsymbol{E}\times \boldsymbol{B}$
drift can significantly alter the Bohm condition for the plasma flow to the target (see (2.5)).
$\boldsymbol{E}\times \boldsymbol{B}$
drift can significantly alter the Bohm condition for the plasma flow to the target (see (2.5)).
In the studies of edge plasma transport, the electrostatic potential, $\unicode[STIX]{x1D711}$
, is determined from the equation
$\unicode[STIX]{x1D711}$
, is determined from the equation $\unicode[STIX]{x1D735}\boldsymbol{\cdot }\boldsymbol{j}=0$
. The perpendicular component of the electric current,
$\unicode[STIX]{x1D735}\boldsymbol{\cdot }\boldsymbol{j}=0$
. The perpendicular component of the electric current, $\boldsymbol{j}_{\bot }$
, comes from the perpendicular force balance equation for the plasma, which in the simplest case of a plasma with one ion species can be written as
$\boldsymbol{j}_{\bot }$
, comes from the perpendicular force balance equation for the plasma, which in the simplest case of a plasma with one ion species can be written as
 $$\begin{eqnarray}\displaystyle Mn\left((\boldsymbol{V}\boldsymbol{\cdot }\unicode[STIX]{x1D735})\boldsymbol{V}\right)_{\bot }=-\unicode[STIX]{x1D735}_{\bot }P_{p}+c^{-1}(\boldsymbol{j}_{\bot }\times \boldsymbol{B}), & & \displaystyle\end{eqnarray}$$
where $P_{p}$
is the total plasma pressure and
$P_{p}$
is the total plasma pressure and $\boldsymbol{V}$
the plasma velocity. The parallel component of the electric current,
$\boldsymbol{V}$
the plasma velocity. The parallel component of the electric current, $j_{||}$
, comes from the parallel momentum balance of electrons assuming that the electron inertial component is negligible (the so-called generalized Ohm’s law). In the simplest case, this equation is
$j_{||}$
, comes from the parallel momentum balance of electrons assuming that the electron inertial component is negligible (the so-called generalized Ohm’s law). In the simplest case, this equation is
 $$\begin{eqnarray}\displaystyle 0=-\unicode[STIX]{x1D735}_{||}P_{e}-\unicode[STIX]{x1D6FC}_{e}n\unicode[STIX]{x1D735}_{||}T_{e}+en\unicode[STIX]{x1D735}_{||}\unicode[STIX]{x1D711}+m_{e}\unicode[STIX]{x1D708}_{ei}j_{||}/e, & & \displaystyle\end{eqnarray}$$
where $P_{e}$
and
$P_{e}$
and $\unicode[STIX]{x1D6FC}_{e}$
are the electron pressure and the electron thermal force coefficient (
$\unicode[STIX]{x1D6FC}_{e}$
are the electron pressure and the electron thermal force coefficient ( $\unicode[STIX]{x1D6FC}_{e}=0.71$
for the plasma with singly charged ions). The boundary conditions for the equations (2.20), (2.21) at the targets come from the expressions for
$\unicode[STIX]{x1D6FC}_{e}=0.71$
for the plasma with singly charged ions). The boundary conditions for the equations (2.20), (2.21) at the targets come from the expressions for $\unicode[STIX]{x0394}\unicode[STIX]{x1D711}_{\text{sh}}$
, which we discussed in § 2.3. More detailed consideration of the boundary conditions at the targets (including the expressions for the plasma momentum, the electrostatic potential and the heat flux) in the presence of the drifts and electric current can be found in Chankin & Stangeby (Reference Chankin and Stangeby1994) and Cohen & Ryutov (Reference Cohen and Ryutov2003).
$\unicode[STIX]{x0394}\unicode[STIX]{x1D711}_{\text{sh}}$
, which we discussed in § 2.3. More detailed consideration of the boundary conditions at the targets (including the expressions for the plasma momentum, the electrostatic potential and the heat flux) in the presence of the drifts and electric current can be found in Chankin & Stangeby (Reference Chankin and Stangeby1994) and Cohen & Ryutov (Reference Cohen and Ryutov2003).
We note that the presence of the ‘open’ magnetic flux surfaces having a direct contact with the conducting surfaces of the divertor targets, the large variation of the plasma temperature along the magnetic field, the secondary electron emission from the targets, the strong asymmetry between the plasma parameters in the inner and outer divertors and the relatively narrow SOL make the effects of the drifts and electric currents in the SOL and divertor significantly differ from those in the core.
For example, in Harbour (Reference Harbour1988) and Staebler & Hinton (Reference Staebler and Hinton1989) it was shown that the difference of the electron temperatures in the inner and outer divertors causes the corresponding difference of the electrostatic potential drop at the sheaths, $\unicode[STIX]{x0394}\unicode[STIX]{x1D711}_{\text{sh}}$
. As a result, the electric current will flow along the magnetic field from one divertor to the other. This current (which does not exist at all in the core plasma) can significantly exceed the Phirsch–Schlüter current caused by the
$\unicode[STIX]{x0394}\unicode[STIX]{x1D711}_{\text{sh}}$
. As a result, the electric current will flow along the magnetic field from one divertor to the other. This current (which does not exist at all in the core plasma) can significantly exceed the Phirsch–Schlüter current caused by the $\unicode[STIX]{x1D735}B$
and curvature drifts.
$\unicode[STIX]{x1D735}B$
and curvature drifts.
The effects of the drifts become particularly important for the case where the width of the SOL, $\unicode[STIX]{x1D6E5}_{\text{SOL}}$
, is relatively small. Indeed, consider (2.21) neglecting the contribution from the parallel current and assuming that the electron and ion temperatures are equal. Then, for a subsonic parallel plasma flow
$\unicode[STIX]{x1D6E5}_{\text{SOL}}$
, is relatively small. Indeed, consider (2.21) neglecting the contribution from the parallel current and assuming that the electron and ion temperatures are equal. Then, for a subsonic parallel plasma flow $2P_{e}=P_{p}=\text{const}.$
and from (2.21) we have
$2P_{e}=P_{p}=\text{const}.$
and from (2.21) we have $\unicode[STIX]{x1D735}_{||}(\unicode[STIX]{x1D6FC}_{e}T_{e}-e\unicode[STIX]{x1D711})=0$
, which gives
$\unicode[STIX]{x1D735}_{||}(\unicode[STIX]{x1D6FC}_{e}T_{e}-e\unicode[STIX]{x1D711})=0$
, which gives $e\unicode[STIX]{x1D711}=\unicode[STIX]{x1D6FC}_{e}T_{e}$
. Hence, the poloidal component of
$e\unicode[STIX]{x1D711}=\unicode[STIX]{x1D6FC}_{e}T_{e}$
. Hence, the poloidal component of $\boldsymbol{E}\times \boldsymbol{B}$
drift velocity,
$\boldsymbol{E}\times \boldsymbol{B}$
drift velocity, $V_{\boldsymbol{E}\times \boldsymbol{B}}^{p}$
, can be estimated as
$V_{\boldsymbol{E}\times \boldsymbol{B}}^{p}$
, can be estimated as
 $$\begin{eqnarray}\displaystyle V_{\boldsymbol{E}\times \boldsymbol{B}}^{p}\approx \frac{c\unicode[STIX]{x1D6FC}_{e}T_{e}}{eB_{T}\unicode[STIX]{x1D6E5}_{\text{SOL}}}, & & \displaystyle\end{eqnarray}$$
where $B_{T}$
is the toroidal magnetic field. Then, taking into account that the poloidal projection of the parallel plasma flow velocity,
$B_{T}$
is the toroidal magnetic field. Then, taking into account that the poloidal projection of the parallel plasma flow velocity, $V_{||}$
, is
$V_{||}$
, is $V_{||}(B_{P}/B_{T})$
, where
$V_{||}(B_{P}/B_{T})$
, where $B_{P}$
is the poloidal magnetic field (
$B_{P}$
is the poloidal magnetic field ( $B_{P}\ll B_{T}$
), we find that the poloidal
$B_{P}\ll B_{T}$
), we find that the poloidal $\boldsymbol{E}\times \boldsymbol{B}$
drift dominates the parallel transport even for
$\boldsymbol{E}\times \boldsymbol{B}$
drift dominates the parallel transport even for $V_{||}$
comparable to
$V_{||}$
comparable to $C_{s}$
if
$C_{s}$
if
 $$\begin{eqnarray}\displaystyle \unicode[STIX]{x1D6E5}_{\text{SOL}}\tilde{{<}}\unicode[STIX]{x1D70C}_{i,P}, & & \displaystyle\end{eqnarray}$$
where $\unicode[STIX]{x1D70C}_{i,P}$
is the ion Larmor radius calculated with the poloidal magnetic field (Tendler & Rozhansky Reference Tendler and Rozhansky1992). For such a regime, the plasma pressure can vary strongly along the magnetic field (Krasheninnikov, Sigmar & Yushmanov Reference Krasheninnikov, Sigmar and Yushmanov1995) and the parallel and cross-field flows become strongly coupled.
$\unicode[STIX]{x1D70C}_{i,P}$
is the ion Larmor radius calculated with the poloidal magnetic field (Tendler & Rozhansky Reference Tendler and Rozhansky1992). For such a regime, the plasma pressure can vary strongly along the magnetic field (Krasheninnikov, Sigmar & Yushmanov Reference Krasheninnikov, Sigmar and Yushmanov1995) and the parallel and cross-field flows become strongly coupled.
The importance of the drift effects on the divertor and SOL plasma parameters has been shown in experiments and 2-D simulations since long ago (see e.g. Hill et al. Reference Hill, Rensink, Futch, Buchenauer, Petrie, Mahdavi and Matthews1990; Hutchinson et al. Reference Hutchinson, LaBombard, Goetz, Lipschultz, McCracken, Snipes and Terry1995; Asakura et al. Reference Asakura, Hosogane, Tsuji-Iio, Itami, Shimizu and Shimada1996; Chankin et al. Reference Chankin1996; Rognlien, Porter & Ryutov Reference Rognlien, Porter and Ryutov1999; Boedo et al. Reference Boedo, Schaffer, Maingi and Lasnier2000; Schaffer et al. Reference Schaffer2001; Wenzel et al. Reference Wenzel, Coster, Kallenbach, Kastelewicz, Laux, Maier and Schneider2001; Groth et al. Reference Groth2011; Rozhansky et al. Reference Rozhansky, Molchanov, Veselova, Voskoboynikov, Kirk and Coster2013; Aho-Mantila et al. Reference Aho-Mantila, Bonnin, Coster, Lowry, Wischmeier, Brezinsek and Federici2015, Reference Aho-Mantila2017; Reimold et al. Reference Reimold, Wischmeier, Potzel, Guimarais, Reiter, Bernert, Dunne and Lunt2017).
However, in experiments, the impact of the drifts on the divertor plasma parameters can be masked by other factors. For example, the ballooning nature of anomalous transport in the edge plasma (enhanced at the outer side of the torus, which, for the case of a single-null divertor configuration, causes uneven split of the power coming to the outer and inner divertors), location of neutral gas (both hydrogen and impurity) puffing and pumping, as well as geometrical detail of the first wall components can result in additional poloidal asymmetries of the edge plasma parameters. Therefore, the ‘cleanest’ experiments revealing drift effects should be those done with reversing the toroidal magnetic field in double-null divertor configurations with up–down symmetric geometry. An example of experimental data obtained in such experiments is shown in figure 12, where one can see clearly that the drift effects cause a nearly symmetric flip of the ion saturation current on the upper and lower divertor targets of the outer divertors when the direction of the toroidal magnetic field is reversed. Another example of such a ‘clean’ experiment can be found in Aho-Mantila et al. (Reference Aho-Mantila, Wischmeier, Müller, Potzel, Coster, Bonnin and Conway2012).
Distribution of the ion saturation current on the upper and lower outer divertor targets of the EAST tokamak, in two similar double-null discharges with the normal and reversed toroidal magnetic field, before and after D $_{2}$
injection at the outer strike points. Taken from Wang et al. (Reference Wang, Guo, Wang, Luo, Wu, Wu, Gao, Wang and Li2011).
$_{2}$
injection at the outer strike points. Taken from Wang et al. (Reference Wang, Guo, Wang, Luo, Wu, Wu, Gao, Wang and Li2011).

2.7 Cross-field transport in the tokamak SOL and divertor plasmas
Cross-field plasma transport in the SOL and divertor affects the width of the layer where the energy flux coming from the core is transferred to the divertor targets. Therefore, it strongly affects virtually all processes in the divertor volume, including divertor plasma detachment. Due to the complexity of cross-field plasma transport that has both anomalous and classical features affected by the magnetic geometry and by changes from the L- to H-modes and from the attached to detached regimes, we have no predictive model describing cross-field plasma transport yet. Nonetheless, in some cases we can identify the main contributors to the cross-field plasma transport.
It is widely accepted that in L-mode the anomalous plasma transport prevails (see e.g. Zweben et al. (Reference Zweben, Boedo, Grulke, Hidalgo, LaBombard, Maqueda, Scarin and Terry2007) and the references therein). Moreover, studies of double-null magnetic configurations demonstrate much stronger plasma transport on the outer side of the torus in comparison to the inner one (Counsell et al.
Reference Counsell, Kirk, Ahn, Tabasso and Yang2002; LaBombard et al.
Reference LaBombard2004). This suggests that ballooning effects determine the SOL plasma turbulence. The fluctuations of the plasma parameters close to the separatrix observed in L-mode are large ( ${\sim}$
100 %) and the turbulence has an intermittent character, which is usually attributed to the so-called ‘blobby’ nature of the turbulence. Blobs are coherent filamentary structures extended along the magnetic field, which propagate ballistically in the radial direction with a high speed
${\sim}$
100 %) and the turbulence has an intermittent character, which is usually attributed to the so-called ‘blobby’ nature of the turbulence. Blobs are coherent filamentary structures extended along the magnetic field, which propagate ballistically in the radial direction with a high speed ${\sim}1\,\text{km}~\text{s}^{-1}$
and contain a high density plasma (for details see Krasheninnikov, D’Ippolito & Myra (Reference Krasheninnikov, D’Ippolito and Myra2008), D’Ippolito, Myra & Zweben (Reference D’Ippolito, Myra and Zweben2011)). Based on experimental data, theoretical models and numerical simulations, it is believed that blobs are formed in the core near the separatrix, although the mechanism(-s) of their formation is still under debate (see e.g. D’Ippolito et al.
Reference D’Ippolito, Myra and Zweben2011). The dynamics of a poloidal slice of the blob observed in NSTX with the gas puffing imaging (GPI) diagnostic is shown in figure 13. Theoretical models and computer simulations largely support the ballooning nature and the intermittent character of the L-mode SOL plasma turbulence (see e.g. Krasheninnikov et al. (Reference Krasheninnikov, D’Ippolito and Myra2008) and the references therein).
${\sim}1\,\text{km}~\text{s}^{-1}$
and contain a high density plasma (for details see Krasheninnikov, D’Ippolito & Myra (Reference Krasheninnikov, D’Ippolito and Myra2008), D’Ippolito, Myra & Zweben (Reference D’Ippolito, Myra and Zweben2011)). Based on experimental data, theoretical models and numerical simulations, it is believed that blobs are formed in the core near the separatrix, although the mechanism(-s) of their formation is still under debate (see e.g. D’Ippolito et al.
Reference D’Ippolito, Myra and Zweben2011). The dynamics of a poloidal slice of the blob observed in NSTX with the gas puffing imaging (GPI) diagnostic is shown in figure 13. Theoretical models and computer simulations largely support the ballooning nature and the intermittent character of the L-mode SOL plasma turbulence (see e.g. Krasheninnikov et al. (Reference Krasheninnikov, D’Ippolito and Myra2008) and the references therein).
Dynamics of blobs shown on the sequence of nine consecutive fast camera image frames, from 428.071 ms (top left) to 428.147 ms (bottom right), obtained with the D $_{\unicode[STIX]{x1D6FC}}$
filtered GPI diagnostic at NSTX. The separatrix is shown with the solid yellow line and the antenna limiter shadow is indicated with the dashed blue line. Taken from Maqueda & Stotler (Reference Maqueda and Stotler2010).
$_{\unicode[STIX]{x1D6FC}}$
filtered GPI diagnostic at NSTX. The separatrix is shown with the solid yellow line and the antenna limiter shadow is indicated with the dashed blue line. Taken from Maqueda & Stotler (Reference Maqueda and Stotler2010).

In H-mode the situation is complicated by the presence of ELMs – the repetitive bursts driven by the peeling–ballooning instability (see e.g. Connor, Hastie & Wilson Reference Connor, Hastie and Wilson1998) and resulting in expulsion of the hot H-mode pedestal plasma into the SOL and further down to the divertor volume. In the double-null divertor configuration most of this plasma goes into the outer divertor (Counsell et al. Reference Counsell, Kirk, Ahn, Tabasso and Yang2002; Petrie et al. Reference Petrie, Watkins, Lao and Snyder2003). While relatively small ELMs can be dissipated in detached divertor plasmas by the impurity radiation (Pigarov et al. Reference Pigarov, Krasheninnikov, Hollmann and Rognlien2016), large ELMs, carrying a large amount of energy, burn through the detached plasma and deliver unacceptably high heat flux to the divertor targets (e.g. Coenen et al. Reference Coenen2015). Therefore, different techniques that can help to avoid ELMs or drastically reduce their amplitudes are currently under intense study. In between ELMs, the SOL plasma is much more quiescent than that in L-mode. In particular, it appears that recent experimental data on the SOL width in between ELMs in the attached H-mode regime (Eich et al. Reference Eich2013) can be well fitted by the model completely ignoring the plasma turbulence and only accounting for the weakly collisional ion dynamics in the SOL, predicting the SOL width of the order of the ion banana width (Goldston Reference Goldston2012). However, some turbulence-based theoretical models (e.g. Halpern et al. Reference Halpern2013; Myra, D’Ippolito & Russel Reference Myra, D’Ippolito and Russel2015) and the results of numerical simulations (e.g. Halpern & Ricci Reference Halpern and Ricci2017; Chang et al. Reference Chang, Ku, Maingi, Loarte, Parail, Romanelli and Köchl2016) do also show reasonable agreement with the experimental database. Note, however, that applicability of the fluid models based on the Braginskii-like equations, often used in both analytic and numerical turbulence studies, may be questionable in the weakly collisional, H-mode SOL plasma. Indeed, the neoclassical effects could be important and the Landau resonances can change significantly both the linear growth rates of the unstable modes (see e.g. Angus & Krasheninnikov Reference Angus and Krasheninnikov2012) and, probably, their nonlinear evolution. Another indication of a possible impact of turbulence on the SOL plasma transport is the presence of the blobs observed in H-mode in between ELMs (e.g. Zweben et al. Reference Zweben2016). Finally, the experimental data show that the SOL width is doubled in H-mode in the detached plasma in comparison with the attached one (Sun et al. Reference Sun, Wolfrum, Eich, Kurzan, Potzel and Stroth2015), which may also indicate that the physical picture based on weakly collisional ion dynamics is at least incomplete. In some papers, somewhat similar expansion of the SOL width in detached plasma is attributed to the changes in the blob dynamics (e.g. Carralero et al. Reference Carralero2014).
One of the general issues related to the SOL turbulence (in both the L- and H-modes) is, whether (i) the SOL turbulence is driven locally, as was assumed in the early assessments of the SOL width (e.g. Connor et al. Reference Connor, Counsell, Erents, Fielding, LaBombard and Morel1999), or (ii) the plasma parameter fluctuations observed in the SOL are just a consequence of turbulent phenomena inside the separatrix, which somehow propagate into the SOL (recall the blobs), so that the SOL turbulence is just a ‘fossil turbulence’, or (iii) the SOL is subject to ‘global’ modes developing in some regions both inside and outside the separatrix. Knowing the correct answer could guide further development of the theoretical models for the SOL width and give a hint for the control knobs allowing to change it. Today, it is difficult to draw any definite conclusion (see e.g. Myra et al. Reference Myra, D’Ippolito and Russel2015).
So far, we were discussing the SOL turbulence, whereas the divertor turbulence can also play an important role (e.g. in spreading the heat into the private flux region (PFR)). It can be particularly important for some advanced divertor designs, envisioned for future tokamak reactors, which have long divertor legs and effective divertor volume enlarged by specific magnetic geometry (see e.g. Valanju, Kotschenreuther & Mahajan Reference Valanju, Kotschenreuther and Mahajan2010; LaBombard et al. Reference LaBombard2015). Unfortunately, the experimental database on the divertor turbulence is very limited and much more should be done to address the issues of the role and the impact of the divertor turbulence in advanced divertors. Present theoretical and numerical studies show that the turbulent processes in the near SOL and the divertor volume can be disentangled by the strong magnetic shear near the X-points (Farina, Pozzoli & Ryutov Reference Farina, Pozzoli and Ryutov1993; Umansky, Rognlien & Xu Reference Umansky, Rognlien and Xu2005). As a result, only perturbations with large poloidal wavelengths are not affected by the X-point magnetic shear. Experimental data on blob propagation largely confirm these theoretical conclusions (Maqueda & Stotler Reference Maqueda and Stotler2010; Grulke et al. Reference Grulke, Terry, Cziegler, LaBombard and Garcia2014). Meanwhile, theoretical analysis suggests that apart from the ‘standard’ plasma instabilities (e.g. resistive ballooning, resistive drift wave, etc.), the divertor plasma can feature instabilities related to the contact of the plasma with the material surfaces, where the sheath properties can be responsible for the destabilizing effects (see e.g. Berk et al. Reference Berk, Cohen, Ryutov, Tsidulko and Xu1993; Ryutov & Cohen Reference Ryutov and Cohen2004). In addition, the plasma parameters in the detached regime can open a window for the instabilities that would have been stabilized otherwise. For example, Krasheninnikov & Smolyakov (Reference Krasheninnikov and Smolyakov2016) have shown that the current–convective instability (see e.g. Kadomtsev Reference Kadomtsev1961) can be important for cross-field plasma transport in the detached divertor regimes.
Overall, it is clear that at present our understanding of the SOL and divertor plasma turbulence, in particular in the detached regime, is insufficient. This is why in the 2-D edge plasma transport simulations the ad hoc cross-field transport models (e.g. diffusive approximation with some, often constant, diffusivities) are widely used for both the analysis of the available experimental data and the projections of the edge plasma performance in the future devices.
2.8 Processes related to plasma–material interactions
In the course of plasma–material interactions, the materials of the PFCs become strongly modified due to the processes of erosion/re-deposition of the PFC material, implantation and desorption of the hydrogenic species, helium (which is inherent in the burning fusion plasmas) and impurities deliberately injected into the plasma for different purposes (see e.g. Federici et al. Reference Federici, Skinner, Brooks, Coad, Grisolia, Haasz, Hassanein, Philipps, Pitcher and Roth2001). All of these effects are very important for both the reactor performance and the lifetime of the PFCs. However, here we restrict our short discussion to the processes related to plasma recycling that have direct impact on the detachment physics. More details of different aspects of the plasma–material interactions can be found in ITER Physics Basis (1999), Federici et al. (Reference Federici, Skinner, Brooks, Coad, Grisolia, Haasz, Hassanein, Philipps, Pitcher and Roth2001).
Plasma recycling on the material surfaces includes reflection, absorption, transport inside the wall material and desorption of the hydrogenic species. If we follow the history of the hydrogenic and helium ions impinging on a material surface, we find that some of them are reflected back to the plasma, whereas some others penetrate into the material lattice. The latter ones can diffuse through the lattice, can be trapped by lattice imperfections for rather long time, can be de-trapped due to thermal effects or due to interactions with the particles impinging onto the surface and, finally, can be desorbed from the surface. All these processes depend on the energies of the impinging particles and their fluence, as well as on the PFC material and its temperature. For many cases, the amount of hydrogen trapped in the wall significantly exceeds that in the plasma volume (e.g. see Roth et al.
Reference Roth2008). Nonetheless, for the quasi-stationary plasma parameters and virtually all the materials used for the PFCs in fusion devices, the plasma flux to the PFCs becomes very close to the flux of the particles returning from the surface back into the plasma. Apparently, the reason for this is that the typical implantation depth of the plasma particles impinging on the surface is small, ${\sim}\mathit{few}$
nm. In this case, a thicker,
${\sim}\mathit{few}$
nm. In this case, a thicker, ${\sim}$
10 s of nm, layer beneath the surface becomes supersaturated with hydrogen and/or helium, which effectively blocks further penetration of the plasma species and promotes desorption of them back into the plasma volume. However, such a quasi-equilibrium between the absorption and desorption processes may not hold for transient events such as ELMs. It seems that for large amplitude ELMs, virtually all the hydrogen lost from the pedestal becomes stored in the wall and it is actually the dynamics of wall outgassing that controls re-healing of the pedestal density and, therefore, can affect the period of the ELM cycle (Krasheninnikov, Pigarov & Lee Reference Krasheninnikov, Pigarov and Lee2014; Brezinsek et al.
Reference Brezinsek2016; Wiesen et al.
Reference Wiesen, Brezinsek, Harting, Dittmar, de la Luna, Matveev and Schmid2016). However, more work is needed to make definite conclusions on the physics of the plasma–wall interactions during large ELMs, on the impact of the wall material and on the hydrogen outgassing processes after the ELM bursts. Another reason, for which the quasi-equilibrium between the absorption and desorption processes breaks, is the increase of the wall temperature in the long pulse discharges, which stimulates the desorption process and results in an influx of a large amount of hydrogen into the discharge and, finally, leads to a disruption (Nakano et al.
Reference Nakano, Asakura, Takenaga, Kubo, Miura, Shimizu, Konoshima, Masaki and Higashijima2006).
${\sim}$
10 s of nm, layer beneath the surface becomes supersaturated with hydrogen and/or helium, which effectively blocks further penetration of the plasma species and promotes desorption of them back into the plasma volume. However, such a quasi-equilibrium between the absorption and desorption processes may not hold for transient events such as ELMs. It seems that for large amplitude ELMs, virtually all the hydrogen lost from the pedestal becomes stored in the wall and it is actually the dynamics of wall outgassing that controls re-healing of the pedestal density and, therefore, can affect the period of the ELM cycle (Krasheninnikov, Pigarov & Lee Reference Krasheninnikov, Pigarov and Lee2014; Brezinsek et al.
Reference Brezinsek2016; Wiesen et al.
Reference Wiesen, Brezinsek, Harting, Dittmar, de la Luna, Matveev and Schmid2016). However, more work is needed to make definite conclusions on the physics of the plasma–wall interactions during large ELMs, on the impact of the wall material and on the hydrogen outgassing processes after the ELM bursts. Another reason, for which the quasi-equilibrium between the absorption and desorption processes breaks, is the increase of the wall temperature in the long pulse discharges, which stimulates the desorption process and results in an influx of a large amount of hydrogen into the discharge and, finally, leads to a disruption (Nakano et al.
Reference Nakano, Asakura, Takenaga, Kubo, Miura, Shimizu, Konoshima, Masaki and Higashijima2006).
The formation of such a supersaturated layer is often accompanied (depending on the wall material) by the formation of nano-bubbles (Miyamoto et al. Reference Miyamoto, Nishijima, Baldwin, Doerner, Ueda, Yasunaga, Yoshida and Ono2011), figures 14 and 15, and by strong modification of the surface morphology (e.g. Takamura et al. Reference Takamura, Ohno, Nishijima and Kajita2006; Kajita et al. Reference Kajita, Sakaguchi, Ohno, Yoshida and Saeki2009; Zibrov et al. Reference Zibrov, Balden, Morgan and Mayer2017) resulting in formation of the blisters (figure 15, dust, ‘fuzz’, pinholes, protrusions, etc. (see e.g. figure 16).
Nano-bubbles in a tungsten sample irradiated by helium plasma. Taken from Miyamoto et al. (Reference Miyamoto, Nishijima, Baldwin, Doerner, Ueda, Yasunaga, Yoshida and Ono2011).

Blister-like structure on a tungsten sample irradiated at 380 K by deuterium plasma. Taken from Zibrov et al. (Reference Zibrov, Balden, Morgan and Mayer2017).

Modification of the tungsten surface morphology for different sample temperature and energy of the impinging helium ions. Taken from Kajita et al. (Reference Kajita, Sakaguchi, Ohno, Yoshida and Saeki2009).

For theoretical/computational assessment of the dynamics of the helium and hydrogen atoms in the wall material different approaches, ranging from molecular dynamic simulations to crude models of global uptake of the plasma species by the wall material, are used (see e.g. Federici et al. Reference Federici, Skinner, Brooks, Coad, Grisolia, Haasz, Hassanein, Philipps, Pitcher and Roth2001; Pigarov et al. Reference Pigarov, Krstic, Krasheninnikov, Doerner and Rognlien2012; Wirth et al. Reference Wirth, Hammond, Krasheninnikov and Maroudas2015, and the references therein). One of the most popular approaches, which is widely used for interpretation of the experimental data on temperature desorption spectra, is based on reaction–diffusion models. These models employ a continuous approximation and describe diffusive transport of the mobile species and their reactions with the immobile ones and with available traps. Although these equations look rather ‘simple’, in practice for the case of a large number of different traps they correspond (Krasheninnikov & Marenkov Reference Krasheninnikov and Marenkov2014) to a family of complex fractional (Klafter & Sokolov Reference Klafter and Sokolov2011) and nonlinear diffusion equations which have a complex short term time response to the impinging plasma flux and unusual long-term outgassing time dependence, which resembles that observed in experiments (see Pégourié et al. Reference Pégourié2013; Philipps et al. Reference Philipps, Loarer, Esse, Vartanian, Kruezi, Brezinsek and Matthews2013).
Overall, our understanding of the wall processes is still very poor. Therefore, in most cases plasma recycling on the PFC material is described with some albedo, which is determined from fitting the experimental data.
3 Two-dimensional modelling of edge plasma and divertor detachment
First publications on development of the 2-D transport modelling codes for the divertor plasma, employing the assumption of the toroidal symmetry, appeared in the beginning of 1980s (e.g. Petravic et al. Reference Petravic, Post, Heifez and Schmidt1982). The 2-D models offer a reasonable compromise between the accuracy and computational efficiency of the model. They catch the trends of the plasma evolution by variation of different parameters, as seen in experiment, and are indispensable in validation of the simple theoretical models describing plasma detachment. They serve as numerical experiment that can be analysed to the very detail, stimulating development of theoretical approaches. The activities in 2-D modelling of the divertor plasma are widespread in the plasma physics community. A number of codes suitable for this purpose are available, including EDGE2D-Eirene (Taroni et al. Reference Taroni, Corrigan, Radford, Simonini, Spence and Weber1992; Simonini et al. Reference Simonini, Corrigan, Radford, Spence and Taroni1994), UEDGE (Rognlien et al. Reference Rognlien, Milovich, Rensink and Porter1992), SONIC (Shimizu et al. Reference Shimizu, Takizuka, Ohya, Inai, Nakano, Takayama, Kawashima and Hoshino2009) and the SOLPS code family (Reiter et al. Reference Reiter, Kever, Wolf, Baelmans, Behrisch and Schneider1991; Schneider et al. Reference Schneider, Reiter, Zehrfeld, Braams, Baelmans, Geiger, Kastelewicz, Neuhauser and Wunderlich1992; Kukushkin et al. Reference Kukushkin, Pacher, Kotov, Pacher and Reiter2011; Wiesen et al. Reference Wiesen2015).
3.1 Equations for plasma transport in the 2-D codes
Usually, the Coulomb collision mean free paths for both the ions and electrons in magnetized SOL and divertor plasmas are shorter than the characteristic scale lengths of variation of the plasma parameters along the magnetic field, whereas the SOL width is significantly larger than the ion Larmor radius. Therefore, one can use the fluid approximation for the description of edge plasma transport (although some subtleties remain, see further discussions).
The most complete set of fluid equations for fully ionized, multi-component, magnetized plasma can be found in Zhdanov (Reference Zhdanov2002). It was derived from the kinetic equations for the plasma components by using the 21-moment Grad approximation. The physics in the Zhdanov equations (or some adopted version of these equations) can describe not only relatively slow plasma transport phenomena, but also fast turbulent processes in a collisional plasma, which apparently control the anomalous cross-field plasma transport. However, even with modern computers it is impossible to simulate a multi-component edge plasma turbulence coupled to the neutral dynamics and atomic physics on the time scales relevant to the edge plasma transport phenomena. In addition, the SOL and divertor plasma is subject to violent turbulent events such as ELMs, which are originated in the H-mode pedestal region inside the separatrix, where the applicability of the Zhdanov equations is questionable. Therefore, in all the 2-D edge plasma transport codes, the anomalous cross-field transport is introduced with simplified models and the plasma and neutral gas parameter distribution is assumed toroidally symmetric. In most cases, the edge plasma transport models adopt diffusive/convective description of anomalous cross-field transport of the density, parallel momentum and energy of the plasma species, retaining, however, the contributions of the classical cross-field drifts and the classical terms describing transport of the density, parallel momentum and energy of the plasma species along the magnetic field. In addition, these models contain the source terms related to ionization and recombination of the edge plasma/neutral species and the radiation loss. It is assumed that the rates of these processes, calculated assuming the Maxwellian distribution functions, are lower than the corresponding Coulomb collision frequencies, so one can neglect the impact of the ionization, recombination and radiation processes on the parallel classical transport coefficients for the plasma species.
Although the fluid equations are widely used for the modelling of edge plasma transport, there are still some issues regarding their validity. In particular, the derivation of the classical fluid transport coefficients describing parallel plasma transport assumes that the ratio of the Coulomb mean free path, $\unicode[STIX]{x1D706}_{C}$
, to the scale length of the plasma parameter variation along the magnetic field lines,
$\unicode[STIX]{x1D706}_{C}$
, to the scale length of the plasma parameter variation along the magnetic field lines, $L_{||}$
, is small. Unfortunately, for a decent validity of the fluid approximation for such a high-order moment as the heat flux, the
$L_{||}$
, is small. Unfortunately, for a decent validity of the fluid approximation for such a high-order moment as the heat flux, the $\unicode[STIX]{x1D706}_{C}/L_{||}$
ratio must be pretty small,
$\unicode[STIX]{x1D706}_{C}/L_{||}$
ratio must be pretty small, $\unicode[STIX]{x1D706}_{C}/L_{||}\tilde{{<}}10^{-2}$
(see e.g. Gurevich & Istomin Reference Gurevich and Istomin1979; Gray & Kilkenny Reference Gray and Kilkenny1980). This is because the major contribution to the heat flux is made by the suprathermal particles having a long Coulomb mean free path that is proportional to the particle energy squared. For
$\unicode[STIX]{x1D706}_{C}/L_{||}\tilde{{<}}10^{-2}$
(see e.g. Gurevich & Istomin Reference Gurevich and Istomin1979; Gray & Kilkenny Reference Gray and Kilkenny1980). This is because the major contribution to the heat flux is made by the suprathermal particles having a long Coulomb mean free path that is proportional to the particle energy squared. For $\unicode[STIX]{x1D706}_{C}/L_{||}>10^{-2}$
, which is a typical situation in the tokamak edge plasmas, the standard, local fluid closure for the solution of the corresponding kinetic equations, yielding the heat flux proportional to the temperature gradient, becomes invalid and non-local kinetic features must be taken into account. These non-local effects cause a reduction of the heat flux – in comparison with the classical predictions of Spitzer & Harm (Reference Spitzer and Harm1953) – in the high temperature region, where the classical expression overestimates the impact of the suprathermal electrons. Correspondingly, the heat flux in the low temperature region, where the local theory does not allow for the impact of the suprathermal particles arriving from the hot plasma, increases.
$\unicode[STIX]{x1D706}_{C}/L_{||}>10^{-2}$
, which is a typical situation in the tokamak edge plasmas, the standard, local fluid closure for the solution of the corresponding kinetic equations, yielding the heat flux proportional to the temperature gradient, becomes invalid and non-local kinetic features must be taken into account. These non-local effects cause a reduction of the heat flux – in comparison with the classical predictions of Spitzer & Harm (Reference Spitzer and Harm1953) – in the high temperature region, where the classical expression overestimates the impact of the suprathermal electrons. Correspondingly, the heat flux in the low temperature region, where the local theory does not allow for the impact of the suprathermal particles arriving from the hot plasma, increases.
Over the years, quite a few simplified models taking into account the non-local features of heat transport were suggested (e.g. Luciani, Mora & Virmont Reference Luciani, Mora and Virmont1983; Albritton et al. Reference Albritton, Williams, Bernstein and Swartz1986; Krasheninnikov Reference Krasheninnikov1993; Kukushkin & Runov Reference Kukushkin and Runov1994; Manheimer, Colombant & Goncharov Reference Manheimer, Colombant and Goncharov2008). However, in practice only the simple, so-called ‘flux-limited’ expression for the parallel heat flux, which can be traced back to Krall & Trivelpiece (Reference Krall and Trivelpiece1973), is routinely used in the 2-D edge plasma transport codes:
 $$\begin{eqnarray}\displaystyle q=\frac{q_{fc}q_{fs}}{|q_{fc}|+q_{fs}}. & & \displaystyle\end{eqnarray}$$
Here $q_{fc}$
is the expression for the heat flux following from the fluid closure and
$q_{fc}$
is the expression for the heat flux following from the fluid closure and $q_{fs}=f_{\text{lim}}V_{T}nT$
describes the ‘free streaming’ heat flux, where
$q_{fs}=f_{\text{lim}}V_{T}nT$
describes the ‘free streaming’ heat flux, where $V_{T}$
,
$V_{T}$
, $n$
and
$n$
and $T$
are the thermal velocity, density and temperature of the corresponding plasma species and
$T$
are the thermal velocity, density and temperature of the corresponding plasma species and $f_{\text{lim}}\sim 0.05{-}0.2$
is a so-called ‘flux-limit factor’ determined from matching (3.1) and the results of the kinetic simulations. Although the expression (3.1) describes reasonably the reduction of the heat flux in the high temperature region for the case where
$f_{\text{lim}}\sim 0.05{-}0.2$
is a so-called ‘flux-limit factor’ determined from matching (3.1) and the results of the kinetic simulations. Although the expression (3.1) describes reasonably the reduction of the heat flux in the high temperature region for the case where $\unicode[STIX]{x1D706}_{C}/L_{||}>10^{-2}$
, it fails to allow for the increase of the heat flux above
$\unicode[STIX]{x1D706}_{C}/L_{||}>10^{-2}$
, it fails to allow for the increase of the heat flux above $q_{fc}$
, caused by the superthermal particles coming from the hot plasma, in the low temperature region.
$q_{fc}$
, caused by the superthermal particles coming from the hot plasma, in the low temperature region.
In principle, kinetic models dealing with the distribution functions rather than with their moments, such as the density, temperature and momentum, could help. However, the need to describe both the velocity space and the Coulomb collision terms makes kinetic codes complex and computationally very time consuming. As of today, in most cases, the kinetic modelling studies of the SOL and divertor plasma have been performed in 1-D slab geometry and with some crude description of the neutrals (see e.g. Batishchev et al. Reference Batishchev1997; Tskhakaya et al. Reference Tskhakaya, Jachmich, Eich and Fundamenski2011; Chankin & Coster Reference Chankin and Coster2015, and the references therein). The results of these 1D2V (one dimension in the coordinate space and two in the velocity space) kinetic modelling of a high-recycling regime demonstrate clearly formation of the enhanced and depleted tails of the electron distribution function in, correspondingly, the low temperature divertor and high temperature SOL plasma (see e.g. figure 17). These features, in particular, modify electron heat conduction (discussed above), affect interpretation of the results of the electron temperature measurements with probes, which is based on the analysis of the tail of the electron distribution function, and can modify the rate constants of the atomic processes (e.g. ionization and excitation), in particular, in the low temperature region. Unfortunately, the impact of the kinetic effects on the rate constants of the atomic processes is neglected in all current 2-D edge plasma transport codes.
Electron distribution function over parallel energy normalized by the effective local temperature near divertor target and mid-plane found from 1D2V kinetic simulations. Taken from Batishchev et al. (Reference Batishchev1997).

The complexity of full kinetic modelling in 2D2V case has called for some reduced kinetic models for practical use. In Kukushkin & Runov (Reference Kukushkin and Runov1994), a combination of a simplified kinetic model employing the Bhatnagar–Gross–Krook approximation (Bhatnagar, Gross & Krook Reference Bhatnagar, Gross and Krook1954) for the plasma in a set of 1-D problems along the rows of the 2-D grid with the usual 2-D transport model was tried. In this approach, the parallel heat conductivities were evaluated in the kinetic part and used in the fluid one, and the fluid parameters (density, temperature, flow velocity) were used to construct the initial plasma background for the kinetic part. Such a procedure was run in iterations along with the time stepping of the fluid code and the requirement that the corresponding moments of the distribution function be close to the background plasma parameters was included in the convergence criteria for the combined code. However, this approach finally appeared to be not quite suitable for massive calculations if applied to multi-species problems in realistic geometry.
Overall, we see that the set of the equations and the boundary conditions used in the present 2-D edge plasma transport codes differ significantly from those in Zhdanov (Reference Zhdanov2002).
Apart from the kinetic corrections, the fluid equations used in the 2-D transport codes for the edge plasma have an additional limitation related to the plasma parameter fluctuations caused by the edge turbulence. Indeed, in the fluid approximation, all the edge plasma properties are described with three parameters only for each species: the density $n$
, the temperature
$n$
, the temperature $T$
and the velocity
$T$
and the velocity $\boldsymbol{V}$
, which, however, enter the transport equations in a very nonlinear manner. Replacing in these equations the complex turbulent processes with the diffusive–convective cross-field transport models, we assume that we are dealing with the continuity, momentum and energy equations for each species averaged over the characteristic time of the plasma fluctuations. However, in fact, we are not averaging these equations. Instead, we implicitly assume that all the averaged terms in these equations,
$\boldsymbol{V}$
, which, however, enter the transport equations in a very nonlinear manner. Replacing in these equations the complex turbulent processes with the diffusive–convective cross-field transport models, we assume that we are dealing with the continuity, momentum and energy equations for each species averaged over the characteristic time of the plasma fluctuations. However, in fact, we are not averaging these equations. Instead, we implicitly assume that all the averaged terms in these equations, $\langle F(n,T,\boldsymbol{V})\rangle$
, are equal to
$\langle F(n,T,\boldsymbol{V})\rangle$
, are equal to $F(\langle n\rangle ,\langle T\rangle ,\langle \boldsymbol{V}\rangle )$
, where
$F(\langle n\rangle ,\langle T\rangle ,\langle \boldsymbol{V}\rangle )$
, where $\langle ...\rangle$
means averaging over the turbulent fluctuations. However, this approximation is only valid for the case where the plasma parameter fluctuations are small and this often does not hold, in particular, in the presence of strong blobby transport or ELMs (Krasheninnikov et al.
Reference Krasheninnikov, Pigarov, Soboleva and Rudakov2009). The diffusive–convective model becomes inadequate in this case since the cross-field transport is largely realized by fast radial advection of discrete filamentary plasma structures extended along the magnetic field lines. Instead, one can use the so-called ‘macro-blob’ approach, where coherent radial advection of 2-D plasma structures, imitating 3-D dynamics of the plasma filaments, is implemented into the plasma transport equations (Pigarov, Krasheninnikov & Rognlien Reference Pigarov, Krasheninnikov and Rognlien2011).
$\langle ...\rangle$
means averaging over the turbulent fluctuations. However, this approximation is only valid for the case where the plasma parameter fluctuations are small and this often does not hold, in particular, in the presence of strong blobby transport or ELMs (Krasheninnikov et al.
Reference Krasheninnikov, Pigarov, Soboleva and Rudakov2009). The diffusive–convective model becomes inadequate in this case since the cross-field transport is largely realized by fast radial advection of discrete filamentary plasma structures extended along the magnetic field lines. Instead, one can use the so-called ‘macro-blob’ approach, where coherent radial advection of 2-D plasma structures, imitating 3-D dynamics of the plasma filaments, is implemented into the plasma transport equations (Pigarov, Krasheninnikov & Rognlien Reference Pigarov, Krasheninnikov and Rognlien2011).
Discretization of the edge plasma transport equations is usually done with the finite volume method on a quasi-orthogonal grid aligned with the magnetic surfaces, figure 18. This provides natural separation of the parallel and cross-field transport, which is important given the strong transport anisotropy inherent for the edge plasma. However, the targets are generally not orthogonal to the flux surfaces, so the grid becomes inevitably distorted in the divertor. This leads to effective admixing of the cross-field, weaker transport to the parallel one but not vice versa – thanks to the grid alignment with the flux surfaces. Inclusion of some part of the core plasma in the computational domain ensures that the grid becomes topologically rectangular, having the same number of rows and columns everywhere and reconnecting the grid cells over the poloidal cuts to ensure the continuity of the PFR and closeness of the flux surfaces in the core, figure 18. This makes coding easier (the real shape of the computational area only appears in the metric coefficients), but at the expense of the accuracy of the wall description. Indeed, in order to keep the effective rectangularity, the grid has to stop at the first flux surface crossing any part of the first wall or baffle, thus leaving a gap between the grid edge and the wall. This looks acceptable concerning plasma interaction with the targets since the parallel energy flux in the SOL is concentrated near the separatrix. However, if a correct description of plasma interaction with the first wall is required, then the grid should be extended towards the wall and the convenient equivalent rectangularity of the grid is lost. This approach is being developed (Bufferand et al. Reference Bufferand, Ciraolo, Isoardi, Chiavassa, Schwander, Serre, Fedorczak, Ghendrih and Tamain2011; Dekeyser et al. Reference Dekeyser, Baelmans, Reiter, Börner and Kotov2011; Klingshirn, Coster & Bonnin Reference Klingshirn, Coster and Bonnin2013) but the codes featuring this refinement are not routinely available yet.
Typical grid used for discretization of the edge plasma transport equations and the topologically equivalent rectangular grid. Arrows indicate correspondence between the fluxes on the grid cuts. The grid transformation can be presented as (a) cutting the grid along the FG line, (b) unfolding it and (c) distorting it to make rectangular, hiding the curvilinearity in the metric coefficients in the equations.

3.2 Neutral transport in 2-D codes
The situation with hydrogenic neutrals playing very important role in the high-recycling regime is different from that with the plasma transport. In the current tokamaks, the neutral hydrogen density is, in most cases, relatively low, so the mean free path with respect to the neutral–neutral collisions appears to be significantly longer than the SOL width. Thus, the conventional fluid closure cannot be applied for hydrogen neutral transport. However, more frequent neutral collisions with the hydrogen ions provide the neutral–ion collision mean free path that for a high divertor plasma density is shorter than the SOL width. This allows a specific fluid description of neutral hydrogen transport based on the neutral–ion collisions (see e.g. Helander et al. Reference Helander, Krasheninnikov and Catto1994). However, the strong variation of the edge plasma density causes a strong variation of the neutral–ion collision mean free path. As a result, the fluid description of neutral hydrogen transport, strictly speaking, can only be applied within a rather limited domain of the edge plasma region. Nonetheless, due to the relative simplicity and convenience in coupling with the plasma, the fluid models of different sophistication for neutral hydrogen are still in use in 2-D edge plasma transport modelling. The simplest of them deal only with the transport of the neutral density, described within the diffusive approximation based on the neutral–ion collisions. The more sophisticated ones comprise the equations for the neutral momentum parallel to the magnetic field (including the neutral–plasma friction incorporated in the parallel momentum balance equations, both for the neutrals and plasma) and the combined ion–neutral temperature equation. Cross-field transport of the neutral density, the combined ion-neutral temperature and the neutral parallel momentum are described in the diffusive approximation based on the neutral–ion collisions. To allow for possible effects of the high neutral density, the neutral transport coefficients include corrections associated with the neutral–neutral collisions (see e.g. Knoll et al. Reference Knoll, McHugh, Krasheninnikov and Sigmar1996). To describe the neutral transport in regions with a relatively low plasma density, where the diffusive approximation starts to fail, the neutral transport coefficients have a ‘flux-limiting’ form similar to that in expression (3.1). The description of neutral transport based on the transmission and escape probability method (see e.g. Mandrekas Reference Mandrekas2004, and the references therein), which, potentially, can go beyond simple diffusion approximation, was also used in the past.
However, today the most popular tool for describing transport of the neutral species (both hydrogenic and impurities) is the Monte Carlo (MC) technique (see e.g. Heifetz et al. Reference Heifetz, Post, Petravic, Weisheit and Bateman1982; Reiter et al. Reference Reiter, Kever, Wolf, Baelmans, Behrisch and Schneider1991; Stotler & Karney Reference Stotler and Karney1994; Reiter, Baelmans & Börner Reference Reiter, Baelmans and Börner2005, and the references therein). The MC is much more time consuming than the fluid approximation for neutral transport (in particular, for the dense divertor plasmas in ITER and future reactors) and creates some problems with coupling the MC neutrals with the fluid plasma. However, it allows taking into account the neutral transport, divertor geometry and atomic physics effects more accurately. The neutral–neutral collisions can also be included in such a scheme by calculating the neutral background parameters and using them for sampling in iterations with the plasma (see e.g. Reiter et al. Reference Reiter, May, Baelmans and Börner1997).
One of the backsides of the MC approach is the numerical noise inevitably appearing in the source terms in the fluid equations and making the process of solving these equations more difficult. Another problem is that the MC algorithm is explicit whereas implicit discretization of the fluid equations is normally used for the fluid equations. The errors in particle balance arising from this discrepancy can be significant, exceeding the fluxes related to pumping and fuelling, which are much less than the recycling particle flux. A special correction procedure (Kukushkin & Pacher Reference Kukushkin and Pacher2002) needs to be introduced in the plasma–neutral coupling scheme in order to resolve these small fluxes – e.g. for analysis of He removal from a tokamak reactor.
Another area that requires a dedicated effort in model development is description of the plasma and neutral interactions with the material surfaces such as the divertor targets and first wall. This general edge plasma issue includes erosion and re-deposition of the wall materials, as well as recycling of the hydrogenic species. Most of the calculations are performed on the assumption of a fully saturated wall where the flux of the hydrogen leaving the surface balances that of the impinging hydrogen particles. However, this equilibrium is dynamic. The release rate of the hydrogen retained in the wall material or adsorbed on its surface depends on both the wall conditions and plasma parameters. If the plasma parameters at some location at the wall change, this leads to modification of both the plasma flux arriving at the surface and the particle flux released from it. Therefore, different areas of the walls and targets can act not as an ideal wall, but as a pump or as a source of the hydrogenic particles. Since the particle content in the wall can be much larger than that in the plasma, the wall can become the dominant player in particle balance. Whereas increasing the gas puff can easily compensate the extra particle absorption on the walls, counteracting the extra particle release requires intense pumping that is not always available. Such uncontrollable particle–wall interaction can lead to termination of the discharge (Nakano et al. Reference Nakano, Asakura, Takenaga, Kubo, Miura, Shimizu, Konoshima, Masaki and Higashijima2006).
There are very few examples of using models describing dynamic particle–wall interactions in 2-D edge plasma simulations (e.g. Kukushkin et al. Reference Kukushkin, Pacher, Coster, Pacher and Reiter2005a ; Coster, Bonnin & Warrier Reference Coster, Bonnin and Warrier2006; Schmid, Reinelt & Krieger Reference Schmid, Reinelt and Krieger2011; Pigarov et al. Reference Pigarov, Krasheninnikov, Rognlien, Lasnier and Unterberg2014; Schmid et al. Reference Schmid, Krieger, Lisgo, Meisl and Brezinsek2015). In Kukushkin et al. (Reference Kukushkin, Pacher, Coster, Pacher and Reiter2005a ) only carbon erosion/re-deposition processes on Be and W surfaces of early design of the ITER first wall were taken into account along with the transport of the carbon neutrals and ions in plasma volume. At wall locations, where deposition of carbon is faster than erosion, the originally metal wall (Be or W) is assumed to be completely covered by carbon. At other locations, it was considered clean. Therefore, the wall state was implicitly included in the model equations through the particle reflection and sputtering coefficients. In several iterations, the solution was obtained, which described the mutually consistent plasma parameters and wall properties. A more elaborated model describing growth of the deposition layers along with the plasma evolution was realized in Coster et al. (Reference Coster, Bonnin and Warrier2006). The code WallDYN, developed in Schmid et al. (Reference Schmid, Reinelt and Krieger2011), employs a rather sophisticated model of wall erosion allowing for the wall composition, but transport of the eroded material is described on a fixed plasma background. Finally, recycling of hydrogenic species on the first wall was only considered in Pigarov et al. (Reference Pigarov, Krasheninnikov, Rognlien, Lasnier and Unterberg2015) within a rather simple model based on fitting the experimental data on the hydrogen puffing/pumping rates.
As we see, a more complete and reliable model of the dynamic wall response, suitable for inclusion into the 2-D transport models, is still to be developed.
3.3 Radiation transport
When the neutral density in the divertor plasma becomes high, the radiation losses cease to be prompt. The radiated photon can be absorbed by a neutral, causing excitation of the latter with subsequent re-emission – that is, radiation transport occurs. This process provides the transport of excitation, thus affecting the rates of the atomic physics processes, including ionization and recombination, in the surrounding plasmas. In Krasheninnikov & Pigarov (Reference Krasheninnikov and Pigarov1987), Marchand & Lauzon (Reference Marchand and Lauzon1992) it was shown that the radiation in hydrogen Lyman lines can be trapped in MARFE (a poloidally localized formation of cold, dense, radiating plasma at the edge of the plasma column in a tokamak, see Lipschultz et al. (Reference Lipschultz, LaBombard, Marmar, Pickrell, Terry, Watterson and Wolfe1984)), as well as in divertor plasma of the current tokamaks, and will definitely be trapped in large, dense divertor plasmas of ITER and future reactors. Later on, these predictions were confirmed by experimental measurements (see e.g. Terry et al. Reference Terry, Lipschultz, Pigarov, Krasheninnikov, LaBombard, Lumma, Ohkawa, Pappas and Umansky1998; Adams et al. Reference Adams, Scott, Lee, Terry, Marmar, Lipschultz, Pigarov and Freidberg2001). Radiation transport is included in the MC neutral transport code EIRENE by treating the photons corresponding to certain spectral lines as special ‘neutral’ particles reacting with the neutral background and modifying accordingly the collisional–radiative model that calculates the rates of the atomic physics processes (Reiter, Wiesen & Born Reference Reiter, Wiesen and Born2002; Kotov et al. Reference Kotov, Reiter, Kukushkin, Pacher, Börner and Wiesen2006). Somewhat similar approach is utilized in the Cretin code (Scott Reference Scott2001), which is a stand-alone code dealing only with radiation transport and the rates of the atomic physics processes.
In the standard divertor regimes, the impurity density is relatively low, so the trapping of impurity radiation is not important. However, such violent events as large ELMs and disruptions can cause a strong ingress of impurity into the divertor plasma making the impurity radiation trapping significant (e.g. Sizyuk & Hassanein Reference Sizyuk and Hassanein2015).
Allowing for the radiation transport effects in the modelling of the overall divertor plasma performance is extremely computationally expensive. Therefore, there are just few of such examples. In Kukushkin et al. (Reference Kukushkin, Pacher, Kotov, Reiter, Coster and Pacher2005b ), Kotov et al. (Reference Kotov, Reiter, Kukushkin, Pacher, Börner and Wiesen2006) the impact of radiation transport was considered for some ITER cases. It was found that even though the runs with and without radiation trapping effects show significant difference in the distribution of the plasma parameters, the results such as the maximum divertor heat load, crucial from the engineering point of view, do not change much. This served as an ‘excuse’ to neglect the radiation trapping effects in already very time consuming simulations of the ITER divertor. However, it was demonstrated in Kotov & Reiter (Reference Kotov and Reiter2012) that radiation trapping plays a crucial role in simulating a stable MARFE-like structure for the JET configuration.
It is conceivable that in future tokamak reactors having larger power and, probably, stronger divertor opacity, the effects of radiation trapping will be more pronounced.
3.4 Input parameters for 2-D modelling
Because of uncertainties in the model, e.g. in the transport coefficients or in the detail of the particle–wall interactions, every serious study involving 2-D modelling and aimed either at physical understanding or at providing the input data for engineering analysis requires a number of runs with variation of the input parameters in order to see the mutual dependencies. Selection of the parameters to be kept constant and those to be varied is not a straightforward task. If the study is focused on physical understanding of the plasma edge, usually in combination with the simple theoretical models like those described in § 2, then the variables expected to play the dominant role should be selected. For example, for the high-recycling and detachment studies such variables can be the power input to the SOL, the radiation power and the total number of particles in the edge plasma (see e.g. Krasheninnikov et al. Reference Krasheninnikov, Kukushkin, Pistunovich and Pozharov1987; Borrass et al. Reference Borrass, Coster, Reiter and Schneider1997a ; Krasheninnikov et al. Reference Krasheninnikov, Rensink, Rognlien, Kukushkin, Goetz, LaBombard, Lipschultz, Terry and Umansky1999). If the engineering analysis is in the focus, then the variables that can be controlled in a tokamak are preferable – such as the power input to the SOL, the neutral pressure in the divertor, the helium production rate and the concentration of seeded impurity for the ITER studies (Pacher et al. Reference Pacher, Kukushkin, Pacher, Kotov, Pitts and Reiter2015). When the calculations are used to fit the transport coefficients in order to reproduce the experimental measurements, then these variables are the parameters best measured in the experiment, such as the density and temperature profiles upstream and at the targets, the bolometer signals, the saturation currents on the Langmuir probes and other diagnostic signals.
The variables selected are not necessarily simple functions of the input parameters of the mathematical model. If one wants to specify the separatrix density upstream or the total number of particles in the presence of pumping and fuelling, he has to introduce a feedback on the fuelling rate that appears in the model as one of the inputs. If the temperature at the core boundary is chosen as the boundary condition instead of the input power flux in order to make the computations more robust (Rozhansky et al. Reference Rozhansky2009), then iterations are needed to fit the input flux. Since the diagnostic signals are the result of the 2-D calculations, iterative adjustment of the model parameters is needed to fit them (Guillemaut et al. Reference Guillemaut2014).
3.5 ‘Convergence’ criteria
The decision on when to stop the run and consider it ready (‘converged’) does also require some consideration. In the case of purely differential equations that really converge to a steady state, the run is considered ready when the residuals of all the equations involved reduce down to a prescribed level – e.g. to the machine precision. However, when the coefficients of the equations reveal statistical noise, and this is inevitable if the Monte Carlo method is employed to calculate them, the reduction of the residuals is limited by the noise level. Moreover, the nonlinear system of equations can have oscillatory solutions that are of a physical nature (e.g. Krasheninnikov et al. Reference Krasheninnikov, Kukushkin, Pistunovich and Pozharov1987; Smirnov et al. Reference Smirnov, Kukushkin, Krasheninnikov, Pigarov and Rognlien2016b ). In this case, the residuals do not decrease below a certain level, even in the absence of the statistical noise.
In order to put the different runs on a common ground, an objective ‘convergence’ criterion was developed in Kukushkin et al. (Reference Kukushkin, Pacher, Baelmans, Coster, Janeschitz, Reiter and Schneider1997) and used in all SOLPS modelling done at ITER since then (see detailed description in Wiesen et al. (Reference Wiesen2015)). It is based on the analysis of the time traces of certain selected quantities, both integral and local, such as the energy and particle content in the edge, the upstream electron density, the peak power loading on the targets and so on (the selection depends on the kind of study). These traces are smoothed by averaging over a certain time interval to reduce the noise, then the evolution time scales are estimated from comparing the smoothed values taken at different time instants. The run is deemed ready if all the time scales are longer than the prescribed values (depending on the problem but the same for all the runs involved in the study). If the oscillating behaviour is revealed, then averaging is done over the oscillation period.
3.6 Problems with 2-D modelling of edge plasma in large devices
In order to study the physical trends, massive calculations are required. Unfortunately, the 2-D modelling calculations are very time consuming, in particular, for large machines. The principal problem here is that when the machine size grows, the scale lengths, on which the particles interact and the macroscopic parameters change, do not. Typical run times range from days to months. A ‘magic number’ was found in ITER modelling: the average calculation time has remained at a level of 2 months per one run for almost 30 years, although the computer speed and the code efficiency increased in this time, speeding the calculations up by 3–4 orders of magnitude (Kukushkin et al. Reference Kukushkin, Pacher, Kotov, Pacher and Reiter2011). Every step in increasing the computer power or code efficiency was ‘compensated’ by further complication of the model taking into account more and more physical effects. At present, the most computationally demanding effect ready for inclusion in the standard run set-up is the influence of the particle drifts in the magnetic field. The comprehensive equations describing the drift effect are derived and coded (Rozhansky et al. Reference Rozhansky2009), but application of such codes for practical work is still at the early stage. Each run with drifts requires heroic efforts, especially for large devices, such as ITER, with high plasma density in the divertor. This makes it difficult to perform massive run series and hence to do meaningful comparisons necessary for the analysis of peculiarities of the divertor operation in the detachment conditions. Speeding the codes up without reducing the physical model is a priority task for the modelling community. The bottleneck here is the MC part of the code, which requires more and more time for running to a certain accuracy as the modelled divertor detachment gets deeper. (Although the multifluid description of the charged plasma components can also be time consuming, it does not slow down with development of detachment). This part takes typically half the computation time or more, even by running in the parallel environment. There are recent developments related to coupling the MC model for the neutrals with the fluid equation system for the plasma ions and electrons (Ghoos et al. Reference Ghoos, Dekeyser, Samaey and Baelmans2016), which look promising for reducing the number of particle histories to follow in the MC component without loss of the accuracy. If this approach demonstrates the potential for speeding the code up significantly in realistic applications (until now this has been demonstrated for simple cases of pure D plasmas without strong detachment), the runs with drifts will become routine and more physics can be included in the model.
3.7 Modelling of high-recycling and detached divertor regimes
Two-dimensional edge plasma modelling played an important role in finding and clarification of the crucial bits of physics of both the high-recycling and detached divertor regimes. Historically, the high-recycling regime of divertor operation was the first target in 2-D edge modelling (e.g. Petravic et al. Reference Petravic, Post, Heifez and Schmidt1982; Igitkhanov et al. Reference Igitkhanov, Kukushkin, Pigarov and Pistunovich1986; Taroni et al. Reference Taroni, Corrigan, Radford, Simonini, Spence and Weber1992; see also a review paper Rognlien, Braams & Knoll Reference Rognlien, Braams and Knoll1996). These studies largely confirmed the main physical idea of lowering the divertor plasma temperature by ionization trapping of neutrals in the divertor volume, which drastically increases the plasma ionization rate providing the source of the cold plasma. The divertor concept for the INTOR project and the initial version of the ITER divertor concept were based on the high-recycling regime and corresponding modelling was done extensively in late 1980s to the early 1990s (INTOR Group 1988; Cohen et al. Reference Cohen1992). Today, the modelling results for this regime reproduce the experimental data reasonably well (e.g. Wischmeier et al. Reference Wischmeier2011).
However, in order to reduce the divertor power loading significantly, one needs, in particular, to reduce the ion flux to the target. Operational regime meeting these requirements – the detached divertor regime – was found experimentally in early 1990s (see Matthews 1995 and the references therein). The transition into this regime was reached with continuous increase of the hydrogen fuelling rate (the density ramp) and it appeared that after some point, the plasma particle flux to the target started to decrease.
The first 2-D modelling studies related to divertor detachment were presented in Kukushkin (Reference Kukushkin1994), Petravic, Bateman & Post (Reference Petravic, Bateman and Post1994). In these studies, the focus was on the energy dissipation in the pure hydrogen plasma. The first study using MC models for neutral transport did not include volumetric recombination. In Petravic et al. (Reference Petravic, Bateman and Post1994) the latter was included, although a crude model of diffusive transport was used for the neutrals. Neither of these studies considered the radiation trapping effects, even though under conditions considered they should play a very important role (see § 3.3). A sharp ionization–recombination front was found in Petravic et al. (Reference Petravic, Bateman and Post1994) with gradual transition from the ionized plasma to the neutral gas along with the temperature drop towards the target. This picture is consistent with the analytical model (Krasheninnikov & Pigarov Reference Krasheninnikov and Pigarov1987) employing the Saha equilibrium in the dense, partially ionized plasma and diffusive approximation for the radiation loss.
The principal signature of ultimate divertor plasma detachment in experiment is the rollover of the ion flux to the target (Matthews Reference Matthews1995). Originally, based on analytic results from (Rebut et al. (Reference Rebut, Boucher, Gambier, Keen and Watkins1993) and the references therein; Stangeby (Reference Stangeby1993)), the rollover was attributed solely to the pressure drop from the mid-plane to the target caused by a drag force imposed by the neutrals on the plasma flow in the divertor. This effect is somewhat similar to that described by the Self–Ewald model discussed in § 2.5. Such a pressure drop is indeed seen in experiments (see Matthews Reference Matthews1995 and the references therein). Correspondingly, significant modelling effort was initially dedicated to better description of the so-called ‘momentum removal’ by plasma–neutral interactions in the low temperature divertor volume (e.g. The JET Team 1994; Weber, Simonini & Taroni Reference Weber, Simonini and Taroni1994; Janeschitz et al. Reference Janeschitz, Borrass, Federici, Igitkhanov, Kukushkin, Pacher, Pacher and Sugihara1995; Taroni et al. Reference Taroni, Corrigan, Simonini, Spence and Weber1995; Maddison, Reiter & Hugil Reference Maddison, Reiter and Hugil1997).
However, further analytical studies have shown that no substantial reduction of the plasma flux to the targets, $\unicode[STIX]{x1D6E4}_{w}$
, due to ‘momentum removal’ can be expected and that the only processes that can change
$\unicode[STIX]{x1D6E4}_{w}$
, due to ‘momentum removal’ can be expected and that the only processes that can change $\unicode[STIX]{x1D6E4}_{w}$
significantly are the impurity radiation loss and volumetric plasma recombination (Krasheninnikov Reference Krasheninnikov1996). Two-dimensional simulations of (Wising et al.
Reference Wising, Knoll, Krasheninnikov, Rognlien and Sigmar1996) clearly demonstrated the crucial role of the impurity radiation loss and volumetric plasma recombination in the reduction of the plasma flux to the divertor targets (see figure 19). As a result, in the review paper (Loarte Reference Loarte1997) it was concluded: ‘it has become apparent that the momentum loss by neutral–ion friction does not provide an explanation for all the experimental observations of divertor detachment, such as the reduction of total ion flux to the divertor’. Today these conclusions are widely accepted by edge plasma community and both impurity radiation and plasma recombination effects are incorporated in all existing 2-D edge plasma codes and, in particular, were used in assessment of the performance of the ITER divertor design (e.g. Pacher et al.
Reference Pacher, Kukushkin, Pacher, Kotov, Pitts and Reiter2015).
$\unicode[STIX]{x1D6E4}_{w}$
significantly are the impurity radiation loss and volumetric plasma recombination (Krasheninnikov Reference Krasheninnikov1996). Two-dimensional simulations of (Wising et al.
Reference Wising, Knoll, Krasheninnikov, Rognlien and Sigmar1996) clearly demonstrated the crucial role of the impurity radiation loss and volumetric plasma recombination in the reduction of the plasma flux to the divertor targets (see figure 19). As a result, in the review paper (Loarte Reference Loarte1997) it was concluded: ‘it has become apparent that the momentum loss by neutral–ion friction does not provide an explanation for all the experimental observations of divertor detachment, such as the reduction of total ion flux to the divertor’. Today these conclusions are widely accepted by edge plasma community and both impurity radiation and plasma recombination effects are incorporated in all existing 2-D edge plasma codes and, in particular, were used in assessment of the performance of the ITER divertor design (e.g. Pacher et al.
Reference Pacher, Kukushkin, Pacher, Kotov, Pitts and Reiter2015).
Two-dimensional UEDGE modelling results on the plasma ionization source and recombination sink on different flux tubes with and without impurity radiation loss for ITER-like parameters. Taken from Wising et al. (Reference Wising, Knoll, Krasheninnikov, Rognlien and Sigmar1996).

As we see, the results of simplified models can play important roles in both guiding the direction of the 2-D simulations and uncovering the crucial physics. However, the simplified models do not account for all the processes built into the 2-D codes and focus just on some of them. As a result, the simplified models can lead to wrong predictions. Nonetheless, cross-fertilization between the simplified models and comprehensive 2-D codes is very fruitful. Indeed, the 2-D edge plasma transport codes use many ad hoc building blocks, such as anomalous cross-field plasma transport, plasma–wall interactions, etc. In addition, there are some issues even with classical transport (e.g. the kinetic effects). Therefore, simplified models can hint at some new important (according to these models) physics, which is either not present in the codes or has not been examined yet. Being more flexible, simplified models can indicate important trends/phenomena (e.g. bifurcations) and provide useful scaling laws within the scope of the physics models already existing in the 2-D codes. Obviously, the predictions from these simplified models should be carefully examined using both the 2-D codes and experimental data. Conversely, the results of 2-D simulations (in particular, the unexpected ones) can show some nuances of physics, which have not been considered before in simplified models and which require physical interpretation.
Current 2-D simulations of edge plasma transport have two major directions. One is focused on the modelling of current experiments and refining the models used in the codes and understanding the role of different physical processes such as drifts, anomalous cross-field transport, atomic physics, plasma–wall interactions, etc. The other one targets the issues related to enhancement of the divertor performance – in particular, the novel magnetic configurations and geometry.
A big part of the worldwide effort on 2-D modelling of divertor plasmas is devoted to model validation through comparison of the modelling results with the experimental data and most of these studies concentrate on reproducing the profiles of the plasma parameters measured in particular, relatively well-diagnosed experimental shots (e.g. Schneider et al. Reference Schneider, Bonnin, Borrass, Coster, Kastelewicz, Reiter, Rozhansky and Braams2006; Chankin & Coster Reference Chankin and Coster2009; Moulton et al. Reference Moulton, Fundamenski, Wiesen, Corrigan, Belo, Maddison and Giroud2011; Wischmeier et al. Reference Wischmeier2011; Aho-Mantila et al. Reference Aho-Mantila2013; Groth et al. Reference Groth2013; Rozhansky et al. Reference Rozhansky, Molchanov, Veselova, Voskoboynikov, Kirk and Coster2013; Guillemaut et al. Reference Guillemaut2014; Aho-Mantila et al. Reference Aho-Mantila, Bonnin, Coster, Lowry, Wischmeier, Brezinsek and Federici2015; Reimold et al. Reference Reimold2015a ; Wischmeier et al. Reference Wischmeier2015; Aho-Mantila et al. Reference Aho-Mantila2017; Reimold et al. Reference Reimold, Wischmeier, Potzel, Guimarais, Reiter, Bernert, Dunne and Lunt2017). In these calculations, the authors attempt to fit the experimental profiles obtained sometimes by reconstruction of the measured signals using some algorithms of different reliability, by adjusting the coefficients in the model, such as the plasma anomalous transport coefficients, the sputtering yield, the parameters of the neutral particle reflection from the surfaces and so on. There is a considerable progress in making the computational results closer to the known experimental data, although the inaccuracy of the experimental data does also contribute to the differences between the experimental and simulation results (e.g. Guillemaut et al. Reference Guillemaut2014). The results of the 2-D simulations demonstrate a reasonable match to the experimental data for the high-recycling conditions as well as the general trends in divertor detachment in modern devices. In particular, it was shown that introduction of the drifts in the plasma transport equations allows us to reproduce quantitatively the divertor asymmetry observed on JET and ASDEX Upgrade (e.g. Aho-Mantila et al. Reference Aho-Mantila2017; Reimold et al. Reference Reimold, Wischmeier, Potzel, Guimarais, Reiter, Bernert, Dunne and Lunt2017).
Unfortunately, some of the parameter adjustments made for matching the experimental results are ambiguous. In particular, the cross-field transport is assumed to be ‘anomalous’ with the coefficient profiles prescribed ad hoc (Kallenbach et al. Reference Kallenbach, Asakura, Kirk, Korotkov, Mahdavi, Mossessian and Porter2005; Wiesen et al. Reference Wiesen, Fundamenski, Wischmeier, Groth, Brezinsek and Naulin2011; Reimold et al. Reference Reimold2015a ). The profiles proposed in different papers to yield the best fit are different, even if the same machine is modelled (e.g. Rozhansky et al. Reference Rozhansky2009; Reimold et al. Reference Reimold2015a ). This is not surprising since the effect of cross-field transport on the plasma profiles depends on other model assumptions. For example, it was shown in Kukushkin & Pacher (Reference Kukushkin and Pacher2006) that the assumptions made for the cross-field transport in order to get the statistically best fit to the same series of modelling results are different depending on the other assumptions, such as the parallel transport or the neutral transport model. Taking into account this uncertainty, the results of model ‘validation’ or ‘de-validation’ by comparing the detail of the calculated profiles with the experimental data do not always look convincing. Given the complexity of the divertor plasma and unavoidable simplifications in the models, one should not expect exact reproduction of the experimental profiles with the code. However, it is important to reproduce the experimental trends with clear understanding of the physics involved.
In recent years significant amount of 2-D simulations was devoted to the study of the impact of novel magnetic configurations and geometry of divertors on both the heat exhaust and detachment (e.g. Havlíčková et al. Reference Havlíčková, Wischmeier, Lipschultz and Fishpool2015; Wischmeier et al. Reference Wischmeier2015; Asakura et al. Reference Asakura2016; Umansky et al. Reference Umansky, LaBombard, Brunner, Rensink, Rognlien, Terry and Whyte2016; Guo et al. Reference Guo, Sang, Stangeby, Lao, Taylor and Thomas2017). For example, in figure 20 one can see the divertor configurations modelled in (Umansky et al. Reference Umansky, LaBombard, Brunner, Rensink, Rognlien, Terry and Whyte2016). The main goal of these studies is to demonstrate the major trends (e.g. the upstream plasma density at which the onset of detachment starts) and capabilities (e.g. the power input into the SOL, which can be tolerated by the divertor targets with reasonable impurity concentration and upstream plasma density) of the new divertor designs. Note that some simulations are performed for the new divertor configurations that are scheduled to be installed in existing tokamaks. Therefore, it will be interesting to compare the predictions of these simulations with the future experimental data.
Divertor configurations modelled in Umansky et al. (Reference Umansky, LaBombard, Brunner, Rensink, Rognlien, Terry and Whyte2016). Taken from Umansky et al. (Reference Umansky, LaBombard, Brunner, Rensink, Rognlien, Terry and Whyte2016).

4 Physics of detached divertor plasma
In this section we consider the physical mechanisms that can result in rollover of the plasma flux to the divertor target – the manifestation of divertor plasma detachment from the PFCs – and discuss the parameters describing the onset of detachment. We will also touch upon the issues of the detachment stability and the impact of ELMs.
4.1 Mechanisms of divertor plasma detachment
One of the first attempts to explain the rollover of the plasma flux to the divertor targets was made in Stangeby (Reference Stangeby1993). The main idea was based on establishing a large plasma pressure drop between the upstream and divertor regions by means of the ion–neutral collisions, similar to what follows from the Self–Ewald model considered in § 2. It was assumed that such a pressure drop would automatically reduce the plasma flux to the target. As an example of the feasibility of such an effect, the results of experiments on linear divertor simulators (e.g. see Hsu et al. Reference Hsu, Yamada and Barret1982; Fiksel, Kishinevsky & Hershkowitz Reference Fiksel, Kishinevsky and Hershkowitz1990; Schmitz et al. Reference Schmitz, Lehmer, Chevalier, Tynan, Chia, Doerner and Conn1990) were brought up. In these experiments, the plasma flux to the target located in the working chamber separated from the plasma source was reducing strongly with the increase of the neutral gas pressure in the working chamber.
However, in these experiments the reduction of the plasma flux to the target was attributed to cross-field ion transport to the side walls, which is not the case in the tokamak experiments. There are also other important differences between experiments on the tokamaks and linear divertor simulators. In tokamaks, the plasma ionization source sustained by the tokamak heating power must balance the plasma sink, whereas in the divertor simulators, only a small fraction of the plasma produced in the source region enters the working chamber and reaches the target. Meanwhile, in Stangeby (Reference Stangeby1993) the reduction of the neutral ionization rate with the reduction of the plasma flux to the target due to the ion–neutral interactions was postulated. As we will see, this cannot be taken as granted.
To sort out the issues with the plasma source and sink in the detached tokamak plasma, we will follow Krasheninnikov (Reference Krasheninnikov1996), Krasheninnikov et al. (Reference Krasheninnikov, Pigarov, Knoll, LaBombard, Lipschultz, Sigmar, Soboleva, Terry and Wising1997) and consider the global balance of the plasma particles and energy in the tokamak SOL, which can be written as
 $$\begin{eqnarray}\displaystyle \unicode[STIX]{x1D6E4}_{\text{ion}}=\unicode[STIX]{x1D6E4}_{w}+\unicode[STIX]{x1D6E4}_{\text{rec}},\quad Q_{\text{SOL}}=Q_{\text{imp}}+Q_{H}+Q_{CX}+\unicode[STIX]{x1D6FE}_{R}T_{w}\unicode[STIX]{x1D6E4}_{w}. & & \displaystyle\end{eqnarray}$$
Here $\unicode[STIX]{x1D6E4}_{\text{ion}}$
,
$\unicode[STIX]{x1D6E4}_{\text{ion}}$
, $\unicode[STIX]{x1D6E4}_{\text{rec}}$
and
$\unicode[STIX]{x1D6E4}_{\text{rec}}$
and $\unicode[STIX]{x1D6E4}_{w}$
are the particle ionization source in the SOL and divertor, the recombination sink and the plasma flux to the walls, respectively (we assume that the plasma particle flux to the SOL from the core is much lower than
$\unicode[STIX]{x1D6E4}_{w}$
are the particle ionization source in the SOL and divertor, the recombination sink and the plasma flux to the walls, respectively (we assume that the plasma particle flux to the SOL from the core is much lower than $\unicode[STIX]{x1D6E4}_{\text{ion}}$
).
$\unicode[STIX]{x1D6E4}_{\text{ion}}$
). $Q_{\text{SOL}}$
is the power flux coming across the separatrix from the core into the SOL,
$Q_{\text{SOL}}$
is the power flux coming across the separatrix from the core into the SOL, $Q_{\text{imp}}$
the impurity radiation loss in the SOL and divertor volumes,
$Q_{\text{imp}}$
the impurity radiation loss in the SOL and divertor volumes, $Q_{H}$
the power loss associated with the hydrogen ionization processes and
$Q_{H}$
the power loss associated with the hydrogen ionization processes and $Q_{CX}$
the power delivered to the wall by neutrals in the process of neutral–ion energy exchange (in the dense divertor plasma, this is the energy loss associated with neutral heat conduction). The last term in the energy balance equation in (4.1) describes the kinetic energy of the plasma transferred to the wall (
$Q_{CX}$
the power delivered to the wall by neutrals in the process of neutral–ion energy exchange (in the dense divertor plasma, this is the energy loss associated with neutral heat conduction). The last term in the energy balance equation in (4.1) describes the kinetic energy of the plasma transferred to the wall ( $T_{w}$
is the effective plasma temperature at the wall and
$T_{w}$
is the effective plasma temperature at the wall and $\unicode[STIX]{x1D6FE}_{R}$
is the effective sheath transmission factor where the energy of the reflected neutrals is taken into account). As discussed in § 2,
$\unicode[STIX]{x1D6FE}_{R}$
is the effective sheath transmission factor where the energy of the reflected neutrals is taken into account). As discussed in § 2, $Q_{H}$
is related to the plasma ionization source
$Q_{H}$
is related to the plasma ionization source $\unicode[STIX]{x1D6E4}_{\text{ion}}$
through the ionization cost:
$\unicode[STIX]{x1D6E4}_{\text{ion}}$
through the ionization cost: $Q_{\text{ion}}=E_{\text{ion}}\unicode[STIX]{x1D6E4}_{\text{ion}}$
.
$Q_{\text{ion}}=E_{\text{ion}}\unicode[STIX]{x1D6E4}_{\text{ion}}$
. $Q_{CX}$
is also related to
$Q_{CX}$
is also related to $\unicode[STIX]{x1D6E4}_{\text{ion}}$
since the more neutrals participate in ion–neutral energy exchange, the higher the probability of neutral ionization is, so that
$\unicode[STIX]{x1D6E4}_{\text{ion}}$
since the more neutrals participate in ion–neutral energy exchange, the higher the probability of neutral ionization is, so that $Q_{CX}=E_{CX}\unicode[STIX]{x1D6E4}_{\text{ion}}$
where
$Q_{CX}=E_{CX}\unicode[STIX]{x1D6E4}_{\text{ion}}$
where $E_{CX}$
is the effective energy delivered to the wall by the neutrals per a neutral ionization event. In the dense divertor plasma, the neutral-related transport of both the particles and energy is of a diffusive nature. Therefore, a good estimate for
$E_{CX}$
is the effective energy delivered to the wall by the neutrals per a neutral ionization event. In the dense divertor plasma, the neutral-related transport of both the particles and energy is of a diffusive nature. Therefore, a good estimate for $E_{CX}$
is
$E_{CX}$
is $E_{CX}=\unicode[STIX]{x1D709}_{\unicode[STIX]{x1D705}/D}T_{\text{ion}}\unicode[STIX]{x1D6E4}_{\text{ion}}$
, where
$E_{CX}=\unicode[STIX]{x1D709}_{\unicode[STIX]{x1D705}/D}T_{\text{ion}}\unicode[STIX]{x1D6E4}_{\text{ion}}$
, where $\unicode[STIX]{x1D709}_{\unicode[STIX]{x1D705}/D}\sim 2.5$
(Helander et al.
Reference Helander, Krasheninnikov and Catto1994) is the ratio of the heat to the particle diffusivity of the neutrals and
$\unicode[STIX]{x1D709}_{\unicode[STIX]{x1D705}/D}\sim 2.5$
(Helander et al.
Reference Helander, Krasheninnikov and Catto1994) is the ratio of the heat to the particle diffusivity of the neutrals and $T_{\text{ion}}$
is the plasma temperature in the ionization region. For the detached divertor conditions,
$T_{\text{ion}}$
is the plasma temperature in the ionization region. For the detached divertor conditions, $T_{\text{ion}}\sim 5~\text{eV}$
and does not vary strongly, since for a lower temperature, the ionization rate constant drops sharply, whereas the neutrals cannot penetrate to the higher temperature regions due to the high plasma density and fast ionization.
$T_{\text{ion}}\sim 5~\text{eV}$
and does not vary strongly, since for a lower temperature, the ionization rate constant drops sharply, whereas the neutrals cannot penetrate to the higher temperature regions due to the high plasma density and fast ionization.
Then, for the case where $T_{w}$
is low and the heat flux to the target associated with the kinetic energy of the electrons and ions can be ignored, from (4.1) we find (Krasheninnikov Reference Krasheninnikov1996; Krasheninnikov et al.
Reference Krasheninnikov, Pigarov, Knoll, LaBombard, Lipschultz, Sigmar, Soboleva, Terry and Wising1997)
$T_{w}$
is low and the heat flux to the target associated with the kinetic energy of the electrons and ions can be ignored, from (4.1) we find (Krasheninnikov Reference Krasheninnikov1996; Krasheninnikov et al.
Reference Krasheninnikov, Pigarov, Knoll, LaBombard, Lipschultz, Sigmar, Soboleva, Terry and Wising1997)
 $$\begin{eqnarray}\displaystyle \unicode[STIX]{x1D6E4}_{w}=\frac{Q_{\text{SOL}}-Q_{\text{imp}}}{E_{\text{ion}}^{\text{eff}}}-\unicode[STIX]{x1D6E4}_{\text{rec}}\equiv \unicode[STIX]{x1D6E4}_{\text{ion}}^{\max }-\unicode[STIX]{x1D6E4}_{\text{rec}}. & & \displaystyle\end{eqnarray}$$
Here $E_{\text{ion}}^{\text{eff}}=E_{\text{ion}}+E_{CX}$
is the effective neutral ionization cost accounting for the energy loss related to hydrogen radiation, ionization and ‘charge-exchange’ processes and
$E_{\text{ion}}^{\text{eff}}=E_{\text{ion}}+E_{CX}$
is the effective neutral ionization cost accounting for the energy loss related to hydrogen radiation, ionization and ‘charge-exchange’ processes and $\unicode[STIX]{x1D6E4}_{\text{ion}}^{\max }$
is the maximum ionization source limited by the available power. The expression (4.2) is very transparent. In the steady state, the full power coming to the SOL must go somewhere. There are three ways for power to go: to the impurity radiation loss, to the target (the plasma kinetic energy) and to the energy losses related to hydrogen ionization. When
$\unicode[STIX]{x1D6E4}_{\text{ion}}^{\max }$
is the maximum ionization source limited by the available power. The expression (4.2) is very transparent. In the steady state, the full power coming to the SOL must go somewhere. There are three ways for power to go: to the impurity radiation loss, to the target (the plasma kinetic energy) and to the energy losses related to hydrogen ionization. When $T_{w}$
becomes low, the target channel does not work anymore. Then, the power left over after the impurity radiation loss is spent for hydrogen ionization, which produces the ionization source
$T_{w}$
becomes low, the target channel does not work anymore. Then, the power left over after the impurity radiation loss is spent for hydrogen ionization, which produces the ionization source $\unicode[STIX]{x1D6E4}_{\text{ion}}^{\max }$
. Taking into account that the variation of
$\unicode[STIX]{x1D6E4}_{\text{ion}}^{\max }$
. Taking into account that the variation of $E_{\text{ion}}$
,
$E_{\text{ion}}$
, $E_{CX}$
, and, therefore,
$E_{CX}$
, and, therefore, $E_{\text{ion}}^{\text{eff}}$
is marginal, this ionization source cannot be reduced further if both
$E_{\text{ion}}^{\text{eff}}$
is marginal, this ionization source cannot be reduced further if both $Q_{\text{SOL}}$
and
$Q_{\text{SOL}}$
and $Q_{\text{imp}}$
are fixed. As a result, under these circumstances, the only way the plasma flux to the target can be reduced below
$Q_{\text{imp}}$
are fixed. As a result, under these circumstances, the only way the plasma flux to the target can be reduced below $\unicode[STIX]{x1D6E4}_{\text{ion}}^{\max }$
is via the recombination processes. The importance of taking into account plasma recombination for reproducing the experimental data with 2-D simulations was demonstrated originally in Wising et al. (Reference Wising, Knoll, Krasheninnikov, Rognlien and Sigmar1996), Borrass et al. (Reference Borrass, Coster, Reiter and Schneider1997a
).
$\unicode[STIX]{x1D6E4}_{\text{ion}}^{\max }$
is via the recombination processes. The importance of taking into account plasma recombination for reproducing the experimental data with 2-D simulations was demonstrated originally in Wising et al. (Reference Wising, Knoll, Krasheninnikov, Rognlien and Sigmar1996), Borrass et al. (Reference Borrass, Coster, Reiter and Schneider1997a
).
Now, one can ask a legitimate question: what is the role, if any, of the ion–neutral collisions in divertor plasma detachment? Actually, the ion–neutral collisions, being not directly involved in the reduction of the plasma flux to the target, play three important roles in the detachment physics. First, as pointed out in § 2, at low plasma temperature near the targets, the ion–neutral collisions maintain the effective pressure $P_{\text{recyl}}$
in the recycling region, which counter-balances the upstream plasma pressure
$P_{\text{recyl}}$
in the recycling region, which counter-balances the upstream plasma pressure $P_{\text{up}}$
. Secondly, when the plasma temperature in the neutral ionization region becomes low (
$P_{\text{up}}$
. Secondly, when the plasma temperature in the neutral ionization region becomes low ( ${\sim}\mathit{few}~\text{eV}$
), then neither atomic hydrogen nor impurity-related atomic processes can cool the plasma further down to
${\sim}\mathit{few}~\text{eV}$
), then neither atomic hydrogen nor impurity-related atomic processes can cool the plasma further down to ${\sim}$
1 eV range necessary to turn the plasma recombination on. This is where the electron–ion–neutral energy exchange (including the elastic ion–neutral collisions and vibrational excitation of the hydrogen molecules by electron impact), assisted by fast heat conduction via neutrals that dump the residual plasma energy onto the target, becomes important for cooling the plasma down and switching the recombination processes on. Thirdly, at low plasma temperature, the ion–neutral interactions (‘friction’) switch the plasma flow from a free streaming to a slow, subsonic, diffusive regime, thus increasing the plasma density and making the residence time of the electrons and ions in the low temperature region sufficient for recombination.
${\sim}$
1 eV range necessary to turn the plasma recombination on. This is where the electron–ion–neutral energy exchange (including the elastic ion–neutral collisions and vibrational excitation of the hydrogen molecules by electron impact), assisted by fast heat conduction via neutrals that dump the residual plasma energy onto the target, becomes important for cooling the plasma down and switching the recombination processes on. Thirdly, at low plasma temperature, the ion–neutral interactions (‘friction’) switch the plasma flow from a free streaming to a slow, subsonic, diffusive regime, thus increasing the plasma density and making the residence time of the electrons and ions in the low temperature region sufficient for recombination.
As we see, consideration of SOL energy balance brings a constraint on the plasma ionization source. Such a constraint is not applicable to the experimental results from linear divertor simulators, neither was it considered in the Self–Ewald model. It is interesting to see, what kind of energy requirements follows from the Self–Ewald model. Since this model is one-dimensional, we will consider the specific energy flux to the neutral gas layer from upstream, $q_{SE}$
, which is needed to sustain the plasma recycling. Assuming that the ‘charge-exchange’ energy loss per an ion-neutral collision is (
$q_{SE}$
, which is needed to sustain the plasma recycling. Assuming that the ‘charge-exchange’ energy loss per an ion-neutral collision is ( $3/2$
)T, by using the expressions ((2.13), (2.14)), after some algebra, for the most interesting case
$3/2$
)T, by using the expressions ((2.13), (2.14)), after some algebra, for the most interesting case $\unicode[STIX]{x1D6FC}\ll 1$
we find
$\unicode[STIX]{x1D6FC}\ll 1$
we find
 $$\begin{eqnarray}\displaystyle q_{SE}(T)=\frac{3}{2}P_{\text{up}}C_{s}(T)\left\{\frac{K_{iN}(T)}{K_{\text{ion}}(T)}\right\}^{1/2}. & & \displaystyle\end{eqnarray}$$
Since $K_{\text{ion}}(T\rightarrow 0)$
is a sharply decreasing function, from (4.3) we find that
$K_{\text{ion}}(T\rightarrow 0)$
is a sharply decreasing function, from (4.3) we find that $q_{SE}(T\rightarrow 0)\rightarrow \infty$
for fixed P
$q_{SE}(T\rightarrow 0)\rightarrow \infty$
for fixed P $_{\text{up}}$
, which demonstrates the limitation of the Self–Ewald model.
$_{\text{up}}$
, which demonstrates the limitation of the Self–Ewald model.
Going back to (4.2), we conclude that, although a minor variation of $\unicode[STIX]{x1D6E4}_{w}$
is possible due to some adjustment of
$\unicode[STIX]{x1D6E4}_{w}$
is possible due to some adjustment of $E_{\text{ion}}$
and
$E_{\text{ion}}$
and $E_{CX}$
, a drastic reduction of the plasma flux to the divertor target, observed experimentally in the detached divertor regime, is only possible by (i) increasing the impurity radiation loss and/or (ii) enhancing volumetric recombination. However, complete dissipation of
$E_{CX}$
, a drastic reduction of the plasma flux to the divertor target, observed experimentally in the detached divertor regime, is only possible by (i) increasing the impurity radiation loss and/or (ii) enhancing volumetric recombination. However, complete dissipation of $Q_{\text{SOL}}$
by impurity radiation is not possible. One of the reasons for this is that the impurity radiation loss decreases sharply when the plasma temperature falls below few eV. Another one, which reflects some fundamental properties of the edge plasma, will be discussed in the next sub-section. As a result,
$Q_{\text{SOL}}$
by impurity radiation is not possible. One of the reasons for this is that the impurity radiation loss decreases sharply when the plasma temperature falls below few eV. Another one, which reflects some fundamental properties of the edge plasma, will be discussed in the next sub-section. As a result, $Q_{\text{SOL}}-Q_{\text{imp}}\geqslant Q_{\min }$
and there is some minimum plasma ionization source,
$Q_{\text{SOL}}-Q_{\text{imp}}\geqslant Q_{\min }$
and there is some minimum plasma ionization source, $\unicode[STIX]{x1D6E4}_{\text{ion}}^{\min }=Q_{\min }/E_{\text{ion}}^{\text{eff}}$
. Therefore,
$\unicode[STIX]{x1D6E4}_{\text{ion}}^{\min }=Q_{\min }/E_{\text{ion}}^{\text{eff}}$
. Therefore, $\unicode[STIX]{x1D6E4}_{w}$
can only be decreased significantly below
$\unicode[STIX]{x1D6E4}_{w}$
can only be decreased significantly below $\unicode[STIX]{x1D6E4}_{\text{ion}}^{\min }$
via plasma recombination and this is the regime we call ‘ultimate divertor plasma detachment’.
$\unicode[STIX]{x1D6E4}_{\text{ion}}^{\min }$
via plasma recombination and this is the regime we call ‘ultimate divertor plasma detachment’.
Let us now discuss briefly the impact of both the impurity radiation loss and plasma recombination on the detachment process, observed in experiments. In many cases, the experiments show clearly the presence of strong recombination in the detached plasma. One of the indications of plasma recombination is the enhanced radiation from the highly excited states of a hydrogen atom, associated with populating these states in the course of three-body recombination. In figure 21, one can see this for the Balmer series of lines corresponding to the transitions from the excited states of a hydrogen atom to the level $n=2$
as observed in Alcator C-Mod. (Terry et al.
Reference Terry, Lipschultz, Pigarov, Krasheninnikov, LaBombard, Lumma, Ohkawa, Pappas and Umansky1998). Similar observations were made on all major tokamaks (see e.g. Isler et al.
Reference Isler, McKee, Brooks, West, Fenstermacher and Wood1997; Lumma, Terry & Lipschultz Reference Lumma, Terry and Lipschultz1997; McCracken et al.
Reference McCracken, Stamp, Monk, Meigs, Lingertat, Prentice, Starling, Smith and Tabasso1998; Wenzel et al.
Reference Wenzel, Behringer, Carlson, Gafert, Napiontek and Thoma1999; Tabasso et al.
Reference Tabasso, Dowling, Ahn, Cunningham, Kirk, Mcardle and Price2003; Soukhanovskii et al.
Reference Soukhanovskii2009). A more detailed investigation of the role of plasma recombination shows that the plasma recombination sink can reach 80 per cent of the ionization source and even more (Lipschultz et al.
Reference Lipschultz1999).
$n=2$
as observed in Alcator C-Mod. (Terry et al.
Reference Terry, Lipschultz, Pigarov, Krasheninnikov, LaBombard, Lumma, Ohkawa, Pappas and Umansky1998). Similar observations were made on all major tokamaks (see e.g. Isler et al.
Reference Isler, McKee, Brooks, West, Fenstermacher and Wood1997; Lumma, Terry & Lipschultz Reference Lumma, Terry and Lipschultz1997; McCracken et al.
Reference McCracken, Stamp, Monk, Meigs, Lingertat, Prentice, Starling, Smith and Tabasso1998; Wenzel et al.
Reference Wenzel, Behringer, Carlson, Gafert, Napiontek and Thoma1999; Tabasso et al.
Reference Tabasso, Dowling, Ahn, Cunningham, Kirk, Mcardle and Price2003; Soukhanovskii et al.
Reference Soukhanovskii2009). A more detailed investigation of the role of plasma recombination shows that the plasma recombination sink can reach 80 per cent of the ionization source and even more (Lipschultz et al.
Reference Lipschultz1999).
Intensities of the Balmer series of lines corresponding to recombining divertor plasma in Alcator C-Mod. Taken from Terry et al. (Reference Terry, Lipschultz, Pigarov, Krasheninnikov, LaBombard, Lumma, Ohkawa, Pappas and Umansky1998).

In addition to the recombination processes, the experimental data show that the plasma flux to the targets can also be affected by both the power input to the SOL and impurity radiation. It was shown in Goetz et al. (Reference Goetz1999) that in H-mode, the reduction of $\unicode[STIX]{x1D6E4}_{w}$
by a factor
$\unicode[STIX]{x1D6E4}_{w}$
by a factor ${\sim}$
5 can be achieved by nitrogen gas puffing with virtually no impact of the recombination effects. An impact of the impurity on the rollover of the plasma flux to the target can also be deduced from the JET experiments with carbon and ITER-like wall (Brezinsek et al.
Reference Brezinsek2015). The effects of both impurity radiation and auxiliary heating on the plasma flux to the target, as observed in C-Mod, are shown in figure 22. The experimental data for
${\sim}$
5 can be achieved by nitrogen gas puffing with virtually no impact of the recombination effects. An impact of the impurity on the rollover of the plasma flux to the target can also be deduced from the JET experiments with carbon and ITER-like wall (Brezinsek et al.
Reference Brezinsek2015). The effects of both impurity radiation and auxiliary heating on the plasma flux to the target, as observed in C-Mod, are shown in figure 22. The experimental data for $\unicode[STIX]{x1D6E4}_{\text{ion}}$
,
$\unicode[STIX]{x1D6E4}_{\text{ion}}$
, $\unicode[STIX]{x1D6E4}_{\text{rec}}$
and
$\unicode[STIX]{x1D6E4}_{\text{rec}}$
and $\unicode[STIX]{x1D6E4}_{w}$
, shown there were inferred from the spectroscopic and probe measurements. From the panels (a) and (b) we see that the auxiliary heating of the detached plasma with ion cyclotron radio frequency (ICRF) (which increases
$\unicode[STIX]{x1D6E4}_{w}$
, shown there were inferred from the spectroscopic and probe measurements. From the panels (a) and (b) we see that the auxiliary heating of the detached plasma with ion cyclotron radio frequency (ICRF) (which increases $Q_{\text{SOL}}$
in (4.2)) results in the increase of both the plasma ionization source
$Q_{\text{SOL}}$
in (4.2)) results in the increase of both the plasma ionization source $\unicode[STIX]{x1D6E4}_{\text{ion}}$
and the plasma flux to the targets
$\unicode[STIX]{x1D6E4}_{\text{ion}}$
and the plasma flux to the targets $\unicode[STIX]{x1D6E4}_{w}$
with virtually no change in the plasma recombination sink
$\unicode[STIX]{x1D6E4}_{w}$
with virtually no change in the plasma recombination sink $\unicode[STIX]{x1D6E4}_{\text{rec}}$
. Meanwhile, from the panels (c) and (d) we see that both the plasma ionization source
$\unicode[STIX]{x1D6E4}_{\text{rec}}$
. Meanwhile, from the panels (c) and (d) we see that both the plasma ionization source $\unicode[STIX]{x1D6E4}_{\text{ion}}$
and the plasma flux to the targets
$\unicode[STIX]{x1D6E4}_{\text{ion}}$
and the plasma flux to the targets $\unicode[STIX]{x1D6E4}_{w}$
decrease strongly with nitrogen gas puffing (which increases
$\unicode[STIX]{x1D6E4}_{w}$
decrease strongly with nitrogen gas puffing (which increases $Q_{\text{imp}}$
in (4.2)) while the plasma recombination sink
$Q_{\text{imp}}$
in (4.2)) while the plasma recombination sink $\unicode[STIX]{x1D6E4}_{\text{rec}}$
remains negligibly small.
$\unicode[STIX]{x1D6E4}_{\text{rec}}$
remains negligibly small.
Impact of the ICRF heating and nitrogen puffing on $\unicode[STIX]{x1D6E4}_{\text{ion}}$
,
$\unicode[STIX]{x1D6E4}_{\text{ion}}$
, $\unicode[STIX]{x1D6E4}_{\text{rec}}$
and
$\unicode[STIX]{x1D6E4}_{\text{rec}}$
and $\unicode[STIX]{x1D6E4}_{w}$
in C-Mod. Taken from Lipschultz et al. (Reference Lipschultz1999).
$\unicode[STIX]{x1D6E4}_{w}$
in C-Mod. Taken from Lipschultz et al. (Reference Lipschultz1999).

Both the theoretical estimates and experimental observations are well in line with the 2-D modelling results. The key role that the volumetric plasma recombination and radiation loss play in the reduction of $\unicode[STIX]{x1D6E4}_{w}$
is illustrated in figure 23. The corresponding data were deduced from dedicated numerical simulations of edge plasma transport in a DIII-D-like magnetic configuration with divertor targets orthogonal to the magnetic flux surfaces (for other parameters used in the simulations see Krasheninnikov, Kukushkin & Pshenov (Reference Krasheninnikov, Kukushkin and Pshenov2016)).
$\unicode[STIX]{x1D6E4}_{w}$
is illustrated in figure 23. The corresponding data were deduced from dedicated numerical simulations of edge plasma transport in a DIII-D-like magnetic configuration with divertor targets orthogonal to the magnetic flux surfaces (for other parameters used in the simulations see Krasheninnikov, Kukushkin & Pshenov (Reference Krasheninnikov, Kukushkin and Pshenov2016)).
(a) Dependence of the plasma flux $\unicode[STIX]{x1D6E4}_{w}$
on
$\unicode[STIX]{x1D6E4}_{w}$
on $\bar{N}_{D}^{\text{edge}}$
for:
$\bar{N}_{D}^{\text{edge}}$
for: $Q_{\text{SOL}}=8~\text{MW}$
,
$Q_{\text{SOL}}=8~\text{MW}$
, $Q_{\text{imp}}=0$
(red),
$Q_{\text{imp}}=0$
(red), $Q_{\text{SOL}}=4~\text{MW}$
,
$Q_{\text{SOL}}=4~\text{MW}$
, $Q_{\text{imp}}=0$
(blue) and
$Q_{\text{imp}}=0$
(blue) and $Q_{\text{SOL}}=8~\text{MW}$
,
$Q_{\text{SOL}}=8~\text{MW}$
, $Q_{\text{imp}}=4~\text{MW}$
(green) with (solid lines) and without (dashed lines) volumetric plasma recombination; (b) dependence of
$Q_{\text{imp}}=4~\text{MW}$
(green) with (solid lines) and without (dashed lines) volumetric plasma recombination; (b) dependence of $\unicode[STIX]{x1D6E4}_{\text{rec}}$
,
$\unicode[STIX]{x1D6E4}_{\text{rec}}$
, $\unicode[STIX]{x1D6E4}_{\text{ion}}$
and
$\unicode[STIX]{x1D6E4}_{\text{ion}}$
and $\unicode[STIX]{x1D6E4}_{w}$
on
$\unicode[STIX]{x1D6E4}_{w}$
on $\bar{N}_{D}^{\text{edge}}$
for
$\bar{N}_{D}^{\text{edge}}$
for $Q_{\text{SOL}}=4~\text{MW}$
and
$Q_{\text{SOL}}=4~\text{MW}$
and $Q_{\text{imp}}=0$
with volumetric plasma recombination turned on.
$Q_{\text{imp}}=0$
with volumetric plasma recombination turned on.

As one sees from figure 23(a), without volumetric plasma recombination, $\unicode[STIX]{x1D6E4}_{w}=\unicode[STIX]{x1D6E4}_{\text{ion}}$
saturates with increasing number of the deuterium nuclei (ions plus neutrals) in the computational domain,
$\unicode[STIX]{x1D6E4}_{w}=\unicode[STIX]{x1D6E4}_{\text{ion}}$
saturates with increasing number of the deuterium nuclei (ions plus neutrals) in the computational domain, $\bar{N}_{D}^{\text{edge}}$
, at the level determined, in accordance with (4.2), by the power available for neutral ionization,
$\bar{N}_{D}^{\text{edge}}$
, at the level determined, in accordance with (4.2), by the power available for neutral ionization, $\unicode[STIX]{x1D6E4}_{\text{ion}}^{\max }\propto Q_{\text{SOL}}-Q_{\text{imp}}$
. In particular, for given
$\unicode[STIX]{x1D6E4}_{\text{ion}}^{\max }\propto Q_{\text{SOL}}-Q_{\text{imp}}$
. In particular, for given $Q_{\text{SOL}}$
, an increase of
$Q_{\text{SOL}}$
, an increase of $Q_{\text{imp}}$
reduces
$Q_{\text{imp}}$
reduces $\unicode[STIX]{x1D6E4}_{\text{ion}}^{\max }$
(compare the cases with
$\unicode[STIX]{x1D6E4}_{\text{ion}}^{\max }$
(compare the cases with $Q_{\text{SOL}}=4~\text{MW}$
,
$Q_{\text{SOL}}=4~\text{MW}$
, $Q_{\text{imp}}=0$
and
$Q_{\text{imp}}=0$
and $Q_{\text{SOL}}=8~\text{MW}$
,
$Q_{\text{SOL}}=8~\text{MW}$
, $Q_{\text{imp}}=4~\text{MW}$
) in a way similar to that shown in figure 22(c,d) for nitrogen puffing. However, with recombination turned on and
$Q_{\text{imp}}=4~\text{MW}$
) in a way similar to that shown in figure 22(c,d) for nitrogen puffing. However, with recombination turned on and $\bar{N}_{D}^{\text{edge}}$
increasing,
$\bar{N}_{D}^{\text{edge}}$
increasing, $\unicode[STIX]{x1D6E4}_{w}$
exhibits an increase, a rollover, and then a strong reduction. From figure 23(b) we conclude that the reason for the rollover and further reduction of
$\unicode[STIX]{x1D6E4}_{w}$
exhibits an increase, a rollover, and then a strong reduction. From figure 23(b) we conclude that the reason for the rollover and further reduction of $\unicode[STIX]{x1D6E4}_{w}$
is the increase of
$\unicode[STIX]{x1D6E4}_{w}$
is the increase of $\unicode[STIX]{x1D6E4}_{\text{rec}}$
while the plasma ionization source
$\unicode[STIX]{x1D6E4}_{\text{rec}}$
while the plasma ionization source $\unicode[STIX]{x1D6E4}_{\text{ion}}$
saturates at the same level
$\unicode[STIX]{x1D6E4}_{\text{ion}}$
saturates at the same level $\unicode[STIX]{x1D6E4}_{\text{ion}}^{\max }$
as for the case without volumetric recombination, which is what is seen from the experimental data in figure 22(a,b). Note that similar saturation of
$\unicode[STIX]{x1D6E4}_{\text{ion}}^{\max }$
as for the case without volumetric recombination, which is what is seen from the experimental data in figure 22(a,b). Note that similar saturation of $\unicode[STIX]{x1D6E4}_{w}$
with recombination turned off was observed in other 2-D simulations (see e.g. Kotov & Reiter Reference Kotov and Reiter2009).
$\unicode[STIX]{x1D6E4}_{w}$
with recombination turned off was observed in other 2-D simulations (see e.g. Kotov & Reiter Reference Kotov and Reiter2009).
Therefore, we can conclude that the experimental data and the results of 2-D numerical simulations agree conceptually with our physical picture (which for the low plasma temperature near the targets can be boiled down to (4.2)) that determines the key ingredients affecting the plasma flux to the targets. However, we should note that (4.2) deals with the total plasma flux onto all the plasma-facing components. Therefore, the fact that $\unicode[STIX]{x1D6E4}_{w}$
in pure hydrogen plasma and in the absence of volumetric recombination saturates with increasing
$\unicode[STIX]{x1D6E4}_{w}$
in pure hydrogen plasma and in the absence of volumetric recombination saturates with increasing $\bar{N}_{D}^{\text{edge}}$
does not prevent some re-distribution of the local specific plasma flux to the divertor targets, caused by both a change of the local ionization source and cross-field plasma transport.
$\bar{N}_{D}^{\text{edge}}$
does not prevent some re-distribution of the local specific plasma flux to the divertor targets, caused by both a change of the local ionization source and cross-field plasma transport.
Next, we consider the available experimental data showing the role of the MAR (see § 2.5) in the overall plasma recombination sink. In a linear divertor simulator, the MAR processes were identified in the helium plasma with a small addition of hydrogen (Ohno et al.
Reference Ohno, Ezumi, Takamura, Krasheninnikov and Pigarov1998). Post-processing of the spectroscopic data from the detached plasma in the C-Mod tokamak indicated that the plasma sink due to MAR is comparable ( ${\sim}$
0.7) with that caused by the EIR processes (Terry et al.
Reference Terry, Lipschultz, Pigarov, Krasheninnikov, LaBombard, Lumma, Ohkawa, Pappas and Umansky1998). Similar conclusions were made in Kubo et al. (Reference Kubo, Takenaga, Sawada, Nakano, Kobayashi, Higashijima, Asakura and Shimizu2005) after the analysis of the spectroscopic data from the JT-60 tokamak. In contrast to that, the analysis of the experimental data from the AUG tokamak led to the conclusion that the contribution of the MAR to the overall recombination rate is of the order of 10 % (Fantz et al.
Reference Fantz, Reiter, Heger and Coster2001). However, evaluation of the contribution of the MAR to the overall plasma recombination sink from the experimental data requires rather complex post-processing (involving the atomic physics, radiation and neutral transport). Therefore, it is difficult to estimate the error bar of the results obtained.
${\sim}$
0.7) with that caused by the EIR processes (Terry et al.
Reference Terry, Lipschultz, Pigarov, Krasheninnikov, LaBombard, Lumma, Ohkawa, Pappas and Umansky1998). Similar conclusions were made in Kubo et al. (Reference Kubo, Takenaga, Sawada, Nakano, Kobayashi, Higashijima, Asakura and Shimizu2005) after the analysis of the spectroscopic data from the JT-60 tokamak. In contrast to that, the analysis of the experimental data from the AUG tokamak led to the conclusion that the contribution of the MAR to the overall recombination rate is of the order of 10 % (Fantz et al.
Reference Fantz, Reiter, Heger and Coster2001). However, evaluation of the contribution of the MAR to the overall plasma recombination sink from the experimental data requires rather complex post-processing (involving the atomic physics, radiation and neutral transport). Therefore, it is difficult to estimate the error bar of the results obtained.
In divertor modelling, the importance of the MAR is also not uniform among different studies. The results of Kotov & Reiter (Reference Kotov and Reiter2009) show that the contribution of MAR to the total recombination sink can be ${\sim}$
30 %. A dedicated numerical investigation into the MAR process for DIII-D-like plasma (Kukushkin et al.
Reference Kukushkin, Krasheninnikov, Pshenov and Reiter2017) shows a strong isotope dependence of the effective MAR rate. The reaction chain leading to the MAR appearance includes the heavy particle collisions with both electrons (which include vibrational excitation of hydrogenic molecules) and heavy particles. The rates of the latter depend on the relative velocities of the colliding particles, whereas the rate of vibrational excitation by electron impact is sensitive to the structure of the vibrational levels, which depends on the mass of the hydrogenic atom. Both these effects give rise to the isotopic dependence of the overall MAR rate.
${\sim}$
30 %. A dedicated numerical investigation into the MAR process for DIII-D-like plasma (Kukushkin et al.
Reference Kukushkin, Krasheninnikov, Pshenov and Reiter2017) shows a strong isotope dependence of the effective MAR rate. The reaction chain leading to the MAR appearance includes the heavy particle collisions with both electrons (which include vibrational excitation of hydrogenic molecules) and heavy particles. The rates of the latter depend on the relative velocities of the colliding particles, whereas the rate of vibrational excitation by electron impact is sensitive to the structure of the vibrational levels, which depends on the mass of the hydrogenic atom. Both these effects give rise to the isotopic dependence of the overall MAR rate.
Comparison of the H and D plasmas shows that in the latter, the MAR branch involving $D_{2}^{+}$
becomes weaker whereas the
$D_{2}^{+}$
becomes weaker whereas the $D^{-}$
branch (usually neglected in divertor modelling) becomes stronger. The MAR fraction in the total recombination can reach 30 % in the hydrogen plasma, where the both branches are of a comparable weight. The
$D^{-}$
branch (usually neglected in divertor modelling) becomes stronger. The MAR fraction in the total recombination can reach 30 % in the hydrogen plasma, where the both branches are of a comparable weight. The $D^{-}$
branch, for which some crude estimates are only available, can reach even 60 % in the D plasma, but in this case, the
$D^{-}$
branch, for which some crude estimates are only available, can reach even 60 % in the D plasma, but in this case, the $D_{2}^{+}$
branch becomes negligible. This is illustrated in figure 24 where the fraction of the two MAR branches in the total (volumetric plus surface) recombination is shown against the fraction of volumetric recombination in the total recombination.
$D_{2}^{+}$
branch becomes negligible. This is illustrated in figure 24 where the fraction of the two MAR branches in the total (volumetric plus surface) recombination is shown against the fraction of volumetric recombination in the total recombination.
MAR versus volumetric recombination fraction of the total, volumetric plus surface, recombination for two MAR branches in H and D plasmas. The data are from Kukushkin et al. (Reference Kukushkin, Krasheninnikov, Pshenov and Reiter2017).

4.2 Onset of ultimate divertor plasma detachment: the control parameters
As we discussed in the previous sub-section, plasma recombination and the impurity radiation loss are the key processes leading to divertor plasma detachment. However, only plasma recombination can result in ultimate detachment by reducing $\unicode[STIX]{x1D6E4}_{w}$
significantly below
$\unicode[STIX]{x1D6E4}_{w}$
significantly below $\unicode[STIX]{x1D6E4}_{\text{ion}}^{\min }$
. Here we consider the physics determining
$\unicode[STIX]{x1D6E4}_{\text{ion}}^{\min }$
. Here we consider the physics determining $\unicode[STIX]{x1D6E4}_{\text{ion}}^{\min }$
and the parameters that control the onset of ultimate detachment.
$\unicode[STIX]{x1D6E4}_{\text{ion}}^{\min }$
and the parameters that control the onset of ultimate detachment.
The specific energy flux from upstream and the plasma parameters are different in different magnetic flux tubes. Therefore, the onset of detachment and corresponding reduction of the plasma flux to the target occur locally, which is indeed seen in experiment (see figure 25).
Distribution of the plasma flux on the outer target in C-Mod in the attached and detached regimes. Taken from ITER Physics Basis (1999).

To consider the local onset of ultimate detachment we will follow the approach of Krasheninnikov et al. (Reference Krasheninnikov, Kukushkin, Pistunovich and Pozharov1987, Reference Krasheninnikov, Rensink, Rognlien, Kukushkin, Goetz, LaBombard, Lipschultz, Terry and Umansky1999) and consider a SOL magnetic flux tube of the length $\ell _{0}$
, assuming that the energy flux
$\ell _{0}$
, assuming that the energy flux $q_{0}$
enters one end of the tube, whereas the other end contacts the divertor target. To characterize the plasma and neutral gas densities, we apply the ‘closed box’ approximation, where we specify the average concentration of the particles within the given flux tube,
$q_{0}$
enters one end of the tube, whereas the other end contacts the divertor target. To characterize the plasma and neutral gas densities, we apply the ‘closed box’ approximation, where we specify the average concentration of the particles within the given flux tube, $\bar{N}_{ft}$
, which includes both the ions and neutrals:
$\bar{N}_{ft}$
, which includes both the ions and neutrals: $\bar{N}_{ft}=\ell _{0}^{-1}\int _{0}^{\ell _{0}}(n+N)\,\text{d}\ell$
. Here
$\bar{N}_{ft}=\ell _{0}^{-1}\int _{0}^{\ell _{0}}(n+N)\,\text{d}\ell$
. Here $\ell$
is the coordinate along the flux tube and
$\ell$
is the coordinate along the flux tube and $\ell =0$
corresponds to the target. For the regimes with partial detachment, the plasma density near the divertor targets in current tokamaks usually exceeds
$\ell =0$
corresponds to the target. For the regimes with partial detachment, the plasma density near the divertor targets in current tokamaks usually exceeds $10^{14}~\text{cm}^{-3}$
(in the ITER plasma, it should reach
$10^{14}~\text{cm}^{-3}$
(in the ITER plasma, it should reach ${\sim}10^{15}~\text{cm}^{-3}$
). As a result, the ionization mean free path of neutral hydrogen near the targets (
${\sim}10^{15}~\text{cm}^{-3}$
). As a result, the ionization mean free path of neutral hydrogen near the targets ( ${\sim}$
0.1 cm) becomes significantly shorter than the SOL width (
${\sim}$
0.1 cm) becomes significantly shorter than the SOL width ( ${\sim}$
1 cm). Therefore, we can assume that the plasma recycling occurs locally, in the same flux tube, so that
${\sim}$
1 cm). Therefore, we can assume that the plasma recycling occurs locally, in the same flux tube, so that $\bar{N}_{ft}$
is conserved (the closed box!). By using
$\bar{N}_{ft}$
is conserved (the closed box!). By using $\bar{N}_{ft}$
as the input parameter, we allow the natural ‘re-distribution’ of the particle state between the ion and neutral in accordance with the recycling conditions.
$\bar{N}_{ft}$
as the input parameter, we allow the natural ‘re-distribution’ of the particle state between the ion and neutral in accordance with the recycling conditions.
We model the impurity radiation loss by the energy sink localized around the plasma temperature, $T_{\text{rad}}$
, such, that
$T_{\text{rad}}$
, such, that $T_{d}<T_{\text{rad}}\ll T_{\text{up}}$
, where
$T_{d}<T_{\text{rad}}\ll T_{\text{up}}$
, where $T_{\text{up}}=T(\ell _{0})$
and
$T_{\text{up}}=T(\ell _{0})$
and $T_{d}=T(0)$
. We assume that the energy flux from upstream to the target is transported by electron heat conduction, which is typical for the high-recycling conditions. Finally, we consider the case where the plasma recycling region is close to the target,
$T_{d}=T(0)$
. We assume that the energy flux from upstream to the target is transported by electron heat conduction, which is typical for the high-recycling conditions. Finally, we consider the case where the plasma recycling region is close to the target, $0\leqslant \ell \,\tilde{{<}}\,L_{\text{recycl}}$
, so that
$0\leqslant \ell \,\tilde{{<}}\,L_{\text{recycl}}$
, so that $L_{\text{recycl}}<L_{\text{rad}}\ll \ell _{0}$
, where
$L_{\text{recycl}}<L_{\text{rad}}\ll \ell _{0}$
, where $T(L_{\text{rad}})=T_{\text{rad}}$
. For
$T(L_{\text{rad}})=T_{\text{rad}}$
. For $T>T_{\text{rad}}$
the heat flux along the flux tube is conserved and we have
$T>T_{\text{rad}}$
the heat flux along the flux tube is conserved and we have $q_{0}=\hat{\unicode[STIX]{x1D705}}_{e}T^{5/2}(\text{d}T/\text{d}\ell )$
, where
$q_{0}=\hat{\unicode[STIX]{x1D705}}_{e}T^{5/2}(\text{d}T/\text{d}\ell )$
, where $\unicode[STIX]{x1D705}_{e}\equiv \hat{\unicode[STIX]{x1D705}}_{e}T^{5/2}$
is the electron heat conductivity. As the result we find
$\unicode[STIX]{x1D705}_{e}\equiv \hat{\unicode[STIX]{x1D705}}_{e}T^{5/2}$
is the electron heat conductivity. As the result we find
 $$\begin{eqnarray}\displaystyle T(\ell )=T_{\text{rad}}\left\{1+\frac{7}{2}\frac{q_{0}(\ell -L_{\text{rad}})}{\hat{\unicode[STIX]{x1D705}}_{e}T_{\text{rad}}^{7/2}}\right\}^{2/7}. & & \displaystyle\end{eqnarray}$$
Beyond the recycling region, there is no significant plasma flow, so the plasma pressure is constant and equal to the upstream pressure $P_{\text{up}}$
. Therefore, the plasma density,
$P_{\text{up}}$
. Therefore, the plasma density, $n(\ell )$
, satisfies the relation
$n(\ell )$
, satisfies the relation $n(\ell )=P_{\text{up}}/(2T(\ell ))$
(we assume that the electron and ion temperatures are equal). Examining
$n(\ell )=P_{\text{up}}/(2T(\ell ))$
(we assume that the electron and ion temperatures are equal). Examining $n(\ell )$
with
$n(\ell )$
with $T(\ell )$
from (4.4) we find that the main contribution to
$T(\ell )$
from (4.4) we find that the main contribution to $\bar{N}_{ft}$
is made by the
$\bar{N}_{ft}$
is made by the $\ell >L_{\text{rad}}$
region. Moreover, for
$\ell >L_{\text{rad}}$
region. Moreover, for $T_{d}$
not too low, such that the plasma pressure in the recycling region can be considered equal to
$T_{d}$
not too low, such that the plasma pressure in the recycling region can be considered equal to $P_{\text{up}}$
, the whole region of
$P_{\text{up}}$
, the whole region of $\ell <L_{\text{rad}}$
does not contribute much to
$\ell <L_{\text{rad}}$
does not contribute much to $\bar{N}_{ft}$
. As the result, we find the relation
$\bar{N}_{ft}$
. As the result, we find the relation
 $$\begin{eqnarray}\displaystyle \bar{N}_{ft}=\frac{P_{\text{up}}}{2T_{\text{rad}}\ell _{0}}\int _{0}^{\ell _{0}}\left\{1+\frac{7}{2}\frac{q_{0}\ell }{\hat{\unicode[STIX]{x1D705}}_{e}T_{\text{rad}}^{7/2}}\right\}^{-2/7}\text{d}\ell \approx \frac{7}{10}\frac{P_{\text{up}}}{T_{\text{up}}}\equiv \frac{7}{5}n_{\text{up}}, & & \displaystyle\end{eqnarray}$$
where
 $$\begin{eqnarray}\displaystyle T_{\text{up}}\approx \left\{\!(7/2)(q_{0}\ell _{0}/\hat{\unicode[STIX]{x1D705}}_{e})\!\right\}^{2/7}. & & \displaystyle\end{eqnarray}$$
To find the relation between the plasma parameters at the target and $\bar{N}_{ft}$
, we use (2.7), assume that the plasma flows onto the target with the Mach number
$\bar{N}_{ft}$
, we use (2.7), assume that the plasma flows onto the target with the Mach number $M=1$
and take into account the energy losses related to the processes involved in neutral ionization. As the result, we have
$M=1$
and take into account the energy losses related to the processes involved in neutral ionization. As the result, we have
 $$\begin{eqnarray}\displaystyle P_{\text{up}}=\frac{2q_{\text{recycl}}T_{d}}{C_{s}(T_{d})(E_{\text{ion}}+\unicode[STIX]{x1D6FE}_{d}T_{d})}, & & \displaystyle\end{eqnarray}$$
where $q_{\text{recycl}}=q_{0}-q_{\text{rad}}$
is the energy flux entering the recycling region and
$q_{\text{recycl}}=q_{0}-q_{\text{rad}}$
is the energy flux entering the recycling region and $q_{\text{rad}}$
is the impurity radiation loss. Then from (4.5) and (4.6) we find the relation between
$q_{\text{rad}}$
is the impurity radiation loss. Then from (4.5) and (4.6) we find the relation between $\bar{N}_{ft}$
and
$\bar{N}_{ft}$
and $T_{d}$
 $$\begin{eqnarray}\displaystyle \bar{N}_{ft}=\frac{7}{5}\frac{q_{\text{recycl}}T_{d}}{C_{s}(T_{d})(E_{\text{ion}}+\unicode[STIX]{x1D6FE}_{d}T_{d})T_{\text{up}}}\equiv F_{ft}(T_{d}). & & \displaystyle\end{eqnarray}$$
As we see from (4.8), the $F_{ft}(T_{d})$
function increases
$F_{ft}(T_{d})$
function increases $\propto T_{d}^{-1/2}$
with decreasing
$\propto T_{d}^{-1/2}$
with decreasing $T_{d}$
at high
$T_{d}$
at high $T_{d}$
, reaches the maximum at
$T_{d}$
, reaches the maximum at $T_{d}=T_{\ast }\equiv E_{\text{ion}}/\unicode[STIX]{x1D6FE}_{d}$
,
$T_{d}=T_{\ast }\equiv E_{\text{ion}}/\unicode[STIX]{x1D6FE}_{d}$
,
 $$\begin{eqnarray}\displaystyle F_{ft}(T_{\ast })\equiv \bar{N}_{ft}^{\max }=\frac{7}{10}\frac{q_{\text{recycl}}}{\unicode[STIX]{x1D6FE}_{d}T_{\text{up}}C_{s}(T_{\ast })}, & & \displaystyle\end{eqnarray}$$
and decreases $\propto T_{d}^{1/2}$
with decreasing
$\propto T_{d}^{1/2}$
with decreasing $T_{d}$
at
$T_{d}$
at $T_{d}<T_{\ast }$
. Note however that our model is not applicable at low
$T_{d}<T_{\ast }$
. Note however that our model is not applicable at low $T_{d}$
, where the plasma pressure in the recycling region starts to deviate from
$T_{d}$
, where the plasma pressure in the recycling region starts to deviate from $P_{\text{up}}$
. A rather cumbersome analysis for low
$P_{\text{up}}$
. A rather cumbersome analysis for low $T_{d}$
, allowing for such a pressure difference, shows that the
$T_{d}$
, allowing for such a pressure difference, shows that the $F_{ft}(T_{d})$
function starts to increase with decreasing
$F_{ft}(T_{d})$
function starts to increase with decreasing $T_{d}$
at low
$T_{d}$
at low $T_{d}$
(Krasheninnikov et al.
Reference Krasheninnikov, Kukushkin, Pistunovich and Pozharov1987). Moreover, both the analytic expression and 1-D numerical simulations show that
$T_{d}$
(Krasheninnikov et al.
Reference Krasheninnikov, Kukushkin, Pistunovich and Pozharov1987). Moreover, both the analytic expression and 1-D numerical simulations show that $F_{ft}(T_{d})$
has an S-like shape, which for some range of
$F_{ft}(T_{d})$
has an S-like shape, which for some range of $\bar{N}_{ft}$
yields three solutions for
$\bar{N}_{ft}$
yields three solutions for $T_{d}=F_{ft}^{-1}(\bar{N}_{ft})$
. However, only two of these solutions are thermally stable (see figure 26), so that the inverse
$T_{d}=F_{ft}^{-1}(\bar{N}_{ft})$
. However, only two of these solutions are thermally stable (see figure 26), so that the inverse $T_{d}=F_{ft}^{-1}(\bar{N}_{ft})$
dependence bifurcates from
$T_{d}=F_{ft}^{-1}(\bar{N}_{ft})$
dependence bifurcates from $T_{d}\sim T_{\ast }$
to low
$T_{d}\sim T_{\ast }$
to low $T_{d}\sim 1~\text{eV}$
values with increasing
$T_{d}\sim 1~\text{eV}$
values with increasing $\bar{N}_{ft}$
.
$\bar{N}_{ft}$
.
The $T_{d}=F_{ft}^{-1}(\bar{N}_{ft})$
function following from the 1-D model. The stability is considered here in terms of the transport-driven evolution. On the unstable branch, a small perturbation grows and drives the solution away.
$T_{d}=F_{ft}^{-1}(\bar{N}_{ft})$
function following from the 1-D model. The stability is considered here in terms of the transport-driven evolution. On the unstable branch, a small perturbation grows and drives the solution away.

Since at $T_{d}\sim 1~\text{eV}$
the recombination effects that are missing in Krasheninnikov et al. (Reference Krasheninnikov, Kukushkin, Pistunovich and Pozharov1987) become important, one can take
$T_{d}\sim 1~\text{eV}$
the recombination effects that are missing in Krasheninnikov et al. (Reference Krasheninnikov, Kukushkin, Pistunovich and Pozharov1987) become important, one can take $\bar{N}_{ft}\approx \bar{N}_{ft}^{\max }$
as the criterion for the onset of ultimate detachment. Taking into account the relations (4.5) and (4.9), this criterion can be re-cast for deuterium plasma (Krasheninnikov et al.
Reference Krasheninnikov, Rensink, Rognlien, Kukushkin, Goetz, LaBombard, Lipschultz, Terry and Umansky1999) as follows
$\bar{N}_{ft}\approx \bar{N}_{ft}^{\max }$
as the criterion for the onset of ultimate detachment. Taking into account the relations (4.5) and (4.9), this criterion can be re-cast for deuterium plasma (Krasheninnikov et al.
Reference Krasheninnikov, Rensink, Rognlien, Kukushkin, Goetz, LaBombard, Lipschultz, Terry and Umansky1999) as follows
 $$\begin{eqnarray}\displaystyle \frac{P_{\text{up}}}{q_{\text{recycl}}}\,\tilde{{>}}\,\left(\frac{P_{\text{up}}}{q_{\text{recycl}}}\right)_{\text{crit}}\approx \frac{1}{2\unicode[STIX]{x1D6FE}_{d}C_{s}(T_{\ast })}\sim 15\frac{N}{MW}. & & \displaystyle\end{eqnarray}$$
Note that $(P_{\text{up}}/q_{\text{recycl}})_{\text{crit}}\propto \sqrt{M_{i}}$
.
$(P_{\text{up}}/q_{\text{recycl}})_{\text{crit}}\propto \sqrt{M_{i}}$
.
However, this simplified 1-D model does not take into account a possible impact of both redistribution of the ionization source and cross-field plasma transport in the divertor region. Therefore, the expression (4.10) should be verified with more comprehensive 2-D simulations.
Two-dimensional numerical simulations confirm the criterion (4.10) (Krasheninnikov et al.
Reference Krasheninnikov, Kukushkin and Pshenov2016). For example, in figure 27 we show the density dependence of the ion saturation current (the plasma flux to the target) at some magnetic flux tube close to the separatrix as a function of the $P_{\text{up}}/q_{\text{recycl}}$
parameter, found from 2-D numerical simulations for a DIII-D-like plasma. As one can see, in agreement with our analytic estimates, for very different
$P_{\text{up}}/q_{\text{recycl}}$
parameter, found from 2-D numerical simulations for a DIII-D-like plasma. As one can see, in agreement with our analytic estimates, for very different $Q_{\text{SOL}}$
the rollover of the plasma flux starts at nearly the same value of
$Q_{\text{SOL}}$
the rollover of the plasma flux starts at nearly the same value of $P_{\text{up}}/q_{\text{recycl}}$
.
$P_{\text{up}}/q_{\text{recycl}}$
.
Dependence of the ion saturation current (the plasma flux to the target) at some magnetic flux tube close to the separatrix as a function of the $P_{\text{up}}/q_{\text{recycl}}$
parameter, found from 2-D numerical simulations with varying
$P_{\text{up}}/q_{\text{recycl}}$
parameter, found from 2-D numerical simulations with varying $\bar{N}_{D}^{\text{edge}}$
. Taken from Krasheninnikov et al. (Reference Krasheninnikov, Kukushkin and Pshenov2016).
$\bar{N}_{D}^{\text{edge}}$
. Taken from Krasheninnikov et al. (Reference Krasheninnikov, Kukushkin and Pshenov2016).

Moreover, both the analytic estimates and 2-D numerical simulations (Borrass et al.
Reference Borrass, Coster, Reiter and Schneider1997a
; Krasheninnikov et al.
Reference Krasheninnikov, Rensink, Rognlien, Kukushkin, Goetz, LaBombard, Lipschultz, Terry and Umansky1999) show that once ultimate detachment proceeds, both $P_{\text{up}}$
and, correspondingly,
$P_{\text{up}}$
and, correspondingly, $n_{\text{up}}$
saturate at a level close to that determined by (4.10) with increasing the total number of the hydrogen particles in the simulation domain
$n_{\text{up}}$
saturate at a level close to that determined by (4.10) with increasing the total number of the hydrogen particles in the simulation domain $\bar{N}_{D}^{\text{edge}}$
(see figure 28).
$\bar{N}_{D}^{\text{edge}}$
(see figure 28).
Dependence of the divertor temperature and the separatrix plasma density on $\bar{N}_{D}^{\text{edge}}$
found from 2-D numerical simulation with (solid lines) and without (dashed lines) volumetric recombination. Taken from Borrass et al. (Reference Borrass, Coster, Reiter and Schneider1997a
).
$\bar{N}_{D}^{\text{edge}}$
found from 2-D numerical simulation with (solid lines) and without (dashed lines) volumetric recombination. Taken from Borrass et al. (Reference Borrass, Coster, Reiter and Schneider1997a
).

Simultaneously, the cold region occupied by the recombining plasma and neutrals expands and accumulates more and more particles. However, with recombination turned off, both $P_{\text{up}}$
and
$P_{\text{up}}$
and $n_{\text{up}}$
increase with increasing
$n_{\text{up}}$
increase with increasing $\bar{N}_{D}^{\text{edge}}$
, so it is plasma recombination that plays the principal role in saturation of
$\bar{N}_{D}^{\text{edge}}$
, so it is plasma recombination that plays the principal role in saturation of $P_{\text{up}}$
and
$P_{\text{up}}$
and $n_{\text{up}}$
. The physical reason for such a saturation caused by plasma recombination can be explained as follows. Any significant increase of
$n_{\text{up}}$
. The physical reason for such a saturation caused by plasma recombination can be explained as follows. Any significant increase of $P_{\text{up}}$
above (4.10) would cause an increase of the plasma density in the cold region, which would boost plasma recombination and hence the plasma flow from upstream, tending to reduce
$P_{\text{up}}$
above (4.10) would cause an increase of the plasma density in the cold region, which would boost plasma recombination and hence the plasma flow from upstream, tending to reduce $P_{\text{up}}$
. Note that it is plausible that the density limit in tokamaks is related to the edge phenomena including divertor plasma detachment (Borrass, Schneider & Farengo Reference Borrass, Schneider and Farengo1997b
; Maingi et al.
Reference Maingi, Mahdavi, Petrie, Baylor, Jernigan, La Haye, Hyatt, Wade, Watkins and Whyte1999; Greenwald Reference Greenwald2002).
$P_{\text{up}}$
. Note that it is plausible that the density limit in tokamaks is related to the edge phenomena including divertor plasma detachment (Borrass, Schneider & Farengo Reference Borrass, Schneider and Farengo1997b
; Maingi et al.
Reference Maingi, Mahdavi, Petrie, Baylor, Jernigan, La Haye, Hyatt, Wade, Watkins and Whyte1999; Greenwald Reference Greenwald2002).
The impurity radiation loss $q_{\text{rad}}$
and, therefore,
$q_{\text{rad}}$
and, therefore, $q_{\text{recycl}}=q_{0}-q_{\text{rad}}$
depend on both the impurity and plasma densities, whereas the latter one is limited by (4.10). Thus, (4.10) is actually a nonlinear equation limiting both the plasma density and the impurity radiation loss. The limitation on the impurity radiation loss determines the minimum plasma ionization source
$q_{\text{recycl}}=q_{0}-q_{\text{rad}}$
depend on both the impurity and plasma densities, whereas the latter one is limited by (4.10). Thus, (4.10) is actually a nonlinear equation limiting both the plasma density and the impurity radiation loss. The limitation on the impurity radiation loss determines the minimum plasma ionization source $\unicode[STIX]{x1D6E4}_{\text{ion}}^{\min }$
(discussed in the previous sub-section) that can be reached by impurity radiation. Since the heat flux
$\unicode[STIX]{x1D6E4}_{\text{ion}}^{\min }$
(discussed in the previous sub-section) that can be reached by impurity radiation. Since the heat flux $q_{0}$
and the impurity radiation loss depend on the geometrical parameters of the magnetic configuration and on the cross-field and parallel heat and particle transport in the plasma, (4.10) includes all essential features of the edge plasma physics.
$q_{0}$
and the impurity radiation loss depend on the geometrical parameters of the magnetic configuration and on the cross-field and parallel heat and particle transport in the plasma, (4.10) includes all essential features of the edge plasma physics.
Saturation of $P_{\text{up}}$
at the onset of detachment causes an issue with detachment of the inner and outer divertors together. While the plasma pressure on the separatrix stays virtually constant, there is an asymmetry of the power going into the inner and outer divertors, caused by, in particular, the ballooning nature of the edge plasma transport discussed in § 2.7, where most of the power entering the SOL crosses the separatrix at the outboard side of the torus. As the result, the values of the
$P_{\text{up}}$
at the onset of detachment causes an issue with detachment of the inner and outer divertors together. While the plasma pressure on the separatrix stays virtually constant, there is an asymmetry of the power going into the inner and outer divertors, caused by, in particular, the ballooning nature of the edge plasma transport discussed in § 2.7, where most of the power entering the SOL crosses the separatrix at the outboard side of the torus. As the result, the values of the $P_{\text{up}}/q_{\text{recycl}}$
ratio in the inner and outer divertors become different, whereas the value of
$P_{\text{up}}/q_{\text{recycl}}$
ratio in the inner and outer divertors become different, whereas the value of $(P_{\text{up}}/q_{\text{recycl}})_{\text{crit}}$
remains the same. This is the reason why the inner divertor, which usually receives less power, detaches first. Then, in order to detach the outer divertor, the magnitudes of
$(P_{\text{up}}/q_{\text{recycl}})_{\text{crit}}$
remains the same. This is the reason why the inner divertor, which usually receives less power, detaches first. Then, in order to detach the outer divertor, the magnitudes of $q_{\text{recycl}}$
in the inner and outer divertors must equilibrate somehow. There are few factors, which can lead to effective ‘symmetrization’ of inner and outer divertor detachment. One of them is the flow of neutrals from the detached inner divertor to the outer one through the private flux region (Kukushkin & Pacher Reference Kukushkin and Pacher2016). This neutral flux results in the backflow of the plasma in the outer divertor, which conveys the energy from the outer divertor back into the SOL and hence reduces
$q_{\text{recycl}}$
in the inner and outer divertors must equilibrate somehow. There are few factors, which can lead to effective ‘symmetrization’ of inner and outer divertor detachment. One of them is the flow of neutrals from the detached inner divertor to the outer one through the private flux region (Kukushkin & Pacher Reference Kukushkin and Pacher2016). This neutral flux results in the backflow of the plasma in the outer divertor, which conveys the energy from the outer divertor back into the SOL and hence reduces $q_{\text{recycl}}$
there. This is the reason why the dome structures separating the inner and outer divertors in ITER are designed transparent for neutrals. The other factor is the effect of the
$q_{\text{recycl}}$
there. This is the reason why the dome structures separating the inner and outer divertors in ITER are designed transparent for neutrals. The other factor is the effect of the $\boldsymbol{E}\times \boldsymbol{B}$
drift, which, by the proper orientation of the toroidal magnetic field, equilibrates the power split between the outer and inner divertors (although it may even change the preferential direction of the power flux). Finally, when the inner divertor is completely detached and strongly radiating, a MARFE-like structure develops around the X-point and some power that was originally going into the outer divertor is intercepted by this radiating region, thus reducing
$\boldsymbol{E}\times \boldsymbol{B}$
drift, which, by the proper orientation of the toroidal magnetic field, equilibrates the power split between the outer and inner divertors (although it may even change the preferential direction of the power flux). Finally, when the inner divertor is completely detached and strongly radiating, a MARFE-like structure develops around the X-point and some power that was originally going into the outer divertor is intercepted by this radiating region, thus reducing $q_{\text{recycl}}$
in the outer divertor. The different geometry of the inner and outer divertors can also be an important player in ‘symmetrization’ of inner and outer divertor detachment (see § 4.6).
$q_{\text{recycl}}$
in the outer divertor. The different geometry of the inner and outer divertors can also be an important player in ‘symmetrization’ of inner and outer divertor detachment (see § 4.6).
A useful scaling for the onset of detachment and rollover of the plasma flux to the target can be derived from global energy balance discussed in the previous sub-section. Let us go back to (4.2) that relates the power coming to the SOL, the impurity radiation loss and the plasma flux to the targets for the detached divertor conditions. For the case where the rollover of the plasma flux just starts, the plasma recombination sink plays no big role and from (4.2), we have $Q_{\text{SOL}}=E_{\text{ion}}^{\text{eff}}\unicode[STIX]{x1D6E4}_{W}+Q_{\text{imp}}$
. In these conditions, both the plasma and the neutral hydrogen fluxes are not yet in the diffusive mode and can be described in the free-streaming approximation. Therefore, the neutral flux into the ionization region,
$Q_{\text{SOL}}=E_{\text{ion}}^{\text{eff}}\unicode[STIX]{x1D6E4}_{W}+Q_{\text{imp}}$
. In these conditions, both the plasma and the neutral hydrogen fluxes are not yet in the diffusive mode and can be described in the free-streaming approximation. Therefore, the neutral flux into the ionization region, $\unicode[STIX]{x1D6E4}_{H}$
, which balances the plasma flux
$\unicode[STIX]{x1D6E4}_{H}$
, which balances the plasma flux $\unicode[STIX]{x1D6E4}_{W}$
, is simply proportional to
$\unicode[STIX]{x1D6E4}_{W}$
, is simply proportional to $P_{H}\sqrt{1/T_{W}M_{H}}$
, where
$P_{H}\sqrt{1/T_{W}M_{H}}$
, where $P_{H}$
is the neutral hydrogen pressure in the divertor and
$P_{H}$
is the neutral hydrogen pressure in the divertor and $M_{H}$
the hydrogen atom mass. Taking into account the finite lifetime of the impurity ion,
$M_{H}$
the hydrogen atom mass. Taking into account the finite lifetime of the impurity ion, $Q_{\text{imp}}$
can also be expressed in terms of the effective ‘ionization cost’,
$Q_{\text{imp}}$
can also be expressed in terms of the effective ‘ionization cost’, $E_{\text{ion}}^{\text{imp}}$
, that describes the plasma energy loss per an impurity ion during the time between its origination from ionization in the SOL plasma and complete volumetric recombination or surface neutralization (Tokar & Kelly Reference Tokar and Kelly2003). So,
$E_{\text{ion}}^{\text{imp}}$
, that describes the plasma energy loss per an impurity ion during the time between its origination from ionization in the SOL plasma and complete volumetric recombination or surface neutralization (Tokar & Kelly Reference Tokar and Kelly2003). So, $Q_{\text{imp}}=E_{\text{ion}}^{\text{imp}}\unicode[STIX]{x1D6E4}_{\text{imp}}$
, where
$Q_{\text{imp}}=E_{\text{ion}}^{\text{imp}}\unicode[STIX]{x1D6E4}_{\text{imp}}$
, where $\unicode[STIX]{x1D6E4}_{\text{imp}}$
is the impurity flux into the ionization region, which is proportional to
$\unicode[STIX]{x1D6E4}_{\text{imp}}$
is the impurity flux into the ionization region, which is proportional to $P_{\text{imp}}\sqrt{1/T_{W}M_{\text{imp}}}$
. Here
$P_{\text{imp}}\sqrt{1/T_{W}M_{\text{imp}}}$
. Here $P_{\text{imp}}$
is the neutral impurity pressure in the divertor and
$P_{\text{imp}}$
is the neutral impurity pressure in the divertor and $M_{\text{imp}}$
the impurity atom mass. Thus, we see that at the onset of plasma detachment and rollover of the plasma flux to the target,
$M_{\text{imp}}$
the impurity atom mass. Thus, we see that at the onset of plasma detachment and rollover of the plasma flux to the target,
 $$\begin{eqnarray}\displaystyle (Q_{\text{SOL}})_{\text{crit}}\equiv C_{\det }\left\{P_{H}+(E_{\text{ion}}^{\text{imp}}/E_{\text{ion}}^{\text{eff}})\sqrt{M_{H}/M_{\text{imp}}}P_{\text{imp}}\right\}~\tilde{{>}}~Q_{\text{SOL}}, & & \displaystyle\end{eqnarray}$$
where $C_{\det }$
is a normalization constant that can depend on both the magnetic topology and the geometrical configuration of the divertor region. From Tokar & Kelly (Reference Tokar and Kelly2003), we find the estimate
$C_{\det }$
is a normalization constant that can depend on both the magnetic topology and the geometrical configuration of the divertor region. From Tokar & Kelly (Reference Tokar and Kelly2003), we find the estimate $E_{\text{ion}}^{\text{imp}}\sim 3~\text{keV}$
for the low-Z impurities (although this value can depend on the magnetic topology and the geometrical configuration of the divertor). Then, taking
$E_{\text{ion}}^{\text{imp}}\sim 3~\text{keV}$
for the low-Z impurities (although this value can depend on the magnetic topology and the geometrical configuration of the divertor). Then, taking $E_{\text{ion}}^{\text{eff}}\sim 40~\text{eV}$
and
$E_{\text{ion}}^{\text{eff}}\sim 40~\text{eV}$
and $M_{H}/M_{\text{imp}}\sim 0.1$
, from (4.11) we find
$M_{H}/M_{\text{imp}}\sim 0.1$
, from (4.11) we find
 $$\begin{eqnarray}\displaystyle \left(Q_{\text{SOL}}\right)_{\text{crit}}\propto P_{H}+25\times P_{\text{imp}}, & & \displaystyle\end{eqnarray}$$
which is in the same ballpark with the recent experimental data from AUG (see (1) from Kallenbach et al. Reference Kallenbach2015). Nonetheless, more studies, both experimental and theoretical and computational, are needed to verify this scaling and to take into account the effects of the magnetic topology and divertor geometry.
The onset of divertor plasma detachment can also be considered from the point of view of the ‘similarity’ law that can be tracked back to the Buckingham Pi theorem. For the tokamak plasmas, the similarity approach was originally developed for the core plasma confinement, see e.g. Kadomtsev (Reference Kadomtsev1975), Connor & Taylor (Reference Connor and Taylor1977), Cordey et al. (Reference Cordey1996)). It was shown that the core plasma confinement, leaving aside the geometry, can be described by three main dimensionless parameters: $\unicode[STIX]{x1D70C}_{\ast }$
, the ratio of the ion gyro-radius to the tokamak major radius
$\unicode[STIX]{x1D70C}_{\ast }$
, the ratio of the ion gyro-radius to the tokamak major radius $R$
;
$R$
; $\unicode[STIX]{x1D708}_{\ast }$
, the ratio of the characteristic connection length of the magnetic field line to the Coulomb mean free path of the charged particles (this parameter reflects the assumption of the binary collisions between the plasma particles); and
$\unicode[STIX]{x1D708}_{\ast }$
, the ratio of the characteristic connection length of the magnetic field line to the Coulomb mean free path of the charged particles (this parameter reflects the assumption of the binary collisions between the plasma particles); and $\unicode[STIX]{x1D6FD}$
, the ratio of the plasma pressure to the magnetic one. The full set of the dimensionless parameters includes also the electron to ion mass ratio, the atomic weight of the ions, etc. which are not important for the main conclusions. Essentially, it was assumed that the atomic physics effects (e.g. the radiation loss) are not important and the fourth principal dimensionless parameter, the ratio of the Debye length to
$\unicode[STIX]{x1D6FD}$
, the ratio of the plasma pressure to the magnetic one. The full set of the dimensionless parameters includes also the electron to ion mass ratio, the atomic weight of the ions, etc. which are not important for the main conclusions. Essentially, it was assumed that the atomic physics effects (e.g. the radiation loss) are not important and the fourth principal dimensionless parameter, the ratio of the Debye length to $R$
, was dismissed for the reason for its smallness. Thus, within the approximations made, one should expect similar behaviour of the core plasma in two different tokamak experiments if they have the same values of the
$R$
, was dismissed for the reason for its smallness. Thus, within the approximations made, one should expect similar behaviour of the core plasma in two different tokamak experiments if they have the same values of the $\unicode[STIX]{x1D70C}_{\ast }$
,
$\unicode[STIX]{x1D70C}_{\ast }$
, $\unicode[STIX]{x1D708}_{\ast }$
and
$\unicode[STIX]{x1D708}_{\ast }$
and $\unicode[STIX]{x1D6FD}$
parameters.
$\unicode[STIX]{x1D6FD}$
parameters.
Such an approach was extended later to the edge plasma (Lackner Reference Lackner1994). Since the atomic physics effects (e.g. impurity radiation) play an important role in the edge, a new dimensionless parameter, $\unicode[STIX]{x1D700}_{\ast }$
, the ratio of the plasma temperature to the effective energy of the atomic processes (e.g. the hydrogen ionization potential), was introduced in Lackner (Reference Lackner1994). It was also assumed that only binary collisions involving the charged and neutral particles are important. In addition, it was postulated that the electromagnetic effects associated with a plasma
$\unicode[STIX]{x1D700}_{\ast }$
, the ratio of the plasma temperature to the effective energy of the atomic processes (e.g. the hydrogen ionization potential), was introduced in Lackner (Reference Lackner1994). It was also assumed that only binary collisions involving the charged and neutral particles are important. In addition, it was postulated that the electromagnetic effects associated with a plasma $\unicode[STIX]{x1D6FD}$
that is low in the SOL are not important in the SOL plasma. As a result, if the magnetic topology, the PFC geometry, the impurity fraction and composition and the PFC material are kept the same, then the
$\unicode[STIX]{x1D6FD}$
that is low in the SOL are not important in the SOL plasma. As a result, if the magnetic topology, the PFC geometry, the impurity fraction and composition and the PFC material are kept the same, then the $\unicode[STIX]{x1D70C}_{\ast }$
,
$\unicode[STIX]{x1D70C}_{\ast }$
, $\unicode[STIX]{x1D708}_{\ast }$
and
$\unicode[STIX]{x1D708}_{\ast }$
and $\unicode[STIX]{x1D700}_{\ast }$
parameters describe the edge plasma physics phenomena, at least to the point where the three-body plasma recombination becomes important. Based on these assumptions, it was concluded that one should expect a similar behaviour of the edge plasma in two different tokamak experiments, if the
$\unicode[STIX]{x1D700}_{\ast }$
parameters describe the edge plasma physics phenomena, at least to the point where the three-body plasma recombination becomes important. Based on these assumptions, it was concluded that one should expect a similar behaviour of the edge plasma in two different tokamak experiments, if the $Q_{\text{SOL}}/R$
ratio is the same.
$Q_{\text{SOL}}/R$
ratio is the same.
However, the binary collision approximation, made in Lackner (Reference Lackner1994), actually fails starting at relatively low plasma density, $\tilde{{>}}10^{13}~\text{cm}^{-3}$
, which is well below the plasma densities at which plasma recombination (including the three-body recombination) starts to play a significant role. The reason for this is the ‘multi-step’ effects in the processes of excitation and ionization of the neutrals and ions (Post Reference Post1995). Such processes involve both radiative decay (which can be considered a ‘one-body’ process) and binary excitation/de-excitation. As a result, the rate constants of the ‘binary’ atomic processes (e.g. ionization by electron impact) turn out to depend on the plasma density and the scaling
$\tilde{{>}}10^{13}~\text{cm}^{-3}$
, which is well below the plasma densities at which plasma recombination (including the three-body recombination) starts to play a significant role. The reason for this is the ‘multi-step’ effects in the processes of excitation and ionization of the neutrals and ions (Post Reference Post1995). Such processes involve both radiative decay (which can be considered a ‘one-body’ process) and binary excitation/de-excitation. As a result, the rate constants of the ‘binary’ atomic processes (e.g. ionization by electron impact) turn out to depend on the plasma density and the scaling $Q_{\text{SOL}}/R$
fails. This was demonstrated clearly with 2-D numerical simulations (Catto, Knoll & Krasheninnikov Reference Catto, Knoll and Krasheninnikov1996b
). Trapping of the radiation (in particular, of the hydrogen
$Q_{\text{SOL}}/R$
fails. This was demonstrated clearly with 2-D numerical simulations (Catto, Knoll & Krasheninnikov Reference Catto, Knoll and Krasheninnikov1996b
). Trapping of the radiation (in particular, of the hydrogen $Ly_{\unicode[STIX]{x1D6FC}}$
and
$Ly_{\unicode[STIX]{x1D6FC}}$
and $Ly_{\unicode[STIX]{x1D6FD}}$
lines) in the edge plasmas, which was predicted long ago (Krasheninnikov & Pigarov Reference Krasheninnikov and Pigarov1987) and observed in experiments (see e.g. Terry et al.
Reference Terry, Lipschultz, Pigarov, Krasheninnikov, LaBombard, Lumma, Ohkawa, Pappas and Umansky1998), also causes violation of the binary collision approximation.
$Ly_{\unicode[STIX]{x1D6FD}}$
lines) in the edge plasmas, which was predicted long ago (Krasheninnikov & Pigarov Reference Krasheninnikov and Pigarov1987) and observed in experiments (see e.g. Terry et al.
Reference Terry, Lipschultz, Pigarov, Krasheninnikov, LaBombard, Lumma, Ohkawa, Pappas and Umansky1998), also causes violation of the binary collision approximation.
Some other similarity scalings focused on particular issues, such as the divertor performance, plasma–wall interactions, the onset of detachment, etc. were introduced over time (Catto, Krasheninnikov & Connor Reference Catto, Krasheninnikov and Connor1996a ; Hutchinson & Vlases Reference Hutchinson and Vlases1996; Krasheninnikov Reference Krasheninnikov1996; Knoll, Catto & Krasheninnikov Reference Knoll, Catto and Krasheninnikov1998; Lackner, Coster & Schneider Reference Lackner, Coster and Schneider1998; Whyte et al. Reference Whyte, Olynyk, Barnard, Bonoli, Bromberg, Garrett, Haakonsen, Hartwig, Mumgaard and Podpaly2012). However, it is becoming clear that due to the complexity of the edge plasma physics, the validity of the similarity scalings that are usually derived by making significant simplifications is doubtful, unless, at least, comprehensive numerical simulations back them.
4.3 Transition to the detached divertor regime
In this sub-section we consider the issues related to the transition to the detached regime (i.e. how the evolution from the attached to detached regime proceeds: gradually or bifurcation-like) and the stability of the detached plasma. Considering the stability, we are interested in temporal variation of the parameters of the detached plasma on both the meso- and micro- spatial scales. Relatively slow, mesoscale variations (e.g. self-sustained oscillations) of the plasma parameters can be associated with impurity radiation (e.g. MARFE) or some transport phenomena. Much faster, microscale instabilities that are related to peculiarities of the detached plasmas (e.g. the very low temperature in the divertors) and that are suppressed in the attached regime can result in turbulence phenomena in the detached plasma.
The available experimental data demonstrate that both gradual evolution and bifurcation-like transition to the detached divertor regime are possible. In figure 29, one can see a bifurcation-like change of the electron temperature at the outer strike point as the separatrix plasma density in DIII-D increases (McLean et al. Reference McLean2015). On the contrary, in JET with the ITER-like wall (ILW), a gradual evolution of the plasma flux on both the inner and outer divertor targets along with the increase of the core plasma density is observed (Huber et al. Reference Huber2013), figure 30.
Bifurcation-like transition to ultimate detachment in the DIII-D tokamak with increasing separatrix plasma density (McLean et al. Reference McLean2015).

Evolution of the plasma parameters in JET-ILW (Huber et al. Reference Huber2013).

In the literature, the bifurcation-like transition to detachment is usually attributed to impurity radiation (see e.g. Hutchinson Reference Hutchinson1994; Krasheninnikov Reference Krasheninnikov1997). One of the reasons for this is that such a transition is often accompanied by a formation of a strongly radiating structure in the vicinity of the X-point, similar to MARFE, which, as believed widely, is a nonlinear stage of the radiation–condensation instability driven by impurity radiation (see e.g. Lipschultz et al. Reference Lipschultz, LaBombard, Marmar, Pickrell, Terry, Watterson and Wolfe1984; Neuhauser, Schneider & Wunderlich Reference Neuhauser, Schneider and Wunderlich1986; Drake Reference Drake1987).
Unfortunately, the simplified models do not allow for many effects of the impurity dynamics; therefore, their conclusions should be taken with caution. In particular, 2-D numerical simulations of detachment in a DIII-D-like plasma show that a gradual increase of the impurity (neon) content results in a smooth reduction of the plasma flux to the target and propagation of the detachment front towards the X-point (Krasheninnikov, Kukushkin & Pshenov Reference Krasheninnikov, Kukushkin and Pshenov2017a ). The reason for this is progressive accumulation of the impurity in the cold, virtually non-radiative divertor region that expands gradually. This effect plays the role of a negative feedback and prevents development of the thermal instability.
However, transition to ultimate detachment depends on $q_{\text{recycl}}$
, which depends on the SOL width
$q_{\text{recycl}}$
, which depends on the SOL width $\unicode[STIX]{x1D6E5}_{\text{SOL}}$
– that is, on the cross-field plasma transport upstream, and on the impurity radiation loss. It is known for a long time that in L-mode, cross-field transport is increasing at high plasma density when approaching detachment (see e.g. Umansky et al.
Reference Umansky, Krasheninnikov, LaBombard and Terry1998; LaBombard et al.
Reference LaBombard, Umansky, Boivin, Goetz, Hughes, Lipschultz, Mossessian, Pitcher and Terry2000; Greenwald Reference Greenwald2002; Rudakov et al.
Reference Rudakov2005; Wiesen et al.
Reference Wiesen, Fundamenski, Wischmeier, Groth, Brezinsek and Naulin2011. Usually it is related to the increased contribution of intermittent blobby plasma transport (see Zweben et al.
Reference Zweben, Boedo, Grulke, Hidalgo, LaBombard, Maqueda, Scarin and Terry2007; Krasheninnikov et al.
Reference Krasheninnikov, D’Ippolito and Myra2008; D’Ippolito et al.
Reference D’Ippolito, Myra and Zweben2011, and the references therein). However, recent experimental data (Sun et al.
Reference Sun, Wolfrum, Eich, Kurzan, Potzel and Stroth2015) suggest that even in H-mode,
$\unicode[STIX]{x1D6E5}_{\text{SOL}}$
– that is, on the cross-field plasma transport upstream, and on the impurity radiation loss. It is known for a long time that in L-mode, cross-field transport is increasing at high plasma density when approaching detachment (see e.g. Umansky et al.
Reference Umansky, Krasheninnikov, LaBombard and Terry1998; LaBombard et al.
Reference LaBombard, Umansky, Boivin, Goetz, Hughes, Lipschultz, Mossessian, Pitcher and Terry2000; Greenwald Reference Greenwald2002; Rudakov et al.
Reference Rudakov2005; Wiesen et al.
Reference Wiesen, Fundamenski, Wischmeier, Groth, Brezinsek and Naulin2011. Usually it is related to the increased contribution of intermittent blobby plasma transport (see Zweben et al.
Reference Zweben, Boedo, Grulke, Hidalgo, LaBombard, Maqueda, Scarin and Terry2007; Krasheninnikov et al.
Reference Krasheninnikov, D’Ippolito and Myra2008; D’Ippolito et al.
Reference D’Ippolito, Myra and Zweben2011, and the references therein). However, recent experimental data (Sun et al.
Reference Sun, Wolfrum, Eich, Kurzan, Potzel and Stroth2015) suggest that even in H-mode, $\unicode[STIX]{x1D6E5}_{\text{SOL}}$
increases during evolution to detachment. The reason for such an increase is not clear at the moment, although some data suggest that it might be related to the changes in the blob dynamics in the SOL – a low temperature effect (see e.g. Carralero et al.
Reference Carralero2014). Nonetheless, this way or another, increasing cross-field transport creates a positive feedback: an increase of
$\unicode[STIX]{x1D6E5}_{\text{SOL}}$
increases during evolution to detachment. The reason for such an increase is not clear at the moment, although some data suggest that it might be related to the changes in the blob dynamics in the SOL – a low temperature effect (see e.g. Carralero et al.
Reference Carralero2014). Nonetheless, this way or another, increasing cross-field transport creates a positive feedback: an increase of $\unicode[STIX]{x1D6E5}_{\text{SOL}}$
promotes detachment, which causes a further increase of
$\unicode[STIX]{x1D6E5}_{\text{SOL}}$
promotes detachment, which causes a further increase of $\unicode[STIX]{x1D6E5}_{\text{SOL}}$
. As a result, the transition to detachment may have a bifurcation-like character. Indeed, 2-D SOLPS simulations demonstrate such a bifurcation when the cross-field plasma transport increases with a decrease of the plasma temperature near the targets (Krasheninnikov et al.
Reference Krasheninnikov, Kukushkin, Wonjae, Phsenov, Smirnov, Smolyakov, Stepanenko and Zhang2017b
).
$\unicode[STIX]{x1D6E5}_{\text{SOL}}$
. As a result, the transition to detachment may have a bifurcation-like character. Indeed, 2-D SOLPS simulations demonstrate such a bifurcation when the cross-field plasma transport increases with a decrease of the plasma temperature near the targets (Krasheninnikov et al.
Reference Krasheninnikov, Kukushkin, Wonjae, Phsenov, Smirnov, Smolyakov, Stepanenko and Zhang2017b
).
Apart from this, it was shown that the impurity radiation loss and, therefore, $q_{\text{recycl}}$
can be affected strongly by cross-field plasma transport in the low temperature divertor region. As a result, contrary to the 1-D calculations of Post et al. (Reference Post, Putvinskaya, Perkins and Nevins1995), the bulk of the impurity radiation loss can come from the low temperature divertor region (Krasheninnikov & Knoll Reference Krasheninnikov and Knoll1996; Krasheninnikov Reference Krasheninnikov1997). Therefore, the variation of anomalous plasma transport in the divertor during the evolution to detachment may also cause a bifurcation-like transition. As we see, the feedback of anomalous cross-field plasma transport in both the relatively hot upstream region of the SOL and in the relatively cold divertor plasma can play an important role in the transition to detachment. In most of the 2-D numerical simulations performed so far (in particular, in support of ITER), the cross-field plasma transport coefficients are assumed to be constant in time. A bifurcation-like transition to detachment may also be related to a breakdown of the quasi-equilibrium between the absorption and desorption processes on the plasma-facing components (Krasheninnikov et al.
Reference Krasheninnikov, Kukushkin, Wonjae, Phsenov, Smirnov, Smolyakov, Stepanenko and Zhang2017b
). A large amount of hydrogen, at least in carbon wall tokamaks, is usually stored in the first wall material. As a result, such a breakdown caused by a variation of the parameters of both the plasma and the plasma-facing components may cause a massive gas release from the wall and a bifurcation-like jump to detachment. Such a jump was indeed observed experimentally in long pulse discharges (Nakano et al.
Reference Nakano, Asakura, Takenaga, Kubo, Miura, Shimizu, Konoshima, Masaki and Higashijima2006).
$q_{\text{recycl}}$
can be affected strongly by cross-field plasma transport in the low temperature divertor region. As a result, contrary to the 1-D calculations of Post et al. (Reference Post, Putvinskaya, Perkins and Nevins1995), the bulk of the impurity radiation loss can come from the low temperature divertor region (Krasheninnikov & Knoll Reference Krasheninnikov and Knoll1996; Krasheninnikov Reference Krasheninnikov1997). Therefore, the variation of anomalous plasma transport in the divertor during the evolution to detachment may also cause a bifurcation-like transition. As we see, the feedback of anomalous cross-field plasma transport in both the relatively hot upstream region of the SOL and in the relatively cold divertor plasma can play an important role in the transition to detachment. In most of the 2-D numerical simulations performed so far (in particular, in support of ITER), the cross-field plasma transport coefficients are assumed to be constant in time. A bifurcation-like transition to detachment may also be related to a breakdown of the quasi-equilibrium between the absorption and desorption processes on the plasma-facing components (Krasheninnikov et al.
Reference Krasheninnikov, Kukushkin, Wonjae, Phsenov, Smirnov, Smolyakov, Stepanenko and Zhang2017b
). A large amount of hydrogen, at least in carbon wall tokamaks, is usually stored in the first wall material. As a result, such a breakdown caused by a variation of the parameters of both the plasma and the plasma-facing components may cause a massive gas release from the wall and a bifurcation-like jump to detachment. Such a jump was indeed observed experimentally in long pulse discharges (Nakano et al.
Reference Nakano, Asakura, Takenaga, Kubo, Miura, Shimizu, Konoshima, Masaki and Higashijima2006).
Unfortunately, our understanding of many important issues such as the anomalous transport in the edge plasma (in particular, in the divertor volume), as well as the physics of the hydrogen absorption and desorption processes, which appear to have a pronounced impact not only on the heat load onto the divertor targets, but also on the detachment dynamics, is very limited. At present, we can make no reliable prediction on the impact of these effects on the transition of the edge plasma to detachment. More work, both theoretical and experimental, is needed to close these important gaps in our knowledge of the edge plasma physics.
4.4 Transient effects in the detached divertor regime
Plasma parameters in the detached divertor regime do not necessarily stay constant in time, even for the case where the plasma heating and hydrogen and impurity puffing are fixed. Apart from the fluctuations caused by the ‘standard’ edge plasma turbulence including blobs that are originated somewhere inside the separatrix, the peculiar conditions in the SOL plasma contacting the material surfaces can drive some specific instabilities (see e.g. Nedospasov Reference Nedospasov1989; Berk et al.
Reference Berk, Cohen, Ryutov, Tsidulko and Xu1993; Cohen & Ryutov Reference Cohen and Ryutov1996). Moreover, some peculiarities of the detached plasmas (including the detachment front, strong impurity radiation, the large volume of a cold, ${\sim}$
eV, plasma, etc.) can result in instabilities that do not show up in the attached regime. And indeed, some plasma parameter fluctuations were observed experimentally only in the detached (or semi-detached) regime in both the linear divertor simulators (see e.g. Matsubara et al.
Reference Matsubara, Watanabe, Sugimoto, Sudo and Sato2006; Hayashi et al.
Reference Hayashi, Ohno, Kajita and Tanaka2016) and the tokamaks (see e.g. Petrie et al.
Reference Petrie1992; Asakura et al.
Reference Asakura, Hosogane, Tsuji-Iio, Itami, Shimizu and Shimada1996; Wenzel et al.
Reference Wenzel, Bachmann, Carlson, Laux, Napiontek and Weinlich1997; Loarte et al.
Reference Loarte, Monk, Kukushkin, Righi, Campbell, Conway and Maggi1999; Potzel et al.
Reference Potzel, Wischmeier, Bernert, Dux, Mul̈ler and Scarabosio2013; Reimold et al.
Reference Reimold, Wischmeier, Bernert, Potzel, Kallenbach, Mul̈ler, Sieglin and Stroth2015b
). In the tokamaks, the frequency of these fluctuations varies from device to device and spans over a range from
${\sim}$
eV, plasma, etc.) can result in instabilities that do not show up in the attached regime. And indeed, some plasma parameter fluctuations were observed experimentally only in the detached (or semi-detached) regime in both the linear divertor simulators (see e.g. Matsubara et al.
Reference Matsubara, Watanabe, Sugimoto, Sudo and Sato2006; Hayashi et al.
Reference Hayashi, Ohno, Kajita and Tanaka2016) and the tokamaks (see e.g. Petrie et al.
Reference Petrie1992; Asakura et al.
Reference Asakura, Hosogane, Tsuji-Iio, Itami, Shimizu and Shimada1996; Wenzel et al.
Reference Wenzel, Bachmann, Carlson, Laux, Napiontek and Weinlich1997; Loarte et al.
Reference Loarte, Monk, Kukushkin, Righi, Campbell, Conway and Maggi1999; Potzel et al.
Reference Potzel, Wischmeier, Bernert, Dux, Mul̈ler and Scarabosio2013; Reimold et al.
Reference Reimold, Wischmeier, Bernert, Potzel, Kallenbach, Mul̈ler, Sieglin and Stroth2015b
). In the tokamaks, the frequency of these fluctuations varies from device to device and spans over a range from ${\sim}$
10 Hz (Loarte et al.
Reference Loarte, Monk, Kukushkin, Righi, Campbell, Conway and Maggi1999) to
${\sim}$
10 Hz (Loarte et al.
Reference Loarte, Monk, Kukushkin, Righi, Campbell, Conway and Maggi1999) to ${\sim}$
10 kHz (Potzel et al.
Reference Potzel, Wischmeier, Bernert, Dux, Mul̈ler and Scarabosio2013), which suggests that the physical mechanisms of these fluctuations are different.
${\sim}$
10 kHz (Potzel et al.
Reference Potzel, Wischmeier, Bernert, Dux, Mul̈ler and Scarabosio2013), which suggests that the physical mechanisms of these fluctuations are different.
At the moment, studies devoted to detailed theoretical assessment of the mechanism(-s) of these experimentally observed fluctuations of the divertor plasma parameters, or to detailed comparison of the available theoretical models and the numerical simulation results with the available experimental data are very few and rare.
In Smirnov et al. (Reference Smirnov, Kukushkin, Krasheninnikov, Pigarov and Rognlien2016b
), two different types of relatively slow ( ${\sim}$
100 Hz) self-sustained oscillations (SSO) of the edge plasma parameters were found in numerical simulations of the ITER-like plasma and their mechanisms were identified. These mechanisms are related to the high- or low-Z impurity dynamics and radiation loss. The high-Z impurity (tungsten)-driven SSO were observed close to the X-point. tungsten was introduced in the edge plasma by ablation of the dust particles injected from the divertor targets to simulate a possible impact of the ELMs. The physics of these SSO is related to the effect of the thermal force acting on the impurity ions by the radiation–condensation instability. The thermal force is pushing the impurity ions towards the high temperature regions, which switches the radiation–condensation instability from the aperiodic instability to a slowly growing travelling wave (Morozov & Herrera Reference Morozov and Herrera1996) that in the nonlinear phase transforms into the SSO. The physics of the SSO driven by the low-Z impurity (nitrogen) appears to be similar to that behind the SSO discussed in Krasheninnikov et al. (Reference Krasheninnikov, Kukushkin, Pistunovich and Pozharov1987) for the pure hydrogen plasma and can be described as follows. The nitrogen neutrals in the divertor volume get ionized predominantly in the relatively dense and hot plasma region and then flow along the magnetic field lines. As a result, both the fraction of the N ions and the radiation loss within that flux tube increase. This causes the reduction of the plasma temperature and the N ionization rate within the flux tube. The correlation of the waveforms of plasma cooling, N transport and ionization results in a development of the SSO.
${\sim}$
100 Hz) self-sustained oscillations (SSO) of the edge plasma parameters were found in numerical simulations of the ITER-like plasma and their mechanisms were identified. These mechanisms are related to the high- or low-Z impurity dynamics and radiation loss. The high-Z impurity (tungsten)-driven SSO were observed close to the X-point. tungsten was introduced in the edge plasma by ablation of the dust particles injected from the divertor targets to simulate a possible impact of the ELMs. The physics of these SSO is related to the effect of the thermal force acting on the impurity ions by the radiation–condensation instability. The thermal force is pushing the impurity ions towards the high temperature regions, which switches the radiation–condensation instability from the aperiodic instability to a slowly growing travelling wave (Morozov & Herrera Reference Morozov and Herrera1996) that in the nonlinear phase transforms into the SSO. The physics of the SSO driven by the low-Z impurity (nitrogen) appears to be similar to that behind the SSO discussed in Krasheninnikov et al. (Reference Krasheninnikov, Kukushkin, Pistunovich and Pozharov1987) for the pure hydrogen plasma and can be described as follows. The nitrogen neutrals in the divertor volume get ionized predominantly in the relatively dense and hot plasma region and then flow along the magnetic field lines. As a result, both the fraction of the N ions and the radiation loss within that flux tube increase. This causes the reduction of the plasma temperature and the N ionization rate within the flux tube. The correlation of the waveforms of plasma cooling, N transport and ionization results in a development of the SSO.
A theoretical model (based on the current–convective instability), suitable for explanation of the rather fast divertor plasma fluctuations observed in Potzel et al. (Reference Potzel, Wischmeier, Bernert, Dux, Mul̈ler and Scarabosio2013) for the case where the inner divertor is detached while the outer one is still attached, was suggested in Krasheninnikov & Smolyakov (Reference Krasheninnikov and Smolyakov2016). The drive for this instability is the large temperature difference between the vicinities of the inner detached and outer attached targets. This temperature difference causes the onset of a large electrostatic potential drop (Harbour Reference Harbour1988; Staebler & Hinton Reference Staebler and Hinton1989) and, correspondingly, the electric current through the detached plasma of the inner divertor. This current combined with the non-uniformity of the resistivity of the detached plasma along the magnetic field lines can drive the current–convective instability (see e.g. Kadomtsev Reference Kadomtsev1961) in the inner divertor with subsequent fluctuations of the radiation loss, similar to those observed in experiments. Usually, the current–convective (or ‘rippling’) mode is stabilized in tokamaks due to the high electron thermal conductivity along the magnetic field, which irons out quickly the electron temperature inhomogeneity driving this instability (see e.g. Carreras et al.
Reference Carreras, Gaffney, Hicks and Callen1982). However, for the case of the cold ( ${\sim}$
1 eV) detached plasma, the electron thermal conductivity becomes low and unable to suppress the current–convective instability completely. The estimates for the frequency of the fluctuations due to the current–convective instability in the inner divertor yield
${\sim}$
1 eV) detached plasma, the electron thermal conductivity becomes low and unable to suppress the current–convective instability completely. The estimates for the frequency of the fluctuations due to the current–convective instability in the inner divertor yield ${\sim}$
10 kHz (Krasheninnikov & Smolyakov Reference Krasheninnikov and Smolyakov2016), which is close to the experimental observations. Once the outer divertor detaches also, the difference in the plasma temperature between the inner and outer targets disappears and the driving force for the current–convective instability causing the oscillations of the radiation loss vanishes. This feature is indeed observed in the experiments (Potzel et al.
Reference Potzel, Wischmeier, Bernert, Dux, Mul̈ler and Scarabosio2013). Three-dimensional simulations of the nonlinear stage of the current–convective instability, performed with the BOUT
${\sim}$
10 kHz (Krasheninnikov & Smolyakov Reference Krasheninnikov and Smolyakov2016), which is close to the experimental observations. Once the outer divertor detaches also, the difference in the plasma temperature between the inner and outer targets disappears and the driving force for the current–convective instability causing the oscillations of the radiation loss vanishes. This feature is indeed observed in the experiments (Potzel et al.
Reference Potzel, Wischmeier, Bernert, Dux, Mul̈ler and Scarabosio2013). Three-dimensional simulations of the nonlinear stage of the current–convective instability, performed with the BOUT $++$
code for the plasma parameters relevant for the detached inner divertor in AUG, demonstrated a good agreement between the simulated and experimental frequency spectra (Stepanenko & Krasheninnikov Reference Stepanenko and Krasheninnikov2017). An alternative explanation of these experimental data was proposed in Manz et al. (Reference Manz, Potzel, Reimold and Wischmeier2017). It is based on the interplay between the ionization–recombination instability of the detachment front (Krasheninnikov et al.
Reference Krasheninnikov, Rensink, Rognlien, Kukushkin, Goetz, LaBombard, Lipschultz, Terry and Umansky1999) and the neutral dynamics. For the case where both divertors are detached, stabilization of the oscillations is then explained by localization of the ionization region above the X-point and sustaining this ionization source by strong neutral recycling at the outer divertor nose, caused by enhanced blobby transport at the outer side of the torus. However, more experiments, simulations and comparisons of the experimental and theoretical results are needed to make a definite conclusion on the physics of these oscillations in the detached plasmas.
$++$
code for the plasma parameters relevant for the detached inner divertor in AUG, demonstrated a good agreement between the simulated and experimental frequency spectra (Stepanenko & Krasheninnikov Reference Stepanenko and Krasheninnikov2017). An alternative explanation of these experimental data was proposed in Manz et al. (Reference Manz, Potzel, Reimold and Wischmeier2017). It is based on the interplay between the ionization–recombination instability of the detachment front (Krasheninnikov et al.
Reference Krasheninnikov, Rensink, Rognlien, Kukushkin, Goetz, LaBombard, Lipschultz, Terry and Umansky1999) and the neutral dynamics. For the case where both divertors are detached, stabilization of the oscillations is then explained by localization of the ionization region above the X-point and sustaining this ionization source by strong neutral recycling at the outer divertor nose, caused by enhanced blobby transport at the outer side of the torus. However, more experiments, simulations and comparisons of the experimental and theoretical results are needed to make a definite conclusion on the physics of these oscillations in the detached plasmas.
Some of the fluctuations observed in the simulations discussed above cause a significant (up to ${\sim}$
50 %) modulation of the heat load on the divertor targets. This adds to the challenge for the performance of the target design in fusion reactors. Therefore, more attention should be paid to both experimental and theoretical studies of the effect of the plasma parameter fluctuations that can develop in the detached regime.
${\sim}$
50 %) modulation of the heat load on the divertor targets. This adds to the challenge for the performance of the target design in fusion reactors. Therefore, more attention should be paid to both experimental and theoretical studies of the effect of the plasma parameter fluctuations that can develop in the detached regime.
Next, we consider the effect of the ELMs on the detached divertor plasma. It is widely accepted that both in ITER and in future tokamak reactors, the large ELMs must be avoided in order to prevent severe damage of the plasma-facing components. However, it is not clear, what the ELM that can be tolerable is, if we take into account dissipation of the ELM energy in the detached plasma by impurity radiation. This is not a simple question and the answer to it depends, obviously, on how deep the detachment is.
ELMs are essentially 3-D structures (see e.g. Kirk et al. Reference Kirk2005) and as such, they are not easy objects for 2-D modelling. Some models used in the ELM simulations are based on a drastic enhancement of the transport coefficients, either diffusivities or the outward pinch velocity, for a short time corresponding to the ELM duration, with subsequent reduction of them to the steady-state level. More sophisticated description of the ELM burst within 2-D simulations is based on the so-called ‘macro-blob’ approach (Pigarov et al. Reference Pigarov, Krasheninnikov and Rognlien2011), where a poloidal outboard segment of the plasma is advected coherently, with high speed, mimicking the dynamics of the ELM filament. However, one of the issues with the modelling of the ELMs using the plasma transport description based on the fluid models is related to the fact that the ELMs expel pieces from the hot core plasma. The collisional mean free path of these hot plasma electrons and ions is long even in the cold divertor plasma typical for the detached divertor operation. As a result, the applicability of the fluid models becomes questionable.
Nonetheless, both the experiments and simulations (Pigarov et al.
Reference Pigarov, Krasheninnikov, Hollmann and Rognlien2016) suggest that the detached plasma can be more resilient to the impact of the ELMs than it was anticipated before. In the detached regime, there is a strong compression of the impurity ions in the cold, virtually non-radiating regions (recall the discussion in § 4.3), which for deep detachment can occupy a significant part of the divertor legs. As a result, in between ELMs, the detachment is maintained by radiation from a small fraction of the available impurity ions only. During the ELM, when the ELM energy heats the cold divertor plasma up, both the radiating fraction of the impurity and the total radiation loss can increase drastically. Enhancement of the cross-field transport in the divertor plasma during the ELM burst, which was not taken into account in Pigarov et al. (Reference Pigarov, Krasheninnikov, Hollmann and Rognlien2016), may cause a further increase of the impurity radiation loss and, correspondingly, dissipation of the ELM energy. However, modelling of ITER edge plasma with rather large ELMs expelling from the core plasma ${\sim}$
1 MJ of energy per ELM shows that such ELMs burn through the partially detached divertor plasma in ITER (Coster et al.
Reference Coster, Chankin, Klingshirn, Dux, Fable, Bonnin, Kukushkin and Loarte2015). As the result, W erosion from the targets, which is negligible in the steady-state operation, becomes significant during ELMs. Experimental data from AUG and JET also demonstrate a strong increase of W erosion during type I ELMs (see e.g. Dux, Janzer & Puẗterich Reference Dux, Janzer and Puẗterich2011; Den Harder et al.
Reference Den Harder, Brezinsek, Puẗterich, Fedorczak, Matthews, Meigs, Stamp, van de Sanden and Van Rooij2016 and the references therein).
${\sim}$
1 MJ of energy per ELM shows that such ELMs burn through the partially detached divertor plasma in ITER (Coster et al.
Reference Coster, Chankin, Klingshirn, Dux, Fable, Bonnin, Kukushkin and Loarte2015). As the result, W erosion from the targets, which is negligible in the steady-state operation, becomes significant during ELMs. Experimental data from AUG and JET also demonstrate a strong increase of W erosion during type I ELMs (see e.g. Dux, Janzer & Puẗterich Reference Dux, Janzer and Puẗterich2011; Den Harder et al.
Reference Den Harder, Brezinsek, Puẗterich, Fedorczak, Matthews, Meigs, Stamp, van de Sanden and Van Rooij2016 and the references therein).
4.5 Impact of drifts on divertor plasma detachment
In § 2.6 we mentioned that the most pronounced impact of the drifts is on the poloidal symmetry of the plasma parameters. As a clear signature of the drift effects, a significant change of the plasma parameters in the inner and outer divertors in a single-null divertor configuration with reversing the direction of the toroidal magnetic field was observed both in experiments (see e.g. Hutchinson et al. Reference Hutchinson, LaBombard, Goetz, Lipschultz, McCracken, Snipes and Terry1995; Asakura et al. Reference Asakura, Hosogane, Tsuji-Iio, Itami, Shimizu and Shimada1996; Chankin et al. Reference Chankin1996; Huber et al. Reference Huber2005; Pitts et al. Reference Pitts2005; Liu et al. Reference Liu2012; Guo et al. Reference Guo2016; McLean et al. Reference McLean2016) and in 2-D simulations (see e.g. Rognlien et al. Reference Rognlien, Porter and Ryutov1999; Pitts et al. Reference Pitts2005; Wischmeier et al. Reference Wischmeier2011; Rozhansky et al. Reference Rozhansky, Molchanov, Veselova, Voskoboynikov, Kirk and Coster2013; Guo et al. Reference Guo2016).
As a result, the appropriate choice of the direction of the toroidal field for the case of a single-null divertor can promote symmetrization of inner and outer divertor detachment. For example, in figure 31 one can see the change of the electron temperature profiles measured with the divertor Thomson scattering diagnostics in the inner and outer divertors in the DIII-D tokamak. Here the ‘forward’ direction is defined as the direction of the toroidal magnetic field at which the ion $\boldsymbol{B}\times \unicode[STIX]{x1D735}B$
drift velocity is directed towards the divertor. In these experiments it was found (see figure 31) that with increasing the plasma density for the case of the forward direction, the inner divertor was detaching well before the outer one, whereas at the reversed direction, both the inner and outer divertors were detaching in parallel. Somewhat similar ‘symmetrization’ of the inner and outer divertor detachment was also found in Huber et al. (Reference Huber2005).
$\boldsymbol{B}\times \unicode[STIX]{x1D735}B$
drift velocity is directed towards the divertor. In these experiments it was found (see figure 31) that with increasing the plasma density for the case of the forward direction, the inner divertor was detaching well before the outer one, whereas at the reversed direction, both the inner and outer divertors were detaching in parallel. Somewhat similar ‘symmetrization’ of the inner and outer divertor detachment was also found in Huber et al. (Reference Huber2005).
Evolution of the electron temperature in the DIII-D tokamak divertor during the transition to detachment for the ‘forward’ (top) and ‘reverse’ (bottom) toroidal magnetic fields (McLean et al. Reference McLean2016).

However, the direction of the toroidal magnetic field affects also the power threshold for the L–H transition (Loarte et al. Reference Loarte2007). Therefore, the applicability of such a mechanism of symmetrization of the inner and outer divertors for a single-null divertor configuration in future reactors requires consideration of the integrated performance of the device.
4.6 Impact of the divertor geometry and magnetic configuration on detachment
In § 4.1 it was demonstrated that ultimate divertor detachment is controlled by impurity radiation and plasma recombination. The latter can only be important when the plasma temperature is reduced to ${\sim}$
1 eV and below. However, the impurity radiation loss becomes inefficient in cooling the plasma at these low temperatures. Thus, only electron–ion–neutral energy exchange (including the elastic ion–neutral collisions and vibrational excitation of the hydrogen molecules by electron impact), assisted by fast heat conduction in the neutrals that dump the residual plasma energy to the target, are able to cool the plasma down to
${\sim}$
1 eV and below. However, the impurity radiation loss becomes inefficient in cooling the plasma at these low temperatures. Thus, only electron–ion–neutral energy exchange (including the elastic ion–neutral collisions and vibrational excitation of the hydrogen molecules by electron impact), assisted by fast heat conduction in the neutrals that dump the residual plasma energy to the target, are able to cool the plasma down to ${\sim}$
eV range and to switch the recombination processes on. As a result, any geometrical and magnetic configuration effect facilitating the impurity radiation loss and plasma–neutral interactions near the targets can further the onset of ultimate divertor detachment. Therefore, one can imagine that a divertor geometry that confines the neutrals close to the divertor targets (the so-called ‘closed’ divertor geometry) would promote divertor detachment.
${\sim}$
eV range and to switch the recombination processes on. As a result, any geometrical and magnetic configuration effect facilitating the impurity radiation loss and plasma–neutral interactions near the targets can further the onset of ultimate divertor detachment. Therefore, one can imagine that a divertor geometry that confines the neutrals close to the divertor targets (the so-called ‘closed’ divertor geometry) would promote divertor detachment.
Numerical simulations seem to support this simple thought about the neutral confinement by geometrical effects (e.g. Schneider et al. Reference Schneider, Reiter, Coster, Neuhauser, Lackner and Braams1995). One of particular examples of such a ‘closed’ geometry is a ‘slot’ in the outer divertor in the Alcator C-Mod tokamak (Lipschultz et al. Reference Lipschultz1997). However, the experimental data show that the so-called ‘vertical-plate’, and not the ‘slot’, configuration, is preferential for the onset of detachment (see figure 32).
Left: the vertical-plate (a), slot (b) and flat-plate (c) divertor geometries tested in the experiments. Right: the lux surface extent of detachment as a function of the discharge plasma density. Taken from Lipschultz et al. (Reference Lipschultz, LaBombard, Terry, Boswell and Hutchinson2007).

Experiments on other tokamaks found also that the vertical-plate configuration is preferential for the onset of detachment compared to the flat-plate one (e.g. Kallenbach et al. Reference Kallenbach1999; Schneider et al. Reference Schneider1999; Loarte Reference Loarte2001). However, it is not clear if the change of the neutral dynamics related to the change of the divertor geometry played the leading role in facilitation of detachment. The available experimental data show that the impurity radiation loss was significantly higher for the case of the vertical plate than for the flat one (Kallenbach et al. Reference Kallenbach1999; Loarte Reference Loarte2001). Possible effects of divertor geometry on the radiation pattern are also suggested by modelling (Aho-Mantila et al. Reference Aho-Mantila, Bonnin, Coster, Lowry, Wischmeier, Brezinsek and Federici2015). Taking into account the theoretical assessment of the role of 2-D effects in the impurity radiation loss for the case of a strongly V-shaped impurity radiation pattern (Krasheninnikov, Batishcheva & Simakov Reference Krasheninnikov, Batishcheva and Simakov1998), it is conceivable that the geometrical effects affect the onset of detachment by enhancing the impurity radiation.
In addition, recent simulations (Guo et al. Reference Guo, Sang, Stangeby, Lao, Taylor and Thomas2017) demonstrated that the onset of ultimate detachment in a slot-like divertor configuration could be sensitive to even a relatively small change of the side wall geometry (see figure 33). Unfortunately, at present there is no in-depth analysis of the results of the numerical simulations; therefore the physics of such a strong effect is not clear.
Electron temperature at the outer strike point as a function of the target inclination angle with respect to the separatrix for two different upstream plasma densities. Taken from Guo et al. (Reference Guo, Sang, Stangeby, Lao, Taylor and Thomas2017).

Another way of controlling the neutral localization is by variation of the magnetic configuration. For example, by spreading the magnetic flux surfaces, which increases the width of the area of the targets wetted by the plasma and makes it more difficult for the neutrals to escape from the divertor volume without interaction with the divertor plasma. One can see such an effect clearly in figure 34 taken from Pitts et al. (Reference Pitts2001), where $D_{\unicode[STIX]{x1D6FC}}$
radiation becomes more localized near the target with spreading of the magnetic flux surfaces.
$D_{\unicode[STIX]{x1D6FC}}$
radiation becomes more localized near the target with spreading of the magnetic flux surfaces. $D_{\unicode[STIX]{x1D6FC}}$
radiation in TCV tokamak discharges with different spreading of the magnetic flux surfaces near the outer target. Taken from Pitts et al. (Reference Pitts2001).
$D_{\unicode[STIX]{x1D6FC}}$
radiation in TCV tokamak discharges with different spreading of the magnetic flux surfaces near the outer target. Taken from Pitts et al. (Reference Pitts2001).

However, for the high plasma density near the divertor targets, where the neutral–ion collision mean free path becomes much shorter than the width of the wetted area on the target (which is the case in both ITER and future reactors), the confinement of the neutrals near the targets with material structures or expanded magnetic flux surfaces in order to facilitate plasma cooling to the eV range becomes not so important. However, it might still be important in order to reduce the neutral leakage towards the core plasma, since the neutrals can deteriorate the core plasma confinement (see e.g. ITER Physics Basis 1999) and increase the main chamber erosion.
The most important issue for future reactors will be a virtually complete exhaust of the power coming into SOL by impurity radiation. Few novel concepts, magnetic configurations and geometry of divertors, targeting this issue, were suggested in recent years (see e.g. Kotschenreuther Reference Kotschenreuther2004; Ryutov Reference Ryutov2007; Valanju et al.
Reference Valanju, Kotschenreuther, Mahajan and Canik2009; LaBombard et al.
Reference LaBombard2015; Goldston et al.
Reference Goldston, Hakim, Hammett, Jaworski and Schwartz2017). The so-called ‘snowflake’ divertor configuration (Ryutov Reference Ryutov2007) has already been tested in a few tokamaks and has shown a good performance (see e.g. Piras et al.
Reference Piras, Coda, Duval, Labit, Marki, Medvedev, Moret, Pitzschke and Sauter2010; Soukhanovskii et al.
Reference Soukhanovskii2011). More exotic divertors were studied only with the 2-D edge plasma transport codes. These simulations are demonstrating promising results for small scale tokamaks (Havlíčková et al.
Reference Havlíčková, Wischmeier, Lipschultz and Fishpool2015; Umansky et al.
Reference Umansky, LaBombard, Brunner, Rensink, Rognlien, Terry and Whyte2016). For example, in figure 35 one can see the power scan of the peak electron temperature on the outer divertor targets, found from 2-D simulations, for the divertor configurations envisioned for the ADX project (LaBombard et al.
Reference LaBombard2015). The advanced divertors demonstrate clearly the transition to detachment at higher $Q_{\text{SOL}}$
and/or lower upstream plasma density than the conventional divertors. Apparently, these new divertor configurations enhance the impurity radiation loss (e.g. due to the larger divertor volume in the case analysed in Umansky et al. (Reference Umansky, LaBombard, Brunner, Rensink, Rognlien, Terry and Whyte2016)). However, at present, there are no in-depth studies of the physics that drives these improvements, nor are there simulations of the advanced divertor performance in the future reactors.
$Q_{\text{SOL}}$
and/or lower upstream plasma density than the conventional divertors. Apparently, these new divertor configurations enhance the impurity radiation loss (e.g. due to the larger divertor volume in the case analysed in Umansky et al. (Reference Umansky, LaBombard, Brunner, Rensink, Rognlien, Terry and Whyte2016)). However, at present, there are no in-depth studies of the physics that drives these improvements, nor are there simulations of the advanced divertor performance in the future reactors.
Power scan of the peak electron temperature at the outer divertor targets for the different divertor configurations (see figure 20) envisioned for the ADX project. Taken from Umansky et al. (Reference Umansky, LaBombard, Brunner, Rensink, Rognlien, Terry and Whyte2016).

5 Summary
In this short review, we have tried to describe just the basic physics of the high-recycling and ultimate detachment regimes of operation of a tokamak divertor. Detachment is characterized by nearly complete disappearance of the plasma flux and a very low heat load on the divertor targets, which strongly decrease erosion of the target material. This is why the detached divertor regime looks so attractive from the point of view of future fusion reactors.
As we have seen, the physics of the SOL and divertor plasma is very complex and multifaceted. Detailed description of the processes controlling the SOL and divertor, which can affect the edge plasma parameters and the erosion of the PFCs significantly, requires understanding of the classical and anomalous transport of multi-component plasmas, the multi-component neutral transport, the atomic physics, the radiation transport and, finally, the physics of the plasma–wall interactions including the processes occurring inside the wall material. Although both the experimental and theoretical studies of the processes in a tokamak divertor began more than 35 years ago, our knowledge of these processes is still limited. Nonetheless, today we understand the basic physics of divertor plasma detachment, even though we are still unable to describe all the details from the first principles.
Here we summarize the main issues discussed in our review. After a short excursion into the history of the divertor research in § 1, in § 2 we proceeded with consideration of the processes playing the most important roles in the SOL and of the plasma physics relevant to the divertor. Divertor plasma recycling, which is powered by the energy flux coming into the SOL from the core plasma, plays the key role in sustaining the SOL and divertor plasma for the high-recycling regime. The Bohm criterion for the plasma flow velocity on a material surface provides effective boundary conditions at the plasma contact with the material surface, which are widely used in the theoretical estimates and numerical simulations. The impurity dynamics and impurity-related radiation loss of the plasma energy are among the main ingredients furthering the reduction of the heat load on the divertor targets. The atomic and molecular collision processes involving the hydrogenic species, such as elastic collisions, excitation and ionization of neutrals and recombination of the plasma ions with electrons, largely determine the plasma dynamics in the recycling region. Finally, the effects of drifts and currents in the edge can be extremely important in the edge plasma dynamics.
In § 3, we discussed the approaches to numerical simulation of the processes occurring at the edge of the tokamaks and the models built in the 2-D transport codes for the edge plasma, as well as the limitations of these models. We started with the equations for the plasma transport and considered the applicability of the fluid description and the kinetic corrections needed for better characterization of the processes such as heat conduction along the magnetic field. We discussed the problems with anomalous cross-field plasma transport and its ad hoc transport coefficients used in the codes. Next, we considered transport of the neutrals. Even though in some divertor regions with high plasma density it is possible to use a fluid description of the neutrals based on the neutral–ion collisions, this approximation fails in the regions with lower plasma densities. Therefore, the accuracy of the fluid neutral models, which are still in use owing to their simplicity, is often questionable. As a result, the Monte Carlo approach, allowing detailed description of different kinds of the neutral particles and atomic physics effects, is implemented in the modern neutral transport codes. Finally, we touched on the issues related to the radiation transport and plasma interactions with the plasma facing materials. We discussed also the numerical methods and the convergence criteria used in the modern 2-D edge plasma transport codes.
In § 4, we considered the physics of divertor plasma detachment. We started with the analysis of the total plasma flux on the PFCs, $\unicode[STIX]{x1D6E4}_{w}$
. Based on energy balance, we found that for a low plasma temperature near the targets,
$\unicode[STIX]{x1D6E4}_{w}$
. Based on energy balance, we found that for a low plasma temperature near the targets, $\unicode[STIX]{x1D6E4}_{w}$
can only be reduced by the impurity radiation loss and plasma recombination. The plasma–neutral ‘friction’ per se, which in some publications (e.g. Stangeby Reference Stangeby1993; Stangeby Reference Stangeby2000) is believed to be responsible for the reduction of
$\unicode[STIX]{x1D6E4}_{w}$
can only be reduced by the impurity radiation loss and plasma recombination. The plasma–neutral ‘friction’ per se, which in some publications (e.g. Stangeby Reference Stangeby1993; Stangeby Reference Stangeby2000) is believed to be responsible for the reduction of $\unicode[STIX]{x1D6E4}_{w}$
, actually cannot change the plasma flux. The reason for this is very clear: if the plasma temperature near the target is low, then virtually all the power entering the recycling region from upstream,
$\unicode[STIX]{x1D6E4}_{w}$
, actually cannot change the plasma flux. The reason for this is very clear: if the plasma temperature near the target is low, then virtually all the power entering the recycling region from upstream, $Q_{\text{SOL}}-Q_{\text{imp}}$
, is spent for neutral ionization. In the absence of recombination, this neutral ionization source determines
$Q_{\text{SOL}}-Q_{\text{imp}}$
, is spent for neutral ionization. In the absence of recombination, this neutral ionization source determines $\unicode[STIX]{x1D6E4}_{w}$
that reaches the targets, no matter how strong the plasma–neutral ‘friction’ is. Nonetheless, the neutrals play an important role in balancing the upstream plasma pressure, cooling down the plasma near the targets, which turns the recombination processes on, and slowing down the plasma flow, which increases the plasma density and makes the residence time of the ions and electrons sufficient for recombination. The experimental data support these conclusions.
$\unicode[STIX]{x1D6E4}_{w}$
that reaches the targets, no matter how strong the plasma–neutral ‘friction’ is. Nonetheless, the neutrals play an important role in balancing the upstream plasma pressure, cooling down the plasma near the targets, which turns the recombination processes on, and slowing down the plasma flow, which increases the plasma density and makes the residence time of the ions and electrons sufficient for recombination. The experimental data support these conclusions.
Next we considered the onset of ultimate detachment of the plasma from the target on a given magnetic flux surface. We demonstrated that this ultimate detachment caused by plasma recombination starts when the ratio of the hydrogen plasma pressure upstream, $P_{\text{up}}$
, to the specific energy flux into the recycling region,
$P_{\text{up}}$
, to the specific energy flux into the recycling region, $q_{\text{recycl}}$
, reaches the critical value
$q_{\text{recycl}}$
, reaches the critical value $(P_{\text{up}}/q_{\text{recycl}})_{\text{crit}}\propto \sqrt{M_{i}}$
(for deuterium,
$(P_{\text{up}}/q_{\text{recycl}})_{\text{crit}}\propto \sqrt{M_{i}}$
(for deuterium, $(P_{\text{up}}/q_{\text{recycl}})_{\text{crit}}\sim 15~\text{N}~\text{MW}^{-1}$
). This requirement has a clear physical interpretation: sustainment of the upstream plasma by divertor recycling, while keeping a relatively high temperature near the divertor targets to avoid plasma recombination, is only possible with a sufficiently high flux of energy into the recycling region to fuel the neutral ionization process. In addition, the onset of plasma recombination does not allow the ratio
$(P_{\text{up}}/q_{\text{recycl}})_{\text{crit}}\sim 15~\text{N}~\text{MW}^{-1}$
). This requirement has a clear physical interpretation: sustainment of the upstream plasma by divertor recycling, while keeping a relatively high temperature near the divertor targets to avoid plasma recombination, is only possible with a sufficiently high flux of energy into the recycling region to fuel the neutral ionization process. In addition, the onset of plasma recombination does not allow the ratio $P_{\text{up}}/q_{\text{recycl}}$
to exceed its critical value significantly. For a fixed
$P_{\text{up}}/q_{\text{recycl}}$
to exceed its critical value significantly. For a fixed $q_{\text{recycl}}$
, this results in virtual saturation of the upstream plasma pressure and density. Since
$q_{\text{recycl}}$
, this results in virtual saturation of the upstream plasma pressure and density. Since $P_{\text{up}}$
is the same for both the inner and outer divertors, the asymmetry of
$P_{\text{up}}$
is the same for both the inner and outer divertors, the asymmetry of $q_{\text{recycl}}$
in the inner and outer divertors retards ultimate detachment in the divertor with higher
$q_{\text{recycl}}$
in the inner and outer divertors retards ultimate detachment in the divertor with higher $q_{\text{recycl}}$
. The 2-D numerical simulations fully confirm these findings. We also derived a less rigorous, but more practical criterion of the onset of ultimate divertor plasma detachment, which is based on energy balance (see (4.12)). It agrees well with the criterion deduced from the experimental data from AUG (Kallenbach et al.
Reference Kallenbach2015). Within some parameter range, this criterion is supported by the results of the 2-D numerical simulations. However, the limits of applicability of this criterion are still to be determined.
$q_{\text{recycl}}$
. The 2-D numerical simulations fully confirm these findings. We also derived a less rigorous, but more practical criterion of the onset of ultimate divertor plasma detachment, which is based on energy balance (see (4.12)). It agrees well with the criterion deduced from the experimental data from AUG (Kallenbach et al.
Reference Kallenbach2015). Within some parameter range, this criterion is supported by the results of the 2-D numerical simulations. However, the limits of applicability of this criterion are still to be determined.
Then, we discussed, how the transition to detachment occurs – smoothly or bifurcation-like. Experimental data are somewhat uncertain and seem to show that the both ways are possible. Some simplified theoretical models predict a bifurcation-like transition to detachment. However, these models rely on assumptions that require verification with 2-D numerical simulations. Although the physics incorporated in the 2-D edge plasma transport codes is still incomplete, it is much more adequate than that used in the simplified models.
Two-dimensional numerical simulations of transition to the detached regime for a DIII-D-like geometry and constant cross-field plasma transport coefficients show a smooth transition to detachment with a gradual increase of the impurity content. The reason for this is a strong stabilizing effect of accumulation of the ‘excess’ of both the impurity and hydrogen plasma in the cold divertor region, where the impurity radiation is negligible. This effect, which was missing in the simplified theoretical models predicting a bifurcation-like transition to detachment, can be very important for mitigation of the ELMs. However, bifurcation does occur when the cross-field plasma transport coefficients that increase with decreasing plasma temperature near the divertor targets (a feature that was apparently observed in the experiments by Sun et al. (Reference Sun, Wolfrum, Eich, Kurzan, Potzel and Stroth2015)) are used. This demonstrates that anomalous plasma transport can be an important ingredient determining the transition to detachment.
We also reviewed the transient effects (e.g. the ELMs) in the detached plasma. Both the experimental data and the 2-D numerical simulations show that a detached divertor can mitigate relatively small ELMs by radiation from the impurity localized in the cold region of the divertor. In between ELMs, these impurities do not contribute to the radiation loss because of the low temperature. However, the increased energy flux into the divertor during the ELM burst produces a thermal wave propagating towards the target. It increases the plasma temperature and simultaneously boosts the impurity radiation loss. As the result, depending on the energy flux and impurity density, the thermal wave can be slowed down or even stopped. However, large ELMs, which dump into the SOL a large amount of virtually collisionless, hot plasma, burn through the detached divertor plasma and can severely damage the PFCs (Loarte et al.
Reference Loarte2007). At present, we have no criterion predicting the ELM mitigation in a detached divertor plasma. We discussed also the plasma parameter fluctuations that arise due to some processes that develop in the SOL and divertor regions not just as a response to phenomena occurring in the core plasma, such as ELMs. Such fluctuations are observed in both the experiments and numerical simulations. The frequencies of the fluctuations range from ${\sim}$
10 Hz to
${\sim}$
10 Hz to ${\sim}$
10 kHz. Although they do not produce perturbations of either heat or particle fluxes on the divertor targets as large as the ELMs do, the deviations from the stationary values found in the numerical simulations can be significant (up to 50 %). Unfortunately, the experimentally observed fluctuations have not been studied in sufficient detail, so the physics of these fluctuations is not clear. Two-dimensional numerical simulations show that the interplay between impurity radiation and transport is responsible for driving the fluctuations observed in the simulations. Obviously more work needs to be done in this area.
${\sim}$
10 kHz. Although they do not produce perturbations of either heat or particle fluxes on the divertor targets as large as the ELMs do, the deviations from the stationary values found in the numerical simulations can be significant (up to 50 %). Unfortunately, the experimentally observed fluctuations have not been studied in sufficient detail, so the physics of these fluctuations is not clear. Two-dimensional numerical simulations show that the interplay between impurity radiation and transport is responsible for driving the fluctuations observed in the simulations. Obviously more work needs to be done in this area.
Finally, we considered the impact on detachment of the currents, drifts and geometrical effects. Both the experimental data and numerical simulations demonstrate that the drifts change the asymmetry between the inner and outer divertors significantly (see figure 31). Potentially, by choosing the appropriate direction of the toroidal magnetic field, one could try to minimize the asymmetry in the onset of detachment in the inner and outer divertors. However, since the direction of the toroidal magnetic field does also affect transition to the H-mode, the feasibility of this approach in future tokamak reactors is not clear. Other factors that can affect the divertor plasma parameters and detachment significantly are the magnetic configuration (see e.g. figure 20) and the divertor geometry. Interestingly, it seems that even for the same divertor geometry, the location of the strike point can impact the impurity radiation loss (see e.g. Lipschultz et al. Reference Lipschultz, LaBombard, Terry, Boswell and Hutchinson2007) and, as the result, promote detachment. We also discussed some more exotic divertor configurations that are envisioned for future reactors, where the power generated will be much higher than in ITER. As a result, to protect the plasma-facing components in future reactors, the power necessary to be dissipated in the divertor has to exceed greatly that achievable in the current divertor configurations. However, as of today, the studies of the most exotic divertor configurations involve only numerical simulations. To have a more reliable information on the performance of these new divertors, the optimistic conclusions that follow from the simulations need to be confirmed by the experimental data.
Thus, at this moment we have a rather complete conceptual physical picture of ultimate divertor detachment, which is supported by both the experimental data and the results of the numerical simulations. However, our understanding of the processes involved is still insufficient to predict reliably the edge plasma performance – in particular, the conditions for divertor detachment – in the future reactors. We think that the critical problem here is our poor understanding of anomalous cross-field plasma transport (at the core–edge interface, SOL and divertor volume) and plasma–wall interactions (including dynamics of the absorbed plasma species in the wall material, their desorption, sputtering and erosion of the PFCs, modification of surface morphology under plasma irradiation, etc.). The role of cross-field transport of the plasma and the plasma–wall interactions in the control of core plasma confinement, heat loading of the targets, plasma and impurity recycling, wall erosion and impurity production, and so on, is crucial. Moreover, these processes may reveal important synergistic effects. Therefore, a significant progress in these areas would boost our understanding of the key physics necessary to build the future fusion reactors.
Acknowledgements
This paper is based upon the work supported partially by the U.S. Department of Energy, Office of Science, Office of Fusion Energy Sciences under award nos DE-FG02-04ER54739, DE-FG02-06ER54852, and DE-SC0008660 at UCSD and the Russian Ministry of Education and Science grant no. 14.Y26.31.0008 at MEPhI. Some calculations were done using the resources of the federal collective usage center ‘Complex for simulation and data processing for mega-science facilities’ at NRC ‘Kurchatov Institute’, http://ckp.nrcki.ru/.


