


Introduction
The mechanical properties of ferritic materials are subjected to detrimental dose-dependent evolutions, including embrittlement, swelling, hardening, and radiation-induced segregations. These evolutions represent an important life-limiting factor for various types of nuclear installations [Reference Bloom1, Reference Matijasevic, Lucon and Almazouzi2, Reference Matijasevic, Van Renterghem and Almazouzi3, Reference Baluc, Gelles, Jitsukawa, Kimura, Klueh, Odette, van der Schaaf and Yu4]. Ferritic materials are characterized by a well-defined ductile-to-brittle transition (DBT), in both irradiated and non-irradiated conditions [Reference Hishinuma, Kohyama, Klueh, Gelles and Ehrlich5, Reference Nikolaev, Nikolaeva and Shtrombakh6, Reference Konstantinovic, Rebterghem, Matjasevic, Minov, Lambrecht, Toyama, Chiapetto and Maleraba7, Reference Hein, Keim, May and Schnabel8, Reference Hintsala, Teresi, Wagner, Mkhoyan and Gerberich9]. Usual surveillance practices include the DBT temperature assessment of the reactor pressure vessel (RPV) steel. Such evaluation involves the destructive testing of a fixed number of macroscopic specimens inserted in surveillance capsules located near the RPV inner wall prior to the initial reactor start-up. The surveillance specimens are taken out-of-pile at a selected periodicity (a few years, typically) and then handled, tested, and disposed of in hot cell facilities [Reference Yoo, Lee, Ham and Seo10, Reference Ballesteros, Alstadt, Gillemot, Hein, Wagemans, Rouden, Barthelmes, Wilford, Serrano, Brumovsky, Chaouadi and Ortner11, Reference Altstad, Keim, Hein, Serrano, Bergner, Viehrig, Ballesteros, Chaouadi and Wilford12]. Although reliable, this conventional approach is time-consuming and extremely costly and lacks flexibility.
In that context, it is highly desirable to develop and apply supporting evaluation methods, preferably based on numerical simulation and nondestructive observation techniques, like EBSD analysis [Reference Diaz-Fuentes, Iza-Mendia and Gutierrez13], small-angle neutron scattering (SANS) measurements [Reference Meslin, Lambrecht, Hernandez-Mayoral, Bergner, Malerba, Pareige, Radiguet, Barbu, Gómez-Briceño, Ulbricht and Almazouzi14, Reference Heintze, Ulbricht, Bergner and Eckerlebe15], or X-ray submicron diffraction methods [Reference Budiman, Tamura, Valek, Gadre, Maiz, Spolenak, Nix and Patel16, Reference Khoo, Liu, Sasangka, Made, Tamura, Kunz, Budiman, Gan and Thompson17, Reference Tippabhotla, Radchenko, Song, Illya, Handara, Kunz, Tamura, Tay and Budiman18]. Such approach could then help optimizing the existing surveillance programs, while providing valuable complementary information regarding the material degradation causes. Progress toward the said objectives can be achieved by taking advantage of recent numerical simulation results [Reference Li and Robertson19, Reference Li, Robertson, Ma and Wang20], addressing post-irradiation plastic strain spreading at the scale of ferritic grains.
The exposure of metallic materials to neutron irradiation flux results in the progressive accumulation of radiation-induced defect clusters, mostly in the form of dislocation loops. These defect clusters can then strongly interact with dislocation-mediated plasticity mechanisms according to transmission electron microscopy (TEM) observations [Reference Birtcher, Kirk, Furuya, Lumpkin and Ruault21, Reference Robach, Robertson, Wirth and Arsenlis22], molecular dynamics (MD) [Reference Bacon and Osetsky23, Reference de la Rubia, Zbib, Kraishin, Wirth, Victoria and Caturla24], and dislocation dynamics (DD) simulation analysis [Reference Kwon, Kwon and Hong25, Reference Ghoniem, Tong, Singh and Sun26, Reference Chaussidon, Robertson, Rodney and Fivel27, Reference Gururaj, Robertson and Fivel28]. It is important to note that the DBT of ferritic materials is concurrent with and generally depends on the temperature-dependent mobility of screw dislocations, based on thermally activated slip and cross-slip theory [Reference Klueh, Sokolov, Shiba, Miwa and Robertson29, Reference Hirsch and Roberts30, Reference Tanaka, Tarleton and Roberts31]. Analysis of the dislocation-mediated plasticity mechanisms has shown that [Reference Li and Robertson19, Reference Li, Robertson, Ma and Wang20]
(i) Both the straining temperature and the defect dispersions primarily impact the effective screw dislocation mobility.
(ii) The defect dispersions impact the effective dislocation mobility depending on the defect size and defect number densities.
(iii) The defect-induced changes can be expressed in terms of a quantitative scalar indicator called the “defect-induced apparent straining temperature shift” (noted ΔDIAT).
Our goal in this work is to evaluate the grain size and grain orientation effect on ΔDIAT evolutions using three-dimensional DD simulations. This evaluation is regarded as an essential step toward developing a fully predictive model, applicable at the scale of representative (macroscopic) grain aggregates and then macroscopic specimens [Reference Viehrig, Boehmert and Dzugan32]. This particular study is adapted to Fe–2.25% Cr grains taken as a model ferritic system, for which all the required data are available in the open literature (see also “Dislocation stress-velocity rules”), as far as dislocation mobility is concerned [Reference Bohmert and Muller33].
The present article thus includes the following core sections. The adopted methodology is presented in “Investigation methods”, namely the dislocation mobility rules (“Dislocation stress-velocity rules”), the different DD simulation setups, and dislocation/defect interaction treatment (“Grain setups and dislocation/defect interaction implementation”). The defect-dependent evolutions of the effective dislocation mobility are evaluated based on ΔDIAT, as presented in “Defect induced changes of effective dislocation mobility and DIAT shift concept”. “Results and discussion” presents the various ΔDIAT trends associated with various simulation conditions and setups. The grain size and grain orientation effects are presented in “Grain size effect on plastic strain spreading” and “Grain orientation effect”, respectively. Relations between the present simulation results and corresponding post-irradiation ductile-to-brittle transition temperature shifts (ΔDBTT) are then further examined and discussed. In certain irradiation conditions, the DIAT shift level is comparable to the ΔDBTT (see “Grain size and orientation effect on ΔDIAT and dislocation microstructures”). This correlation is interpreted in “The ΔDIAT versus ΔDBTT correlation”, based on both experimental evidence and theoretical arguments.
Results and discussion
Grain size effect on plastic strain spreading
Effect on the mechanical response and dislocation accumulation rate
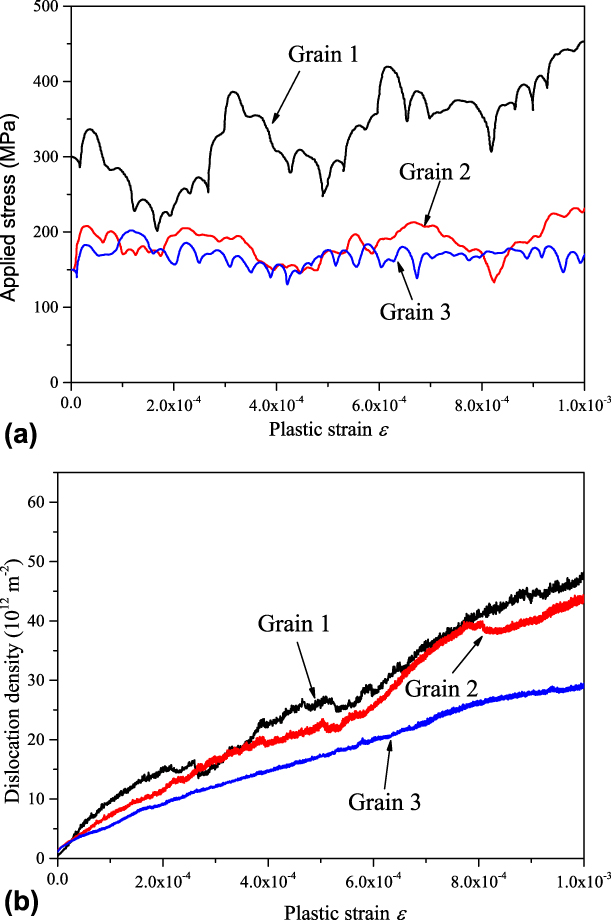
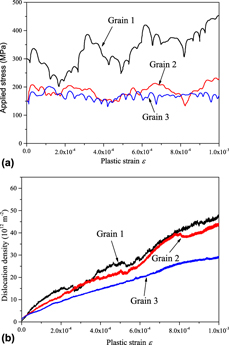
The stress–strain responses of 1 and 2 µm defect-free grains are shown side by side in Fig. 1(a). The initial applied stress level (where εp < 2 × 10⁻⁴) is proportional to  ${1 / {\sqrt {{D_{\rm{g}}}} }}$, i.e., consistent with the well-known Hall–Petch effect, associated with the internal stress landscape, where the dislocations store at the grain boundaries. The work-hardening rate is limited, in agreement with the stress–strain response of polycrystalline BCC metals [Reference Bohmert and Muller33]. The mean applied stress level is consistent with the observed mobile dislocation densities [see Fig. 1(b)], given the selected (controlled) plastic strain rate conditions and the adopted stress–velocity rules. The dislocation density accumulation rate is linear with the cumulated plastic strain, in both Grain 1 and Grain 2 cases. At a fixed plastic strain level, the dislocation density is slightly lower in Grain 2 than in Grain 1, despite the relatively large applied stress gap between the two cases. A comparable effect is observed in MD simulations [Reference Hahn and Meyers34] using similar boundary conditions as specified in “Investigation methods”. In the present DD simulations, the dislocation structures take the form of individual shear bands, whose number density increases with the increasing strain level and disperse defect number density [Reference Chaussidon, Robertson, Rodney and Fivel27, Reference Robertson and Gururaj35, Reference Chaussidon, Robertson and Fivel36]. Dislocation multiplication inside individual shear bands is due to the formation of dislocation sources (in the form of open loops) and very active cross-slip [Reference Chaussidon, Robertson, Rodney and Fivel27, Reference Louchet and Saka37]. In these conditions, it can be shown that the actual shear band thickness and spacing are consistent with the internal stress field evolutions [Reference Gururaj, Robertson and Fivel38, Reference Robertson, Obrtlik and Marini39]. In any case, the observed grain size effect on the dislocation density accumulation rate is in good agreement with earlier DD simulation results and direct experimental evidence [Reference Chaussidon, Robertson, Rodney and Fivel27, Reference Gururaj, Robertson and Fivel28, Reference Robertson and Gururaj35, Reference Chaussidon, Robertson and Fivel36, Reference Robertson, Obrtlik and Marini39].
Plastic strain spreading in defect-free Grain 1, Grain 2, and Grain 3 simulation setups. (a) Stress–strain response. (b) Dislocation density evolution with cumulated plastic strain. Grain 1, Grain 2, and Grain 3 labels are defined in Table III.
The (average) applied stress level is dose dependent (not shown), i.e., increases with the defect number density [Reference Li and Robertson19, Reference Bohmert and Muller33]. This effect mainly depends on the dislocation mobility rules and dislocation/facet interaction mechanisms that are likewise grain size independent.
Effect on effective dislocation mobility and ΔDIAT
The DIAT shift amplitude corresponding to each simulation case is then calculated using Eqs. (4) and (5) and plotted in Fig. 2 (solid symbols).
ΔDIAT evolutions for different defect number densities in Grain 1 and Grain 2 simulation setups. Grain size effect for different defect number density cases: (a) defect size D = 15 nm and (b) defect size D = 25 nm. Solid symbols: DD simulation results using Eq. (5); dashed lines: Eq. (1) prediction for corresponding D and N inputs. Adjustment of ΔDIAT data with analytical Eq. (1) is further discussed in “Discussion.”
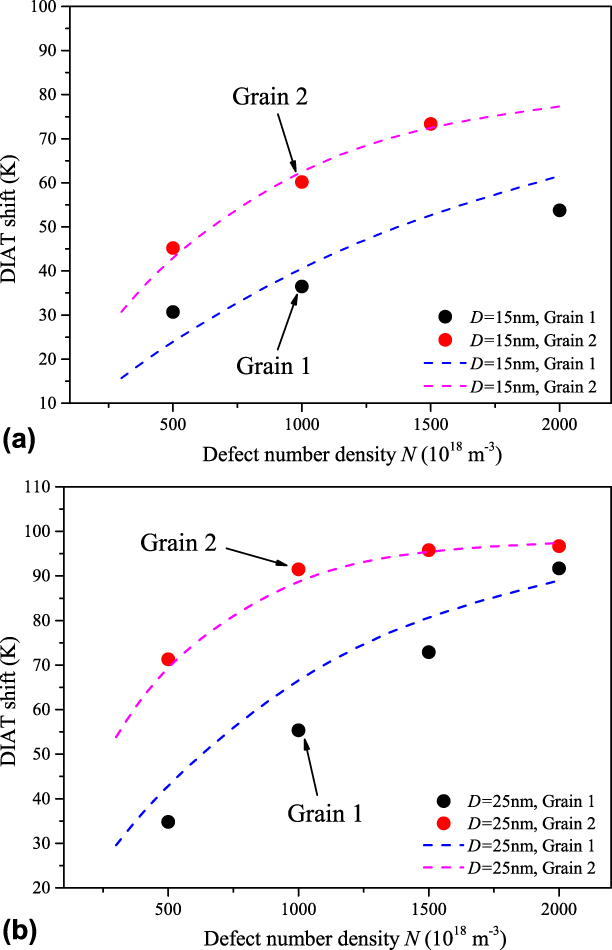
For a fixed grain size, the DIAT shift increases with the defect size and number density up to a specific, case-dependent saturation level. In Grain 2 and D = 25 nm case, for example, the ΔDIAT level saturates at 95 K for a defect number density N > 1021 m−3. For a fixed irradiation condition, larger grain size induces higher ΔDIAT, especially with small defect number density. In D = 25 nm case, for instance, ΔDIAT increases from 38 K (D g = 1 µm) to 71 K (D g = 2 µm) at 5 × 10²⁰ m−3 defect number density. According to Fig. 1, increasing the grain size (at fixed strain rate) induces lower applied stress and dislocation accumulation rate, which means dislocation propagations in larger grain become much easier yielding more mobile dislocations. Therefore, the influence of defect dispersions in Grain 2 is relatively more important than that in Grain 1 in terms of statistical dislocation mobility, which finally results in a larger ΔDIAT amplitude. The grain size effect is significantly smaller for higher defect densities [see Fig. 2(b)], where the dislocation/defect interaction rate is dominant, in terms of dislocation multiplication mechanism.
Grain orientation effect
Effect on plastic strain spreading
The grain orientation effect is evaluated by comparing the DD simulation results associated with Grain 2 and 3 setups (see section “Grain setups and dislocation/defect interaction implementation”). The applied stress and dislocation density evolutions with plastic strain in defect-free case are shown in Figs. 1(a) and 1(b).
The significant grain orientation dependence hereby is due to decreased activity in the first slip system (SS). In the second SS, however, the dislocation density is almost unchanged for the two tested grain orientations (not shown). It is understood that these evolutions closely reflect the Schmid factors evolutions indicated in Table IV. Obtaining the exact form of the grain orientation dependence on ΔDIAT involves further theoretical developments to be presented in a separate paper. In principle, however, a grain orientation yielding a lower Schmid factor (in either the primary or cross-slip systems) is also associated with a smaller internal stress field and finer shear bands (see also Fig. 4 and Ref. Reference Gururaj, Robertson and Fivel38). This interpretation is validated by the simulation results to be presented in the next sections.
Effect on effective dislocation mobility and ΔDIAT
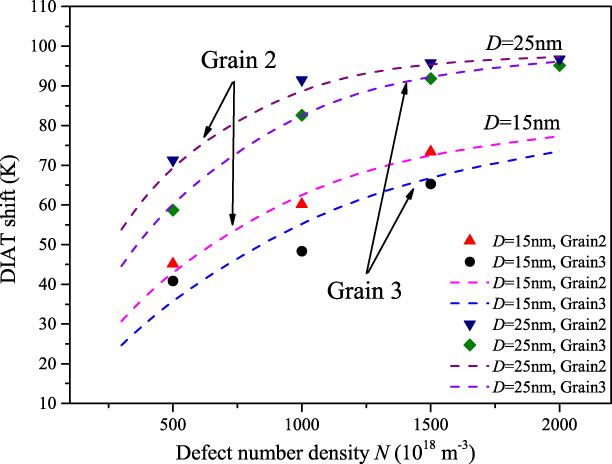
The grain orientation effect on the ΔDIAT evolutions is presented in Fig. 3, showing a similar trend as in Fig. 2. However, the ΔDIAT level is systematically lower in the  $z = \left( {\bar{1}54} \right)$ oriented Grain 3 than in the z = (100) oriented Grain 2. In the D = 25 nm cases, ΔDIAT achieves a saturation level for about N = 1021 m−3 in Grain 2 and N > 1.5 × 10²¹ m−3 in Grain 3. It is interesting to note that for a fixed defect size, the saturation level is mostly independent of the grain orientation. This situation especially applies to large defect number density cases, where the dislocation multiplication is dominated by the dislocation/defect interactions.
ΔDIAT evolutions using Grain 2 and Grain 3 simulation setups for various defect dispersion cases: grain orientation effect. Solid symbols: DD simulation results using Eq. (5); dashed lines: Eq. (1) prediction for corresponding D and N inputs. Adjustment of ΔDIAT data with Eq. (1) is further discussed in “Discussion.”
Discussion
Grain size and orientation effect on ΔDIAT and dislocation microstructures
All the ΔDIAT results presented in “Grain size effect on plastic strain spreading” and “Grain orientation effect” can be described (i.e., adjusted) using the following semianalytical, dose-dependent expression (dashed lines in Figs. 2 and 3):
 $$\Delta {\rm{DIAT}} = \Delta {T_{\max }}\left( {1 - \exp \left( { - {D \over \lambda }} \right)} \right)\left( {1 - \exp \left( { - {d^2}DN} \right)} \right)\quad ,$$
where D (in m) is the defect size and N (in m−3) the defect number density. The exponential terms in Eq. (1) actually scale with the characteristic evolutions of the internal stress field, as shown in section 3.4 of Ref. Reference Li and Robertson19. Equation (1) includes three independent scaling parameters: ΔT max = 110 K is a reference temperature shift; λ ∼ 11 nm is a reference gliding distance, and d is the thickness of the strain-induced shear bands. The reference temperature shift ΔT max can be estimated assuming coplanar dislocation interaction with hard (non-shearable) disperse defects. In stress-controlled deformation conditions,  $\tau _1^* \approx \tau _0^* + \Delta {\tau _{{\rm{Orowan}}}}$, where ΔτOrowan is calculated using the Scattergood and Bacon expression [Reference Robertson and Gururaj35] with saturation value N = 2 × 10²² m−3 for D = 16 nm (see [Reference Matijasevic, Lucon and Almazouzi2] for example). Inserting $\tau _1^*$ in Eq. (2), putting the corresponding v 1 in Eq. (4) and then solving for T 1 yields (T 1 − T 0) = ΔT max ∼ 110 K. Distance λ is the average integrated free glide path of screw dislocations between consecutive glide plane changes due to cross-slip mechanism (please refer again to Ref. Reference Li and Robertson19). We found that λ is grain size and grain orientation independent at least in the conditions of this study.
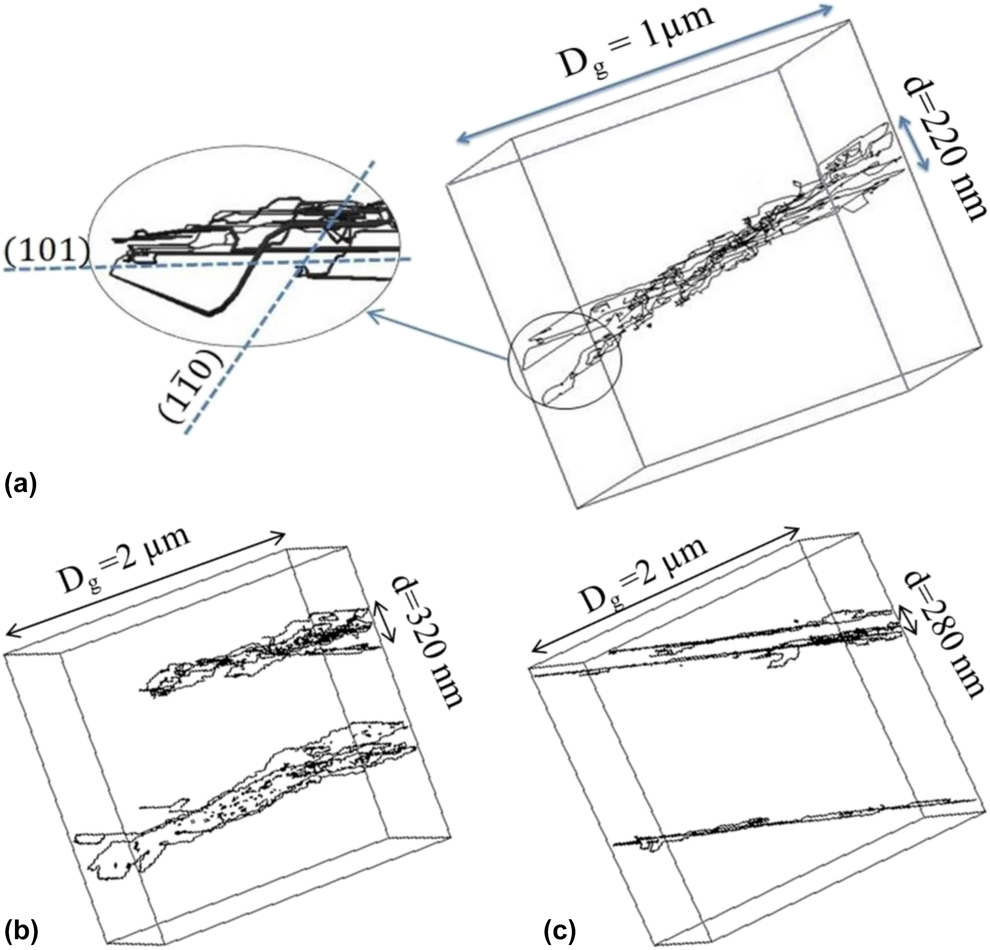
In practice, Fig. 2 data can be adjusted using Eq. (1) by varying the shear band thickness parameter, namely by using d = 320 nm with Grain 2 data and d = 220 nm with Grain 1 data (see Table I). Similarly, Fig. 3 data can be adjusted using Eq. (1) with d = 280 nm for Grain 3 data and d = 320 nm for Grain 2 data (see also Table I). The shear band thicknesses obtained by adjusting ΔDIAT data with Eq. (1) are in any case consistent with the simulation-generated dislocation microstructures (see Fig. 4). Thicker shear bands are found in larger grains (since  $d\;\infty \;D_{\rm{g}}^{{1 / 2}}$) and generate a higher DIAT shift for a given defect dispersion. Increasing the grain size indeed facilitates dislocation cross-slip, which is consistent with thicker shear bands and a more pronounced evolution of the dislocation mobility (with respect to the defect-free case). Changing the grain orientation significantly affects the ΔDIAT level for a given grain size. This particular effect is associated with corresponding change in the applied resolved shear stress repartition, among the different SS. This effect most probably contributes to the ΔDIAT scattering in polycrystalline aggregates.
Shear band thickness parameter d estimated by adjusting Eq. (1) in ΔDIAT simulation results. The data are consistent with  $d\;\infty \;D_{\rm{g}}^{{1 / 2}}$. This means, for example, that $d\left( {{D_{\rm{g}}} = 10\;{\rm{\mu m}}} \right)\;{\rm{ = }}\;d\left( {{D_{\rm{g}}} = 1\;{\rm{\mu m}}} \right) \times \sqrt {{{10\;{\rm{\mu m}}} / {1\;{\rm{\mu m}}}}} = 220\;{\rm{nm}}\sqrt {{\rm{10}}} - 700\;{\rm{nm}}$ (see also “The ΔDIAT versus ΔDBTT correlation”).
Dislocation structures at the same plastic strain level for N = 1021 m−3 and D = 15 nm: grain size and grain orientation effects. The defects are not shown for clarity. (a) Grain 1, (b) Grain 2, and (c) Grain 3 simulation setups (see Table III). The shear band thicknesses are consistent with the ΔDIAT-based values calculated using Eq. (1) and reported in Table I.
“Grain size effect on plastic strain spreading” and “Grain orientation effect” results and their relation with the dose-dependent fracture response evolutions are examined in “The ΔDIAT versus ΔDBTT correlation”.
The ΔDIAT versus ΔDBTT correlation
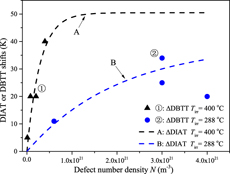
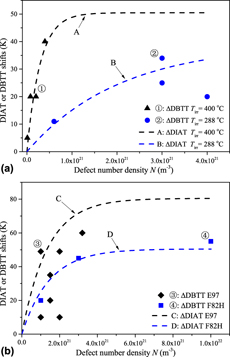
The ΔDIAT levels reported in Figs. 2 and 3 closely reflect the actual dose-dependent ΔDBTT data associated with irradiation conditions (and materials) compatible with the present study [Reference Matijasevic, Lucon and Almazouzi2, Reference Matijasevic, Van Renterghem and Almazouzi3, Reference Baluc, Gelles, Jitsukawa, Kimura, Klueh, Odette, van der Schaaf and Yu4, Reference Hishinuma, Kohyama, Klueh, Gelles and Ehrlich5, Reference Nikolaev, Nikolaeva and Shtrombakh6, Reference Rieth, Dafferner and Rohrig40, Reference Rieth, Dudarev, Gonzale de Vicente, Aktaa, Ahlgren, Antusch, Armstrong, Balden, Baluc, Barthe, Basuki, Battabyal, Becquart, Blagoeva, Boldyryeva, Brinkmann, Celino, Ciupinski, Correia, De Backer, Domain, Gaganidze, García-Rosales, Gibson, Gilbert, Giusepponi, Gludovatz, Greuner, Heinola, Höschen, Hoffmann, Holstein, Koch, Krauss, Li, Lindig, Linke, Linsmeier, López-Ruiz, Maier, Matejicek, Mishra, Muhammed, Muñoz, Muzyk, Nordlund, Nguyen-Manh, Opschoor, Ordás, Palacios, Pintsuk, Pippan, Reiser, Riesch, Roberts, Romaner, Rosiński, Sanchez, Schulmeyer, Traxler, Ureña, van der Laan, Veleva, Wahlberg, Walter, Weber, Weitkamp, Wurster, Yar, You and Zivelonghi41, Reference Nishiyama, Fukaya, Suzuki and Eto42, Reference Porollo, Dvoriashin, Vorobyev and Konobeev43, Reference Ghoniem and Hammad44, Reference Kuleshova, Gurovich, Shtrombakh, Erak and Lavrenchuk45, Reference Kocik, Keilova, Cizek and Prochazka46, Reference Jia and Dai47]. Figure 5(a) presents the case of Fe–2.25% Cr VVER-1000 steel irradiated to different neutron doses, at two different temperatures. The ΔDBTT data set ➀ corresponds to irradiation temperature T = 400 °C, neutron dose range 1022–5 × 10²³ m−2 and grain size D g = 10 µm (shear band thickness d ∼ 700 nm; see Table I caption) [Reference Nishiyama, Fukaya, Suzuki and Eto42]. For a fixed irradiation temperature, the defect size is mostly dose independent, while the defect number density linearly augments with the neutron dose (or fluence) [Reference Matijasevic, Lucon and Almazouzi2, Reference Bruemmer, Simonen, Scrott, Andresen, Was and Nelson48]. The defect size D = 7 nm and number densities N corresponding to data set ➀ are evaluated based on TEM observations [Reference Porollo, Dvoriashin, Vorobyev and Konobeev43]. Similarly, ΔDBTT data set ➁ corresponds to irradiation temperature T = 288 °C, neutron fluence range 7 × 10²³–1.4 × 1024 m−2 and grain size D g = 2 µm (shear band thickness d ∼ 320 nm) [Reference Ghoniem and Hammad44]. The defect size D = 5 nm and number densities N associated with data set ➁ come from Reference Kuleshova, Gurovich, Shtrombakh, Erak and LavrenchukRefs. 45 and Reference Kocik, Keilova, Cizek and Prochazka46. The ΔDIAT curves A and B are calculated with Eq. (1) using D, d, and N values associated with data sets ➀ and ➁, respectively, whereas ΔT max = 110 °C and λ = 11 nm (see “Grain size and orientation effect on ΔDIAT and dislocation microstructures”).
Comparison between calculated ΔDIAT results and actual ΔDBTT data obtained for different ferritic materials and neutron irradiation conditions. (a) Case of Fe–2.25% Cr VVER-1000 steel irradiated to different neutron doses at two different temperatures. ΔDBTT data sets ➀ and ➁ (solid symbols) are associated with ΔDIAT curves A and B (dashed lines), calculated using Eq. (1) with corresponding input data. (b) Case of two different Fe–9% Cr steels irradiated to different neutron doses at 300 °C: F82H and Eurofer97. ΔDBTT data sets ➂ and ➃ (solid symbols) are associated with ΔDIAT curves C and D (dashed lines), calculated using Eq. (1) with the corresponding input data.
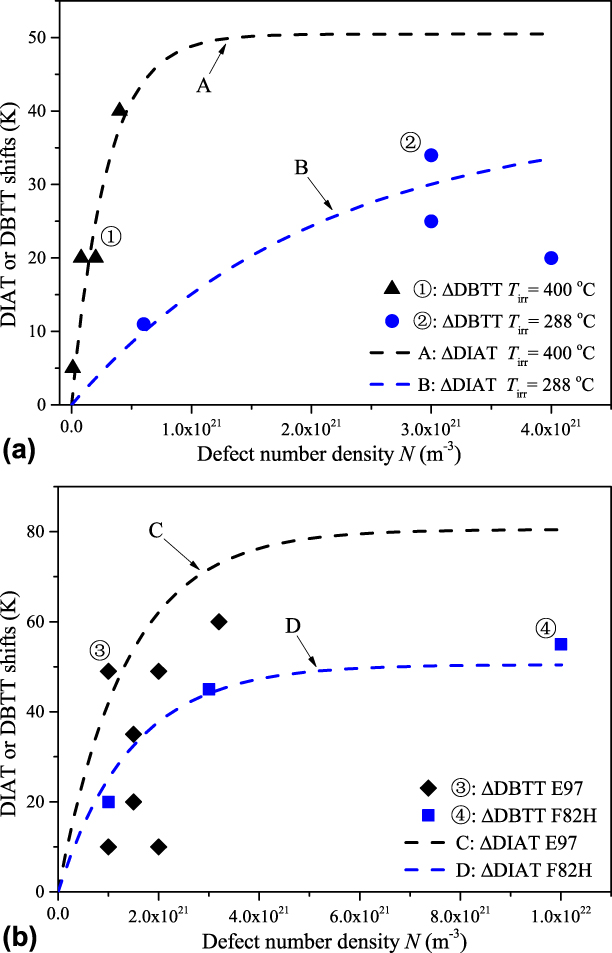
Interestingly, we found that Eq. (1) also applies to ferritic alloys of different Cr concentrations. Figure 5(b) presents two different Fe–9% Cr steel cases, Eurofer97 and F82H, irradiated to different neutron doses, at 300 °C. The ΔDBTT data set ➂ corresponds to Eurofer97 steel, neutron doses 0.3–2.5 dpa and lath (or grain) size D g = 1 µm (shear band thickness d ∼ 220 nm) [Reference Matijasevic, Lucon and Almazouzi2]. The defect size D = 15 nm and number densities N associated with data set ➂ are taken from Ref. Reference Matijasevic, Lucon and Almazouzi2. The ΔDBTT data set ➃ corresponds to F82H steel, neutron doses 0.2–2.5 dpa and lath (or grain) size D g = 2 µm (shear band thickness d = 320 nm) [Reference Rieth, Dafferner and Rohrig40]. The defect size D = 7 nm and defect densities N corresponding to data set ➃ are taken from Ref. Reference Jia and Dai47. The ΔDIAT curves C and D are calculated with Eq. (1) using D, d, and N values associated with data sets ➂ and ➃, respectively (using ΔT max 110 °C and λ = 11 nm, as before).
The ΔDIAT versus ΔDBTT equivalence reported in Fig. 5 can be rationalized as follows. Brittle fracture in ferritic materials is governed by the cleavage initiator distributions (e.g., carbide particles) [Reference Forget, Marini and Vincent49]. This situation can be statistically treated using the weakest-link theory [Reference Anderson, Steinstra and Dodds50] in combination with crystal plasticity modeling [Reference Vincent, Libert, Marini and Rey51, Reference Liber, Rey, Vincent and Marini52]. The fracture probability associated with a given dose level then only depends on the stress field acting on the cleavage initiators [see Eq. (7) in p. 300 of Ref. Reference Forget, Marini, Parrot, Todeschini, Besson, Moinereau and Steglich53]. This perception is consistent with the well-known empirical correlation ΔDBTT ∼ ηΔσapplied [Reference Sokolov, Nanstad and Miller54], where Δσapplied is the irradiation-induced increase of the yield stress and “η” the proportionality factor (in K/MPa units). Likewise, we have seen that changing the grain size affects the dislocation sub-structure characteristic dimensions (see Fig. 4) and associated internal stress landscape τint. The corresponding ΔDIAT trends (see Figs. 2 and 3) indicate that the “exp(−D/λ)” and “exp(−d 2DN)” terms in Eq. (1) actually scale with subgrain σinternal/σapplied evolutions, which finally makes it ΔDIAT ∼ θΔσapplied [Reference Li and Robertson19, Reference Gururaj, Robertson and Fivel38], where “θ” is expressed in K/MPa units. Factor η ≈ θ in Fe–2.25% Cr grains and therefore ΔDIAT ≈ ΔDBTT for a broad Δσapplied domain, compatible with the materials and irradiation conditions as documented in Fig. 5.
One more simulation setup, including a subgrain microcrack, has been tested in an attempt to emulate this most usual fracture initiation condition [Reference Matijasevic, Lucon and Almazouzi2, Reference Matijasevic, Van Renterghem and Almazouzi3]. We thus found that the crack-induced stress field yields no major difference in terms of ΔDIAT magnitude: Eq. (1) is applicable without any further microcrack-related correction (unpublished results). The reader should, however, keep in mind that the current ΔDIAT framework is exclusively based on dislocation-mediated plasticity mechanisms. This approach characterizes the brittle–ductile transition through the quantitative dislocation mobility changes associated with defect dispersion populations, regardless of the defect type (dislocation loop, vacancy loop, voids, or others) involved. In certain irradiation conditions, additional physical causes may also contribute to the dose-dependent fracture response evolutions. For example, the ΔDBTT level is systematically higher in the presence of significant segregating element concentrations at grain boundaries and/or particle/matrix interfaces (e.g., He [Reference Rieth, Dafferner and Rohrig40] and Chap. 6 in [Reference Was55] for details). This means segregations have a distinct contribution to the DBTT shift, adding up to the plasticity mechanisms considered in “Investigation methods”. It is therefore expected that ΔDBTT > ΔDIAT under a certain (yet to be explored) range of irradiation conditions. Accounting for these effects entails further investigation effort by means of adapted simulation methods (e.g., the segregation effect [Reference Yamaguchi56]). In its current form, Eq. (1) best applies to irradiation conditions, where interfacial segregations, helium production, included particle dissolution, or grain size changes are limited, i.e., for relatively low dose and irradiation temperature conditions in ferritic steels. The limiting radiation condition specified in this section is at best indicative (dose < 2–3 dpa, irradiation temperature T < 400 °C), being associated with the largest disperse defect size tested herein.
Conclusions
Grain scale plasticity is investigated using three-dimensional DD simulations adapted to ferritic materials. The effect of defect dispersions on the effective screw dislocation mobility is examined under strain rate–controlled tensile loading conditions, accounting for thermally activated mobility rules and cross-slip mechanism at 300 K. The corresponding defect-induced changes are associated with a Defect-Induced Apparent straining Temperature shift, calculated without adjusting parameters and noted “ΔDIAT.” Analysis of the simulation trends shows that
(1) For a given defect dispersion, the ΔDIAT amplitude increases with the grain size, depending on the grain orientation;
(2) The ΔDIAT level obtained for a disperse defect size D and defect number density N case closely reflects the experimentally observed ΔDBTT associated with exactly the same, actual D and N case;
(3) The reported ΔDIAT evolutions scale with the shear band thickness parameter “d” that itself is grain size and grain orientation dependent;
(4) The proposed ΔDIAT indicator best applies to a dose range and irradiation temperatures, where the radiation-induced modifications of the material (segregations, inclusion, grain size changes, etc.) are minimal.
The ΔDIAT concept is developed with a view to facilitate the prediction of dose-dependent DBT temperature shift evolutions, based on direct observation/measurement of the radiation-induced defect populations. More precisely, DBT shift evolutions can be estimated using Eq. (1) together with actual material microstructure (e.g., EBSD analysis) and radiation-induced disperse defect (e.g., SANS measurements) observation data. This approach can potentially help reducing the need for costly and time-consuming post-irradiation mechanical testing in hot cells and provide valuable complementary information, especially if used in combination with conventional surveillance techniques.
Investigation methods
Dislocation stress–velocity rules
DD simulations of plastic strain spreading are carried out using the TRIDIS code, where the dislocation lines are treated as discrete, orthogonal edge and screw segments [Reference Verdier, Fivel and Groma57]. These segments glide in discrete body center cubic lattice, where the lattice spacing parameter represents 10 times the Burgers vector magnitude b. Dislocation segment displacements are calculated according to applicable dislocation mobility rules. In body-center cubic metals, screw dislocation velocity is temperature and stress dependent [Reference Tang, Kubin and Canova58, Reference Caillard and Martin59, Reference Gilbert, Schuck, Sadigh and Marian60], as
 $$\eqalign{{v_{{\rm{screw}}}} = \,hJX' = h{{8\pi {{\left( {{\tau ^*}} \right)}^2}} \over {\mu Bh}}\cr\exp \left( { - {{\Delta {H_0}} \over {{k_{\rm{B}}}T}}{{\left[ {1 - {{\left( {{{{\tau ^*}} \over {{\tau _0}}}} \right)}^p}} \right]}^q}} \right){{{X_\infty }L} \over {{X_\infty } + L}}\quad ,$$
where h is the Peierls valley separation, i.e., the Burgers vector magnitude b associated with the (110)[111] SS [Reference Weinberger, Boyce and Battaile61]; J is the kink pair nucleation rate per unit dislocation length, and X′ = X ∞L/(X ∞ + L) represents the glide distance of the kink pair before its annihilation with an opposite kink pair, propagating along a finite-length screw dislocation with length L. In the right-hand side of Eq. (2), B is the viscous drag coefficient, µ is the shear modulus, k B is the Boltzmann constant, T is the straining or test temperature, τ* is the effective resolved shear stress acting on the dislocation segment, and ΔH 0 and τ0 are the kink pair formation energy and Peierls shear stress at 0 K, respectively. Parameters p and q are used to characterize the shape of the thermal activation barrier ΔG, that is, ΔG = ΔH 0[1 − (τ*/τ0)p]q. Quantity X ∞ is a reference kink pair propagation distance, corresponding to
 $${X_\infty } = 2{\left( {{{{v_{\rm{k}}}} \over J}} \right)^{{1 / 2}}}\quad ,$$
where v k = v edge = τ*b/B [Reference Alshits, Indenbom and Nabarro62, Reference Gurrutxaga-Lerma, Shehadeh, Balint, Dini, Chen and Eakins63].
The stress- and temperature-dependent constitutive rules, together with the material-dependent parameters of Table II, enable a gradual transition of the stress–velocity response with increasing straining temperature. The corresponding stress–strain evolutions are fully consistent with mechanical response of Fe–2.25% Cr steel for the whole DBT temperature range [Reference Gilbert, Queyreau and Marian64, Reference Po, Cui, Rivera, Cereceda, Swinburne, Marian and Ghoniem65]. The cross-slip mechanism implemented herein is based on a specific Monte Carlo type algorithm, depending on the stress applied on the primary slip plane and the corresponding cross-slip plane (please see Reference Chaussidon, Robertson, Rodney and FivelRefs. 27, Reference Robertson and Gururaj35, and Reference Chaussidon, Robertson and Fivel36 for details).
Material-dependent parameters associated with Fe–2.25% Cr grains.

Grain setups and dislocation/defect interaction implementation
The different DD simulation setups implemented and tested herein are listed in Table III. RPV steels usually present a multi-lath microstructure, with typical lath dimensions a × 10 × 10 µm3. Simulating a × 10 × 10 µm3 volumes irradiated to 0.1 dpa requires handling as many as 105 defects, representing a significant computation load for small computer systems. We thereby checked that the shear band structures obtained in a-µm3 cubic grains are identical to those obtained in a × 10 × 10 µm3 laths, in terms of shear band thickness and mobile and stored dislocation densities (see, e.g., Fig. 10 in Ref. Reference Chaussidon, Robertson and Fivel36).
The different DD simulation setup cases treated in this work.
Additionally, direct TEM observations have shown that the strain-induced dislocations are mostly confined inside of the individual laths, up to significant macroscopic tensile strain levels, regardless of the internal coherency stresses coming from the other grains [Reference Gururaj, Robertson and Fivel28, Reference Gururaj, Robertson and Fivel38, Reference Robertson, Obrtlik and Marini39, Reference Garcia-Rodriguez66]. Using impenetrable grain boundaries allows for a realistic description of intragranular stress field and accompanying the formation of the sub-structure, during DD simulations of bainitic ferritic grains [Reference Robertson and Gururaj35]. Further evidence supporting these claims is presented in Ref. Reference Jiang, Devincre and Monnet67, where the grain shape effect on the plastic response has been investigated in detail. The use of small cubic grain is thus preferred for the sake of minimizing the computational load.
Neutron irradiation generates small, mobile defects that later form various types of defect clusters, including interstitial dislocation loops. At room temperature, those loops are trapped by impurities and act as immobile obstacles, with respect to mobile dislocations. In the present simulations, the defect clusters are implemented in the form of planar, square-shaped surfaces called facets, oriented normal to the (100) direction for simplicity. The interaction mechanism between dislocations and facets is as follows: once a dislocation contact a facet, the effective shear stress applied on the dislocation line τ* is compared with the critical defect strength τdefect. The mobile dislocations can cut through a given facet provided τ* > τdefect. The selected τdefect level is calibrated based on the MD simulation results, depending on the incoming dislocation (edge or screw) character (see Reference Terentyev, Bacon and OsetskyRefs. 68 and Reference Terentyev, Grammatikopoulos, Bacon and Osetsky69 for details).
Additionally, the validity of this simplified dislocation/defect interaction treatment has been evaluated by comparison with detailed DD simulation setups including actual prismatic loops [Reference Li, Robertson, Shukeir and Dupuy70, Reference Li, Robertson, Shukeir and Dupuy71]. It is found that in the presence of cross-slip, the effective defect interaction strength and corresponding dislocation velocity are fully consistent with the MD-observed interaction mechanisms. This conclusion holds true even though the facet/defects have no associated stress field.
Uniaxial tension is applied along the (100) direction under strain rate–controlled loading conditions with  $\dot{\varepsilon } = 100\;{{\rm{s}}^{ - 1}}$. Different irradiation conditions are simulated by inserting different defect number densities (5 × 10²⁰–2 × 10²¹ m−3) and defect sizes (15 and 25 nm) [Reference Matijasevic, Lucon and Almazouzi2, Reference Matijasevic, Van Renterghem and Almazouzi3, Reference Rieth, Dafferner and Rohrig40]. Simulations with grain sizes of 1 µm (Grain 1 in Table III) and 2 µm (Grain 2 and Grain 3 in Table III) have been carried out. Grain 2 and Grain 3 have two different crystallographic orientations: in the first case (Grain 2), the grain z-axis is orientated along the (100) direction. In the second case (Grain 3), the grain z-axis is orientated along the $\left( {\bar{1}54} \right)$ direction. In all the cases, the initial dislocation sources belong to the a/2 $\left( {101} \right)\left[ {\bar{1}\bar{1}1} \right]$ SS, associated with cross-slip systems a/2 $\left( {1\bar{1}0} \right)\left[ {\bar{1}\bar{1}1} \right]$ and a/2 $\left( {011} \right)\left[ {\bar{1}\bar{1}1} \right]$. The Schmid factors corresponding to the two selected crystallographic orientations are indicated in Table IV.
Schmid factors acting in the different SS submitted to a (100) tensile loading for the different DD simulations cases tested in this work.
Defect-induced changes of effective dislocation mobility and DIAT shift concept
The implemented facet (loop) dispersions act as obstacles to the dislocation motion, thus affecting the effective mobility of the screw dislocation populations. The dislocation mobility change due to a given defect dispersion can be characterized by an indicator called the ΔDIAT at a fixed straining temperature. This concept derives from the radiation-induced shift of the ΔDBTT, usually defined for a fixed impact energy (or fracture toughness) level [Reference Li and Robertson19]. The ΔDIAT level associated with a given defect dispersion is calculated as explained below:
Step 1: A DD simulation is carried out in a defect-free grain, at T = 300 K, up to a reference plastic strain level (identified with subscript 0). The average stress  $\overline {\tau _0^*}$ and corresponding velocity $\overline {{v_0}}$ levels are calculated first, accounting for all the screw dislocation segments generated during the simulation. In the absence of defect clusters, it can be shown that $\overline {{v_0}}$ is a (quasi) linear function of $\overline {\tau _0^*}$.
Step 2: Irradiated grains including different defect dispersions (identified with subscript 1) are then strained to the same reference level for the sake of obtaining the effective resolved shear stress  $\tau _1^*$ and corresponding velocity v 1 at the same straining temperature T = 300 K. It is important to note that exactly the same dislocation mobility rule is used in both irradiated and non-irradiated cases, yielding the following relation:
 $${{\overline {{v_0}} } \over {{v_1}}}{\left( {{{\tau _1^*} \over {\overline {\tau _0^*} }}} \right)^{{3 / 2}}} = \exp \left( {{{\Delta {G_1}\left( {\tau _1^*} \right)} \over {2{k_{\rm{B}}}{T_1}}} - {{\Delta {G_0}\left( {\overline {\tau _0^*} } \right)} \over {2{k_{\rm{B}}}{T_0}}}} \right)\quad .$$
An apparent straining temperature T 1 can be obtained by solving Eq. (4), yielding the effective straining temperature shift ΔT = (T 0 − T 1) for the considered (screw) segment.
Step 3: For a given defect dispersion, repeating the step 2 for all screw dislocation segments can obtain a distribution of ΔT. The ΔDIAT level represents the most typical ΔT variation and is thus statistically calculated as follows:
 $$\Delta {\rm{DIA}}{{\rm{T}}_{{\rm{sim}}}} = \sum\limits_{{\tau ^*} = \tau _{\min }^*}^{\tau _{\max }^*} {\left[ {\sum\limits_{L = {L_{\min }}}^{{L_{\max }}} {\Delta T\left( {L,{\tau ^*}} \right)p\left( {L,{\tau ^*}} \right)} } \right]} \quad ,$$
where τ* is the effective resolved shear stress acting on a given screw segment and p(L, τ*) is the corresponding probability of occurrence of a given ΔT amplitude. It can be shown that the proposed ΔDIAT calculation method is independent of the selected reference strain level.
The present ΔDIAT concept does not imply that dislocation interaction with dispersed obstacles and thermally activated lattice friction are actually the same physical mechanisms. It implies that dislocation/defect interactions are, however, equivalent to a definite temperature reduction, in terms of statistical, thermally activated (screw) dislocation velocities. From the author’s standpoint, this defect/temperature equivalency can greatly facilitate the prediction of dose-dependent brittle–ductile transition temperature shifts, based on observation results (see also “The ΔDIAT versus ΔDBTT correlation”).
To the best of the author’s knowledge, there is currently no experimental technique enabling direct evaluation of dislocation population mobility, let alone their characteristic, dose-dependent evolution. An atomic-scale model has been recently developed, however, explaining the brittle–ductile transition based on isolated dislocation/obstacle interaction cases [Reference Swinburne and Dudarev72]. This model confirms that defect-induced dislocation mobility evolutions can help revealing/evaluating the brittle–ductile transition evolutions.
Acknowledgments
This project has received funding from the Euratom Research and Training Programme 2014–2018 under Grant Agreement No. 661913 “SOTERIA”. The views and opinions expressed herein do not necessarily reflect those of the European Commission. The support of Foundation for Youth Innovation Talents in Education Department of Guangdong (2016KQNCX005) and Guangdong Provincial key S & T Special Project (2017B020235001) is also acknowledged.


 Open access