





Non-technical Summary
Multituberculate mammals were an extraordinary group that coexisted with dinosaurs for a remarkably long time. They not only survived the catastrophic end-Cretaceous event, which wiped out the dinosaurs (exclusive of birds), but also thrived in various environments, sharing their domain within the early diversification of modern placental and marsupial mammals. However, in a puzzling turn of events, these enduring creatures vanished from the fossil record in the Eocene Epoch. The mystery of their extinction has prompted various theories regarding their disappearance, one of which suggests that the appearance and rise of modern rodents played an important role in their extinction. To test this idea, this new research reconstructed the complex spatial relationships between plant–mammal associations based on the geographic occurrences of multituberculates and six coeval families of fossil rodents, with respect to the known record of fossil plants. The resulting spatial analysis supports an explanation for the extinction of multituberculates centered on the direct effect of the loss of forest habitat, particularly the loss of boreal forests dominated by dawn redwood and Chinese swamp cypress. This study not only helps unravel a mystery in the ancient past but also imparts crucial lessons for our present and future. It provides valuable insights into the factors that can threaten species, guiding us toward more effective conservation and ecosystem management practices for the future.
Introduction
The question of multituberculate extinction has long captivated paleontologists, sparking curiosity and investigation for over a century (Matthew Reference Matthew1897; Jepsen Reference Jepsen1949; Landry Reference Landry1965; Van Valen and Sloan Reference Van Valen and Sloan1966; Hopson Reference Hopson1967; Krause Reference Krause, Flanagan and Lillegraven1986; Wood Reference Wood2010; Adams et al. Reference Adams, Rayfield, Cox, Cobb and Corfe2019). These ancient mammals, which first emerged during the Jurassic Period, remarkably survived the catastrophic end-Cretaceous mass extinction event. This survival made them one of the longest-lived mammalian lineages on Earth, with potential to dominate the mammalian landscape of the subsequent Cenozoic era. However, the fate of multituberculates took a drastic turn during the late Paleocene and Eocene Epochs. Their diversity and abundance rapidly declined, with a significant drop occurring near the Paleocene/Eocene boundary around 56 Ma. By the end of the Eocene, approximately 34 Ma, these once-thriving mammals had vanished worldwide (Robinson et al. Reference Robinson, Black and Dawson1964; Black Reference Black1967; Krause Reference Krause1982; Ostrander Reference Ostrander1984; Storer Reference Storer1993). The enigma of their extinction is particularly compelling given their survival of the mass extinction event at the end of the Cretaceous, and Paleocene–Eocene thermal maximum event at the onset of the Eocene Epoch (Kielan-Jaworowska et al. Reference Kielan-Jaworowska, Cifelli and Luo2004; Rose Reference Rose2006; Wilson et al. Reference Wilson, Evans, Corfe, Smits, Fortelius and Jernvall2012), only to succumb to unknown factors during the late Eocene.
Multituberculates, a group within the Allotheria clade (alongside the extinct Gondwanatheria and Haramiyida), share a closer relationship with modern monotremes like the platypus (Ornithorhynchus) than with any other extant mammals (Kielan-Jaworowska et al. Reference Kielan-Jaworowska, Cifelli and Luo2004; Rose Reference Rose2006; Celik and Phillips Reference Celik and Phillips2020). Averianov et al. (Reference Averianov, Martin, Lopatin, Schultz, Schellhorn, Krasnolutskii, Skutschas and Ivantsov2021) offers a recent summary regarding their origin and close relationship with the early Jurassic Haramiyida. Characterized by their cheek teeth adorned with multiple rows of cusps or tubercles and the distinctive, broad, serrated blade-like fourth premolars known as plagiaulacoid teeth, these mammals also featured a long diastema separating the incisors from the posterior teeth. This dental arrangement bears a superficial resemblance to rodents, although multituberculate incisors were not ever-growing. However, some Cretaceous species exhibited continuously erupting lower incisors, indicating prolonged wear (see Kielan-Jaworowska et al. Reference Kielan-Jaworowska, Hurum and Lopatin2005). The unique palinal jaw stroke, moving front-to-back, enabled multituberculates to efficiently slice and crush hard seeds and nuts, a feeding mechanism quite distinct from the propalinal (back-to-front) and transverse (side-to-side) motions employed by rodents and lagomorphs (Satoh Reference Satoh1997; Bair Reference Bair2007; Koenigswald et al. Reference Koenigswald, Anders, Engels, Schultz and Ruf2010).
The skeletal anatomy of multituberculates is primarily understood through well-preserved specimens from the Cretaceous of Mongolia, revealing a diverse array of adaptations. Notably for the study of Cenozoic members of the group, the late Paleocene genus Ptilodus suggests arboreal behavior among the Ptilodontoidea (Krause Reference Krause1977; Jenkins and Krause Reference Jenkins and Krause1983; Krause and Jenkins Reference Krause and Jenkins1983). These later early Cenozoic multituberculates exhibited specialized ankle adaptations, enabling extensive foot mobility and a prehensile tail, which, along with large, divergent toes (hallux), facilitated adept climbing and maneuvering among tree branches.
The early Cenozoic multituberculates are divided into two primary groups: the ground-dwelling, beaver-sized Taeniolabidoidea and the arboreal, chipmunk-sized Ptilodontoidea. In North America, Taeniolabidoidea species appeared in the early Paleocene, but disappeared before the middle Paleocene (Tiffanian North American Land Mammal Age [NALMA]; Weil and Krause Reference Weil, Krause, Janis, Gunnell and Uhen2007; Krause et al. Reference Krause, Hoffmann, Lyson, Dougan, Petermann, Tecza, Chester and Miller2021). This group persisted until the end of the Paleocene in Asia but did not survive into the Eocene in Asia. The arboreal Ptilodontoidea, however, were more successful and lingered into the Eocene as the last bastion of multituberculates. This group, during the late Paleocene and Eocene, consisted of four families: Eucosmodontidae, Microcosmodontidae, Neoplagiaulacidae, and Ptilodontidae (Weil and Krause Reference Weil, Krause, Janis, Gunnell and Uhen2007). Among these, only Neoplagiaulacidae and possibly Eucosmodontidae continued into the Eocene.
The genus Neolitomus, a common species from the basal Eocene (Wasatchian) of Wyoming and Colorado, is potentially part of the Eucosmodontidae family. However, several authorities, including Simmons (Reference Simmons, Szalay, Novacek and McKenna1993), Kielan-Jaworowska and Hurum (Reference Kielan-Jaworowska and Hurum2001), and Weil and Krause (Reference Weil, Krause, Janis, Gunnell and Uhen2007), classify Neolitomus outside Eucosmodontidae, suggesting it represents a new lineage of multituberculates in the late Paleocene and early Eocene. The Neoplagiaulacidae family showcased greater diversity during the Eocene, represented by three genera: Ectypodus, the closely related Parectypodus, and the rare Mesodmops, the latter being the sole Eocene multituberculate found in Asia, specifically in the Wutu Basin of China (Tong and Wang Reference Sheng and Wang1994).
In North America, multituberculate species richness significantly declined across the Paleocene/Eocene boundary, from more than nine coexisting species in the late Paleocene to merely four in the Eocene. The scarcity of multituberculate fossils in well-sampled middle Eocene sites, such as the Bridger Formation in southwest Wyoming, indicates a marked decline post-boundary. Nevertheless, the group survived into the late Eocene, with at least 124 fossil occurrences in North America (Robinson et al. Reference Robinson, Black and Dawson1964; Black Reference Black1967; Krause Reference Krause1982; Ostrander Reference Ostrander1984; Storer Reference Storer1993; Weil and Krause Reference Weil, Krause, Janis, Gunnell and Uhen2007). In Europe, early Eocene localities in France, Belgium, and England have yielded Ectypodus specimens, although they are absent by the middle Eocene (Russell et al. Reference Russell, Godinot, Louis and Savage1979; Smith and Smith Reference Smith and Smith2003; Marandat et al. Reference Marandat, Adnet, Marivaux, Martinez, Vianey-Liaud and Tabuce2012).
Paleontologists have proposed various hypotheses to explain the extinction of multituberculates, which broadly fall under two major evolutionary frameworks. The first framework suggests that extinction was driven by intrinsic biotic interactions, such as the introduction of new predators, parasites, diseases, and changes in food sources, or direct competition with other species for resources. The second framework attributes extinctions to abiotic factors, such as climate change or asteroid impacts. These frameworks align with two prominent evolutionary theories: the Red Queen hypothesis, which posits that the constant state of extinction in the fossil record reflects an ongoing evolutionary arms race, where species that fail to adapt face extinction (Van Valen Reference Van Valen1973), and the Court Jester hypothesis, which attributes extinctions to significant abiotic changes or random events in the physical environment (Barnosky Reference Barnosky2001). Given that multituberculate extinction was gradual and not associated with a mass extinction event, it is unsurprising that most researchers attribute their decline to losing an evolutionary arms race with better-adapted coeval species during the Eocene.
The most widely supported hypothesis for multituberculate extinction is direct competition with rodents. Rodents first appeared in North America during the late Paleocene, likely as immigrants from Asia, and rapidly diversified in the early Eocene. The competitive exclusion hypothesis suggests that rodents outcompeted multituberculates, a theory supported by many researchers (Jepsen Reference Jepsen1949; Van Valen and Sloan Reference Van Valen and Sloan1966; Hopson Reference Hopson1967; Krause Reference Krause, Flanagan and Lillegraven1986; Wood Reference Wood2010; Adams et al. Reference Adams, Rayfield, Cox, Cobb and Corfe2019). This hypothesis is primarily supported by the similar morphology of the skull in both groups and the timing of the emergence of rodents coinciding with the decline of multituberculates. Rodents likely evolved within the Paleocene Asian order Anagalida, comprising the families Anagalidae and Pseudictopidae (Meng and Wyss Reference Meng and Wyss2001). Evidence of their presence in the late Paleocene (Gashatan) Bayan Ulan fauna of Inner Mongolia includes the primitive genus Tribosphenomys (Meng et al. Reference Meng, Ni, Li, Beard, Gebo, Wang and Wang2007). In North America, rodents first appear during the Clarkforkian NALMA), just before the Paleocene/Eocene boundary (Rose Reference Rose1980, Reference Rose1981). The scarcity of Eocene multituberculates in Asia after the emergence of rodents, with only early Eocene records from the Wutu Fauna of China (Tong and Wang Reference Sheng and Wang1994), further supports the competitive exclusion theory as the leading cause of their extinction during the Eocene (Jepsen Reference Jepsen1949; Van Valen and Sloan Reference Van Valen and Sloan1966; Hopson Reference Hopson1967; Krause Reference Krause, Flanagan and Lillegraven1986; Wood Reference Wood2010; Adams et al. Reference Adams, Rayfield, Cox, Cobb and Corfe2019).
However, some researchers have offered alternative explanations. Ostrander (Reference Ostrander1984) suggested climate change as a mechanism for multituberculate extinction, coinciding with rapid climatic changes such as the global warming event at the onset of the Eocene (reviewed by McInerney and Wing Reference McInerney and Wing2011), and the global cooling event at the end of the Eocene (reviewed by Prothero Reference Prothero1994). Landry (Reference Landry1965) rejected the rodent competition theory outright, without proposing an alternative mechanism. In contrast, Rose (Reference Rose2006) offered a more nuanced explanation, involving competition with placental mammals. Rose’s idea suggests a potential reproductive disadvantage for multituberculates, hypothesizing that they may have laid eggs like modern monotremes or carried their young in pouches like marsupials, resulting in smaller litters compared with modern rodents (see also Adams et al. Reference Adams, Rayfield, Cox, Cobb and Corfe2019), an idea consistent with a Red Queen–like scenario.
The objective of this study is to explore the paleobiogeography of multituberculates and rodents during the Eocene, focusing on their interrelationship with ancient forest communities. By examining the distribution and ecological associations of multituberculates alongside various rodent families, and analyzing the paleobotanical record, this study aims to determine the specific types of forests associated with these groups. In particular, the research seeks to identify the forest types linked to Eocene multituberculates (the family Neoplagiaulacidae plus Neolitomus) and six contemporaneous Eocene rodent families. This spatial comparative analysis intends to clarify the ecological forest niches occupied by these two significant mammalian groups. The study hypothesizes that multituberculates were closely associated with a distinct forest environment, different from those of rodents, potentially affecting their evolutionary pathways and eventual extinction. The null hypothesis posits that multituberculates and rodents were evenly and randomly distributed across forest environments with respect to each other, indicating no specific ecological preference or difference between the two groups of mammals. This study aims to rigorously test these two contrasting hypotheses.
Methods
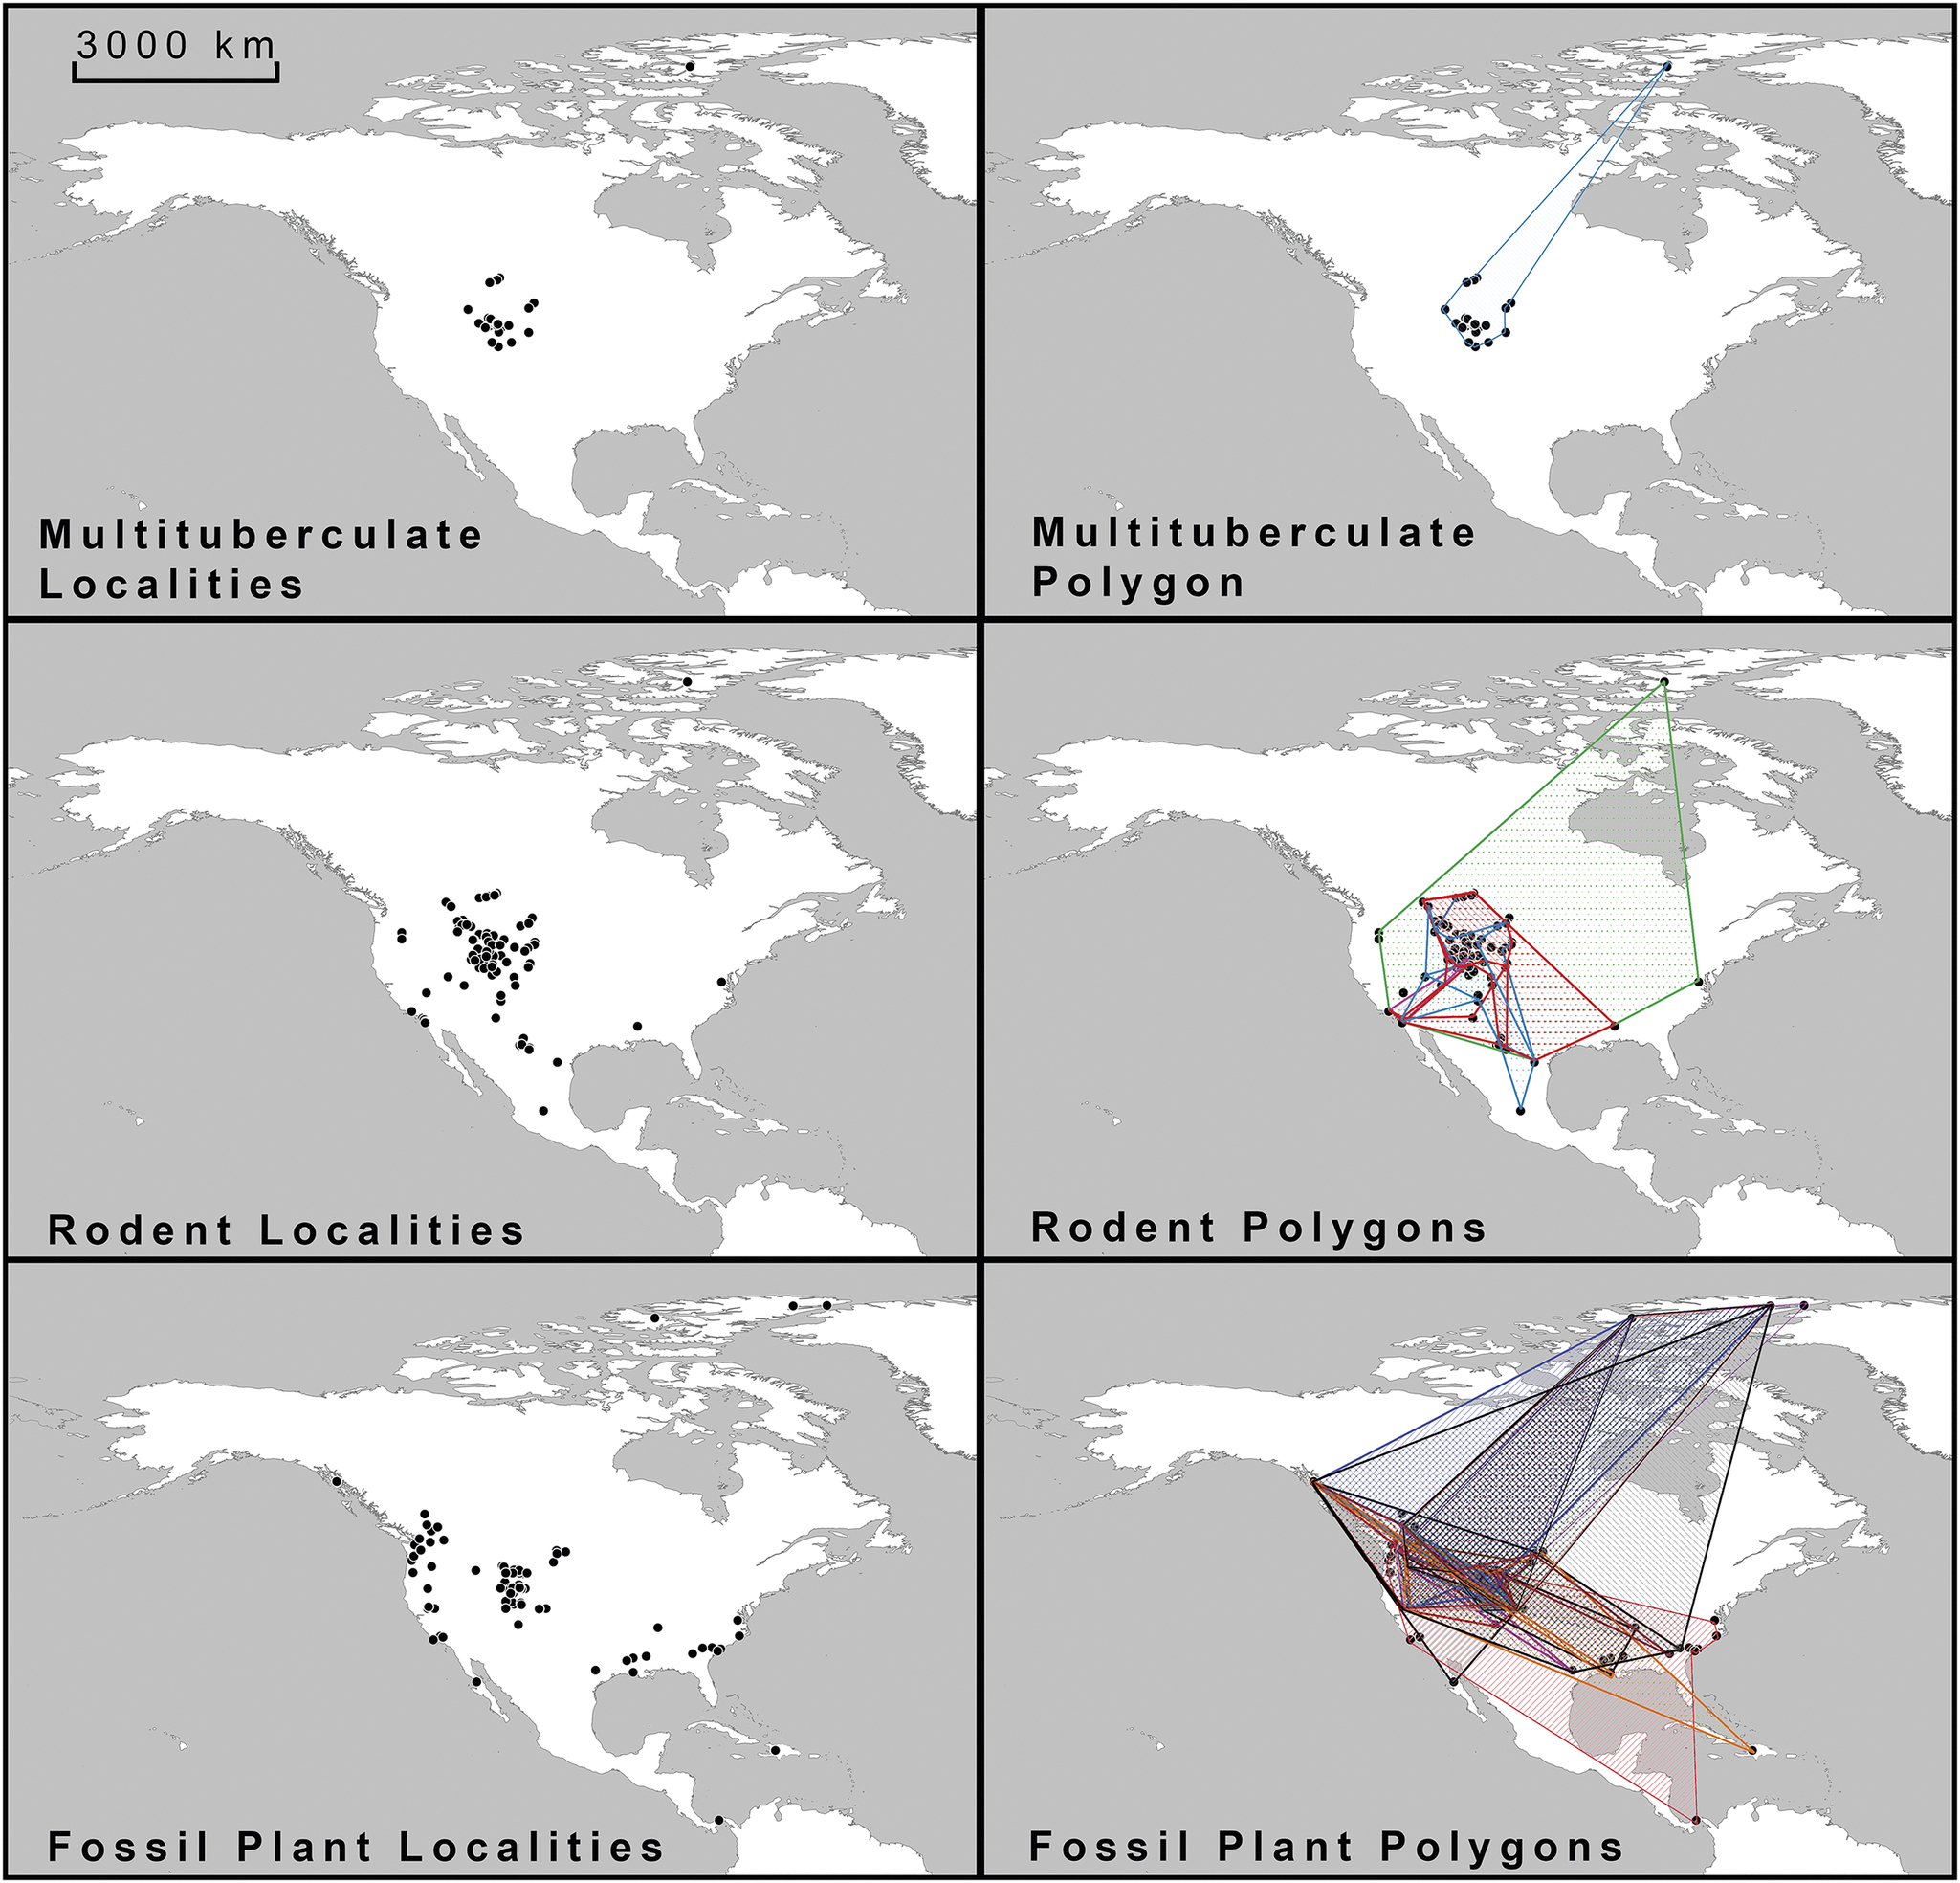
The latitude and longitude data of Eocene North American fossil sites for multituberculates (Neoplagiaulacidae and Neolitomus) and six Eocene rodent families (Ischyromyidae, Cylindrodontidae, Sciuravidae, Eutypomyidae, Eomyidae, and Protoptychidae (as defined in McKenna and Bell Reference McKenna and Bell1997) were gathered from primary literature, online databases (such as the Paleobiology Database), and various museum collections (see Fig. 1 and Supplementary Files for lists of references). The genera within these groups are as follows:
-
Multituberculates: Ectypodus, Parectypodus, Neolitomus.
-
Ischyromyidae: Paramys, Thisbemys, Notoparamys, Quadratomus, Rapamys, Tapomys, Manitsha, Pseudotomus, Franimys, Reithroparamys, Acritoparamys, Uriscus, Microparamys, Lophiparamys, Churcheria, Strathcona, Mytonomys.
-
Cylindrodontidae: Pareumys, Cylindrodon, Pseudocylindrodon, Ardynomys, Dawsonomys, Anomoemys, Presbymys, Mysops, Jaywilsonomys, Tuscahomys.
-
Sciuravidae: Sciuravus, Knightomys, Pauromys, Tillomys, Taxymys, Prolapsus.
-
Eutypomyidae: Mattimys, Microeutypomys, Janimus, Eutypomys.
-
Eomyidae: Simiacritomys, Litoyoderimys, Yoderimys, Zemiodontomys, Namatomys, Metanoiamys, Paranamatomys, Montanamus, Adjidaumo, Protadjidaumo, Cristadjidaumo, Aguafriamys, Aulolithomys, Cupressimus, Centimanomys.
-
Protoptychidae: Protoptychus, Presbymys.
Map of plotted Eocene fossil localities and constructed polygon shapes used in the study.

These occurrences were plotted using QGIS software and converted to decimal coordinates. QGIS is an open-source geographic information system (GIS) licensed under the GNU General Public License and is an official project of the Open-Source Geospatial Foundation (see QGIS 2024; Supplementary Files).
To define the minimum paleogeographic range of each mammal group, vector polygon shapes were created using the three nearest points for each group, resulting in a total of seven mammal polygon shapes (Fig. 1). These shapes were generated using the concave-hull algorithm in QGIS, which forms a complex shape around the data points, set to a value of three, creating a tight-fitting, conservative polygon (Moreira and Santos Reference Moreira, Santos, Braz, Vázquez and Pereira2007).
These seven mammal polygons were then compared with 30 similar polygons based on fossil plant occurrences, which were derived from leaf fossil preservation data (Fig. 1, Supplementary Files). The 30 fossil plant groups examined included those that produced seeds potentially serving as food for multituberculates and rodents. The seed characteristics (e.g., cone-like, hard nuts, acorn-like, bean husks, small berries, fleshy fruits, winged seeds/samara, or cotton-like seeds) were documented. These plants likely provided important food resources and habitats for the mammals examined in the study.
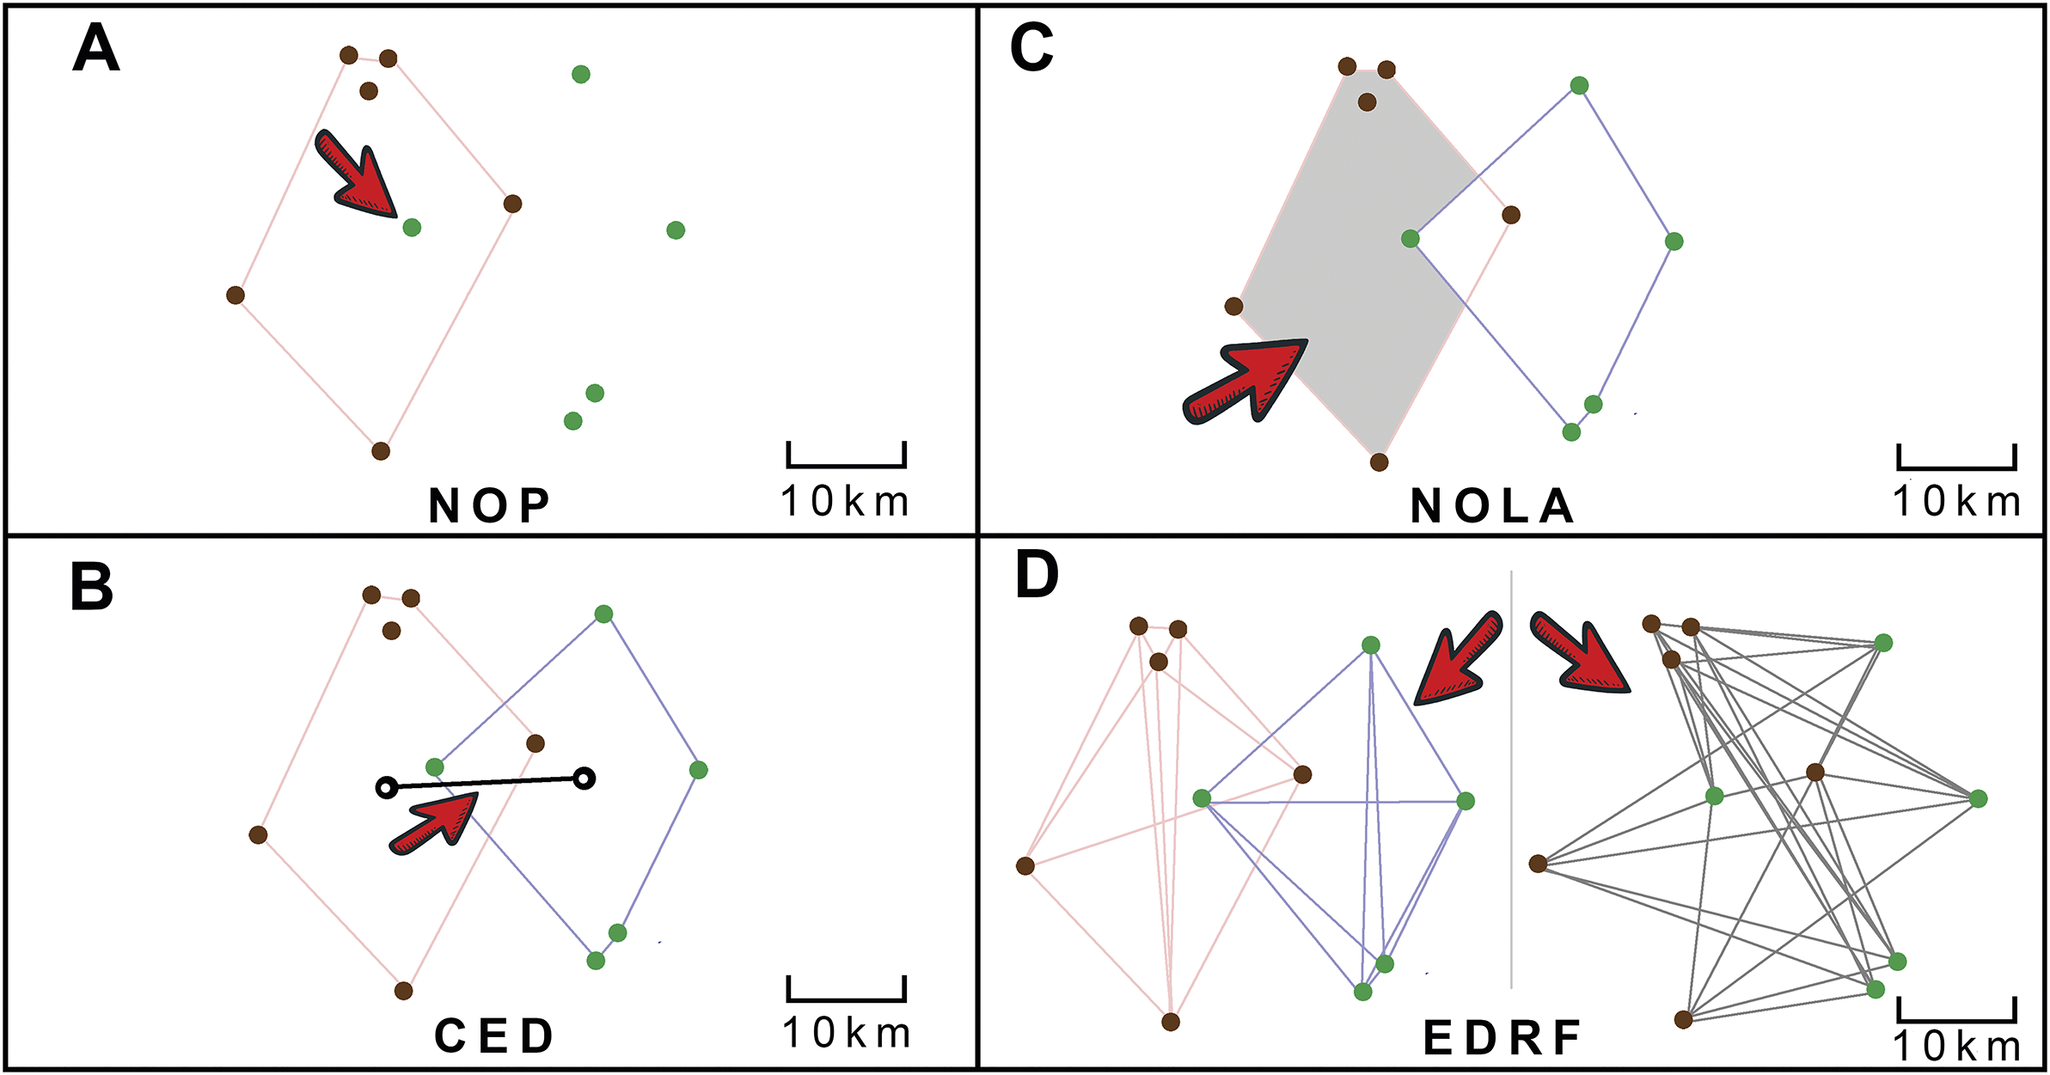
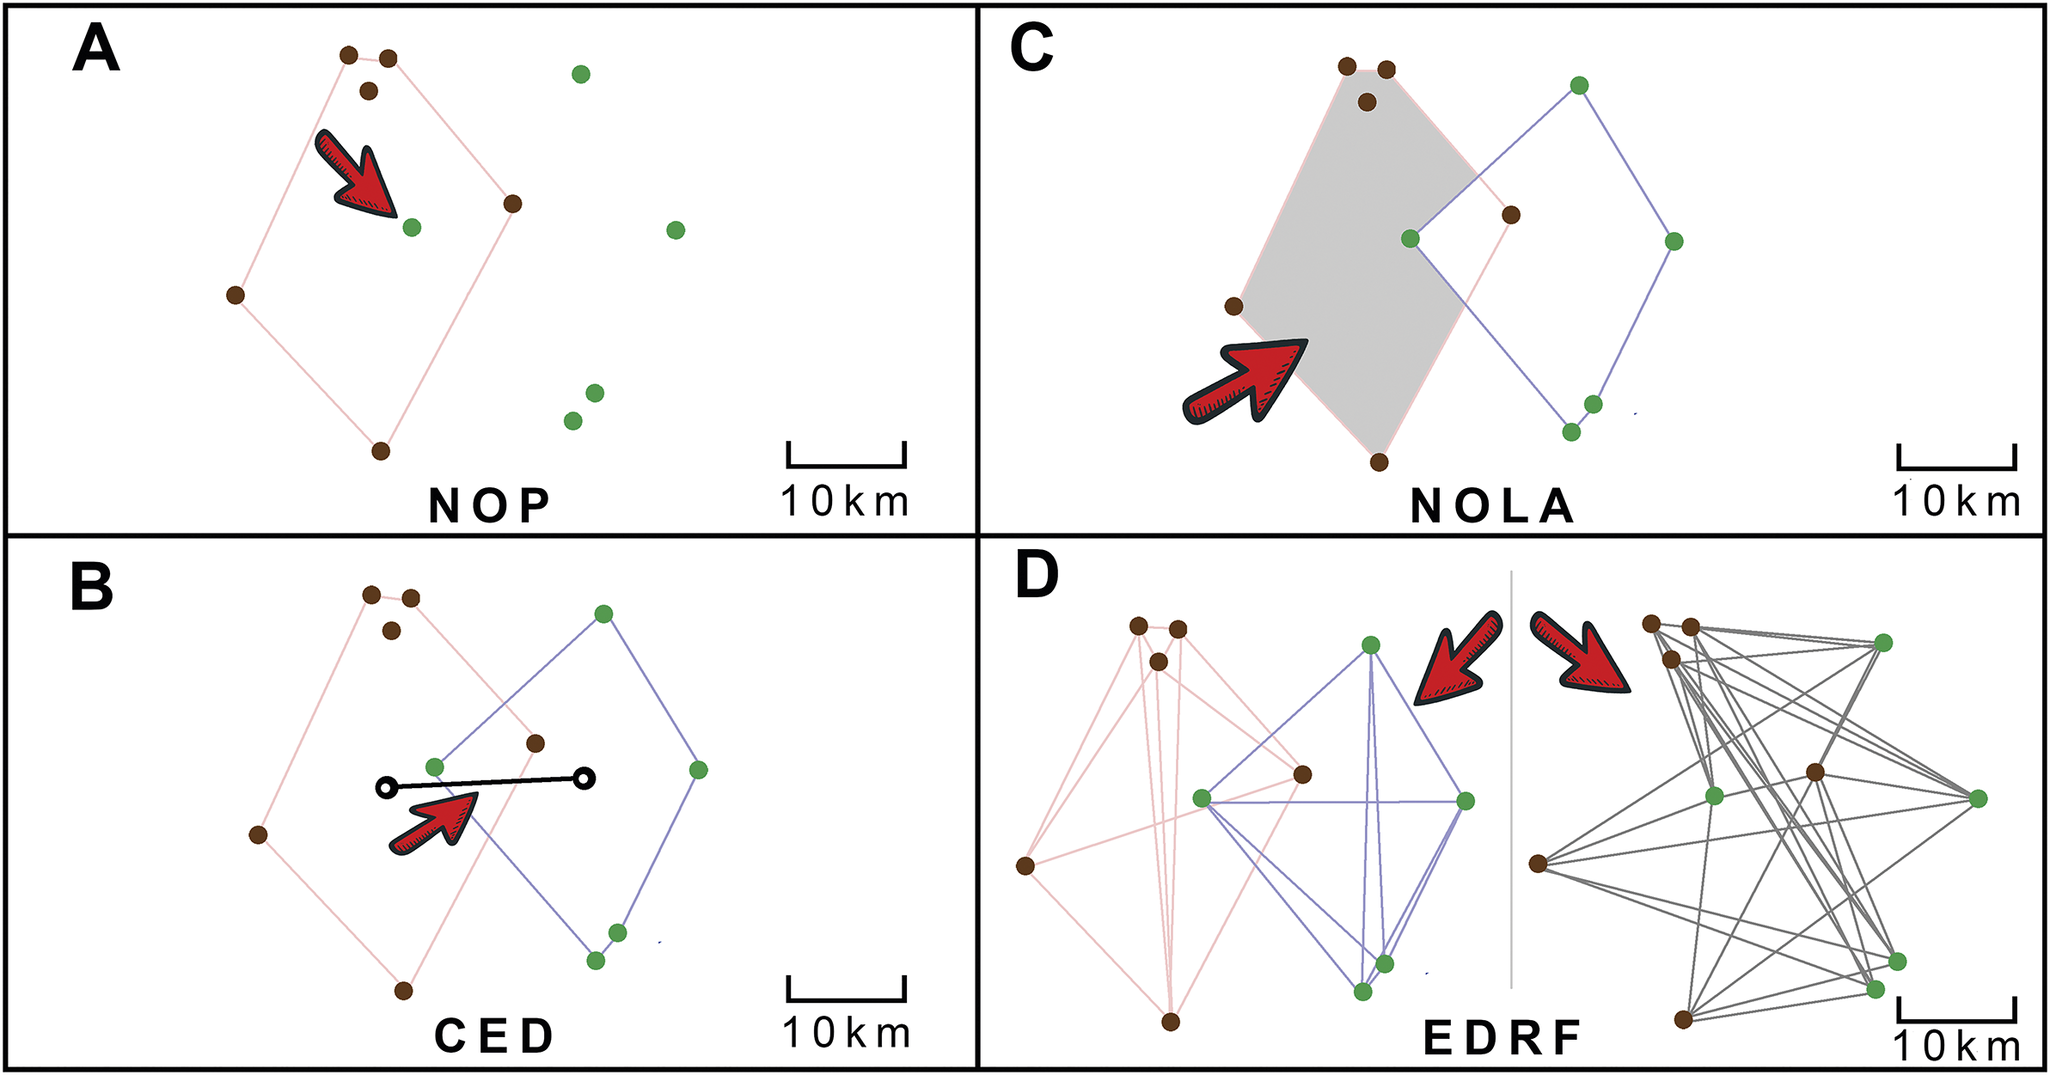
To evaluate the spatial relationships between multituberculates, rodents, and their forest environments, four ranked parameters were calculated for each mammal–plant comparison (Fig. 2). For each of these parameters, two null models were also developed to determine whether the paired spatial data points are distributed randomly. The first null model assumes a stochastic distribution of the paired spatial data points over a unit area. The second null model assumes a probabilistic distribution, where the spatial data points are randomized based on their limited geographic occurrence, rather than being mathematically randomized. If the observed data fall within either of these null model values, they can be assumed to be scientifically inconclusive regarding avoidance or association with the plant group, thus representing a more random distribution with respect to each other. In other words, if the results fall within the null model ranges, the mammal and plant comparisons cannot be attributed to either significant association or avoidance.
Graphic explanation of the four parameters measured in the study as illustrated by hypothetical point locality of fossil mammal and plant data. Plant fossil localities are depicted as green dots, and fossil mammal localities as brown dots. A, Number of occurrences in the polygon (NOP): the percentage of fossil plant occurrences within each mammal polygon shape. For example, there is 1 plant locality within the mammal polygon, out of a total of 5 plant localities, thus the NOP value would be 1/5 or 20%. B, Centroid ellipsoid distance (CED): the distance between the two calculated centroid points of each polygon shape. In this example, the value would be 20 km. C, Non-overlap of areas (NOLA): the percentage of the area of non-overlap between the mammal and plant polygon shapes. In this example, the value would be 90%, the area not overlapped by the plant polygon. D, Ellipsoid distance ratio function (EDRF): a calculated function of the ratio of the distances between similar localities, mammal-to-mammal and plant-to-plant distances, as compared with opposite localities, mammal-to-plant distances. This was calculated using the Ellipsoid-Distance-Ratio-Function.py python script provided in the Supplementary Files.
Number of Occurrences in the Polygon (NOP)
The first parameter used in the study is called the NOP, and it simply measures the percentage of fossil plant occurrences within each mammal polygon shape (Fig. 2A). A higher NOP value indicates a greater likelihood that the mammal and plant groups coexisted within the same geographic range, showing a stronger correlation between them, or association. NOP is a measure of how precisely the plant and mammal data overlap. To calculate this percentage, the total number of plant occurrences within a mammal polygon is divided by the total known fossil occurrences of that plant group, then multiplied by 100. This calculation also considers instances where plant and mammal fossils are found together at the same locality.
For the probabilistic null model, 10 data points were randomly selected from all mammal localities to generate a random polygon. Then, 10 additional data points from all plant localities were used to calculate the average percentage of points within the shape over 1000 runs. The result was an average of 18.68% of points falling within the first shape, with a variance of 243.66% and a 95% confidence interval between 17.71% and 19.65%. This finding suggests that the actual mammal data points are more localized or clustered than expected under a random distribution, especially when compared with actual plant data points, which are much more widespread. If the probabilistic null hypothesis is accurate, the results should fall within the range of 17.71% to 19.65%, which is lower than the 50% prediction of the stochastic null model (see Supplementary Files).
Centroid Ellipsoid Distance (CED)
The second parameter analyzed is the CED, which measures the ellipsoidal distance between the centroids (geometric barycenters) of the plant and mammal polygons (Fig. 2B). The geometric barycenter for each polygon was calculated using vector analysis in QGIS, and the distance between the centroid points of the mammal and plant polygons was measured in kilometers. A lower CED value indicates that the polygons are closer together. The CED primarily measures accuracy (rather than precision) in the spatial overlap of the data. This metric reflects the similarity of biomes in terms of general geographic occurrence patterns, with lower CED values suggesting a similar geographic distribution concerning latitude, climate, and other environmental factors for both mammal and plant groups. CED values were ranked from smallest to largest.
To evaluate the probabilistic null model, I randomly selected 10 data points and compared them with another set of 10 points. The centroid of each group was determined, and the distance between these centroids was measured. This process was repeated 10,000 times. The average CED parameter was calculated to be 306 km, with a variance of 35,565 km (standard deviation of 189 km) and a 95% confidence interval ranging from 294 to 317 km. This average distance is notably smaller than the stochastic null model’s expected value of 4184 km (see Supplementary Files) due to the potential for subsampling the same data point, resulting in reduced distances, as well as geographic and geological constraints of the North American fossil record. The average distance between locality data points was found to be 828.55 km.
Non-overlap of Areas (NOLA)
The third parameter, NOLA, quantifies the non-overlapping regions between mammal and plant polygons (Fig. 2C). If the mammal polygon is entirely enclosed by the fossil plant polygon, the NOLA value is 0. Lower NOLA values indicate that plant polygons encompass the entire known geographic range of the mammals. Conversely, fossil plants in a different climatic zone from the mammals’ geographic ranges result in high NOLA values, with 100% indicating complete non-overlap of the two polygons, or in other words, avoidance. Thus, a high NOLA parameter suggests a lack of close associations between the mammal and plant groups, hence NOLA values are ranked from smallest to largest.
One challenge in constructing a probabilistic null model from actual point datasets is ensuring the validity of the generated polygons. Randomly selected points can lead to invalid, self-intersecting polygons that must be excluded from the Monte Carlo subsampling process. In this study, I limited the analysis to polygon shapes formed by only 10 data points each. From an estimated 10,000 runs, the average NOLA value was found to be 78.67%, with a 95% confidence interval between 77.23% and 80.12%. These probabilistic null values align within the estimated stochastic null model (61.58% and 82.57%; see Supplementary Files), but fall within a narrower range, likely due to the limitation of using only sets of 10 observed data points.
Ellipsoid Distance Ratio Function (EDRF)
The fourth and final parameter simply compares two things and finds a ratio: the average distances between similar data points (plant-to-plant or mammal-to-mammal distances) and the distances between different data points (plant-to-mammal distances). This comparison helps clarify the spatial relationships between these two sets of data points (Fig. 2D)
This was done using the following formula:
 $$ {\displaystyle \begin{array}{l}y=\frac{\sum_{i=1}^a AA+{\sum}_{i=1}^b BB}{a+b}\\ {}x=\frac{\sum_{i=1}^n AB}{n}\\ {}\mathrm{EDRF}=\frac{x}{y}\end{array}} $$
where AA is the distance between unique plant data points, BB is the distance between unique mammal data points, AB is the distance between unique mammal and plant pairing of data points, a is the number of distances between plant data points (p) or p 2, and b is the number of distances between mammal data points (m) or m2, and n is the number of distances between A and B data points or n = p × m (see Fig. 2).
To accomplish this calculation, a computer program was written in python to quickly calculate this ratio value from all the distances (see Supplementary Files). A theoretical value of 1.0 indicates a perfectly balanced ratio of the two sets of distances. The higher the ratio above 1.0, the more independently clustered the two datasets are, and the weaker the plant-to-mammal association. In contrast the lower the ratio is below 1.0, the smaller the sample size and the less certainty there is within the ratio. For example, a ratio of 0 would indicate all the mammal and plant pairings were found in a single location; if both the mammal and plant fossils were found at only two locations together, the ratio would be 0.5. The absolute value of the EDRF was subtracted from 1 so that the top-ranked pairing was the value closest to 1.0. This analysis is similar to mapped point pattern cluster analysis discussed by Ripley (Reference Ripley2004), but as a comparison of two sets of point data.
The mathematically predicted stochastic null value is simply 1.0000; however, a probabilistic null model using the randomization of 10 plant occurrences and 10 mammal occurrences from observed data points (a Monte Carlo test), yield a similar value of 1.00106 with a 0.003 SD for 10,000 random runs. EDRF is best at measuring the degree of avoidance between the two groups of points, as a perfect association would fall within the null model expectations.
In this study, the focus is on finding the highest and lowest outliers to understand the relationship between two datasets, rather than just identifying average distributions. Calculating a range of null model values helps highlight the most moderate results within each parameter or expected random distributions. Data falling within the stochastic and probabilistic null model values indicate expected random ranges and are less informative regarding the spatial association or spatial avoidance of mammal–plant pairings.
For each fossil mammal group the four parameters were ranked from strongest to weakest association, with ties given the same rank. These rankings were then summed up to get a total score for each type of plant. A lower total score indicates plant groups that are most likely to be found near the corresponding fossil mammal group, while the highest scores suggest the mammal group likely avoided those plants.
Testing for Fossil Preservation Bias
The methodology for each of the four calculated parameters of the mammal–plant pairings focused solely on the geographic distribution of actual positive fossil occurrences, without considering the possibility of false negatives. In other words, the study’s parameters only analyze data where fossils were actually observed, ignoring regions without fossil records. One critique of this methodology is similar to concerns in epidemiological studies, where positive cases in a region may reflect the number of tests conducted rather than the true prevalence of the disease. Similarly, one can test a null hypothesis that assumes that the spatial distribution of positive fossil occurrences for each group is correlated with the total number of known fossil localities in each region—meaning that the likelihood of finding fossils of each group increases with the number of sampling sites in an area, following a rarefication model.
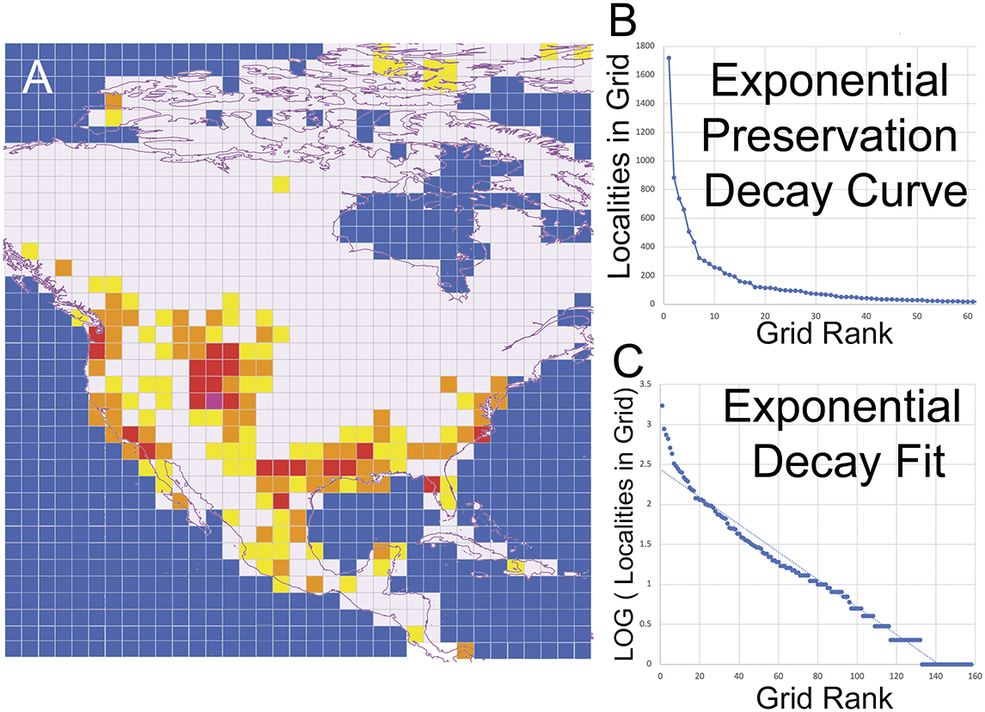
To evaluate this correlation of fossil preservation bias between the number of fossil localities in a region and the observed occurrences for each fossil mammal group, an additional statistical analysis was conducted, using a 2° × 2° latitude and longitude reference grid to map all known Eocene fossil localities in North America within each referenced grid cell. Ye (Reference Ye2024) highlighted an issue with using a gridded reference frame in paleontological statistical analysis, specifically, that spatial aggregation of fossil data can be influenced by the modifiable areal unit problem. This means that the user’s choice of size and orientation of the reference grid can affect statistical findings when employed. In this study, the correlation of fossil preservation bias was performed to simply illustrate that the observed fossil ranges reflect an underlying biogeographic distribution rather than being driven by preservation. Based on the total number of fossil localities in each grid, the model was used to predict the expected number of fossil occurrences given the known prevalence of fossil localities within the grid. The observed and expected numbers (using the fossil preservation model) were compared using a chi-square test of significance. If the p-values are at or near 0 for a group (p < 0.05), the null hypothesis can be rejected, indicating that the spatial distribution of fossil occurrences is independent of the sampling density.
Results
Fossil Preservation Bias
The chi-square test was performed to compare the predicted and observed fossil occurrences for all fossil groups in the study. Significant differences (p < 0.05) were identified in most fossil groups examined, leading to the rejection of the null hypothesis regarding the influence of sampling density on spatial distribution (Fig. 3; see Supplementary Appendix S1). Exceptions included the rodent family Protoptychidae and the plant group Myrtaceae, which did not meet the significance threshold (see Supplementary Appendix S1).
A, Map of terrestrial Eocene fossil locality density and modeled fossil preservation spatial decay curves used to calculate the expected occurrence numbers for each fossil group. Grids with more than 1000 localities are shaded purple; between 999 and 100, shaded red; between 99 and 10, shaded orange; 9 to 1 shaded yellow; and white represents no known fossil terrestrial Eocene localities within grid. B, Exponential preservation decay curve from spatial distribution of all fossil localities. C, Log fit calculation of preservation decay curve, where a can be adjusted to match the curve for predicted the model of fossil group occurrences in each grid region.

The distribution of Eocene terrestrial fossil localities across North America exhibited a skewed pattern, with clustering observed predominantly in the intermountain basins of Wyoming, Utah, and Colorado. The spatial decay model was represented by the following exponential decay equation: log(Y) = −0.0172X + ⍺, where Y is the number of fossil localities per grid unit, X is the grid rank, and ⍺ is an adjustment factor ranging from 1.90 to 2.15, accounting for the skewness in the spatial decay curve (Fig. 3). Fossil preservation bias affected certain groups, such as Protoptychidae and Myrtaceae, but for most groups, the spatial occurrence was statistically independent of sampling density. Consequently, the geographic distribution of fossil occurrences for the remaining groups likely reflects biogeographic ranges rather than sampling or preservation biases.
Mammal–Plant Associations
Raw, unranked results of the four parameters for each mammal–plant pairing are presented in Supplementary Appendices S2A–S2F, while a summary of the ranked results can be found in Supplementary Tables S1–S7. Several values, particularly for the NOLA and NOP parameters, fell within the stochastic and probabilistic range of null values, suggesting a random distribution in the pairwise comparison of mammal and plant biogeographic ranges (see Supplementary Appendices S2A–S2F). However, most results deviated from these null expectations, indicating either avoidance or association between the two fossil groups. Ranked values are tabulated in Supplementary Tables S1–S7 and visualized in Figures 4–9.
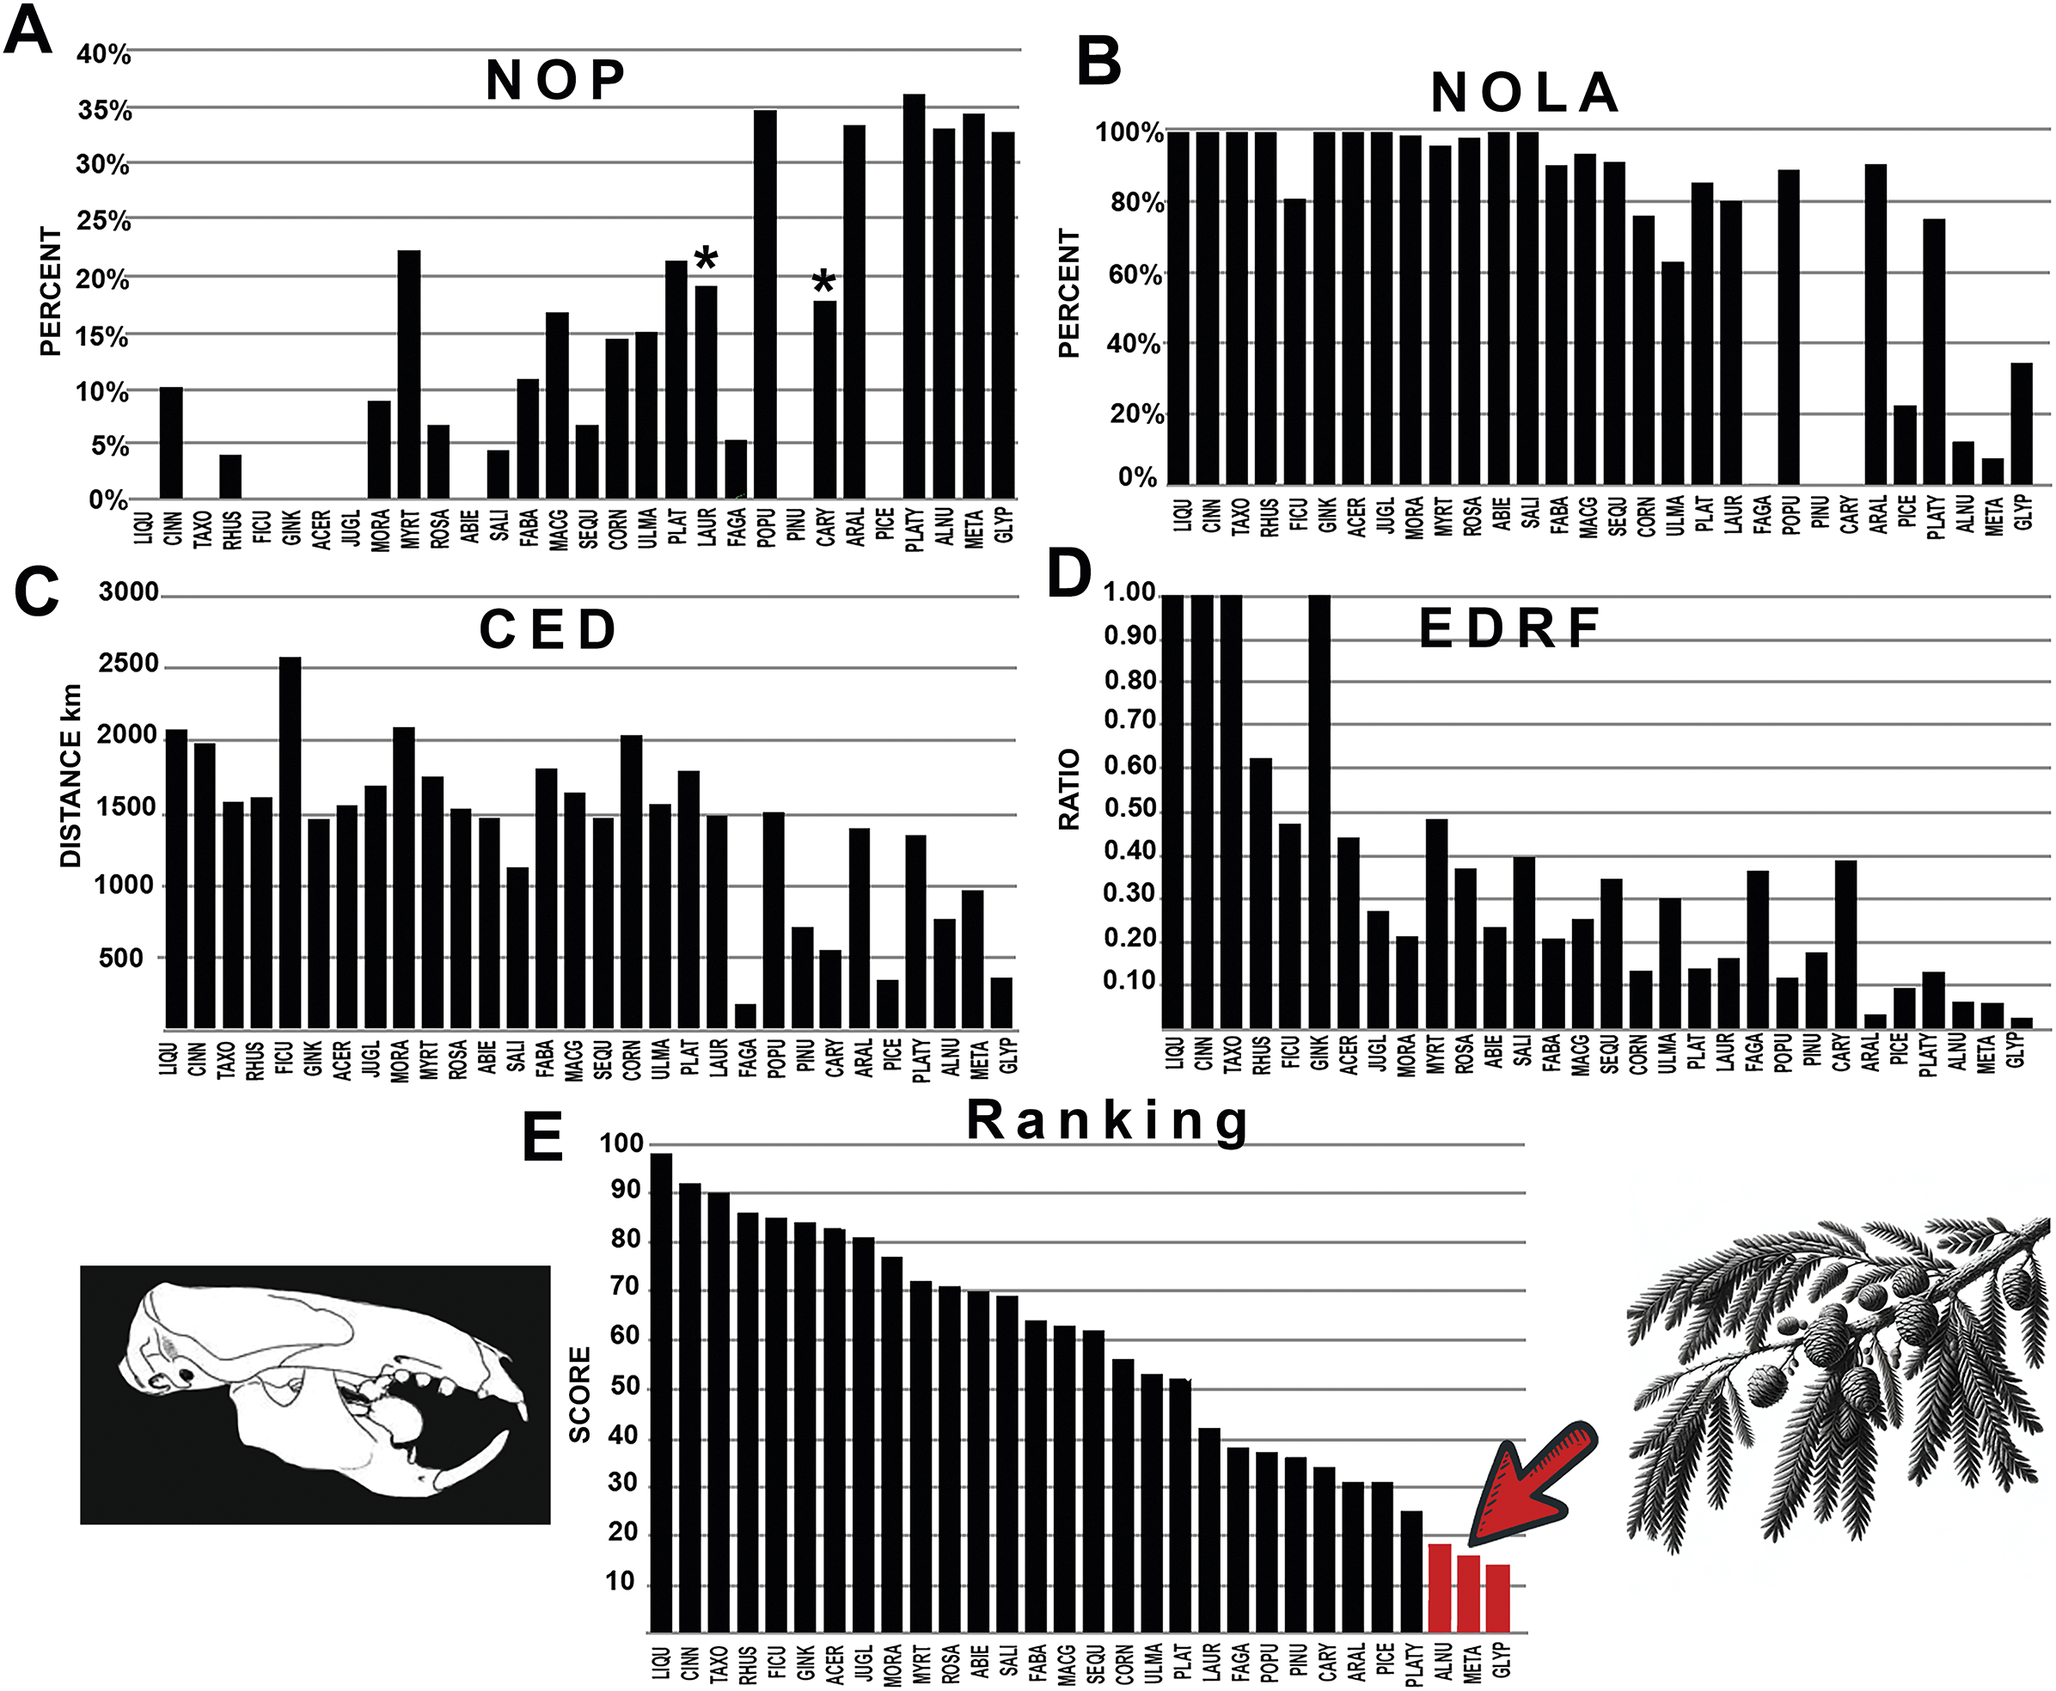
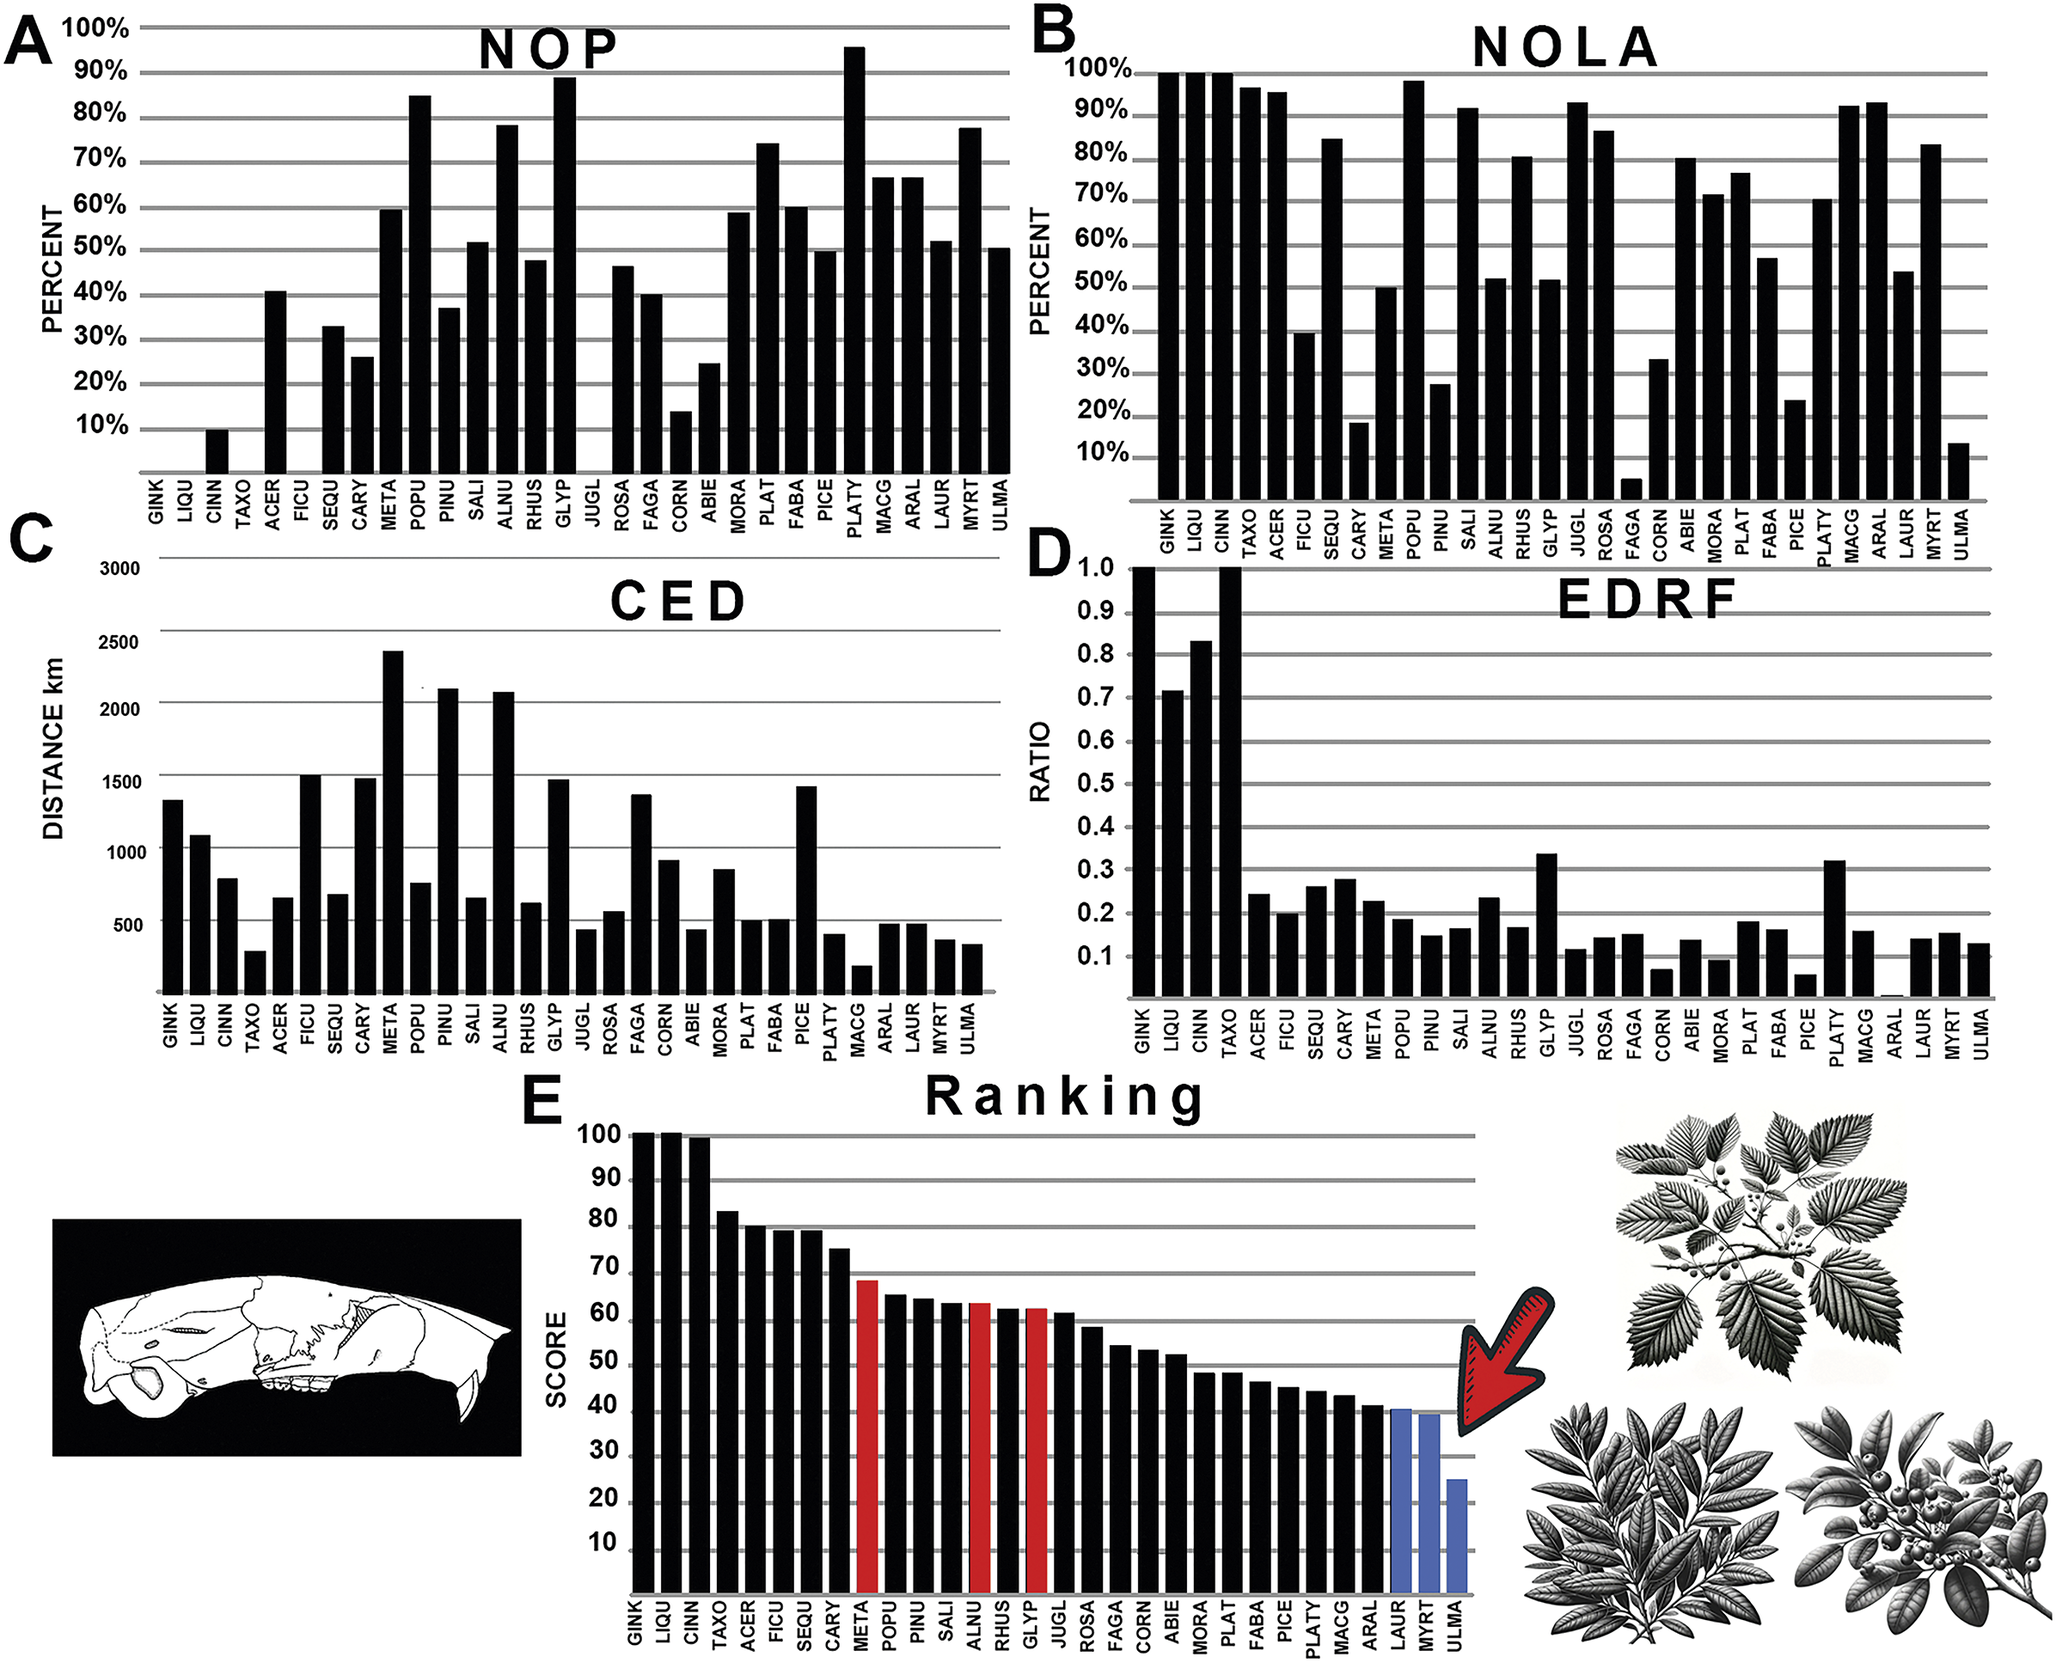
The graphical results comparing multituberculate mammals with various fossil plants across the four measured parameters, A–D: NOP, number of occurrences in the polygon; NOLA, non-overlap of areas; CED, centroid ellipsoid distance; EDRF, ellipsoid distance ratio function. E, The total rank score of each plant association. Abbreviations of plant groups can be found in Appendix S2A, and calculated ranked data can be found in Supplementary Files: Summary of Results (Supplementary Table S1). Image of Ectypodus modified from Sloan (Reference Sloan, Fairbridge and Jablonski1979). Red bars highlighted with the arrow indicate plants most closely associated with multituberculates with the lowest score. An asterisk (*) indicates value within nonsignificance regarding association or avoidance within the probabilistic null model.

Multituberculate fossils were most closely associated with Chinese swamp cypress (Glyptostrobus), dawn redwood (Metasequoia), and alder trees (Alnus; Fig. 4, Supplementary Files, Supplementary Appendix S2A, Supplementary Table S1). No significant rodent associations with these plant groups were observed. Ischyromyid rodents exhibited more random associations, with preferences for oaks (Fagaceae), elm (Ulmaceae), legumes (Fabaceae), and spruce (Picea; Fig. 5, Supplementary Appendix S2B, Supplementary Table S2). However, at least one parameter for these pairings fell within the null model range for NOLA and NOP. Cylindrodontid rodents displayed associations with mulberry and figs (Moraceae), peas and beans (Fabaceae), and elm (Ulmaceae; Fig. 5, Supplementary Appendix S2C, Supplementary Table S3), although except for elm, several parameters were within the null model values for NOP. Sciuravid rodents were most closely associated with mulberry (Moraceae), with no parameters falling within the null model range (Fig. 5, Supplementary Appendix S2D, Supplementary Table S4). Eutypomyid rodents preferred dogwood (Cornus) and mulberry (Moraceae), as well as legumes (Fabaceae), with only the latter resulting in a parameter falling within the null model range (Fig. 8, Supplementary Appendix S2E, Supplementary Table S5). The results of the analysis indicate strong overall affinities between eomyid rodents and laurel forests (Lauraceae) and elm forests (Ulmaceae), as well as Macginitiea (the extinct sycamore), which showed lowest CED values, while NOLA values also showed association between eomyids and Fagaceae (chestnut, acorn, and oak trees; Fig. 9, Supplementary Appendix S2F, Supplementary Table S6).
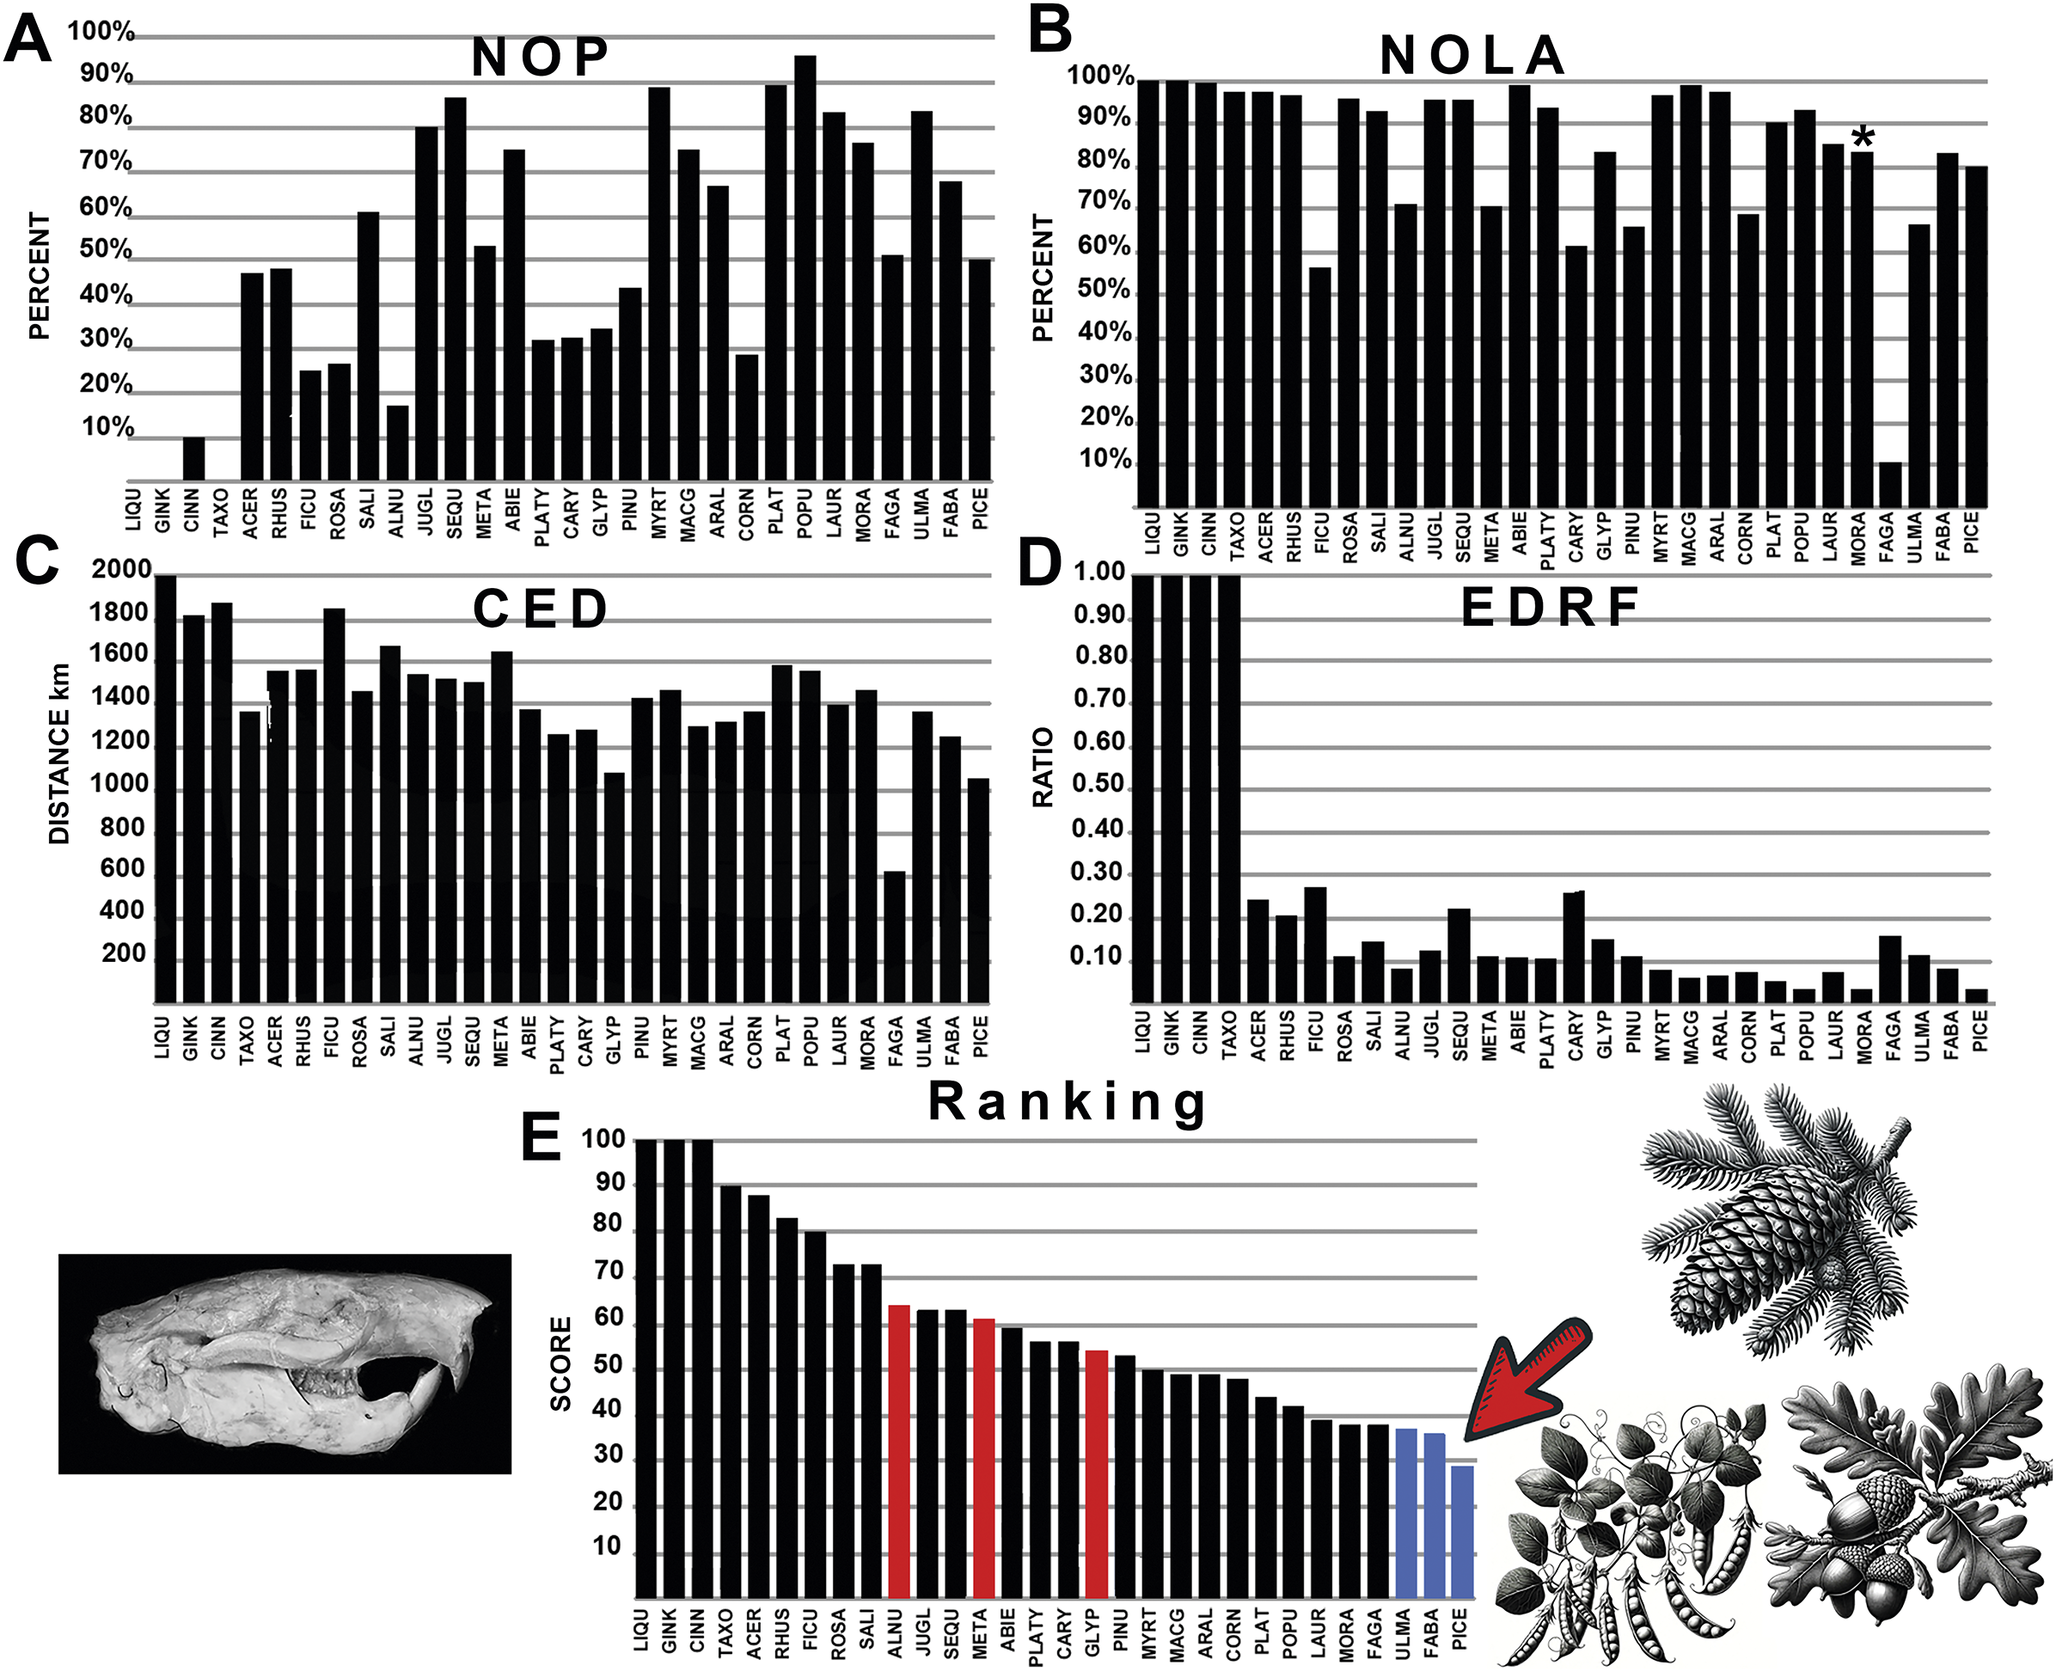
The graphical results comparing ischyromyid rodents with various fossil plants across the four measured parameters, A-D: NOP, number of occurrences in the polygon; NOLA, non-overlap of areas; CED, centroid ellipsoid distance; EDRF, ellipsoid distance ratio function. E, The total rank score of each plant association. Abbreviations of plant groups can be found in Appendix S2B, and calculated ranked data can be found in Supplementary Files: Summary of Results (Supplementary Table S2). Image of Ischyromys based on USNM V16828. Blue bars on the graph indicate plants most closely associated with ischyromyid rodents with the lowest score, while red bars on the graph indicate plants most closely associated with multituberculates. An asterisk (*) indicates value within nonsignificance regarding association or avoidance within the probabilistic null model.

None of the rodent groups overlapped with the highest-ranked plant groups associated with Eocene multituberculates. These results suggest that Eocene multituberculates occupied distinct forest habitats and ecological niches differing from Eocene rodents.
Discussion
Discussion of Results
The comparison of the known occurrences of multituberculates with the paleogeographic distribution of plant groups shows a very strong association between multituberculates and dawn redwood (Metasequoia) and Chinese swamp cypress (Glyptostrobus), with lesser but nearly equal associations with alder trees (Alnus) and cone nut trees (Platycarya), each of which bear tiny seeds in small cone-like structures (Fig. 4). Less strong association was found with hickory trees, as well as weak association with pine, spruce, poplar, and aspen forests. The weakest associations were found with the many nut- and berry-bearing trees, with some of the weakest association with walnut trees (Juglans).
Dawn redwood (Metasequoia), Chinese swamp cypress, (Glyptostrobus), alder trees (Alnus), and cone nut trees (Platycarya) were found to have the highest NOP values (Fig. 4, Supplementary Files, Supplementary Appendix S2A). NOLA values indicate very widespread occurrences of pine and spruce (Pinus and Picea) occupying a similar geographic range with multituberculates but are found to rarely occur within the multituberculate polygon (Fig. 4, Supplementary Appendix S2A). This seems to imply that multituberculates were actively avoiding pine- and spruce-dominated forests, despite having a similar geographic distribution as those trees. Furthermore, multituberculates were not found to be particularly strongly associated with redwood trees (Sequoia). The results also show very low association with swamp cypress (Taxodium), as most of these occurrences are far south of the multituberculate polygon, even though both these trees have tiny seed-bearing cones. There was also no strong association found with ginkgo trees (Ginkgo) despite the long temporal range of these trees in the Mesozoic and early Cenozoic. Previously Del Tredici (Reference Del Tredici1989) advocated for the possibility of Ginkgo seed dispersal by multituberculates, but results of this new study suggest low affinity between the two, at least during the Eocene. Multituberculates may have used their elongated incisors as tweezers or tongs to extract seeds from deep furrows in the cones of Metasequoia and Glyptostrobus and thus are associated with these ancient remnants of these gymnosperm-dominated forests.
The generated polygon for the rodent family Ischyromyidae fully encapsulated the multituberculate polygon, indicating a much broader geographic range. The comparison of the known occurrences of ischyromyid rodents with the paleogeographic distribution of plant groups shows some preference for the families Fagaceae (chestnut, acorn, and oak trees), Ulmaceae (elms), Fabaceae (legumes), and Picea (spruce; Fig. 5, Supplementary Appendix S5). Most of these plants produce acorn- and pod-like or husked bean−like seeds, or in the case of Ulmaceae abundant samara wind-blown seeds. Of these, Fagaceae ranked highest in CED and NOLA parameters, while the genus Populus (popular, aspen, and cottonwood) ranked highest in NOP, with significant overlap of occurrences within the rodent polygon. EDRF values supported close association with Picea (spruce), although two parameters (NOP and NOLA) regarding this association fall within the predicted null model values (Supplementary Appendix S2B), indicating a high level of randomness in this association. Ischyromyid rodents were also linked to sycamore, spruce, guava, redwoods, mulberry, hickory, and walnut trees, above any of the plants associated with the occurrence of multituberculates (Fig. 5). The gut contents of well-preserved specimens from Messel Germany of the ischyromyid Ailuravus demonstrate a diet of laurel leaves (Lauraceace; Ruf and Lehmann Reference Ruf, Lehmann, Smith, Schaal and Habersetzer2018), which were also found to be highly ranked in their association with ischyromyid rodents in this study (Supplementary Appendix 2). Overall, ischyromyid rodents showed dominant angiosperm preference, with an association with spruce forests, possibly in higher elevations and latitudes.
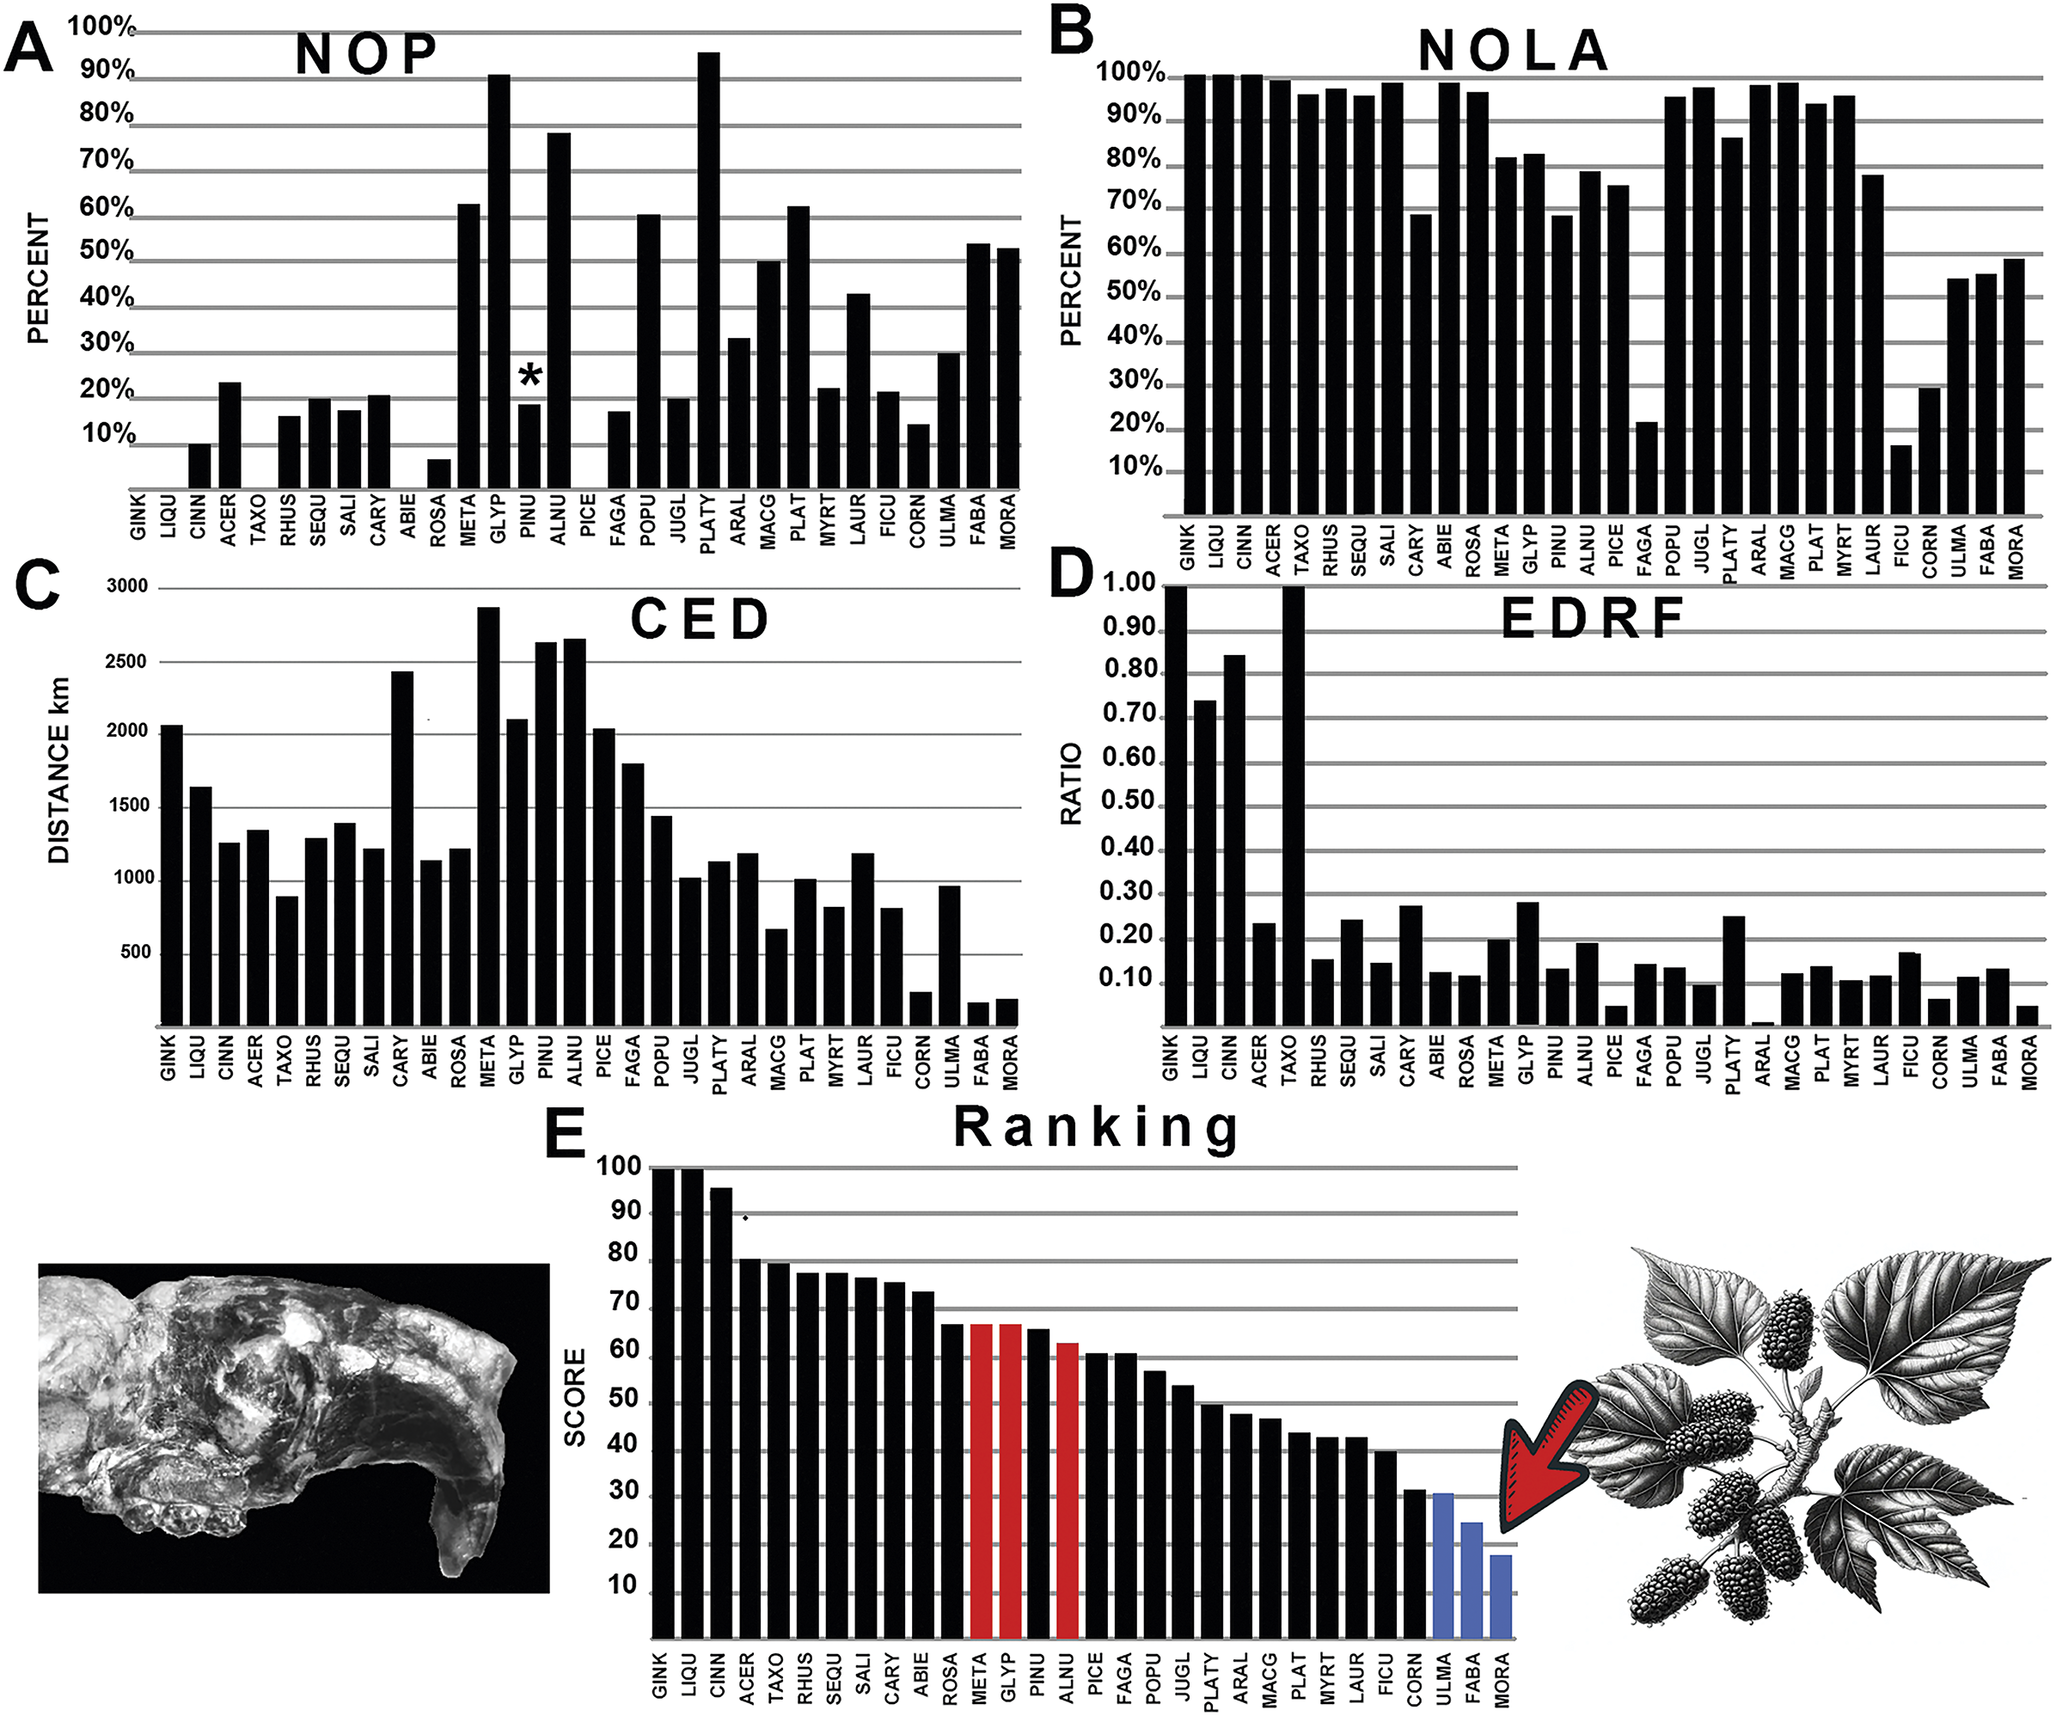
The generated polygon for the rodent family Cylindrodontidae is distributed over a more southern range compared with the polygons for ischyromyid rodents and multituberculates. The polygon overlaps with multituberculates in the northwestern portion of its range. The occurrences of cylindrodontid rodents show a broad association (Fig. 6, Supplementary Appendix S2C). These rodents show an overall preference for softer food sources, with an association with the mulberry family (Moraceae), especially regarding the occurrence of Ficus (fig trees) and the legume family (Fabaceae), but also some affinity with elms (Ulmaceae) similar to ischyromyid rodents. Cylindrodontid rodents showed a weaker association with Fagaceae (chestnuts, acorn, and oak) indicating the occupation of a different forest habitat than that found with ischyromyid rodents. Cylindrodontid rodents also showed weak correlation with pine (Pinus), spruce (Picea), redwood (Sequoia), and fir trees (Abies) indicating they were not exploiting cone-bearing trees. However, unlike ischyromyid rodents, the cylindrodontids do show a stronger affinity to Platycarya, with only moderate support for Glyptostrobus and Alnus, trees found to be more highly associated with multituberculates. This was a result of high values of NOP, with many plant localities found in the northern extremes of the plotted cylindrodontid rodent polygon; however, NOLA, ED, and EDRF values were not as correlative with these plants.
The graphical results comparing cylindrodontid rodents with various fossil plants across the four measured parameters, A-D: NOP, number of occurrences in the polygon; NOLA, non-overlap of areas; CED, centroid ellipsoid distance; EDRF, ellipsoid distance ratio function. E, The total rank score of each plant association, with red bars indicating multituberculate plant associations. Abbreviations of plant groups can be found in Appendix S2C, and calculated ranked data can be found in Supplementary Files: Summary of Results (Supplementary Table S3). Image of the cylindrodontid rodent Adrynomys based on Korth and Tabrum (Reference Korth and Tabrum2016). Blue bars on the graph indicate plants most closely associated with cylindrodontid rodents with the lowest score, while red bars on the graph indicate plants most closely associated with multituberculates. An asterisk (*) indicates value within non-significance regarding association or avoidance within the probabilistic null model.

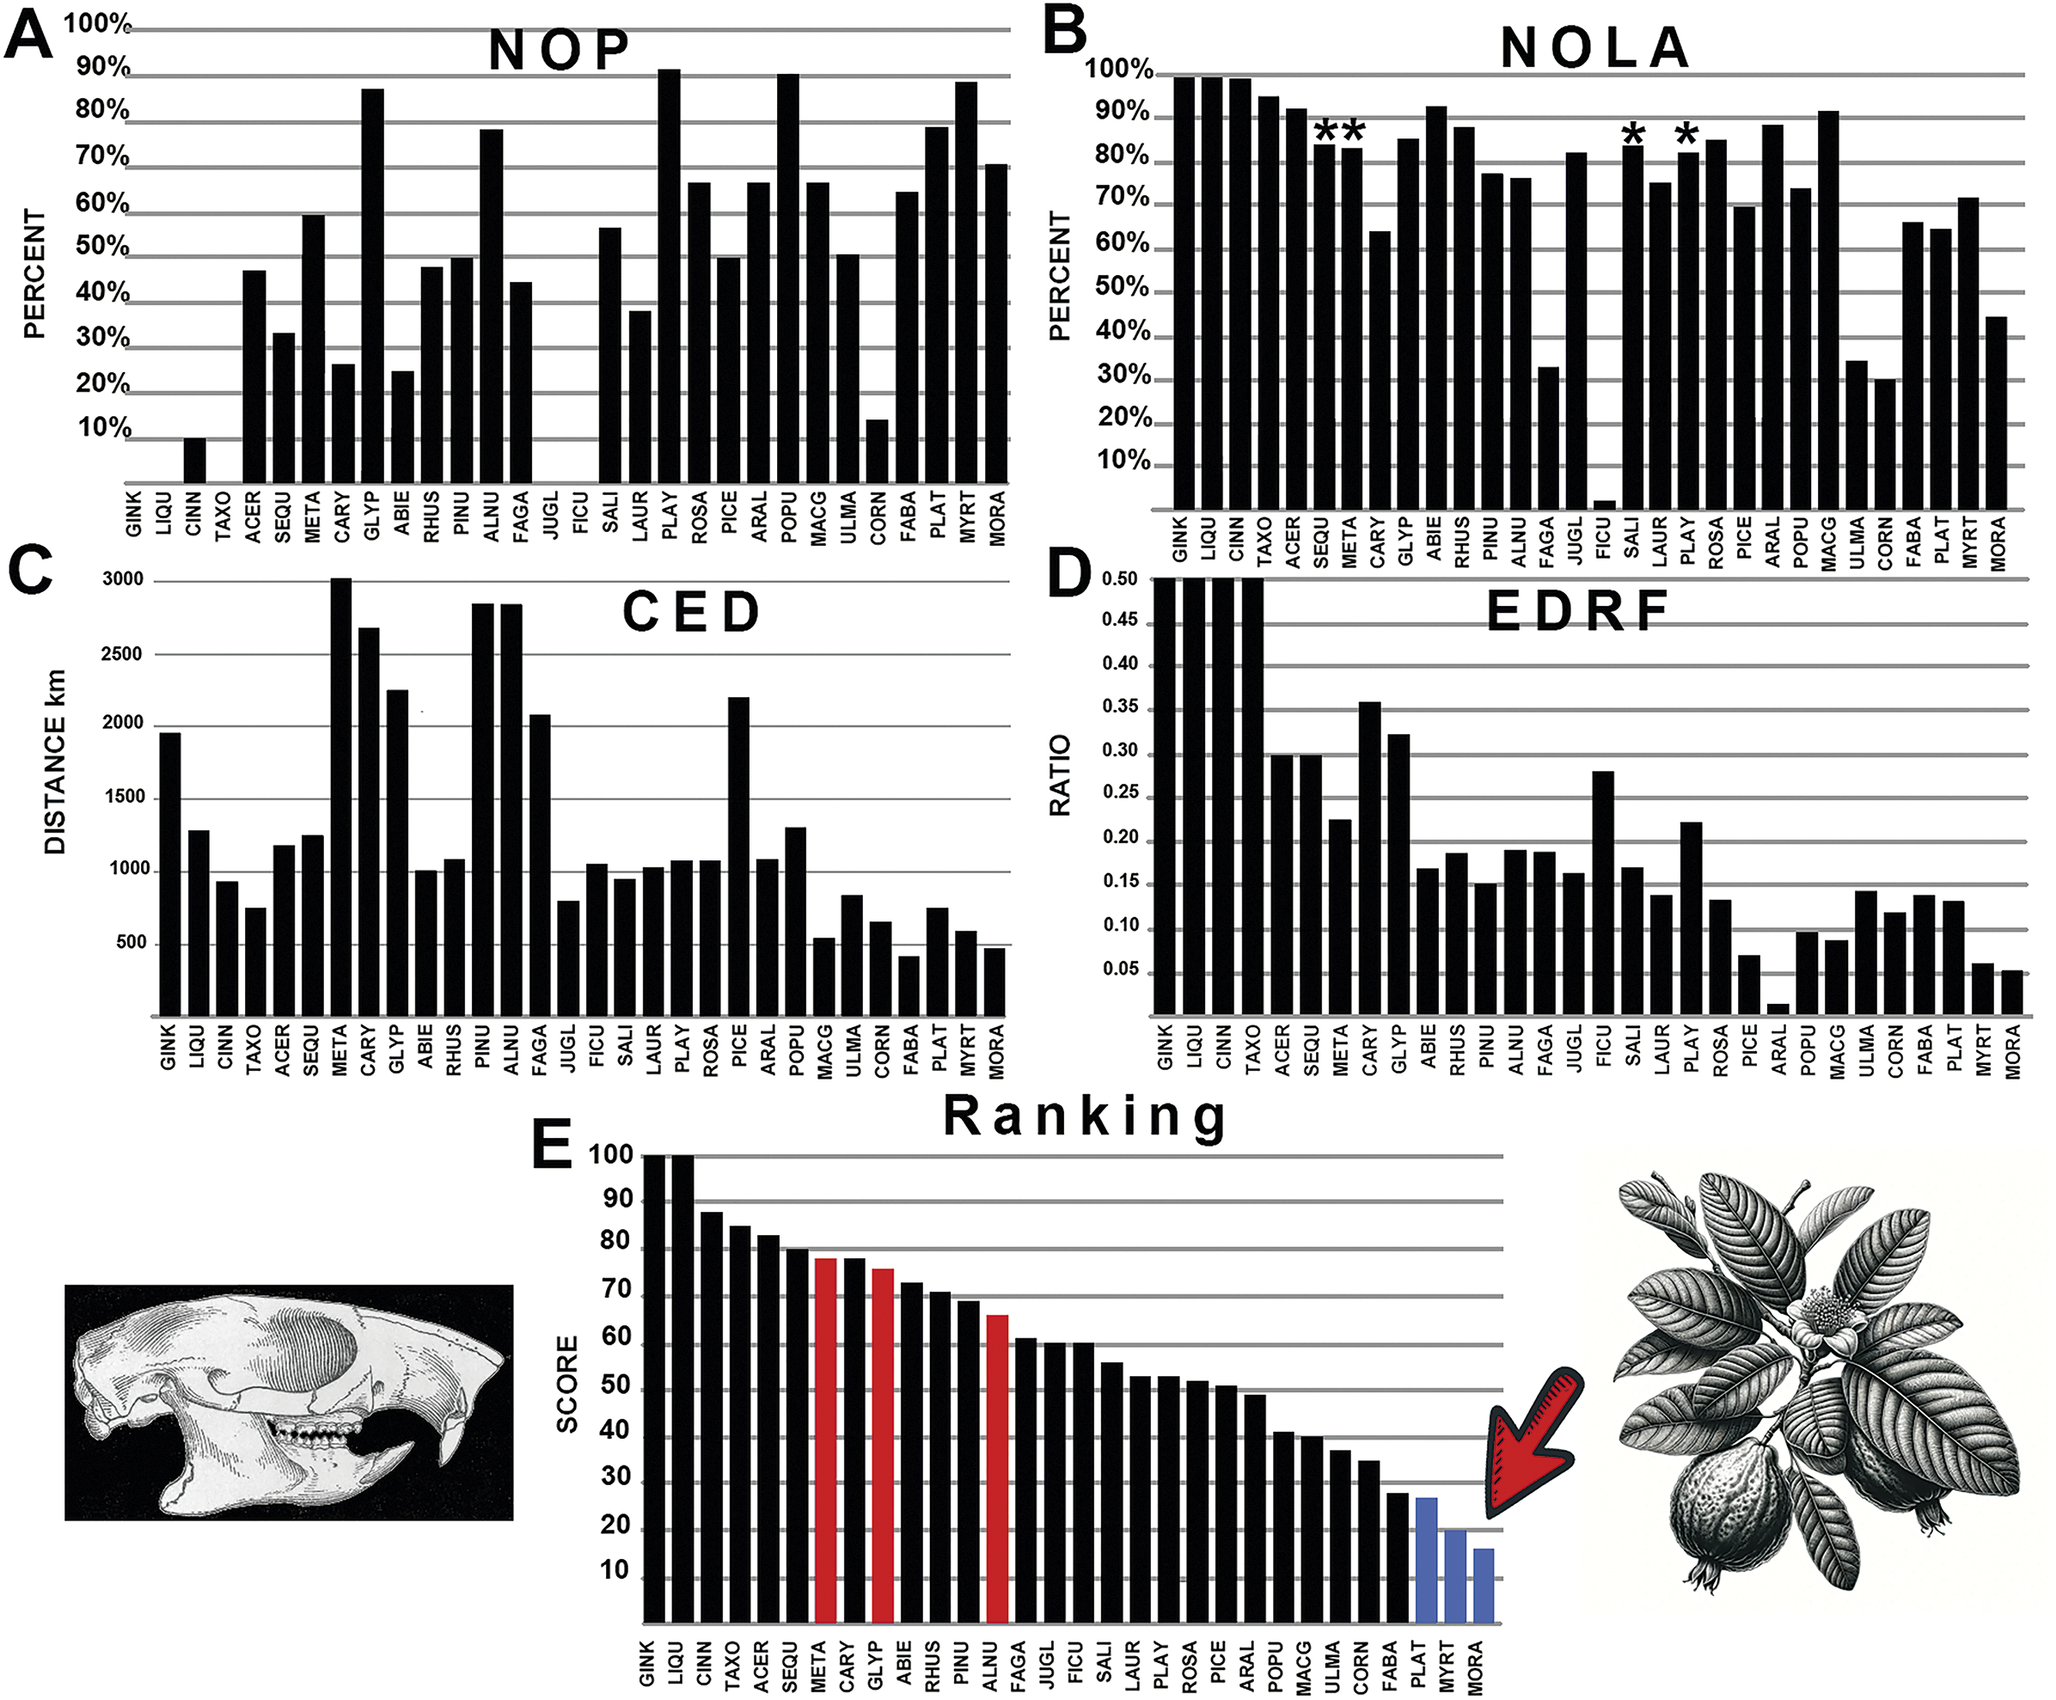
The generated polygon for the rodent family Sciuravidae is more localized within the center of the continent and only overlaps with multituberculates across a limited area of Wyoming. This rodent family consists of smaller rodents that appear during the early Eocene (early Wasachian NALMA) but go extinct by the end of the middle Eocene (Uintan NALMA). Results show an affinity for softer fruit and berry-bearing trees such as Eugenia, as well as Moraceae (mulberry trees), a similarity to cylindrodontid rodents (Fig. 7). They also show an affinity with Fabaceae (legumes), a common plant preference shared with other rodents. Sycamore trees (Platanus) and the extinct Macginitiea show some affinity with sciuravid rodents, indicating that they preferred slightly different habitats than other rodents, with greater affinity for sycamore forests. Weak support was found for an association with spruce, dawn redwoods, pine, walnut, hickory, maple, redwood, fir trees, ginkgo, and swamp cypress (Fig. 7). There was no strong association with chestnut, acorn, oak and various laurel trees, as was found with ischyromyid rodents. Of the trees with affinities with multituberculates, the sciuravid rodents did show some affinity to Platycarya, particularly with numerous co-occurrences in the northern portion of the family’s geographic range.
The graphical results comparing sciuravid rodents with various fossil plants across the four measured parameters, A-D: NOP, number of occurrences in the polygon; NOLA, non-overlap of areas; CED, centroid ellipsoid distance; EDRF, ellipsoid distance ratio function. E, The total rank score of each plant association, with red bars indicating multituberculate plant associations. Abbreviations of plant groups can be found in Appendix S2D, and calculated ranked data can be found in Supplementary Files: Summary of Results (Supplementary Table S4). Image of Sciuravus based on Matthew (Reference Matthew1910). Blue bars on the graph indicate plants most closely associated with sciuravid rodents with the lowest score, while red bars on the graph indicate plants most closely associated with multituberculates. An asterisk (*) indicates value within nonsignificance regarding association or avoidance within the probabilistic null model.

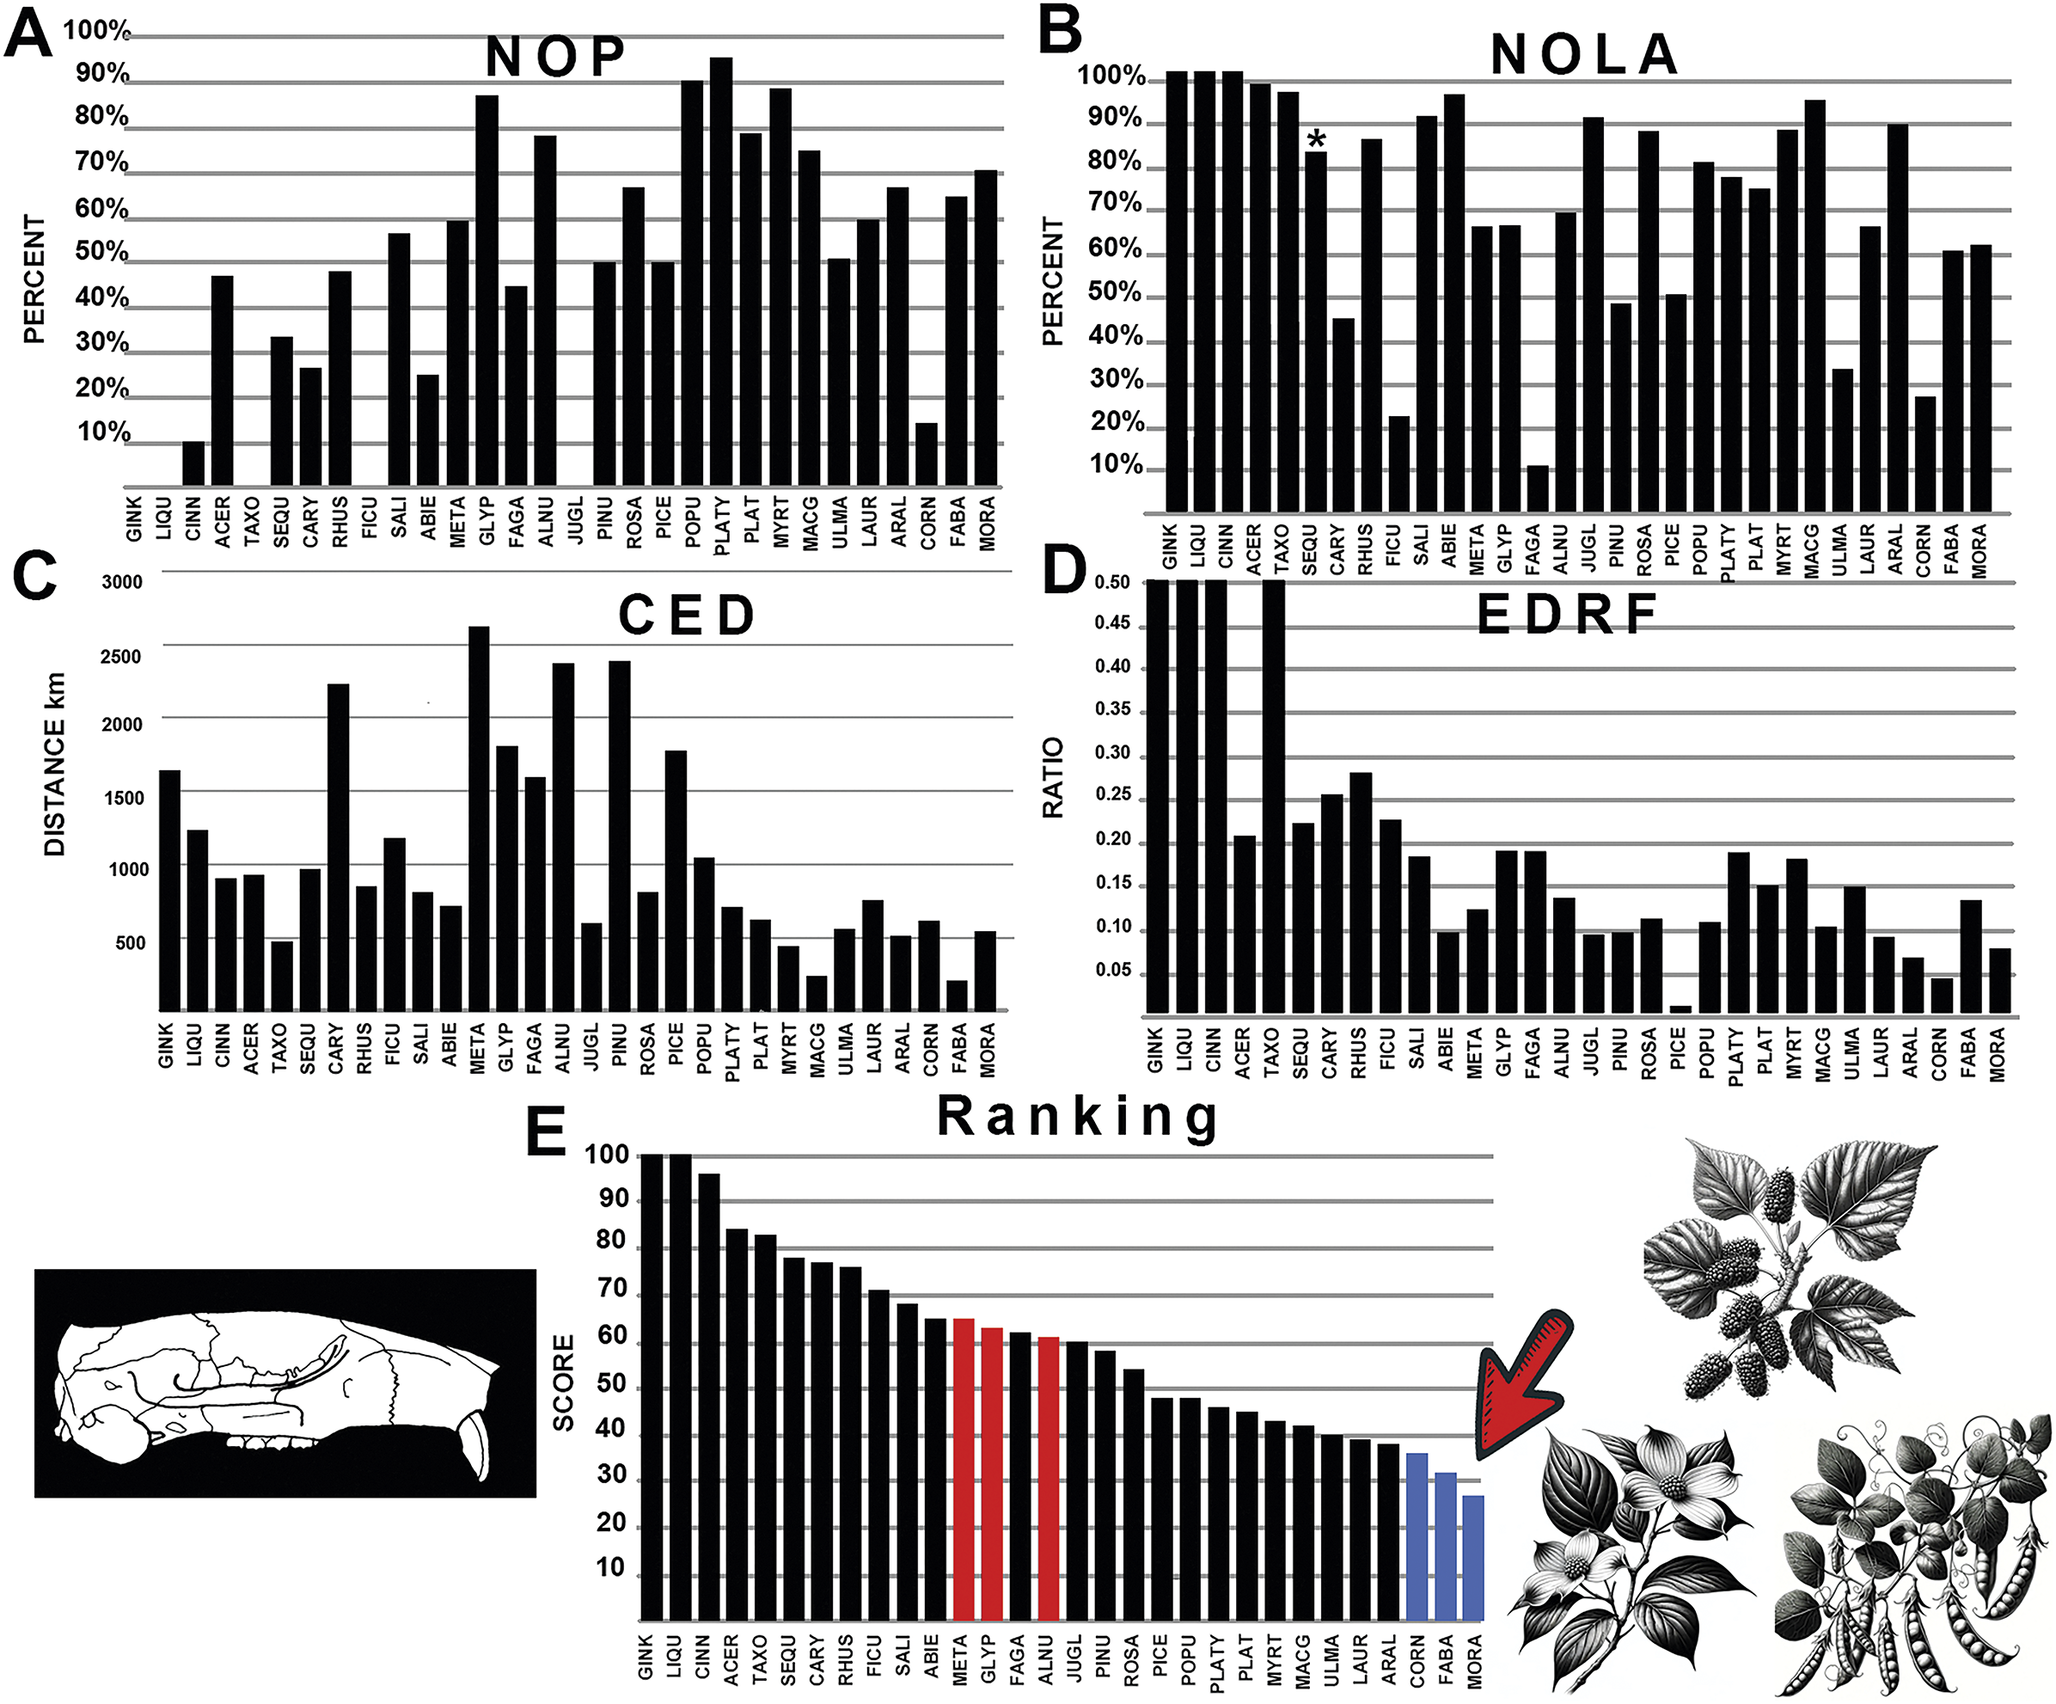
The generated polygon for the rodent family Eutypomyidae only overlaps with multituberculates in the northern portions of its more southern-placed geographic range. This family is regarded as more closely related to modern beavers (Korth Reference Korth1994), showing more terrestrial or ground-dwelling adaptions compared with other Eocene rodents examined. Results show an affinity to Platycarya (cone nut trees), with high NOP values, yet CED values suggest instead an affinity with Fabaceae (legumes), NOLA values support affinities with Fagaceae (chestnut, acorn, and oak), and EDRF values show affinity with Picea (spruce; Fig.8). These disparate results are likely due to more widely attributed floral associations, with Cornus (dogwood), Fabaceae (legumes), and Moraceae (mulberry) as the top-ranked results (Fig. 8). This result might be because this group of rodents are ground dwelling, with a more generalized habitat.
The graphical results comparing eutypomyid rodents with various fossil plants across the four measured parameters, A-D: NOP, number of occurrences in the polygon; NOLA, non-overlap of areas; CED, centroid ellipsoid distance; EDRF, ellipsoid distance ratio function. E, The total rank score of each plant association, with red bars indicating multituberculate plant associations. Abbreviations of plant groups can be found in Appendix S2E, and calculated ranked data can be found in Supplementary Files: Summary of Results (Supplementary Table S5). Image of Eutypomys based on Korth (Reference Korth1994). Blue bars on the graph indicate plants most closely associated with eutypomoyid rodents with the lowest score, while red bars on the graph indicate plants most closely associated with multituberculates. An asterisk (*) indicates value within nonsignificance regarding association or avoidance within the probabilistic null model.

The generated polygon for the rodent family Eomyidae represents an extinct group of squirrel-like rodents that first appear in the late Eocene with the masseter originating on the side of the snout in sciuromorphous fashion. They have historically been grouped with modern pocket gophers, but recent studies demonstrate many independent squirrel-like features, although the most recent phylogeny (Asher et al. Reference Asher, Smith, Rankin and Emry2019) places Protadjidaumo as the basalmost Geomyoidea within the Castroimorpha clade. The family overlaps greatly with multituberculates in the northeastern portions of its geographic range, but also has numerous occurrences in southern California and several in Texas, where Eocene multituberculates are unknown. The resulting polygon is unusually shaped given these data points. The results of the analysis indicate strong overall affinities between eomyid rodents and Pacific coast laurel forests (Lauraceae) and interior elm forests (Ulmaceae; Fig. 9). Macginitiea (the extinct sycamore) showed the lowest CED values, while NOLA values showed considerable overlap with Fagaceae (chestnut, acorn, and oak trees). NOP values were highest for cone nut trees (Platycarya) and Chinese swamp cypress (Glyptostrobus), two trees that also showed strong affinity with multituberculates (Figs. 4, 9). EDRF showed highest affinity to Corylites and Palaeocarpinus, a group of extinct birch trees. The eomyid rodents showed some overlap with multituberculates in their association with Platycarya but were also the only rodent group to show any level of affinity to fir trees (Abies), which are well represented in modern forests in boreal and alpine regions of North America today.
The graphical results comparing eomyid rodents with various fossil plants across the four measured parameters, A-D: NOP, number of occurrences in the polygon; NOLA, non-overlap of areas; CED, centroid ellipsoid distance; EDRF, ellipsoid distance ratio function. E, The total rank score of each plant association, with red bars indicating multituberculate plant associations. Abbreviations of plant groups can be found in Appendix S2F, and calculated ranked data can be found in Supplementary Files: Summary of Results (Supplementary Table S6). Image of Protadjidaumo based on Wahlert (Reference Wahlert1978). Blue bars on the graph indicate plants most closely associated with eomyid rodents with the lowest score, while red bars on the graph indicate plants most closely associated with multituberculates. An asterisk (*) indicates value within nonsignificance regarding association or avoidance within the probabilistic null model.

A surprising outcome of this study is the notable avoidance of pine-dominated forests by Eocene rodents, as well as multituberculates. This might be due to acidic soils in these forests preventing the preservation of fossil mammals, although Abies and Pinus and other evergreen conifers are well documented in the upland Eocene of Florissant Colorado, where fossil mammals are also known to occur (Meyer Reference Meyer2003).
What is intriguing is that earlier Eocene rodents appeared to show a preference for softer fruits, beans, peas, nuts, and seeds. This behavior stands in contrast to present-day boreal and montane forests, where arboreal rodents feed more exclusively on pinecones possessing a tough thorny material, that are serotinous; that is, only opening after the pinecone is subjected to forest fires (Smith Reference Smith1970). Interestingly, after the Eocene, rodents do appear to begin the adoption of behaviors involving more gnawing and consuming these much harder pinecone seeds with the advent of true squirrels near the Eocene/Oligocene boundary (Goodwin Reference Goodwin, Janis, Gunnell and Uhen2008).
Researchers propose that the increased bite force observed in modern pine squirrels (Sciurus; Adams et al. Reference Adams, Rayfield, Cox, Cobb and Corfe2019) likely evolved due to selective pressures favoring a diet that involves gnawing through the harder husks of pinecones to access the edible seeds underneath (Smith Reference Smith1970). This phenomenon is particularly relevant for plant species like lodgepole pine, where the seeds remain encased within the cone until a forest fire triggers their release. In today’s forest ecosystems, the consumption of these hard-enclosed pinecones necessitates gnawing behaviors as a means of obtaining food (Smith Reference Smith1970). The emergence of gnawing behaviors in modern squirrels (family Sciuridae) took place in this post-Eocene world (Emry and Thorington Reference Emry and Thorington1982), indicating a potential response to the drier and colder climates of the early Oligocene and forest habitat subjected to more frequent forest fires. This evolutionary shift possibly influenced Eocene rodent families, much like multituberculates, leading to the decline of various rodent families near the Eocene/Oligocene boundary. This decline in both Eocene rodent families and the extinction of multituberculates coincide with significant climate shifts within forest communities, rather than direct competition with each other.
This study revealed a correlation between multituberculates and dawn redwood (Metasequoia) and Chinese swamp cypress (Glyptostrobus), which disappeared from North American forests during the later Cenozoic (Liu et al. Reference Liu, Arens and Li2007). LePage et al. (Reference LePage, Yang, Matsumoto, LePage, Williams and Yang2005) depict some vestiges of Metasequoia remaining into the middle Miocene (14 Ma) in North America, while occurrences are better documented in the earlier Oligocene, such as the well-known Bridge Creek Flora. The last occurrences of Glyptostrobus extend to the middle Miocene as well, with last occurrences in California and Nevada, likely surviving on the wet side of the Sierra Nevada rain shadow (Axelrod Reference Axelrod1995). These trees were replaced by the more modern pine- and spruce-dominated boreal forests in the Neogene, and based on the results of this study, it appears that the loss of forest habitat at the end of the Eocene was a major contributing factor in multituberculate extinction.
Why, then, did the widespread dawn redwood (Metasequoia) and Chinese swamp cypress (Glyptostrobus) forests disappear from North America during the Cenozoic? This disappearance was likely a result of a major drying and cooling that occurred during the second half of the Eocene Epoch leading up to the sudden cool down of the Eocene/Oligocene boundary (Liu et al. Reference Liu, Arens and Li2007; Wang et al. Reference Wang, Kunzmann, Su, Xing, Zhang, Wang and Zhou2019). This pronounced cooling led to the gradual expansion of tundra and permafrost in the northern extremes, while drier climates prevailed in the southern extremes beginning around 40 Ma (LePage et al. Reference LePage, Yang, Matsumoto, LePage, Williams and Yang2005). Living relic natural populations of Metasequoia found near Lichuan City in Central China’s Hubei Province today require wet winters in a warm-temperate (nearly subtropical) zone with a mean annual temperature near 12.7°C and 50 mm of early spring precipitation, with more than 500 mm of annual precipitation (Williams Reference Williams, LePage, Williams and Yang2005; Wang et al. Reference Wang, Kunzmann, Su, Xing, Zhang, Wang and Zhou2019). Without this high level of spring precipitation, the seedlings cannot survive. Similarly, Chinese swamp cypress (Glyptostrobus) requires very wet conditions to grow, and today is found in protected subtropical forests in Laos, Vietnam, and across southern China.
One outcome of this study is that it suggests that Eocene multituberculates in Asia are not as well documented in the fossil record compared with North America. The known fossil occurrence of Metasequoia and Glyptostrobus during the Eocene and late Cenozoic of Asia, such as in Japan, should have provide suitable habitats for multituberculates (Wang et al. Reference Wang, Kunzmann, Su, Xing, Zhang, Wang and Zhou2019). To verify the conclusions of this study, it is recommended that future researchers explore middle Eocene and later deposits in Asia, especially in southern China, for potential gaps in our current knowledge of the latest occurrence of multituberculate fossils. If new discoveries are made in association with these fossils of Metasequoia and Glyptostrobus, it would support the conclusions of this study. However, if the regions were primarily populated by rodents, there may be additional factors contributing to the decline and extinction of multituberculates that played out differently in Asia compared with North America.
Other factors that may have also led to the extinction of multituberculates during the Eocene that were not tested in this study include the early diversification of seed-eating passerine birds (songbirds), with their unique anisodactyl perching foot structure, as well as a diversification of other Eocene mammalian groups, such as paromomyids, microsyopids, and apatemyids, all mammal groups that have elongated incisors. These birds and mammals were not examined in this study but may have also contributed to the decline of arboreal multituberculates during the Eocene given their apparent abilities for feeding on small cone seeds that are found in Metasequoia and Glyptostrobus. This will require further research. Nevertheless, this study is the first to suggest that rodents were not directly competing for the same forest resources with multituberculates, and the two groups occupied different forest communities with unique ecological habitats and niches.
Discussion of Methodology
The application of four distinct parameters—CED, EDRF, NOLA, and NOP—provided a comprehensive framework for evaluating the ecological associations and avoidances between mammal–plant pairings. Of these, the CED and EDRF parameters were consistently the least likely to fall within the null model ranges, indicating stronger indicators for these metrics. Only two mammal–plant pairings were found to align with the stochastic or probabilistic null models, suggesting that most associations or avoidances observed were nonrandom. However, the broad definition of the NOLA stochastic null model, which primarily focused on overlapping polygonal shapes, resulted in many pairings, particularly those involving rodents, falling within this null model range. Similarly, the NOP null model also introduced some ambiguities, leading to inconclusive results for a larger number of rodents compared with multituberculate plant pairings.
In contrast to the stochastic null model, the probabilistic ranges for NOLA and NOP were more narrowly defined, resulting in fewer pairings meeting the criteria for inclusion within these models. When values fell within both of these null model ranges, they could be interpreted as neutral, indicating that no strong association or avoidance could be inferred. Such pairings remain inconclusive. This discrepancy was especially evident in cases where pairings were highly ranked on one parameter (e.g., CED or EDRF) but fell within the null model range for others (e.g., NOLA or NOP). For instance, the Ischyromyidae–Fagaceae pairing ranked highest in CED and NOLA but showed a weaker association according to the NOP parameter, suggesting potential randomness in the observed overlap (Supplementary Appendix S2B).
The key takeaway from this analysis is that pairings where one or more values fall within null model ranges likely reflect weaker or more random association. These contrasts are most apparent when compared with pairings where all four parameters fall outside the null models, which provide stronger evidence of true ecological relationships. The subsampling used to define the probabilistic null model ranges, while narrower and more selective, resulted in fewer occurrences of ambiguous results. Future studies may benefit from further refining these mathematically defined stochastic null models to reduce the overly broad overlaps observed and improve the precision of the associations detected.
This study’s use of broad taxonomic groups, particularly at the family level, may have contributed to some of the ambiguities observed in the results. Finer-scale analyses focusing on genus- or species-level associations could help clarify these relationships and reduce the level of uncertainty surrounding more ambiguous pairings. This finer resolution may also provide more direct evidence of niche overlap, particularly when supplemented by direct dietary evidence from gut content studies in fossil mammals. As such, these mammal–plant associations should be regarded as hypothesized niche models, awaiting further verification through continued fossil discoveries and more detailed examination.
Discussion of Fossil Preservation
A significant issue in assessing mammal–plant associations within this framework of spatial distributions is the uneven nature of fossil preservation, which can bias interpretations of the fossil record. In regions with high fossil sampling, the observed ranges of certain taxa, such as Protoptychidae and Myrtaceae, appear to reflect the high sampling density rather than broader biogeographic distributions. Conversely, undersampled regions might fail to represent the full spatial distribution of any group. Moreover, inconsistencies in defining fossil localities further complicate the interpretation of spatial density. The use of precise geolocation during modern fieldwork often results in narrowly defined fossil localities, while historical data may encompass much larger areas. Equating these two types of localities could overestimate fossil locality density, leading to skewed interpretations of fossil distributions.
An underlying assumption in this study is that fossils of similar types have equal preservation potential, and thus their spatial distribution in the environment reflects ecological associations. However, preservation biases may affect different groups unevenly, particularly if certain environments are more conducive to fossilization. For example, gymnosperms’ narrow evergreen needles preserving less frequently when compared with broadleaf deciduous angiosperms. Also, other forest resources might be absent from the fossil record. For instance, multituberculates may have occupied forest niches where they exploited food resources that are not well represented in the fossil record, such as fungi or insects found only in Metasequoia- and Glyptostrobus-dominated forests. This unaccounted-for niche exploitation could lead to misleading conclusions about mammal–plant associations, especially when fossil preservation is not uniform across similar taxa.
Discussion of the Evolutionary Framework
The findings of this study challenge the long-standing hypothesis that competition with rodents was the primary driver of multituberculate extinction in the Eocene. Instead, the data suggest that shifts in forest composition, particularly the reduction of Metasequoia- and Glyptostrobus-dominated forests, played a more significant role in multituberculate decline. These findings are best interpreted through the lenses of the Red Queen and Court Jester hypotheses. According to the Red Queen hypothesis, multituberculates failed to adapt to new food resources and forest types as their traditional habitats were replaced by more modern forest compositions. Their specialization on the small seed–bearing trees of Metasequoia and Glyptostrobus limited their ecological flexibility, making them particularly vulnerable to extinction.
The Court Jester hypothesis, on the other hand, emphasizes the role of external environmental factors—such as the cooling and drying trends of the late Eocene—in driving the decline of these specialized forest ecosystems. The loss of these habitats, rather than direct competition with rodents, likely compounded the vulnerability of multituberculates, as they were unable to exploit the newly dominant boreal forests of pine and spruce. Rodents, with their more generalized diets and greater ecological flexibility, were better equipped to adapt to these changing environments.
The specialization of multituberculates, particularly their adaptation to specific forest environments, aligns very well with Simpson’s (Reference Simpson1944) adaptive phenotypic landscape model. Multituberculates, having evolved to occupy a specific ecological peak within Metasequoia- and Glyptostrobus-dominated ecosystems, were unable to shift away from this niche as forest compositions changed. Rodents, on the other hand, were able to occupy a broader range of ecological niches due to their dietary flexibility, which likely contributed to their success following the decline of multituberculates.
This study thus proposes that both the Red Queen and Court Jester hypotheses played complementary roles in the extinction of multituberculates. While multituberculates’ inability to adapt to new forest types represents a failure to “run fast enough” in the evolutionary race, broader climatic and environmental changes further accelerated their extinction by eliminating the specific habitats to which they were adapted.
Conclusions
This study challenges the prevailing notion that rodents were the primary cause of multituberculate extinction. Instead, the findings suggest that changes in forest structure during the late Eocene and middle Cenozoic played a more significant role. A strong association was observed between multituberculates and ancient Eocene forests dominated by Metasequoia and Glyptostrobus, both of which began disappearing from North American landscapes in the late Eocene and early Oligocene. These ancient forests were gradually replaced by modern boreal pine and spruce, likely contributing to the decline and eventual extinction of multituberculates.
Notably, both Eocene rodents and multituberculates exhibited avoidance of pine-dominated forests, in contrast to modern rodents, which have adapted to consuming pinecone seeds. This behavioral shift in rodents, driven by a cooler and drier climate, as well as an increased incidence of forest fires, coincided with the decline of various Eocene rodent families and ultimately the extinction of multituberculates.
This study also highlights the importance of future research in Asian regions, particularly southern China, where these ancient forest ecosystems persisted longer. Understanding the habitats and occurrences of multituberculates in these areas may shed new light on their extinction patterns. Additionally, the role of other factors, such as the diversification of seed-eating birds and non-rodent mammals, requires further investigation.
In conclusion, this study contends that rodents were not the primary agents of multituberculate extinction, as previously thought. Instead, the loss of specific forest habitats and the restructuring of forest ecosystems during the Eocene emerge as the more significant drivers of their decline.
Acknowledgments
I extend my deepest gratitude to E. Saupe, the editor, and the four anonymous reviewers whose insightful encouragement to explore the mathematical framework of spatial data significantly enriched the development of stochastic and probabilistic null models for this study. I am also profoundly indebted to P. Robinson whose pioneering work on Eocene multituberculates in the 1960s has been the major source of inspiration for this study.
Competing Interests
The author declares no competing interests.
Data Availability Statement
All accompanying data, including tables, appendices, null-model methods, python scripts, data files, and GIS files are available on Zenodo: https://doi.org/10.5281/zenodo.14657122, with table references on Dryad: https://doi.org/10.5061/dryad.vmcvdnd2v.

 Open access

