


1. Introduction
Recently, an increasingly popular approach in modelling turbulent flows is the use of the linearised Navier–Stokes equations. For example, the linearised Navier–Stokes equations are used: (i) to understand the origin of coherent structures (del Álamo & Jiménez Reference del Álamo and Jiménez2006; Hwang & Cossu Reference Hwang and Cossu2010; McKeon & Sharma Reference McKeon and Sharma2010); (ii) to generate statistical inputs for the state-space estimation problem (Illingworth, Monty & Marusic Reference Illingworth, Monty and Marusic2018; Madhusudanan, Illingworth & Marusic Reference Madhusudanan, Illingworth and Marusic2019; Morra et al. Reference Morra, Semeraro, Henningson and Cossu2019; Gupta et al. Reference Gupta, Madhusudanan, Wan, Illingworth and Juniper2021); (iii) for a predictive quasi-linear approximation (Hwang & Eckhardt Reference Hwang and Eckhardt2020; Skouloudis & Hwang Reference Skouloudis and Hwang2021); (iv) to produce a reduced-order description of exact coherent states and turbulence statistics in the minimal flow unit (Rosenberg & McKeon Reference Rosenberg and McKeon2019; Nogueira et al. Reference Nogueira, Morra, Martini, Cavalieri and Henningson2020); (v) for statistics completion problems from partial measurements (Zare, Jovanović & Georgiou Reference Zare, Jovanović and Georgiou2017; Towne, Lozano-Durán & Yang Reference Towne, Lozano-Durán and Yang2019); (vi) to produce reduced-order models for existing flow control strategies (Luhar, Sharma & McKeon Reference Luhar, Sharma and McKeon2014; Ran, Zare & Jovanović Reference Ran, Zare and Jovanović2021). In wall-bounded turbulent flows, an essential feature in modelling the fluctuating state is how the nonlinear term is replaced. Since wall-bounded turbulent flows are linearly stable (Butler & Farrell Reference Butler and Farrell1993; Pujals et al. Reference Pujals, García-Villalba, Cossu and Depardon2009), a forcing or driving term is necessary to generate non-trivial solutions. Since this forcing term directly replaces the nonlinearity, how accurately this forcing statistically mimics the physics of the nonlinearity has also been observed as a key to the performance of linear models in their various uses (Gupta et al. Reference Gupta, Madhusudanan, Wan, Illingworth and Juniper2021; Morra et al. Reference Morra, Nogueira, Cavalieri and Henningson2021; Symon et al. Reference Symon, Madhusudanan, Illingworth and Marusic2022).
One such modelling framework, which leveraged ‘predictive’ features of the physics of wall-bounded shear flows, was recently proposed by Hwang & Eckhardt (Reference Hwang and Eckhardt2020). In this approach, referred to as minimal quasi-linear approximation (MQLA), the attached eddy model of Townsend (Reference Townsend1976) was revisited to relax the inviscid limit, allowing statistics to be predicted for high yet finite Reynolds numbers. The MQLA achieved this by following the framework of a quasi-linear approximation. The general idea of this approach is to decompose the velocity state into two separate groups, typically a large- and small-scale state. An approximation then arises when the nonlinear self-interactions of the small-scale state are neglected, and instead, a closure is provided. The earliest works that implemented a quasi-linear approximation (Malkus Reference Malkus1954, Reference Malkus1956; Herring Reference Herring1963, Reference Herring1964, Reference Herring1966) provided a closure through a marginal stability criterion. The linear stability of wall-bounded turbulence means that alternative closures have to be provided. Indeed, in modern variants of quasi-linear approximations, the nonlinear self-interactions of the small-scale state have been more flexibly modelled, depending on the nature of the flow and the purpose of the approximation. Such examples include stochastic structural stability theory (Farrell & Ioannou Reference Farrell and Ioannou2007, Reference Farrell and Ioannou2012), direct statistical simulation (Marston, Conover & Schneider Reference Marston, Conover and Schneider2008; Tobias & Marston Reference Tobias and Marston2013), self-consistent approximations (Mantic̆-Lugo, Arratia & Gallaire Reference Mantic̆-Lugo, Arratia and Gallaire2014; Mantic̆-Lugo & Gallaire Reference Mantic̆-Lugo and Gallaire2016), restricted nonlinear models (Thomas et al. Reference Thomas, Lieu, Jovanović, Farrell, Ioannou and Gayme2014, Reference Thomas, Farrell, Ioannou and Gayme2015; Farrell et al. Reference Farrell, Ioannou, Jiménez, Constantinou, Lozano-Durán and Nikolaidis2016), a quasi-linear approximation applied to exact coherent states (Hall & Sherwin Reference Hall and Sherwin2010; Pausch et al. Reference Pausch, Yang, Hwang and Eckhardt2019) and generalised quasi-linear approximations (Marston, Chini & Tobias Reference Marston, Chini and Tobias2016; Tobias & Marston Reference Tobias and Marston2017; Hernández, Yang & Hwang Reference Hernández, Yang and Hwang2022a). The MQLA provided a closure through a stochastic forcing term, implemented self-consistently, i.e. the self-interactions of the small-scale state were enforced to be consistent with the large-scale state, in this case, the mean profile.
From the perspective of the attached eddy hypothesis, the MQLA can be regarded as a controlled approximation with the eddies arising from the linearised Navier–Stokes equations. These linear solutions replace the assumed statistical structure of the representative energy-containing eddies used by Townsend, Perry and co-workers (Townsend Reference Townsend1976; Perry & Chong Reference Perry and Chong1982; Perry, Henbest & Chong Reference Perry, Henbest and Chong1986). The solutions of the linearised Navier–Stokes equations used in the MQLA have the advantage of closely resembling a stage of the self-sustaining process (Hamilton, Kim & Waleffe Reference Hamilton, Kim and Waleffe1995; Waleffe Reference Waleffe1997), a cycle ubiquitous in wall-bounded shear flows and the proposed mechanism for which each of the energy-containing eddies can be sustained (Hwang Reference Hwang2015). In this linear portion of the self-sustaining process, streamwise vortices drive the formation of elongated streaks (i.e. the lift-up effect) (Ellingsen & Palm Reference Ellingsen and Palm1975; Schmid & Henningson Reference Schmid and Henningson2001; Brandt Reference Brandt2014), the key length scales of which are determined through the eddy viscosity enhanced linearised Navier–Stokes operator (Hwang & Cossu Reference Hwang and Cossu2010). Instead of superposing the representative statistical structure of the energy-containing eddies subject to constant Reynolds shear stress, as done by Townsend (Reference Townsend1976), the nonlinear term in the linearised fluctuation equations was replaced self-consistently. The linear operator was modified by an eddy viscosity diffusion term and a forcing structure that generates the Reynolds shear stress identical to that from the nonlinear mean equation. In other words, a self-consistent closure of a quasi-linear approximation was provided. With the mean profile known, the MQLA becomes a predictive framework. The forcing term required to drive the Reynolds shear stress consistent with the mean profile allows further statistics of the velocity fluctuations to be determined at different Reynolds numbers.
Although the attached eddy hypothesis assumes and leverages the self-similar nature of the eddies, attention has been turned to understanding the statistical structure of the forcing or nonlinear term. The benefits of having a well-prescribed model for the nonlinear term are demonstrated, for example, by the performance of state-space estimators (Hœpffner et al. Reference Hœpffner, Chevalier, Bewley and Henningson2005; Chevalier et al. Reference Chevalier, Hœpffner, Bewley and Henningson2006; Illingworth et al. Reference Illingworth, Monty and Marusic2018; Madhusudanan et al. Reference Madhusudanan, Illingworth and Marusic2019; Morra et al. Reference Morra, Semeraro, Henningson and Cossu2019), with more physical models for the nonlinear term resulting in better predictions of velocity statistics across the wall-normal direction (Gupta et al. Reference Gupta, Madhusudanan, Wan, Illingworth and Juniper2021). There is a variety of approaches in determining and modelling the forcing term, ranging from statistically exact control and optimisation-based techniques (for a review, see Jovanović Reference Jovanović2021) to measurement through direct numerical simulation (Chevalier et al. Reference Chevalier, Hœpffner, Bewley and Henningson2006; Nogueira et al. Reference Nogueira, Morra, Martini, Cavalieri and Henningson2020; Morra et al. Reference Morra, Nogueira, Cavalieri and Henningson2021), as well as more phenomenological modelling (Jovanović & Bamieh Reference Jovanović and Bamieh2001; Gupta et al. Reference Gupta, Madhusudanan, Wan, Illingworth and Juniper2021; Holford, Lee & Hwang Reference Holford, Lee and Hwang2023). For example, Zare et al. (Reference Zare, Jovanović and Georgiou2017) determined a set of two-point coloured-in-time forcing statistics through an optimisation problem. This optimisation problem had constraints such that the velocity spectral density exactly matched that of a direct numerical simulation (DNS). This work was recently complemented by Abootorabi & Zare (Reference Abootorabi and Zare2023), which demonstrated the benefits of an additional eddy viscosity diffusion operator to the coloured-in-time forcing. While these methods can yield forcing statistics that generate the exact velocity statistics, often, the techniques are local in the sense that they are applied to a single wavenumber pair and hence have to be repeated for every wavenumber pair to build a global forcing structure.
Regarding implementing a predictive framework, the inputs to many models are often obtained through DNS, which is frequently a desirable output. To address this issue, Holford et al. (Reference Holford, Lee and Hwang2023) recently identified a global forcing structure across the entire wavenumbers required for the eddy viscosity enhanced linearised Navier–Stokes operator with a simplification that the forcing is white in time and decorrelated in space. The findings revealed the self-similar nature of the forcing spectra corresponding to the main energy-containing part of the velocity spectra. In the current work, Holford et al. (Reference Holford, Lee and Hwang2023) is approximately followed to provide a global structure for the forcing across streamwise wavenumbers and Reynolds numbers.
The main findings of the MQLA (Hwang & Eckhardt Reference Hwang and Eckhardt2020) were consistent with the seminal predictions of Townsend's attached eddy hypothesis on turbulence intensities. By superposing the solutions of the linearised Navier–Stokes equations with a forcing that provides a self-consistent Reynolds shear stress, a logarithmic decay in the wall-parallel turbulence intensities was found, as well as a region where the wall-normal turbulence intensity is approximately constant. Additionally, since the determination of the fluctuating velocity generated Reynolds shear stress in the MQLA requires integration of the velocity spectra, the scaling behaviour of the one-dimensional velocity spectra could also be extrapolated to exceptionally high Reynolds numbers (Skouloudis & Hwang Reference Skouloudis and Hwang2021). A strong qualitative match was found between the one-dimensional spanwise wavenumber velocity spectra produced by the MQLA and those reported by DNS (Lee & Moser Reference Lee and Moser2015). However, important quantitative differences were also found. In particular, turbulence intensities of the MQLA were highly anisotropic compared with those of DNS, with the streamwise turbulence intensity far exceeding that of DNS. At the same time, the other velocity components, particularly the wall-normal component, were significantly lower. This result stems from neglecting the streamwise varying Fourier modes in the MQLA, causing the absence of streamwise pressure strain that transfers the energy produced in the streamwise component to the other components (Cho, Hwang & Choi Reference Cho, Hwang and Choi2018; Lee & Moser Reference Lee and Moser2019). Neglecting the streamwise varying Fourier modes is also understood to prohibit the MQLA's capabilities in reproducing features of the self-sustaining process beyond the lift-up effect, particularly the streak instability or transient growth, which plays a crucial role in redistributing turbulent kinetic energy from the streamwise velocity component to the others (Schoppa & Hussain Reference Schoppa and Hussain2002; de Giovanetti, Sung & Hwang Reference de Giovanetti, Sung and Hwang2017; Doohan, Willis & Hwang Reference Doohan, Willis and Hwang2021; Lozano-Durán et al. Reference Lozano-Durán, Constantinou, Nikolaidis and Karp2021).
The present paper aims to extend the MQLA to include the streamwise varying Fourier modes, with an emphasis on maintaining the predictive nature of the MQLA at different Reynolds numbers. To this end, a physics-aware data-driven approach will be taken. Hereafter, the framework of the current study will be referred to as the data-driven quasi-linear approximation (DQLA) to distinguish it from the MQLA. The DQLA framework incorporates the physics element through the attached eddy hypothesis and enforces self-similarity of the forcing with respect to the spanwise length scale. The detailed structure of the forcing is determined using the DNS database from Lee & Moser (Reference Lee and Moser2015). This approach relies on the self-similar nature of the eddy viscosity enhanced linear operator (Hwang & Cossu Reference Hwang and Cossu2010), which has been corroborated by recent findings on the statistical structure of the forcing of this linear model from Holford et al. (Reference Holford, Lee and Hwang2023). While developing a predictive model for turbulent statistics and spectra, the DQLA will provide a fair means of evaluating the performance of the eddy viscosity diffusion operator within linear modelling frameworks. In particular, by incorporating non-zero streamwise wavenumbers, it allows for a comprehensive assessment across a wide range of wavenumber pairs. The results presented represent an initial step, focusing on the evaluation of velocity spectra.
The paper is organised as follows. The DQLA framework is developed in § 2, formulating two optimisation problems. Firstly a self-similar weight is determined following Holford et al. (Reference Holford, Lee and Hwang2023). This weight is then extrapolated across all considered Fourier modes, and a quasi-linear approximation is then implemented following Hwang & Eckhardt (Reference Hwang and Eckhardt2020). The linear model used throughout this study includes an eddy viscosity diffusion operator, and its significance is briefly discussed. The results of the DQLA at  $Re_\tau \simeq 5200$, where $Re_\tau$ is the friction Reynolds number, are then compared with statistics from DNS of Lee & Moser (Reference Lee and Moser2015) in § 3. Emphasis will be placed on the streamwise one-dimensional and two-dimensional velocity spectra since the MQLA cannot produce these statistics. Additionally, any quantitative improvements of the DQLA compared with the MQLA will be discussed concerning the inclusion of streamwise varying Fourier modes. The predictive capabilities of the DQLA will be assessed by extrapolating results up to $Re_\tau = 10^5$ in § 4. The paper is then concluded in § 5, which summarises the results and limitations of this framework.
2. Problem formulation
2.1. Turbulent channel flow
A quasi-linear approximation for incompressible, fully developed turbulent channel flow is considered. The flow domain is the region confined between two infinitely long and wide plates. The coordinates along the streamwise, wall-normal and spanwise directions are denoted by  $x$,
$x$,  $y$ and $z$, respectively, with a corresponding velocity vector $\boldsymbol {u} = (u,\,v,\,w)$. The two plates are located at $y=0,2h$, where $h$ represents the half-width of the channel. The velocity field is decomposed into a time-averaged mean field, $\boldsymbol {U} = (U(y),\,0,\,0)$, and the fluctuating velocity about this mean profile, $\boldsymbol {u}' = (u',\,v',\,w')$, i.e. the Reynolds decomposition. This results in the following coupled set of equations:
 $$\begin{gather} \nu\frac{\mathrm{d}U}{\mathrm{d}\kern0.05em y} - \overline{u'v'} = \frac{\tau_w}{\rho}\left(1-\frac{y}{h}\right), \end{gather}$$
 $$\begin{gather}\frac{\partial \boldsymbol{u}'}{\partial t} + (\boldsymbol{U} \boldsymbol{\cdot} \boldsymbol{\nabla})\boldsymbol{u}' + (\boldsymbol{u}' \boldsymbol{\cdot} \boldsymbol{\nabla})\boldsymbol{U} =-\frac{1}{\rho}\boldsymbol{\nabla} p + \nu \nabla^2\boldsymbol{u} + \mathcal{\boldsymbol{N}}, \end{gather}$$
where
 \begin{equation} \mathcal{N} =-\boldsymbol{\nabla} \boldsymbol{\cdot}(\boldsymbol{u}'\boldsymbol{u}' - \overline{\boldsymbol{u}' \boldsymbol{u}'}). \end{equation}
Here,  $t$ denotes time, $\rho$ the fluid density, $p'$ the fluctuating pressure, $\nu$ the kinematic viscosity, $\overline {({\cdot })}$ a time-averaged quantity and $\tau _w$ is the time-averaged wall shear stress. Following the typical quasi-linear approximation framework, the time-averaged mean profile equation retains this form, including the nonlinear Reynolds shear stress term feeding back from the fluctuating velocity field. The dynamics of the fluctuating velocity is then ‘linearised,’ dropping the self-advection term.
As the associated linear operator is stable for the turbulent mean profile in channel flow (Pujals et al. Reference Pujals, García-Villalba, Cossu and Depardon2009), an additional driving term must be considered for non-trivial statistics. To this end, the nonlinear term is replaced with the following model:
 \begin{equation} \mathcal{N}_{\nu_t,\,f} = \boldsymbol{\nabla} \boldsymbol{\cdot} (\nu_t (\boldsymbol{\nabla} \boldsymbol{u}' + \boldsymbol{\nabla} \boldsymbol{u}'^T)) + \boldsymbol{f}', \end{equation}
where  $\boldsymbol {f}'=(\,f_u',f_v',f_w')$ is a stochastic forcing term and Cess’ expression (Cess Reference Cess1958) is used for the eddy viscosity profile
 \begin{align} \nu_t(\eta) = \frac{\nu}{2}\left\{1 + \frac{\kappa^2Re_{\tau}^2}{9}(1 - \eta^2)^2(1+2\eta^2)^2(1-\exp[(|\eta|-1)Re_{\tau}/A])^2\right\}^{0.5} - \frac{\nu}{2}, \end{align}
with  $\eta = (y-h)/h$. Including the eddy viscosity term in (2.2a) is not a necessity. Using only a forcing term would leave the coupled system as statistically ‘exact’ if the forcing was set to be identical to a set of known statistics generated by the nonlinear term. That being said, the covariance of the nonlinear term has been demonstrated to not possess sign definiteness (Zare et al. Reference Zare, Jovanović and Georgiou2017), which significantly complicates the modelling procedure (for example, Zare et al. Reference Zare, Jovanović and Georgiou2017). The advantage of using the eddy viscosity modified operator lies in the relaxation of this complication with a physical model, although its use does not necessarily enforce the energy neutrality of the nonlinear term. By doing so, the forcing input can be kept as white in time, whereas the overall model for the nonlinear term will be coloured in time through the eddy viscosity. It has been demonstrated that this eddy viscosity term phenomenologically mimics some features of the nonlinear term, including the removal of energy across all integral length scales (Symon, Illingworth & Marusic Reference Symon, Illingworth and Marusic2021), as well as the modelling of the wall-attached footprints of large scales in the velocity spectra of the wall-parallel components (Symon et al. Reference Symon, Madhusudanan, Illingworth and Marusic2022; Holford et al. Reference Holford, Lee and Hwang2023). The same eddy viscosity is also used as a closure in determining the mean velocity profile with
 \begin{equation} -\overline{u'v'} = \nu_t\frac{\mathrm{d}U}{\mathrm{d}\kern0.05em y}, \end{equation}
upon which solving (2.1a) gives the robust law of the wall. Following this closure for the mean profile, the eddy viscosity parameters are set with  $\kappa = 0.426$ and $A = 25.4$, obtained by the best least squares fitting of the mean profile obtained by integrating (2.1a) with (2.3) and the DNS mean profile at $Re_\tau \approx 2000$ (del Álamo & Jiménez Reference del Álamo and Jiménez2006). The crude physical argument for using the same eddy viscosity profile in the mean and fluctuating velocity component equates to both velocity fields experiencing the same background turbulence. Although this physical assumption is used mainly for simplicity, the inclusion of an eddy viscosity diffusion operator has been shown to be beneficial in many previous studies (see, for example, Pujals et al. Reference Pujals, García-Villalba, Cossu and Depardon2009; Zare et al. Reference Zare, Jovanović and Georgiou2017; Illingworth et al. Reference Illingworth, Monty and Marusic2018; Morra et al. Reference Morra, Semeraro, Henningson and Cossu2019; Symon et al. Reference Symon, Illingworth and Marusic2021). Notably, the inclusion of the eddy-viscosity-based diffusion enables one to describe the inner-scaling behaviour of the near-wall-attached region of the outer-scale structures observed in full DNS, in terms of the modes associated with transient growth, resolvent analysis and the stochastic response of the linearised fluctuation equations (Hwang & Cossu Reference Hwang and Cossu2010; Hwang Reference Hwang2016).
In the present study, the forcing is first considered to be white in time and decorrelated in the wall-normal direction for the purpose of utilising the framework of the stochastic linear dynamical system (Farrell & Ioannou Reference Farrell and Ioannou1992; Jovanović & Bamieh Reference Jovanović and Bamieh2005; Hwang & Cossu Reference Hwang and Cossu2010). Given the homogeneous nature of the wall-parallel directions, it is convenient to consider the Fourier transform along those directions
 \begin{equation}
\hat{\boldsymbol{f}}'(t,y;k_x,k_z) =
\int_{-\infty}^{\infty}\int_{-\infty}^{\infty}
\boldsymbol{f}'(t,x,y,z)\,{\rm exp}({\rm i}(k_x x + k_z
z))\,\mathrm{d}\kern0.06em x \,\mathrm{d}z,
\end{equation}
\begin{equation}
\hat{\boldsymbol{f}}'(t,y;k_x,k_z) =
\int_{-\infty}^{\infty}\int_{-\infty}^{\infty}
\boldsymbol{f}'(t,x,y,z)\,{\rm exp}({\rm i}(k_x x + k_z
z))\,\mathrm{d}\kern0.06em x \,\mathrm{d}z,
\end{equation}
giving the wall-normal forcing profiles at a given pair of streamwise and spanwise length scales  $\lambda _x = {2{\rm \pi} }/{k_x}$ and $\lambda _z = {2{\rm \pi} }/{k_z}$, where ( $k_x, k_z$) is the considered wavenumber pair. Analogous definitions of the Fourier transform are used for the other flow states. The spectral covariance matrix for the forcing is then considered to be
 \begin{align} &\mathbb{E}[\,\hat{\boldsymbol{f}}'(y,t;k_x,k_z)\,\hat{\boldsymbol{f}}'^H(y',t';k_x,k_z) ] \nonumber\\ &\quad =\begin{bmatrix} W_u(k_x,k_z) & 0 & 0 \\ 0 & W_v(k_x,k_z) & 0\\ 0 & 0 & W_w(k_x,k_z) \end{bmatrix}\delta(y-y')\delta(t-t'), \end{align}
where  $({\cdot })^{H}$ denotes complex conjugate transpose, $\mathbb {E}[{\cdot } ]$ is the expectation operator over different stochastic realisations and $W_{r}$, with $r=\{u,v,w\}$, are componentwise weights to be determined. Here, the forcing amplitude is considered to vary componentwise, and this is to model the anisotropic nature of the velocity statistics and spectra in channel flow more flexibly.
The resulting power- and cross-spectral densities of velocity fluctuations are obtained from the following velocity spectral covariance matrix:
 \begin{equation} \varPhi_{\boldsymbol{u} \boldsymbol{u}}(y,y';k_x,k_z) = \mathbb{E}[\hat{\boldsymbol{u}}'(y,t;k_x,k_z)\hat{\boldsymbol{u}}'^H(y',t;k_x,k_z)]. \end{equation}
Given the linear relation between the velocity and forcing spectral covariance matrices (Farrell & Ioannou Reference Farrell and Ioannou1992; Jovanović & Bamieh Reference Jovanović and Bamieh2005; Hwang & Cossu Reference Hwang and Cossu2010),  $\varPhi _{\boldsymbol {u} \boldsymbol {u}}(y,y';k_x,k_z)$ can further be decomposed into
 \begin{equation} \varPhi_{\boldsymbol{u} \boldsymbol{u}}(y,y';k_x,k_z) = \sum_{r=u,v,w}W_{r}(k_x,k_z)\varPhi_{\boldsymbol{u} \boldsymbol{u},r}(y,y';k_x,k_z), \end{equation}
where  $\varPhi _{\boldsymbol {u} \boldsymbol {u},r}(y,y';k_x,k_z)$ is the velocity spectral covariance matrix associated with each component of the forcing with the unit amplitude: for example, $\varPhi _{\boldsymbol {u} \boldsymbol {u},u}$ is obtained by setting the forcing spectral covariance to be
 \begin{equation} \mathbb{E}[\,\hat{\boldsymbol{f}}'(y,t;k_x,k_z)\,\hat{\boldsymbol{f}}'^H(y',t';k_x,k_z) ] = \begin{bmatrix} \delta(y-y') & 0 & 0\\ 0 & 0 & 0\\ 0 & 0 & 0 \end{bmatrix}\delta(t-t'), \end{equation}
and  $\varPhi _{\boldsymbol {u} \boldsymbol {u},v}$ and $\varPhi _{\boldsymbol {u} \boldsymbol {u},w}$ are obtained in the same manner. In this study, $\varPhi _{\boldsymbol {u} \boldsymbol {u},r}$ for $r=\{u,v,w\}$ are obtained by solving the standard Lyapunov equation formulated with the Orr–Sommerfeld–Squire system of equations. The equations are discretised using a Chebyshev collocation method (Weideman & Reddy Reference Weideman and Reddy2000) with the wall-normal grid points reported in table 1. For the details of the solution method, the reader may refer to previous studies (Hwang & Cossu Reference Hwang and Cossu2010; Holford et al. Reference Holford, Lee and Hwang2023). The domain of streamwise and spanwise wavelengths are considered as $(\lambda _x,\lambda _z) \in [10\delta _\nu,10\delta _\nu ] \times [100h,10h]$ ( $\delta _\nu =\nu /u_\tau$, where $u_\tau$ is the friction velocity) to cover a range of length scales including near-wall motions, as well as very large-scale motions in the outer region.
Numerical and optimisation parameters used in the present study:  $N_{k_x}$, the number of streamwise wavenumbers; $N_{k_z}$, the number of spanwise wavenumbers; $N_{y}$, the number of wall-normal collocation points.

2.2. Simplifications
The forcing covariance considered in (2.5) may be a starting point of the proposed quasi-linear approximation. However, a white-in-time, uniform forcing in the wall-normal direction at each  $k_x$ and $k_z$ is non-physical. In particular, a uniform wall-normal forcing variance profile yields an undesirable, large energetic response near the channel centreline (see figures 5 and 6 in Hwang & Eckhardt Reference Hwang and Eckhardt2020). It was previously shown that considering some of the leading proper orthogonal decomposition (POD) modes from the response to this forcing offers an effective means to filter out these unwanted features, with respect to modelling the primary energy-containing motions at integral length scales (Hwang & Eckhardt Reference Hwang and Eckhardt2020). That is not to say the less energetic POD modes are not useful – they may be useful in the modelling of other features of turbulence (e.g. small-scale spectra associated with energy cascade). This ansatz also exacerbates the anisotropy of the velocity fluctuations of the quasilinear models (see figure 5 in Hwang & Eckhardt Reference Hwang and Eckhardt2020), although this is a necessary step to overcome the arbitrary assumption of a spatially white forcing input.
Given these previous experiences from Hwang & Eckhardt (Reference Hwang and Eckhardt2020), the forcing statistics in this study are also implicitly modified to drive leading POD modes that contain significant energetic content of the overall response (Hwang & Cossu Reference Hwang and Cossu2010). Consequently, for a given wavenumber pair, the velocity spectral covariance matrix for each forcing component (i.e.  $\varPhi _{\boldsymbol {u} \boldsymbol {u},r}$) is further approximated in terms of the leading-order POD modes, such that
 \begin{equation} \varPhi_{\boldsymbol{u} \boldsymbol{u},r}^{N_{\mathit{POD}}}(y,y';k_x,k_z)=\sum_{i=1}^{N_{\mathit{POD}}}\sigma_{i} \hat{\boldsymbol{u}}_{i,r,\mathit{POD}}(y;k_x,k_z)\hat{\boldsymbol{u}}^H_{i,r,\mathit{POD}}(y';k_x,k_z), \end{equation}
where  $N_{\mathit {POD}}$ is the number of POD modes, and $\sigma _{i}$ and $\hat {\boldsymbol {u}}_{i,r,\mathit {POD}}(y';k_x,k_z)$ are the eigenvalues and eigenfunctions of the original velocity spectral covariance matrix with white-in-time and spatially decorrelated forcing, denoted by $\varPhi _{\boldsymbol {u} \boldsymbol {u}}^W$
 \begin{equation} {} \int_0^{2h} \varPhi_{\boldsymbol{u} \boldsymbol{u}}^{W}(y,y';k_x,k_z) \hat{\boldsymbol{u}}_{i,\mathit{POD}}(y';k_x,k_z)\textrm{d}\kern0.05em y' = \sigma_i \hat{\boldsymbol{u}}_{i,\mathit{POD}}(y;k_x,k_z), \end{equation}
with  $\sigma _i \geq \sigma _{i+1}$. Considering the previous observation in Hwang & Eckhardt (Reference Hwang and Eckhardt2020), $N_{\mathit {POD}} = 2$ is chosen here, retaining the most energetic structure when accounting for the geometrical symmetry in channel flow about $y=h$.
In addition to this, the weighting along the streamwise wavenumber axis is implemented considering the self-similarity of the forcing structure with respect to the spanwise wavenumber (Hwang & Cossu Reference Hwang and Cossu2010; Holford et al. Reference Holford, Lee and Hwang2023), as expected from the attached eddy hypothesis of Townsend (Townsend Reference Townsend1976; Hwang Reference Hwang2015) (see § 2.3 for further details). Consequently, the weight of each component is decomposed into a part that retains the self-similar structure  $W_{r,k_x}(k_x/k_z)$ along the streamwise wavenumber axis and a part that determines its amplitude $W_{k_z}(k_z)$ for each spanwise wavenumber, such that
 \begin{equation} W_{r}(k_x,k_z) = W_{r,k_x}(k_x/k_z)W_{k_z}(k_z), \end{equation}
giving the final form of velocity spectra covariance matrix for the quasi-linear approximation in this study
 \begin{equation} {} \varPhi_{\boldsymbol{u} \boldsymbol{u}}(y,y';k_x,k_z) = W_{k_z}(k_z)\sum_{r=u,v,w}W_{r,k_x}(k_x/k_z)\varPhi_{\boldsymbol{u} \boldsymbol{u},r}^{N_\mathit{POD}}(y,y';k_x,k_z). \end{equation}
The weights are determined by solving the optimisation problems proposed in the following two subsections.
2.3. Data-driven determination of streamwise weighting
To first determine the self-similar weight  $W_{r,k_x}(k_x/k_z)$ along the streamwise wavenumber axis, for each $k_z$, an optimisation problem is considered such that (2.10) best matches the two-dimensional velocity spectra and Reynolds shear stress cospectra of DNS at $Re_\tau \approx 5200$ (Lee & Moser Reference Lee and Moser2015), denoted by $\varPhi _{\boldsymbol {u} \boldsymbol {u} }^{\mathit {DNS}}(y;k_x,k_z)$. This problem has recently been solved with the addition of a wall-normal variation in the forcing term in Holford et al. (Reference Holford, Lee and Hwang2023), and the reader is referred to it for a more complete discussion on the modelling rationale. The present study leverages the main findings from Holford et al. (Reference Holford, Lee and Hwang2023). However, a more straightforward problem is solved for the weight, with the use of the POD modes implicitly varying the wall-normal profile of the forcing term so that the modelling efforts can be extrapolated to other Reynolds numbers without using any further DNS data at different Reynolds numbers.
To determine the weight, two main observations are highlighted. The first is the self-similar nature of the velocity spectra from DNS with respect to the spanwise length scale (Hwang Reference Hwang2015; Holford et al. Reference Holford, Lee and Hwang2023). In particular, the self-similarity occurs at wavenumbers which contribute significantly to the turbulence intensity profiles, i.e. main energy-containing features of the spectra. The second is that the eddy viscosity modified linearised Navier–Stokes equations also generate an approximately self-similar response with respect to the spanwise length scale (Hwang & Cossu Reference Hwang and Cossu2010; Hwang & Eckhardt Reference Hwang and Eckhardt2020). Note that this second observation is primarily due to the eddy viscosity. The key feature of the eddy viscosity is  $\nu _t \sim y$, responsible for the re-scaling property of the linear operator with respect to the spanwise wavenumber in the logarithmic region (Hwang & Cossu Reference Hwang and Cossu2010). Combining these two observations, an optimisation problem that weights a self-similar linear response to an approximately self-similar set of DNS spectra is considered. It is then expected that the weights themselves would be self-similar, at least to the same degree as the DNS velocity spectra. A weighting is now determined to match the two-dimensional velocity spectra from DNS at a given spanwise length scale through the following optimisation problem:
 \begin{equation} \min_{W_{r,k_x}}\sum_s\frac{\Vert \boldsymbol{\varPhi}^{\mathit{DNS}}_{s} - \boldsymbol{\varPhi}_{s}(W_{r,k_x}) \Vert_Q}{\Vert \boldsymbol{\varPhi}^{\mathit{DNS}}_{s} \Vert_Q} +\sum_{r}\gamma{J[W_{r,k_x}]}, \end{equation}
subject to
 \begin{equation} W_{r,k_x}(k_x,y;k_z) \geq 0, \end{equation}
where  $r = \{u, v, w\}$, $s = \{uu, vv, ww, uv\}$ and $\gamma$ is a parameter controlling the relative importance of the regularisation. Here, $J$ is a regularisation functional to penalise the roughness of the forcing intensity, to ensure smooth velocity spectra and to partially denoise the DNS spectra (Holford et al. Reference Holford, Lee and Hwang2023), chosen to be
 \begin{equation} J[W_{r,k_x}] = \left \Vert \left(\frac{\partial^2 W_{r,k_x}}{\partial \ln {k_x}^2}\right) \right \Vert_Q, \end{equation}
where  $\Vert {\cdot } \Vert _Q$ is a norm defined as $\Vert {\cdot } \Vert _Q^2=\int _0^{2h}\int _{-\infty }^{\infty }({\cdot })^2k_xQ(y)\,\mathrm {d}\ln k_x\,\mathrm {d}\kern 0.05em y$ with weight $Q(y) = \chi ^{-1}$, where $\chi = 1 - |\eta |$ is the distance from the wall, to place equal emphasis on points following a logarithmic scaling with distance from the wall. Note that the logarithmic coordinates are also used along the $k_x$-axis to focus the problem on the modelling of the self-similar energy-containing part, placing less significance on the non-self-similar part originating from energy cascade (see Holford et al. Reference Holford, Lee and Hwang2023, for a further discussion). In particular, the purpose of this weighting along the streamwise wavenumber axis is to provide a self-similar weight for use across all wavenumber pairs and all Reynolds numbers.
The convex optimisation problem (2.11) was solved by discretising the spectral velocity state onto  $N_y = 512$ grid points with the Chebyshev collocation method. Discretisation along the streamwise wavenumber axis was carried out with logarithmic spacing to maintain ${\varDelta } (\ln k_x) \leq 0.05$ or otherwise to align with the DNS streamwise wavenumbers for the smaller values of $k_xh$, resulting in 132 streamwise Fourier modes being used, and integration performed using the trapezoidal rule along the streamwise wavenumber axis. The optimisation problem was then converted to a standard second-order cone problem and solved with the MOSEK solver (MOSEK ApS 2022). The trend in the optimisation errors, defined by the first term in (2.11a), upon increasing the regularisation parameter, was found to increase monotonically with $\gamma$ (see figure 14 in Appendix A). Hence, $\gamma$ was set upon inspection of the velocity spectra and smoothness of the weights. An approximate value of $\gamma = 0.5$ was used and changed upon trial and inspection, giving values ranging from 0.3–1.2 across the considered spanwise wavenumbers.
Figure 1 shows solutions to (2.11) for spanwise length scales associated with the logarithmic region, varying from  $k_zh = 14$ ( $\lambda _z/h \approx 0.45$) up to $k_zh = 126$ ( $\lambda _z^+ \approx 259$). Here, the premultiplied weighting is plotted, as this is more physically representative of the forcing spectral density in logarithmic coordinates, as opposed to a weighting correction applied to the velocity spectra. A similar qualitative trend is seen across all components: an approximate self-similarity at relatively large wavelengths ( $\lambda _x \gtrsim \lambda _z$) in the weighting, with a spanwise-wavelength-dependent weighting at small wavelengths ( $\lambda _x \lesssim \lambda _z$). This trend qualitatively agrees well with the recent finding in Holford et al. (Reference Holford, Lee and Hwang2023), where the forcing spectra, obtained for the same linear model, were found to be approximately self-similar at the integral length scale (i.e. $\lambda _x \sim \lambda _z \sim y$), while they are not for $\lambda _x \lesssim \lambda _z$ at which the corresponding DNS spectra are associated with energy cascade. In particular, the forcing spectra for $\lambda _x \lesssim \lambda _z$ were also found to grow with $\lambda _z$ due to the increased separation of local integral and dissipation length scales, consistent with the behaviours of the weights in figure 1. However, it is important to note that this scale-dependent weighting for $\lambda _x \lesssim \lambda _z$ is of little significance in the modelling of the spectra (Holford et al. Reference Holford, Lee and Hwang2023). At the smaller streamwise length scales of $\lambda _x \lesssim \lambda _z$, large forcing input is required to drive relatively inconsequential features of the velocity spectra associated with the energy cascade (Holford et al. Reference Holford, Lee and Hwang2023) (see the discussion below and figure 2b). The contributions of these features to turbulent kinetic energy are small, and they have often been ignored in classical attached eddy models (Townsend Reference Townsend1976; Hwang, Hutchins & Marusic Reference Hwang, Hutchins and Marusic2022). In a similar context, no attempt is made here to correct or modify the weighting at different length scales. This observation is further confirmed by assuming the weights given from solutions of (2.11) at different $\lambda _z$ as self-similar and determining the errors between the normalised spectra at different spanwise length scales (see figure 15d in Appendix A for the sensitivity to weights). It is shown that the scale-dependent features in the weight of $W_{r,k_x}(k_x/k_z)$ have only a small effect on the structure of the velocity spectra, with the total errors being largely independent of the weight obtained for different $k_z$ in figure 1.
Premultiplied streamwise Fourier mode weights in self-similar coordinates for  $k_zh = 14$, 30, 50, 76, 126 ( $\lambda _z/h = 0.45$, 0.21, 0.13, 0.08, 0.05 or $\lambda _z^+ = 2327$, 1086, 651, 429, 259): (a) streamwise, (b) spanwise and (c) wall-normal velocity components. Here, the $\widetilde {({\cdot })}$ denotes the weights normalised such that their premultiplied maximum value is one.

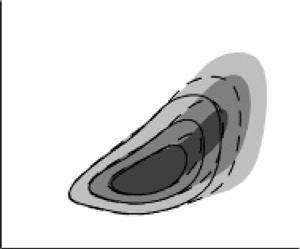
Premultiplied two-dimensional spectra in self-similar coordinates for  $k_zh = 14$, $k_z^+ = 0.0027$ ( $\lambda _z = 0.45h$, $\lambda _z^+ = 2333$) of (a,b) streamwise velocity spectra and (c,d) Reynolds shear stress cospectra determined from (a,c) DNS and (b,d) DQLA. The contour levels are separated by 0.25 times the maximum value for each spectra.

To demonstrate what kind of two-dimensional velocity spectra in the  $k_x$– $y$ plane (2.11) determines, figure 2 compares the streamwise velocity spectra (figure 2a,b) and Reynolds shear stress cospectra (figure 2c,d) of the DNS, to the optimally weighted velocity spectra at $k_zh = 14$. In the streamwise component of the optimally weighted spectra (figure 2b), an energetic response is seen for $1 \lesssim \lambda _x/h \lesssim 10$, consistent with the DNS streamwise velocity spectra (figure 2a). However, the DNS streamwise velocity spectra also have energetic content for $\lambda _x/h \lesssim 1$ away from the wall ( $y/h \gtrsim 0.02$). This part of the spectra has been understood to be associated with the physical processes that would not be modelled well by the linearised model (2.1b) with (2.2a), as discussed in detail in the previous studies (Hwang Reference Hwang2015; de Giovanetti et al. Reference de Giovanetti, Sung and Hwang2017; Holford et al. Reference Holford, Lee and Hwang2023). The weighted linear response of leading POD modes appears to neglect a majority of these features. The other qualitative difference between the spectra is the extent to which the primary peak extends towards the wall, with the primary peak from the linear response extending close towards the wall. The observed differences between the DNS streamwise velocity spectra and the optimally weighted leading POD modes indicate some critical limitations in the current modelling approach. It may be overcome by taking the recent approaches designed to fully reconstruct the spectra using the given linear model at a given Reynolds number (Abootorabi & Zare Reference Abootorabi and Zare2023). However, such approaches do not easily enable us to use the modelled spectra for extrapolation to other Reynolds numbers without additional DNS data. For this purpose, a simple approach is taken, and the spectra not directly associated with the linear processes of the flow are ignored. As discussed above, this is similar to the original attached eddy model of Townsend (Townsend Reference Townsend1976), which ignored all the motions related to energy cascade and dissipation (i.e. small-scale detached eddies).
A more substantial qualitative match is found comparing the Reynolds shear stress cospectra (figure 2c,d). The weighted linear response provides a good agreement for the streamwise wavelength of the primary peak and is overall energetic for a majority of the corresponding DNS spectra. However, the overall amplitude of the Reynolds shear stress generated by the optimally weighted leading POD modes is relatively weak. For the standard  $L_2$-norm over the entire wall-normal distance and considered streamwise wavenumbers (i.e. the root mean square velocities), the ratio of the norms of Reynolds shear stress between the linear model and DNS is approximately $0.4$. In contrast, the streamwise response is approximately $0.9$, indicating a relatively low Reynolds shear stress. This level of anisotropy is expected to carry through results, an intrinsic limitation in this modelling approach, and it originates from the spatially decorrelated nature of the forcing considered initially (see also Holford et al. Reference Holford, Lee and Hwang2023, for a further discussion). Given that the weight shown in figure 1 is approximately self-similar for $\lambda _x/\lambda _z \gtrsim 1$ and the non-self-similar parts for $\lambda _x/\lambda _z \lesssim 1$ do not generate a strong response for the resulting spectra in figure 2, the weight from $k_zh = 30$ shall be used as a self-similar weight for all wavenumber pairs throughout this study. Note that the choice of the weight does not significantly change the resulting quasi-linear approximation (see Appendix A for the sensitivity to weight choice on results of the entire DQLA procedure at $Re_\tau \approx 5200$).
2.4. Self-consistent determination of spanwise weighting
With the self-similar weighting set  $W_{r,k_x}(k_x/k_z)$ along the streamwise axis determined, an optimisation problem to determine the spanwise dependent weighting $W_{k_z}(k_z)$ is now considered. As the Reynolds shear stress generated by the fluctuating velocity field must be identical to that required for the mean profile (see also Hwang & Eckhardt Reference Hwang and Eckhardt2020, for further details), the following optimisation problem for $W_{k_z}(k_z)$ is further formulated:
 \begin{equation} \min_{W_{k_z}} \left[\frac{\displaystyle\int_{0}^{2h} (\overline{u'v'}(y) - \mathbb{E}[u'v'](y))^2Q(y)\,\mathrm{d}\kern0.05em y}{\displaystyle\int_{0}^{2h} (\overline{u'v'}(y))^2Q(y)\,\mathrm{d}\kern0.05em y}\right]^{0.5} + \gamma \left[\int_{0}^{\infty}\left( \frac{\mathrm{d}^2W_{k_z}(k_z)}{\mathrm{d}\ln k_z\,^2}\right)^2R_{uv}(k_z)\,\mathrm{d}k_z\right]^{0.5}, \end{equation}
subject to
 \begin{equation} W_{k_z}(k_z) \geq 0, \end{equation}
and the values of the weight at the smallest and largest considered spanwise lengths are also constrained to be zero with  $W_{k_z}(\lambda _z^+ = 10) = W_{k_z}(\lambda _z = 10h) = 0$. Here, the Reynolds shear stress $\overline {u'v'}(y)$ is given by (2.3) with the assumption that the mean velocity profile is empirically known (e.g. from (2.2b) and (2.3)), while the Reynolds shear stress generated by the fluctuation equation (2.1b) with the nonlinear term model (2.2a) is denoted by $\mathbb {E}[u'v'](y)$ with the definition of
 \begin{align} \mathbb{E}[u'v'](y) &= \frac{1}{4{\rm \pi}^2}\int_{0}^{2h}\int_{-\infty}^{\infty}\int_{-\infty}^{\infty}W_{k_z}(k_z)\nonumber\\ &\quad \times \sum_{r=u,v,w}W_{r,k_x}(k_x/k_z)\varPhi_{uv,r}^{N_{\mathit{POD}}}(y,y';k_x,k_z)\delta(y'-y) \,\mathrm{d}k_x\,\mathrm{d}k_z\,\mathrm{d}\kern0.05em y'. \end{align}
The optimisation problem in (2.12) is weighted in logarithmic coordinates, such that equal emphasis is placed on logarithmic distance from the wall. The constraint in (2.12b) ensures that the velocity covariance operators remain positive definite. Lastly, similar to the determination of the weighting along the streamwise wavenumber axis, a global regularisation term is considered to ensure that the weighting remains smooth, giving a physically reasonable set of velocity spectra. The smoothness regularisation is also weighted by  $R_{uv}(k_z)$, where
 \begin{align} R_{uv}(k_z) = \frac{1}{2{\rm \pi}}\int_{h}^{2h}\int_{-\infty}^{\infty}\sum_{r=u,v,w}W_{r,k_x}(k_x/k_z)\varPhi_{uv,r}^{N_{\mathit{POD}}}(y,y';k_x,k_z)\delta(y'-y) \,\mathrm{d}k_x\,\mathrm{d}\kern0.05em y'. \end{align}
The  $R_{uv}(k_z)$ tends to have large values at large spanwise wavelengths (or small $k_z$), and this is an outcome of the optimisation problem in (2.11). Since $\varPhi _{uv}^{\mathit {DNS}}$ contains large energy at large spanwise wavelengths, the regularisation term is more heavily weighted at such wavelengths. This weighting accounts for the rapid decay in the Reynolds shear stress spectra observed in the previous studies (see Skouloudis & Hwang Reference Skouloudis and Hwang2021, for a further discussion). It prevents erroneous behaviour in the velocity spectra at larger scales, encouraging a smoothly attached compact support at the large scales (figure 3a).
Outputs of quasi-linear approximation optimisation: (a) the normalised spanwise weighting of Fourier modes; (b) the wall-normal Reynolds shear stress profiles determined from the mean profile (dashed) and the fluctuating components (solid).

The optimisation problem in (2.12) is discretised and rearranged to a standard form of a second-order cone program and solved with the MOSEK solver. Discretisation along the spanwise wavenumber axis was carried out with logarithmic spacing to maintain  $\varDelta (\ln (k_z))\leq 0.05$, with integration performed with the trapezoidal rule. Table 1 shows the number of wavenumbers, collocation points and errors in the $Q$ and $L_{2}$ norms of the problem (2.12). Figure 3 shows the weight determined by solving (2.12) and the associated Reynolds shear stress profile compared with $-\overline {u'v'}$. An almost perfect match exists between the two Reynolds shear stress profiles, with the weighting that determines the Reynolds shear stress cospectra to provide a self-consistent approximation. With this procedure established, § 3 compares the results between the DQLA and a DNS (Lee & Moser Reference Lee and Moser2015). The predictive capabilities of the framework are also assessed by using the selected self-similar streamwise weightings as a universal weighting across a range of Reynolds numbers from $Re_\tau =10^3$ to $Re_\tau =10^5$ in § 4.
2.5. Summary
Thus far, a quasi-linear approximation has been formulated, augmented by DNS data at  $Re_\tau \simeq 5200$, combined with the attached eddy hypothesis: i.e. a data-driven quasi-linear approximation. Particular efforts are given such that the model retains a ‘predictive’ (or ‘extrapolative’) nature for some of the key turbulence statistics and spectra at any relevant Reynolds numbers (see also §§ 3 and 4) with ‘minimal inputs’: i.e. a mean velocity profile and a self-similar weight. However, in doing so, a few ad hoc assumptions have become unavoidable for the DQLA to retain the ‘predictive’ nature. In this respect, it would be worth documenting some of its expected characteristics originating from the construction of the model.
(i) Predictability: the main feature of the DQLA is that it is predictable (or extrapolatable) for turbulence statistics and spectra at different Reynolds numbers only with two inputs: a mean profile and a self-similar weight. Note that the mean profile is empirically well documented and commonly available (e.g. Cess Reference Cess1958), and the self-similar streamwise weight needs to be determined only once at a sufficiently high Reynolds number. By doing so, the DQLA can approach any Reynolds numbers without additional DNS data, as long as the flow remains fully turbulent. Importantly, as is seen in § 4, most of the known Reynolds-number-dependent scaling behaviours of turbulence statistics and spectra appear to be reproduced by the present DQLA. Therefore, it may be a valuable tool for studying turbulence statistics at extremely high Reynolds numbers, where an accurate data set is challenging to obtain, as demonstrated by Skouloudis & Hwang (Reference Skouloudis and Hwang2021) and § 4.
(ii) Performance: in the DQLA, the first input, a mean profile, is assumed to be known at a given Reynolds number and is determined by an eddy viscosity closure, giving the law of the wall. Given the robustness of the law of the wall, this input should result in reasonable approximations at extremely high Reynolds numbers. The second input used here is the streamwise weighting. The DQLA leverages the self-similar nature of the eddies in the attached eddy hypothesis, focusing on modelling the logarithmic layer. Given the significance of the logarithmic layer grows with $Re_\tau$, the modelling framework should perform best for the high Reynolds numbers, where the features not modelled by this self-similar weight bear a minor significance: e.g. near-wall motions.
(iii) Limitations: the extrapolation capability of the DQLA is, however, obtained at the cost of the accuracy of the resulting turbulence statistics, especially compared with the recent data-driven modelling efforts (Zare et al. Reference Zare, Jovanović and Georgiou2017; Abootorabi & Zare Reference Abootorabi and Zare2023; Holford et al. Reference Holford, Lee and Hwang2023). In particular, the physical processes and the related velocity spectra originating from the original nonlinear term in (2.1c) were ignored entirely. However, this is a fundamental limitation of any modelling efforts of turbulent fluctuations based on the linearised Navier–Stokes equations. Even if highly accurate turbulence statistics are obtained with a more accurate forcing incorporating the ignored part of the spectra, the model nonlinear term in (2.2a) or any of its variants can only be phenomenological, and they do not have the dynamics of the original nonlinear term in (2.1c). Specifically, the velocity components in the DQLA can only give feedback on each other through the one-way coupling of the lift-up effect, i.e. wall-normal velocity, driving the wall-normal vorticity. When considering the fully nonlinear system with time-dependent solutions, the velocity components can interact in other ways: for example, any spanwise shear in the mean velocity will couple the streamwise and spanwise fluctuations, with the latter driving the former in the sense of the lift-up effect. Therefore, the DQLA is a model primarily for turbulence statistics, leveraging the physical processes that the linearised Navier–Stokes equations can depict. In this respect, the models that describe a better turbulent ‘dynamics’ may be found from some of the recent studies employing more sophisticated state decompositions of the velocity field (e.g. Farrell & Ioannou Reference Farrell and Ioannou2012; Thomas et al. Reference Thomas, Farrell, Ioannou and Gayme2015; Farrell et al. Reference Farrell, Ioannou, Jiménez, Constantinou, Lozano-Durán and Nikolaidis2016; Hernández et al. Reference Hernández, Yang and Hwang2022a,Reference Hernández, Yang and Hwangb). Lastly, the present DQLA employs a steady-state stochastic dynamical systems framework, overlooking any time/frequency domain details. Although the presented framework can be readily extended to encompass the frequency domain using conventional resolvent analysis techniques (Skouloudis & Hwang Reference Skouloudis and Hwang2021), introducing this additional time–frequency dimension comes with the trade-off of increased computational overhead or imposing additional constraints and assumptions within the time–frequency domain.

3. Data-driven quasi-linear approximation at $Re_\tau = 5200$

3.1. One-point turbulence statistics
The DQLA is initially evaluated at  $Re_\tau = 5200$ for comparison with DNS data, as well as to compare the effects of including $k_x \neq 0$ Fourier modes in contrast to the MQLA, which only considers $k_x=0$ Fourier modes. The MQLA has been re-evaluated using the optimisation problem (2.12), with $\mathbb {E}[u'v']$ determined for streamwise uniform modes ( $k_x = 0$). Figure 4 plots the root mean square (r.m.s.) velocity fluctuations and Reynolds shear stress profiles for the DNS, DQLA and MQLA. The Reynolds shear stress profiles are almost identical in logarithmic coordinates (figure 4d; see also table 1), indicating that the optimisation problem (2.12) has been successfully implemented for the DQLA and MQLA. The models show the same qualitative features and compare well with DNS, although the streamwise velocity profile lacks a well-defined plateau. The DQLA r.m.s. velocity profiles show a greater degree of consistency with the DNS profiles than the MQLA (figure 4a–c) in terms of anisotropy. For instance, $({u'_{\mathit {rms,max}}}/{w'_{\mathit {rms,max}}},{u'_{\mathit {rms,max}}}/{v'_{\mathit {rms,max}}})$ is approximately (1.82, 2.67), (1.84, 3.48) and (5.78, 13.9) in the DNS, DQLA and MQLA, respectively, with a strong agreement between the DNS and DQLA ratios for the wall-parallel velocity components, due to the inclusion of $k_x \neq 0$ modes.
Comparison between DNS at  $Re_\tau = 5186$ (solid), DQLA (dashed) and MQLA (dotted) at $Re_\tau = 5200$. (a) Streamwise, (b) wall-normal and (c) spanwise root mean square velocity and (d) Reynolds shear stress profiles.

This mismatch in the MQLA is evidently due to considering only  $k_x=0$ Fourier modes. For the $k_x = 0$ case, the wall-normal derivative of wall-normal velocity fluctuations must be balanced solely by the spanwise variation in the spanwise velocity spectra, given the form of the continuity equation: i.e.
 \begin{equation} \frac{\partial \hat{v}'}{\partial y}+{\rm i}k_z \hat{w}'=0. \end{equation}
Hence, the spanwise velocity can be determined directly from the wall-normal velocity, itself determined solely from the Orr–Sommerfeld equation. Note that the Orr–Sommerfeld equation for the wall-normal velocity is not coupled with the streamwise and spanwise velocity. Similarly, when  $k_x=0$, the streamwise momentum equation is only passively coupled with the other two momentum equations through the wall-normal velocity: i.e.
 \begin{equation} \frac{\partial \hat{u}'}{\partial t}+\hat{v}'\frac{\mathrm{d}U}{\mathrm{d}\kern0.05em y}=\frac{\mathrm{d}\nu_T}{\mathrm{d}\kern0.05em y}\hat{u}' + \nu_T\varDelta_{y,z}\hat{u} + \hat{f}_u', \end{equation}
where  $\varDelta _{y,z} = \partial _{yy} -k_z^2$. This momentum equation is the only one that contains the mean shear, which is the source of energy production in the linearised fluctuation equations. When only $k_x=0$ Fourier mode is considered for velocity fluctuations, as in the MQLA, there is no way to transfer the energy produced by the mean shear at the streamwise velocity component to the other two components. This leads to an overestimation of the streamwise-to-spanwise/wall-normal r.m.s. velocity ratios in the MQLA. By allowing for $k_x \neq 0$ modes in the DQLA, the streamwise momentum equation is now connected to the equations for the other two components through continuity and pressure, significantly reducing the odd anisotropy in the r.m.s. velocity profiles observed in the MQLA. Although the ratio of the peaks of the wall-parallel components is quantitatively similar between the DNS and the DQLA, the ratios in the streamwise and wall-normal components are still overestimated in the DQLA. This is likely due to the simple model for the nonlinear term in (2.2a) and the consideration of only two leading POD modes for the construction of velocity spectra.
3.2. One-dimensional spectra
Figure 5 compares the spanwise one-dimensional velocity spectra from DNS with those of the DQLA and MQLA. Both the MQLA and DQLA compare similarly with the DNS spectra, with all components energetic on a single linear ridge (white dashed lines), as linear ridge in which the energy sharply drops off. In general, the MQLA and DQLA are more energetic closer to the wall. This is most noticeable in the spanwise velocity spectra (figure 5d–f), with similar trends in the other components. The DNS spanwise spectra are energetic along  $y \approx 0.14 \lambda _z$, as opposed to $y \approx 0.03\lambda _z$ in the MQLA. This is partially alleviated in the DQLA, which is energetic farther away from the wall ( $y \approx 0.05\lambda _z$), and, at the larger length scales ( $\lambda _z/h \approx 1$), the DQLA spectra extend much closer to the channel centreline, more in line with the DNS spectra. Moreover, the energy drops along $y \approx 0.2 \lambda _z$ in the DQLA, whereas in the MQLA, this occurs along $y \approx 0.1 \lambda _z$, which is below the energy-containing ridge present in the DNS. The qualitative peak locations are also well replicated by the MQLA and DQLA, with a bimodal structure in the streamwise and Reynolds shear stress spectra and a near-wall peak in the spanwise spectra. However, the relative strength of the outer peak in the MQLA and DQLA is consistent with the lack of a well-defined plateau in the streamwise r.m.s. velocity profile. In the DQLA and MQLA, the outer peak remains relatively strong for much of the linear ridge, penetrating the logarithmic region. This leaves only a small region of separation for $y/h \approx 10^{-2}$, compared with the DNS, which has a more diffuse outer peak and a better-defined plateau in the spectra for $y/h \approx 0.01\unicode{x2013}0.05$. The wall-normal velocity spectra of the MQLA and DQLA contain peaks at much larger length scales than the DNS, at around $y/h \approx 0.1$ and $y/h \approx 0.02$ for the DQLA and MQLA, respectively. Aside from the response along the linear energetic ridges, both wall-parallel velocity spectra exhibit wall-attached features, consistent with the attached eddy hypothesis. Both DQLA and MQLA wall-parallel velocity spectra for $\lambda _z/h \gtrsim 0.1$ penetrate the near-wall region to below $y^+\lesssim 100$, where the wall-normal velocity spectra are not energetic due to the boundary condition. However, these attached features in the DQLA and MQLA are relatively more energetic than their DNS counterparts.
Premultiplied spanwise wavenumber spectra from (a,d,g,j) DNS at  $Re_\tau = 5186$, (b,e,h,k) the DQLA and (c,f,i,l) the MQLA at $Re_\tau = 5200$: (a–c) streamwise velocity; (d–f) wall-normal velocity; (g–i) spanwise velocity; (j–l) Reynold shear stress. The contours are normalised by 0.1 times the maximum value.

Overall, the MQLA and DQLA are qualitatively similar when comparing the overall structure of the one-dimensional spanwise wavenumber velocity spectra. This reduces down to the limitations/expectations of the model. Given both the DQLA and MQLA use the same linearised system, they should accurately capture the linearised dynamics present in the real flow, i.e. production. The production in reality (as observed in DNS) consists largely of streaky elongated motions ( $k_x/k_z\lesssim 0.1$; see also Lee & Moser Reference Lee and Moser2019), and the $k_x = 0$ approximation employed in the MQLA is not completely unrealistic at least for the production spectra. This is presumably why improvements in the DQLA extension are relatively modest compared with the MQLA.
Figure 6 compares one-dimensional velocity and Reynolds shear stress spectra between DNS and DQLA, excluding the MQLA due to the  $k_x = 0$ simplification. In figure 6(a,b), the streamwise velocity spectra are compared. Good qualitative agreement is observed for long streaky features along the $y=0.01\lambda _z$ linear ridge. Although the spectra from the DNS suffer from the finite streamwise domain considered, the DQLA replicates large-scale attached structures, albeit with more significant energetic content. The DQLA shows a primary peak at slightly larger length scales ( $\lambda _x^+ \approx 2000$) compared with DNS ( $\lambda _x^+ \approx 1000$). A distinct separation between the outer and inner peaks is lacking in DQLA, resulting in a negligible plateau and the lack of a distinct outer peak in the streamwise wavenumber spectra. The most significant difference lies above the $y\approx 0.1 \lambda _x$ linear ridge, where the DQLA's energetic content drops to zero, while DNS exhibits another energetic linear ridge ( $y=0.35 \lambda _x$), strongly correlated with the wall-normal and spanwise velocity fields (see also figure 6c,e) (for a detailed discussion, see Hwang Reference Hwang2015).
Premultiplied streamwise wavenumber spectra from (a,c,e,g) DNS at  $Re_\tau = 5186$ and (b,d,f,h) the DQLA at $Re_\tau = 5200$: (a,b) streamwise velocity spectra; (c,d) wall-normal velocity spectra; (e,f) spanwise velocity spectra; (g,h) Reynolds shear stress spectra. The contours are normalised by 0.1 times the maximum value.

Figure 6(c,d) compares the wall-normal velocity spectra. There is a good qualitative agreement between the spectra with respect to the energy-containing motions, with a single linear ridge occurring in both at the same approximate length scale,  $y\sim 0.35\lambda _x$ and $y\sim 0.30\lambda _x$ in the DNS and DQLA, respectively. The main qualitative difference is the DNS velocity spectra are more energetic above the linear ridge than the DQLA. In the DNS spectra, the contour lines with low levels for $y> 0.8\lambda _x$ do not follow any linear scaling like $y \sim \lambda _x$, and this part has previously been associated with energy cascade developing a $k_x^{-5/3}$ spectrum (e.g. Agostini & Leschziner Reference Agostini and Leschziner2017). This is expected, given the determination of the self-similar streamwise weighting effectively removed features associated with the energy cascade, as well as the POD filtering process used. Similarly to the spanwise one-dimensional velocity spectra, the primary peak in the DQLA occurs at larger length scales than the DNS. The wall-normal velocity spectra in the DQLA also fall off at a slower rate below this primary peak when compared with the DNS. The low-level contours in the DQLA follow the linear ridge, extending to $y^+ \approx 1$ for $\lambda _x^+ \approx 2$, whereas the DNS extends to $y^+ \approx 1$ for $\lambda _x^+ \approx 100$. This discrepancy in peak location and the DQLA extending to the near-wall region for small streamwise length scales is presumably from the use of a self-similar weighting across all length scales and is likely contributing to the overprediction in the near-wall wall-normal velocity intensity profile and Reynolds shear stress profile. The spanwise velocity spectra are compared in figure 6(e,f), with the DQLA spectra exhibiting similar characteristics to the streamwise velocity spectra from the DQLA (figure 6b). The DQLA model predicts the location of the near-wall peak in the streamwise direction, albeit at a slightly larger length scale ( $\lambda _x^+ \sim 500$ in the DQLA compared with $\lambda _x^+ \sim 300$). Most notably, the main energetic regions in the spectra are much closer to the wall than in the DNS. The DNS velocity spectra indicate that the main energy-containing regions are along $y \sim 0.27 \lambda _x$. In the DQLA, this appears to be absent. The Reynolds shear stress spectra are compared in figure 6(g,h), with the main observations consistent with the comparisons of the streamwise and wall-normal velocity spectra. The Reynolds shear stress spectra generated by the DQLA are energetic closer to the wall when compared with the DNS and, similar to the wall-normal velocity spectra, extend along the linear ridge to smaller length scales when compared with DNS, leading to a slight overprediction in the Reynolds stress profile (figure 4d).
3.3. Two-dimensional spectra
The two-dimensional streamwise velocity spectra and Reynolds shear stress cospectra for a fixed wall-normal location in the near-wall and logarithmic layers are shown in figures 7 and 8, respectively. The attached footprints of the energy-containing eddies from the log and outer regions are most clearly observed for the near-wall location ( $y^+ \approx 15$ in figure 7). Comparing the DNS and DQLA spectra in the near-wall region (figure 7), there is a strong qualitative agreement, with the DQLA replicating all the features in the DNS. There is a near-wall primary peak in all the spectra, with the inactive (i.e. Reynold shear stress absent; Townsend Reference Townsend1976) footprints of the eddies present as an approximate linear ridge in the streamwise spectra. Consistent with the previous discussion, the attached footprint is more energetic than that present in the DNS, with the 0.30 contour describing the attached footprint in the DQLA and only the 0.10 contour in the DNS spectra. Since these features in the DQLA are modelled by the eddy viscosity diffusion operator (Hwang Reference Hwang2016; Symon et al. Reference Symon, Madhusudanan, Illingworth and Marusic2022), this indicates a more accurate form of eddy viscosity profile in the fluctuating velocity model is required to model these features more accurately. These two-dimensional spectra also show why the peak in the streamwise r.m.s. velocity is overpredicted in the DQLA (figure 4a) – the attached footprints of the energy-containing eddies from the log and outer regions contribute relatively more to this integrated quantity over the $k_x$– $k_z$ plane.
Premultiplied two-dimensional wavenumber spectra at  $y^+ \approx 15$ from (a,c) DNS at $Re_\tau = 5186$ and (b,d) the DQLA at $Re_\tau = 5200$: (a,b) streamwise velocity spectra; (c,d) Reynolds shear stress cospectra. The contours are normalised by 0.1 times the maximum value.

Premultiplied two-dimensional wavenumber spectra at  $y^+ \approx 400$ ( $y/h\approx 0.075$) from (a,c) DNS at $Re_\tau = 5186$ and (b,d) the DQLA at $Re_\tau = 5200$: (a,b) streamwise velocity spectra; (c,d) Reynolds shear stress cospectra. The contours are normalised by 0.1 times the maximum value.

The two-dimensional streamwise velocity spectra and Reynolds shear stress cospectra at a wall-normal location in the log layer are compared in figure 8. At this wall-normal location, the DNS and DQLA spectra are in good agreement for the main energy-containing features, with all of the spectra having a peak occurring at approximately the same length scales. Here, the effects of neglecting energy cascade features are most evident, with the black dashed lines on the DQLA spectra from the linear cutoff lines on the one-dimensional spectra (see figures 5 and 6). Outside these cutoff lines, there is negligible energetic content in the DQLA, whereas no simple linear cutoff was present in the DNS (figures 5 and 6). The DNS spectra are more energetic for the smaller length scales ( $\lambda _x \lesssim 3y$, $\lambda _z \lesssim 3y$), which are associated with energy cascade to small scales for dissipation. The contribution of these energy cascade features to the turbulence intensities is expected to be reasonably small.
4. Scaling behaviour up to $\boldsymbol {Re_\tau = 10^5}$

4.1. Spectra
The DQLA built from the DNS data at  $Re_\tau \approx 5200$ is now repeated for Reynolds numbers ranging from $Re_\tau = 10^3$ to $Re_\tau = 10^5$, given its modelling scope to extrapolate to other Reynolds numbers. Using the self-similar weight $W_{k_x}(k_x/k_z)$ constructed with the DNS data at $Re_\tau \approx 5200$, the weight is interpolated/extrapolated to the considered wavenumber domain at other Reynolds numbers, for which the self-consistent determination of the spanwise weight can be performed, solving (2.12). Firstly, the Reynolds scaling of the one-dimensional spectra is compared between the DNS and DQLA for $Re_\tau \approx 1000$, 2000, 5200. The qualitative scaling behaviour in the DQLA is found to be identical to the MQLA in the spanwise one-dimensional spectra and is not displayed here (see Hwang & Eckhardt Reference Hwang and Eckhardt2020; Skouloudis & Hwang Reference Skouloudis and Hwang2021, for a more complete discussion). There is a strong qualitative agreement between them, with the DQLA and DNS exhibiting inner-scaling features for $O(10) \lesssim \lambda _z^+ \lesssim O(10^3)$ and outer-scaling behaviour for $\lambda _z \approx O(h)$. The attached footprints in the wall-parallel velocity spectra from the DQLA importantly exhibit inner-scaling behaviour (Hwang Reference Hwang2016). Overall, the spanwise velocity spectra are consistent with the attached eddy hypothesis, with qualitative corrections due to the incorporation of viscous effects at a finite Reynolds number (Skouloudis & Hwang Reference Skouloudis and Hwang2021).
The outer- and inner-scaled streamwise one-dimensional spectra are shown in figures 9 and 10, respectively. Note that, due to the peak in the wall-normal velocity spectra occurring at logarithmic streamwise length scales in the DQLA, the contour levels for the inner-scaled streamwise one-dimensional spectra for the wall-normal velocity (figure 10d) are chosen to follow absolute values rather than normalised ones to exhibit the inner-scaling behaviour. Despite the differences between the spectra at a single Reynolds number, as described in § 3, the scaling behaviour in the DQLA compares very well with the DNS. All the spectra are energetic, spanning from  $\lambda _x^+ = O(10^2)$ up to $\lambda _x/h = O(10)$. Both the velocity and Reynolds shear stress spectra have an inner-scaling near-wall peak, with the outer part of the spectra scaling well in outer units. Like the spanwise one-dimensional spectra (Hwang & Eckhardt Reference Hwang and Eckhardt2020; Skouloudis & Hwang Reference Skouloudis and Hwang2021), the wall-parallel velocity spectra have an attached footprint, scaling well in outer and inner units.
Outer-scaled streamwise one-dimensional spectra from (a,c,e,g) DNS (Lee & Moser Reference Lee and Moser2015) and (b,d,f,h) the DQLA: (a,b) streamwise velocity; (c,d) wall-normal velocity; (e,f) spanwise velocity; (g,h) Reynolds shear stress. Here  $Re_\tau \simeq 5200$, 2000, 1000 for the shaded, dashed, and solid line contours, respectively. The contour levels are chosen to be 0.25, 0.50 and 0.75 times the maximum value for comparison, except in (d) where all contours levels are given by 0.25, 0.50 and 0.75 times the maximum value of the $Re_\tau = 5200$ spectra.

Inner-scaled streamwise one-dimensional spectra from (a,c,e,g) DNS (Lee & Moser Reference Lee and Moser2015) and (b,d,f,h) the DQLA: (a,b) streamwise velocity; (c,d) wall-normal velocity; (e,f) spanwise velocity; (g,h) Reynolds shear stress. Here  $Re_\tau \approx 5200$, 2000, 1000 for the shaded, dashed and solid line contours, respectively. The contour levels are chosen to be 0.25, 0.50 and 0.75 times the maximum value for comparison, except in (d) where all contours levels are given by 0.25, 0.50 and 0.75 times the maximum value of the $Re_\tau = 5200$ spectra.

4.2. Turbulence intensity
The predictive capabilities of the DQLA are now used up to  $Re_\tau = 10^5$, with the focus on the streamwise turbulence intensity profiles. The other components are consistent with the MQLA (Hwang & Eckhardt Reference Hwang and Eckhardt2020), albeit with a reduced level of anisotropy, as presented in § 3. The profiles are plotted in the inner- and outer-scaled coordinates in figure 11. The scaling behaviour of the streamwise intensity profiles in DNS and DQLA share the same key features: a near-wall peak at $y^+\approx 15$ at relatively low Reynolds numbers ( $Re_\tau \lesssim 5000$) and an approximate logarithmic decay when scaled in outer units. This behaviour is more evident in the DQLA for $Re_\tau \gtrsim 5200$. For these larger Reynolds numbers, the streamwise intensity profile is consistent with Hwang et al. (Reference Hwang, Hutchins and Marusic2022), in which the spectrum-based attached eddy model of Perry et al. (Reference Perry, Henbest and Chong1986) was extended for finite Reynolds numbers with an experimental data of Samie et al. (Reference Samie, Marusic, Hutchins, Fu, Fan, Hultmark and Smits2018). In the upper logarithmic layer (or inertial sublayer) from $y^+ = 3.6Re_\tau ^{0.5}$ up to $y/h = 0.2$, this model yields the following form of streamwise turbulence intensity
 \begin{equation} \frac{\overline{u'u'}}{u_\tau^2} =-A(Re_\tau)\ln(y/h) + B(Re_\tau), \end{equation}
where
 \begin{equation} A(Re_\tau) = A_0 + A_1(Re_\tau). \end{equation}
Here,  $A(Re_\tau )$ and $B(Re_\tau )$ are supposed to be constants in the limit of infinite $Re_\tau$, and they vary slowly with $Re_\tau$ at finite $Re_\tau$ (Hwang et al. Reference Hwang, Hutchins and Marusic2022).
Streamwise turbulence intensity profiles from (a,c) DNS (Lee & Moser Reference Lee and Moser2015) and (b,d) the DQLA in (a,b) outer-scaled coordinates and (c,d) inner-scaled coordinates. Here,  $Re_\tau = 550$, 1000, 1994, 5185 for DNS and $Re_\tau = 500$, 1000, 2000, 5200, 10 000, 20 000, 50 000, 100 000 for the DQLA.

An essential prerequisite of the model in Hwang et al. (Reference Hwang, Hutchins and Marusic2022) is the existence of  $y$- and $h$-scaling regions of one-dimensional spectra in the upper logarithmic layer. Figure 12(a,b) shows that the DQLA successfully reproduces such spectra in the upper logarithmic layer (compare with figure 3(a,b) in Hwang et al. Reference Hwang, Hutchins and Marusic2022) like the experimental data of Samie et al. (Reference Samie, Marusic, Hutchins, Fu, Fan, Hultmark and Smits2018). Following Hwang et al. (Reference Hwang, Hutchins and Marusic2022), $A(Re_\tau )$ and $B(Re_\tau )$ in (4.1a) are subsequently approximated from the spectra at all Reynolds numbers
 $$\begin{gather} A(Re_\tau) = \left[\ln\left(\frac{a_{x,u}}{y}\right) - \ln\left(\frac{a_{x,l}}{h}\right) \right]^{-1}\int_{\ln(a_{x,l}/h)}^{\ln(a_{x,u}/y)} \frac{k_x\varPhi_{uu}(k_x,y/h)}{u_\tau^2}\,\mathrm{d}\ln(k_x), \end{gather}$$
 $$\begin{gather}B(Re_\tau) = A(Re_\tau)\ln\left(\frac{a_{x,u}}{a_{x,l}}\right). \end{gather}$$
Here,  $a_{x,u}$ and $a_{x,l}$ are dimensionless constants associated with the upper and lower limits of the integration of the streamwise spectra. However, they have to be chosen through inspection of figure 12(a,b), they must be ‘constants’ for all Reynolds numbers. The approximation (4.2) reduces down to using the mean-value theorem to approximate the spectra across these upper and lower limits, with the mean value, or in this case, the Townsend–Perry constant $A(Re_\tau )$, consisting of a universal component $A_0$ and a viscous correction $A_1(Re_\tau )$. Hence, the upper and lower limits lie at values where the spectra scale in outer ( $\lambda _x/h$) and logarithmic ( $\lambda _x/y$) coordinates, respectively. After trial and improvement of the fitting procedure, the upper and lower limits are set with $a_{x,u} = {\rm \pi}$ and $a_{x,l} = 4{\rm \pi} /3$, with the comparison of the approximation and streamwise turbulence intensity profile shown in figure 12(c).
Premultiplied streamwise one-dimensional spectra at various wall-normal locations for  $Re_\tau = 20\,000$ in (a) outer-scaling coordinates $\lambda _x/h$ and (b) logarithmic coordinates $\lambda _x/y$ and (c) the streamwise turbulence intensity profile (solid) with the attached eddy hypothesis approximation following Hwang et al. (Reference Hwang, Hutchins and Marusic2022).

Table 2 reports the values of  $A(Re_\tau )$ and $B(Re_\tau )$ obtained. Consistent with the growing trend of $A(Re_\tau )$ and $B(Re_\tau )$ observed in Hwang et al. (Reference Hwang, Hutchins and Marusic2022) with the experimental data from Samie et al. (Reference Samie, Marusic, Hutchins, Fu, Fan, Hultmark and Smits2018), their values obtained from the DQLA data also slowly grow. Importantly, their growth rate tends to be smaller on increasing $Re_\tau$ from table 2, indicating that they would reach constant values. This trend is consistent with the theoretical model of Hwang et al. (Reference Hwang, Hutchins and Marusic2022), which becomes identical to the classical attached eddy model in the limit of $Re_\tau \rightarrow \infty$ (Townsend Reference Townsend1976; Perry & Chong Reference Perry and Chong1982; Perry et al. Reference Perry, Henbest and Chong1986).
The Reynolds-number-dependent model constants for the streamwise turbulence intensity determined following Hwang et al. (Reference Hwang, Hutchins and Marusic2022).

Apart from the agreement between the near-wall peak and logarithmic decay, the DQLA still does not have a clear plateau behaviour for  $y^+ \approx 200$, although one starts to emerge for $Re_\tau \gtrsim 20\,000$. This is likely due to the overly energetic response of the large-scale motions present in the current model, as discussed in § 3. In the DQLA, the primary near-wall peaks are much less distinct than those in the DNS, with the outer-scaling parts of the spectra and their attached features remaining relatively more energetic in the spectra. One possible improvement on the current DQLA framework to account for this plateau would be an outer and inner correction to the streamwise wavenumber weighting. However, this would detract from the predictability of the current framework, with the inner and outer scaling of the corrections having to be prescribed as additional inputs. Another reason for the lack of the plateau is likely due to the particular use of the eddy viscosity profile, with the large-scale response being generally overly energetic. Given how the viscosity of the eddy is used in modelling the attached large-scale features (Hwang Reference Hwang2016; Symon et al. Reference Symon, Madhusudanan, Illingworth and Marusic2022; Holford et al. Reference Holford, Lee and Hwang2023), the eddy viscosity profile could perhaps be tuned to replicate these features more carefully, but this is beyond the scope of this study.
Finally, figure 13 shows the scaling behaviour of the near-wall peak and two other inner-scaling locations,  $y^+= 50$, 100. Like the MQLA (Hwang & Eckhardt Reference Hwang and Eckhardt2020; Skouloudis & Hwang Reference Skouloudis and Hwang2021) in figure 13(a), the DQLA shows the deviation of near-wall intensities from the classical logarithmic scaling predicted by an extension of the original attached eddy model (Marusic & Kunkel Reference Marusic and Kunkel2003): i.e. $\overline {u'u'}/u_\tau ^2 \sim \ln Re_\tau$. Instead, consistent with the recent findings from a variant of the MQLA (Skouloudis & Hwang Reference Skouloudis and Hwang2021), the near-wall streamwise intensities are inversely proportional to the inner-scaled centreline velocity, with the coloured lines given by fits of
 \begin{equation} \frac{\overline{u'u'}}{u_\tau^2} = C - D/U_{cl}^+, \end{equation}
favouring the prediction made by Monkewitz & Nagib (Reference Monkewitz and Nagib2015) for a turbulent boundary layer using an asymptotic expansion of near-wall turbulence statistics. Notably, the MQLA (Skouloudis & Hwang Reference Skouloudis and Hwang2021) and DQLA provided the same scaling associated with  $1/U_{cl}^+$. However, their construction is quite different, especially in that of the full velocity spectra. This suggests that the scaling behaviour of (4.3) is inherently from the linearised Navier–Stokes equations in (2.1b) with the model nonlinear term (2.2a) rather than a peculiar feature emerging from the construction of the quasi-linear approximation. It also strongly indicates that there must exist a mathematical structure underpinning (4.3). Considering that the DQLA effectively reproduces the scaling behaviour of the streamwise velocity in the upper logarithmic layer, this result warrants thoughtful consideration and should not be underestimated. Importantly, there is growing evidence that the scaling of $\overline {u'u'}/u_\tau ^2 \sim \ln Re_\tau$ from the classical attached eddy model may not be valid, as the original attached eddy model is built by ignoring the viscous effect in the near-wall region. In this respect, it is worth mentioning an alternative proposed by the recent work by Chen & Sreenivasan (Reference Chen and Sreenivasan2021), where a scaling proportional to $Re_\tau ^{-1/4}$ was proposed instead of $1/U_{cl}^+$ scaling. Such scaling may fit well with the near-wall streamwise turbulence intensity of DQLA. However, it was recently shown that, in practice, only a negligibly small difference has been found between the $1/U_{cl}^+$ and $Re_\tau ^{-1/4}$ scalings upon increasing the Reynolds number (Nagib, Monkewitz & Sreenivasan Reference Nagib, Monkewitz and Sreenivasan2022). To the best of the authors’ knowledge, the correct scaling behaviour of the near-wall streamwise turbulence intensity is currently an issue of debate. One of the authors of the present study (Hwang Reference Hwang2022) makes an ongoing effort to address this issue thoroughly in the future.
The Reynolds-scaling behaviour of the streamwise turbulence intensity based on (a)  $\log Re_\tau$ and (b) inner-scaled centreline velocity $U_{cl}^+$. The wall-normal locations correspond to the peak (solid); $y^+ = 50$ (dashed); $y^+ = 100$ (dash-dotted). The coloured lines correspond to (a) $\overline {u'u'}/u_\tau ^2 = a_1 + b_1\ln (Re_\tau )$ fitted in the range $Re_\tau = 1000\unicode{x2013}2000$ and (b) $\overline {u'u'}/u_\tau ^2 = a_2 + b_2/U_{cl}^+$ fitted in the range $Re_\tau = 20\,000\unicode{x2013}50\,000$.

5. Summary
The MQLA (Hwang & Eckhardt Reference Hwang and Eckhardt2020) has been extended in the present study by including streamwise variations of turbulence spectra. To extend the MQLA while still maintaining its predictive nature, self-similarity was used to determine the statistical structure of the forcing. By using the universal nature and growing significance of the logarithmic layer on increasing Reynolds number, a set of self-similar weights was determined by matching the two-dimensional spectra with respect to the streamwise wavenumber and wall-normal location at a single spanwise wavenumber of the linearised Navier–Stokes equations to those of a DNS performed at  $Re_\tau \approx 5200$. By reconstructing the velocity spectra from the leading POD modes of the linearised Navier–Stokes equations, the two-dimensional spectra generated reasonably well replicated the DNS spectra. In doing so, the energy cascade-associated features in the spectra were neglected, in line with the attached eddy hypothesis, for the model to be extrapolatable to other Reynolds numbers. From this self-similar weighting with respect to the streamwise wavenumber, the self-consistent determination of the Reynolds shear stress was implemented following Hwang & Eckhardt (Reference Hwang and Eckhardt2020), completing the DQLA framework.
The DQLA allows complete determination of the two-dimensional velocity spectra and all subsequent statistics, with results compared between the MQLA, DQLA, and DNS. It was shown that the DQLA offers significant quantitative improvements compared with the MQLA with respect to the wall-normal and spanwise r.m.s. velocity profiles. In particular, it significantly reduces the anisotropy in the turbulence intensities while providing the streamwise wavenumber spectra, the scaling of which is consistent with that of DNS. While the DQLA did improve turbulence statistics and spectra compared with the MQLA, there were still some qualitative differences between the DQLA and DNS results. This was demonstrated most clearly in the streamwise one-dimensional spectra, the intensity of which was much stronger than that of the DNS in the region close to the wall while lacking the energetic content at length scales associated with the nonlinear processes modelled in this study (e.g., the streak instability (or transient growth) and energy cascade Schoppa & Hussain Reference Schoppa and Hussain2002; de Giovanetti et al. Reference de Giovanetti, Sung and Hwang2017; Doohan et al. Reference Doohan, Willis and Hwang2021; Lozano-Durán et al. Reference Lozano-Durán, Constantinou, Nikolaidis and Karp2021). Aside from the qualitative differences in the spectra, the DQLA framework was shown to retain the predictive capabilities of the MQLA with the scaling behaviour of turbulence intensities and spectra in qualitative agreement with the DNS. In particular, it offers a scaling behaviour consistent with the recent theoretical model of Hwang et al. (Reference Hwang, Hutchins and Marusic2022), where the spectrum-based attached eddy model in Perry et al. (Reference Perry, Henbest and Chong1986) was extended for finite Reynolds numbers. Also, like the MQLA, the near-wall peak turbulence intensity was inversely proportional to the inner-scaled centreline mean velocity, deviating from the classical prediction based on the attached eddy model.
Acknowledgements
J.H. is supported by Doctoral Training Partnership (DTP) scholarship from the Engineering Physical Science Research Council (EPSRC) in the UK. Y.H. gratefully acknowledges the support of the Leverhulme trust (RPG-123-2019) and EPSRC (EP/T009365/1).
Declaration of interests
The authors report no conflict of interest.
Appendix A. Sensitivity of optimisation procedure
To select an appropriate value for  $\gamma$, figure 14 shows a trade-off curve between the regularisation parameter $\gamma$ and the errors with respect to the $Q-$norm for each of the spectra. As the errors in all of the components are approximately monotonic, the weights were determined by setting $\gamma = 0.5$ and using trial and inspection in varying $\gamma$ until the streamwise weights and the velocity spectra are sufficiently smooth and in good qualitative agreement with the DNS velocity spectra.
The trade-off curve between the componentwise errors in (2.11a), where  $\epsilon _r = {\Vert \varPhi _{r}^{\mathit {DNS}}-\varPhi _{r}\Vert _Q}/{\Vert \varPhi _{r}^{\mathit {DNS}}\Vert _Q}$ for $k_zh = 14$ for the streamwise (solid), wall-normal (chain), spanwise velocity spectra (dotted) and Reynolds shear stress cospectra (dashed).

To check the sensitivity of the DQLA to the choice of self-similar streamwise weighting  $W_{k_x}(k_x/k_z)$, the DQLA was performed at $Re_\tau \approx 5200$ with the different weights from figure 1. The turbulence intensity profiles are shown in the figure 15(a–c). The streamwise turbulence intensity (figure 15a) is relatively insensitive to the choice of the streamwise self-similar weight, while both the wall-normal and spanwise intensities (figure 15b,c) tend to decrease with $k_zh$. The use of the $k_zh = 30$ weight is justified considering here that the wall-normal and spanwise turbulence intensity profiles are much less sensitive for the $k_zh = 14\unicode{x2013}50$ weight. Since these wavenumbers are mainly associated with the logarithmic layer, where self-similarity is expected to hold, the different weights from solving (2.11a) lead to similar results in a DQLA. The sensitivity to the choice of self-similar streamwise weighting $W_{k_x}(k_x/k_z)$ is also examined in figure 15(d), where the total errors between the normalised two-dimensional spectra for fixed spanwise length scales are examined using the weights for different $k_zh$ in figure 1, i.e.
 \begin{equation} \sum_s\left \Vert \frac{\boldsymbol{\varPhi}^{\mathit{DNS}}_{s}}{\Vert \boldsymbol{\varPhi}^{\mathit{DNS}}_{s} \Vert_Q} - \frac{\boldsymbol{\varPhi}^{\mathit{DQLA}}_{s}(W_{r,k_x})}{\Vert \boldsymbol{\varPhi}^{\mathit{DQLA}}_{s} \Vert_Q} \right \Vert_Q, \end{equation}
for  $s = \{uu,vv,ww,uv\}$. Figure 15(d) shows that all weights produce a qualitatively similar trend. This justifies the use of the weights as self-similar weights at the other $k_zh$. The normalised spectra produce approximately the same total errors, giving the same approximate statistical structure of the resulting spectra.
The sensitivity of the DQLA to the choice of streamwise weighting for (a) streamwise, (b) wall-normal, (c) spanwise turbulence intensities; and (d) total error in the two-dimensional normalised spectra as defined in (2.11a) with the streamwise weighting applied at different  $k_zh$. Here, the colour corresponds to the selected $k_zh$ result used for the self-similar streamwise weighting.


 Open access