

Introduction
The decade after the global financial crisis (GFC) was characterised by relatively low real wage growth for most developed economies, with average annual real wage growth between 2011 to 2019, less than half the rate experienced in the period 2000 to 2008 in the majority of OECD countries (OECD 2024). The more recent surge in inflation since 2020 has resulted in real wage decline for many. Particular attention has focussed on frontline workers over the COVID-19 period such as nurses and teachers, with widespread industrial action in many countries focussed on achieving significant pay increases in these industries (International Council of Nurses 2022), with over 37% of total labour protests and strikes in the US in 2023 occurring in the Education and Health industries alone (ILR School 2024). In turn, these events have placed the spotlight on the wage setting practices for public sector workers.
Whereas many private sector workers’ wage growth is dependent on the profitability and fortunes of the business or industry they work in, public sector workers’ wages are largely set by the respective government of the day and their political motives. Historically, governments have often pursued public sector pay restraint and the development of indicators that serve as targets for public sector wage growth (Marsden Reference Marsden1997). Extreme forms of public sector pay restraint including wage freezes were relatively common in developed economies following the GFC as governments shifted their focus to austerity measures (Michael and Christofides Reference Michael and Christofides2020). Similarly, in Australia it has become increasingly common for Australian workers covered by the Commonwealth (national), or various state and territory public sectors, to be subject to “wage cap” rules under the guise of austerity. While some wage caps were in place for a short period of time, others became entrenched in public sector wage determination for over a decade. For example, the New South Wales (NSW) Public Sector Wages Policy was based on a principle of “fiscal discipline” (Carabetta Reference Carabetta2012), limiting wage increases for all NSW public sector workers to a maximum of 2.5% per annum from 2011 to 2022.
While the wage setting mechanisms of private and public sector employers may appear unconnected, some have conjectured that the public sector wage cap rules may have established new wage “norms” in the private sector (Peetz Reference Peetz2022; Buchanan Reference Buchanan2024), thus contributing to the widespread real wage stagnation experienced in Australia in the 2010s (Henderson Reference Henderson, Steward, Stanford and Hardy2018). Colley (Reference Colley2012) and Colley et al (Reference Colley, Woods and Head2022) suggested that one of the purposes of wage caps was to set a model for wage restraint in the labour market in general. Therefore, if successful, what started as a relatively confined public sector wage management policy may have had significant macroeconomic implications for the wider labour market and economy. However, no formal statistical analysis has been undertaken to test this hypothesis. More recent attention has focussed on the upsurge in private wage growth associated with COVID-19, labour shortages and associated inflationary pressures (Jorda and Nechio Reference Jorda and Nechio2023; Dvorkin and Marks Reference Dvorkin and Marks2024). If the purpose of wage caps was to signal wage restraint for the private sector, the contemporary question now becomes whether such dynamics between private and public sector wages have changed, particularly for those states and territories tied to public sector wage caps.
Therefore, the purpose of this research is to investigate the nature of the relationship between private and public wage growth in Australia, identifying links, spillovers and causality. In doing so we investigate two main research questions. First, have public sector wage caps historically influenced private sector wage growth outcomes? Second, has the dynamic relationship been private and public wage growth been affected by economic events associated with COVID-19?
Using wage leadership theory (Aukrust Reference Aukrust, Krause and Salant1977; Smith Reference Smith1996) as a guiding principle, Vector Error Correction Models (VECM) are utilised in this study to quantify the nature of the relationship between wage growth in private and public sectors. VECMs allow us to test two main hypotheses regarding the relationship between private and public wage growth. The first is, what is the nature of long run wage leadership or conversely, which sector reacts or adapts to the other? In the second, we test whether the wage dynamics between private and public sectors are stable over time, identifying and applying structural breaks to our model specification.
The research exploits quarterly Australian Bureau of Statistics (ABS) Wage Price Index (WPI) data between 1998 and 2024 at the aggregate Australian level, as well as by all six states and two territories. The availability of data capturing different geographical wage setting jurisdictions within one country, and testing the robustness of such analyses to significant economic events or disruptions, such as that experienced in recent COVID-19 time period, allows unique insights not available in past international literature (Lamo et al Reference Lamo, Pérez and Schuknecht2012; Camarero et al Reference Camarero, D’Adamo and Tamarit2014; D’Adamo Reference D’Adamo2014; Dolton et al 2019; Gjelsvik et al Reference Gjelsvik, Nymoen and Sparrman2020).
The rest of this article is organised as follows. We first explore the research literature on public and private wage estimation, followed by a presentation of the background to public sector employment and wage setting practices in Australia. The data and methodology is detailed before the presentation of estimation results. We finish with a discussion of findings and conclusions.
Literature review
Understanding and analysing the determinants of wages has historically been one of the main focal points of labour economics and industrial relations (Mincer Reference Mincer1974; Willis Reference Willis, Ashenfelter and Layard1986; Brown and Nolan Reference Brown and Nolan1988). Although public sector wage setting practices have been studied in their own right (Fogel and Lewin Reference Fogel and Lewin1974, Kraay and Van Rijckeghem Reference Kraay and Van Rijckeghem1995; Di Carlo et al Reference Di Carlo, Ibsen and Molina2024), much of the prevailing empirical analysis to this day has focused on the estimation of public-private sector wage gaps using cross sectional or longitudinal microeconomic data. That is, the financial penalty or premium to wages for working in the public sector compared to the private sector, after controlling for an individual’s characteristics such as age, gender, education and occupation (Katz and Krueger Reference Katz and Krueger1991, Gregory and Borland Reference Gregory and Borland1999; Hospido and Moral-Benito Reference Hospido and Moral-Benito2016; Jones Reference Jones2024; Phan and O’Brien Reference Phan and O’Brien2025, to name just a few). Prevailing estimation methods have included augmented Mincer (Reference Mincer1974) wage equations to more sophisticated regression based models (Depalo et al Reference Depalo, Giordano and Papapetrou2015; Wang and Zhou Reference Wang and Zhou2019), as well as decompositions and matching techniques (Borland et al Reference Borland, Hirschberg and Lye1998; Blackaby et al Reference Blackaby, Murphy, O’Leary and Staneva2018; Bonaccolto-Töpfer et al Reference Bonaccolto-Töpfer, Castagnetti and Prümer2022).
A new strand of empirical literature analysing the relationship between public and private sector wages emerged in the last decade, focusing on the interaction between wages in both sectors using macroeconomic level time series data. At a basic level, Alfonso and Gomes (Reference Afonso and Gomes2014), Marzinotto and Turrini (Reference Marzinotto and Turrini2017), and Black and Dowd (Reference Black and Dowd2024) included public (private) wages as an explanatory variable in a model predicting private (public) sector wages. However, more advanced research has focused on the co-movements in wages between private and public sectors using cointegration and statistical causality analyses (Lamo et al Reference Lamo, Pérez and Schuknecht2012; Camarero et al Reference Camarero, D’Adamo and Tamarit2014; D’Adamo Reference D’Adamo2014; Dolton et al Reference Dolton, Hantzsche and Kara2020; Gjelsvik et al Reference Gjelsvik, Nymoen and Sparrman2020). Such analyses are loosely based on the theoretical concept of wage leadership (Aukrust Reference Aukrust, Krause and Salant1977). The Balassa–Samuelson or Scandinavian model of wage leadership postulates that the private export or import competing sector should be the wage leader within a country’s labour market. That is, the private sector sets wages based upon external or market factors, with the public sector wages adjusting accordingly. However, Henderson (Reference Henderson, Steward, Stanford and Hardy2018) argues that public sector wage growth may affect the private sector via two transmission mechanisms. The first is a demonstration effect, whereby wage signals from the public sector represent a highly visible benchmark for the private sector. The second mechanism is a macroeconomic effect, whereby public sector wage increases act as a stimulus to private sector economic activity and wages, or conversely public sector wage suppression acts as a retardant to private sector wage growth.
The Vector Error Correction Model (VECM) has been the preferred estimation model for wage leadership, providing an appropriate method to test multiple hypotheses including long run wage leadership and short run Granger causality (D’Adamo Reference D’Adamo2014). More recent VECM models have incorporated additional exogenous variables, simultaneous equation modelling, or panel cointegration analysis (Vasilev and Manolova Reference Vasilev and Manolova2019; Camarero et al Reference Camarero, D’Adamo and Tamarit2021). The most recent findings by Dolton et al (Reference Dolton, Hantzsche and Kara2020) using UK data, and Gjelsvik et al (Reference Gjelsvik, Nymoen and Sparrman2020) using Norway data, both indicated that the private sector was the wage leader. However, in general there has been no consensus in the empirical literature covering multi-country studies whether the private or public sector is the wage leader.
In the context of Australia, analysis of private and public sector wage linkages is relatively scarce, consisting mostly of theoretical or media commentary of public and private sector wage linkages with little to no supporting statistical analyses. Colley (Reference Colley2012) stated that “modelling restraint for the broader labour market” was a key rationale for wage caps. Supporting this claim, Henderson (Reference Henderson, Steward, Stanford and Hardy2018) asserted that public wage cap policies caused private sector wages to stagnate, although this analysis was largely based on the visual observation of trend breaks in wage time series. Similarly, Peetz (Reference Peetz2022) claimed that public sector wage caps established low wage growth norms across the labour market in general, but the empirical analysis was restricted to the estimation of correlation coefficients only, rather than any methods to capture statistical causality. An exception to the rule is the recent research of O’Brien et al (Reference O’Brien, Gollan and Gerth2024), who investigated public and private sector wage causality in Education and Health industries in two states of Australia (NSW and Victoria), establishing the public sector as the long run wage leader in both industries.
The present research will explore the nature of spillovers and causality between public and private sectors from a number of unique spatial and time aspects not available in the previous research literature. First, previous studies have been conducted at country level only. The use of Australian WPI data allows an analysis of causality at the national level, as well as for all eight individual states and territories. With state and territory governments responsible for the setting of wages for their public sector workers, as well as accounting for the majority of public sector employment in Australia, analysis at this geographical level will allow an additional layer of insights at the relevant level of policy setting not available from aggregate country level analysis. This aspect is particularly important as different state governments have imposed alternative wage policies over time. In particular, this research will address whether public policy wage restraint policies implemented by state and territory governments, such as wage caps, have influenced private sector wages, thus having important macroeconomic policy implications. Second, this study will assess the sensitivity of wage leadership findings to alternative time periods, particularly economic crises. Following the GFC, wage caps were increasingly implemented across states and territories in Australia. However, the economic crisis associated with COVID-19 was quite different in nature, with widespread labour shortages and inflation causing a surge in private sector wages. It is likely that public sector wages in geographical areas subject to wage caps would not have been able to react to such wage pressures in a similar fashion. Therefore, this research will allow for structural breaks in the relationship between private and public sector wages coinciding with the GFC and COVID-19 to determine the robustness of wage leadership to economic crises.
Public sector employment and wage setting practices in Australia
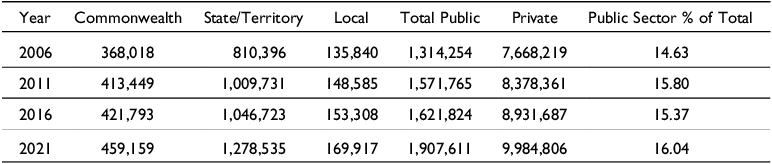
Despite claims of a recent upsurge in public sector employment (ABS 2023a), census data in Table 1 show that public sector employment has been relatively stable over the last 15 years, accounting for approximately 15% of employment in Australia. There was marginal growth in public sector employment from 2016 to 2021, although, it is unclear how much of this represented genuine employment growth, with research elsewhere showing that relative contribution of public sector employment to the labour market grew only temporarily over the COVID-19 period when private sector employment declined temporarily (O’Brien Reference O’Brien2023).
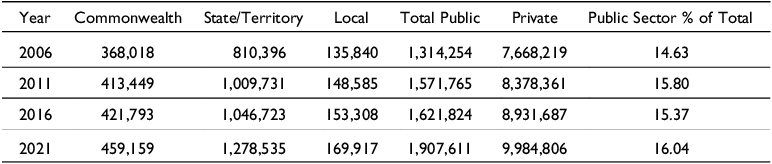
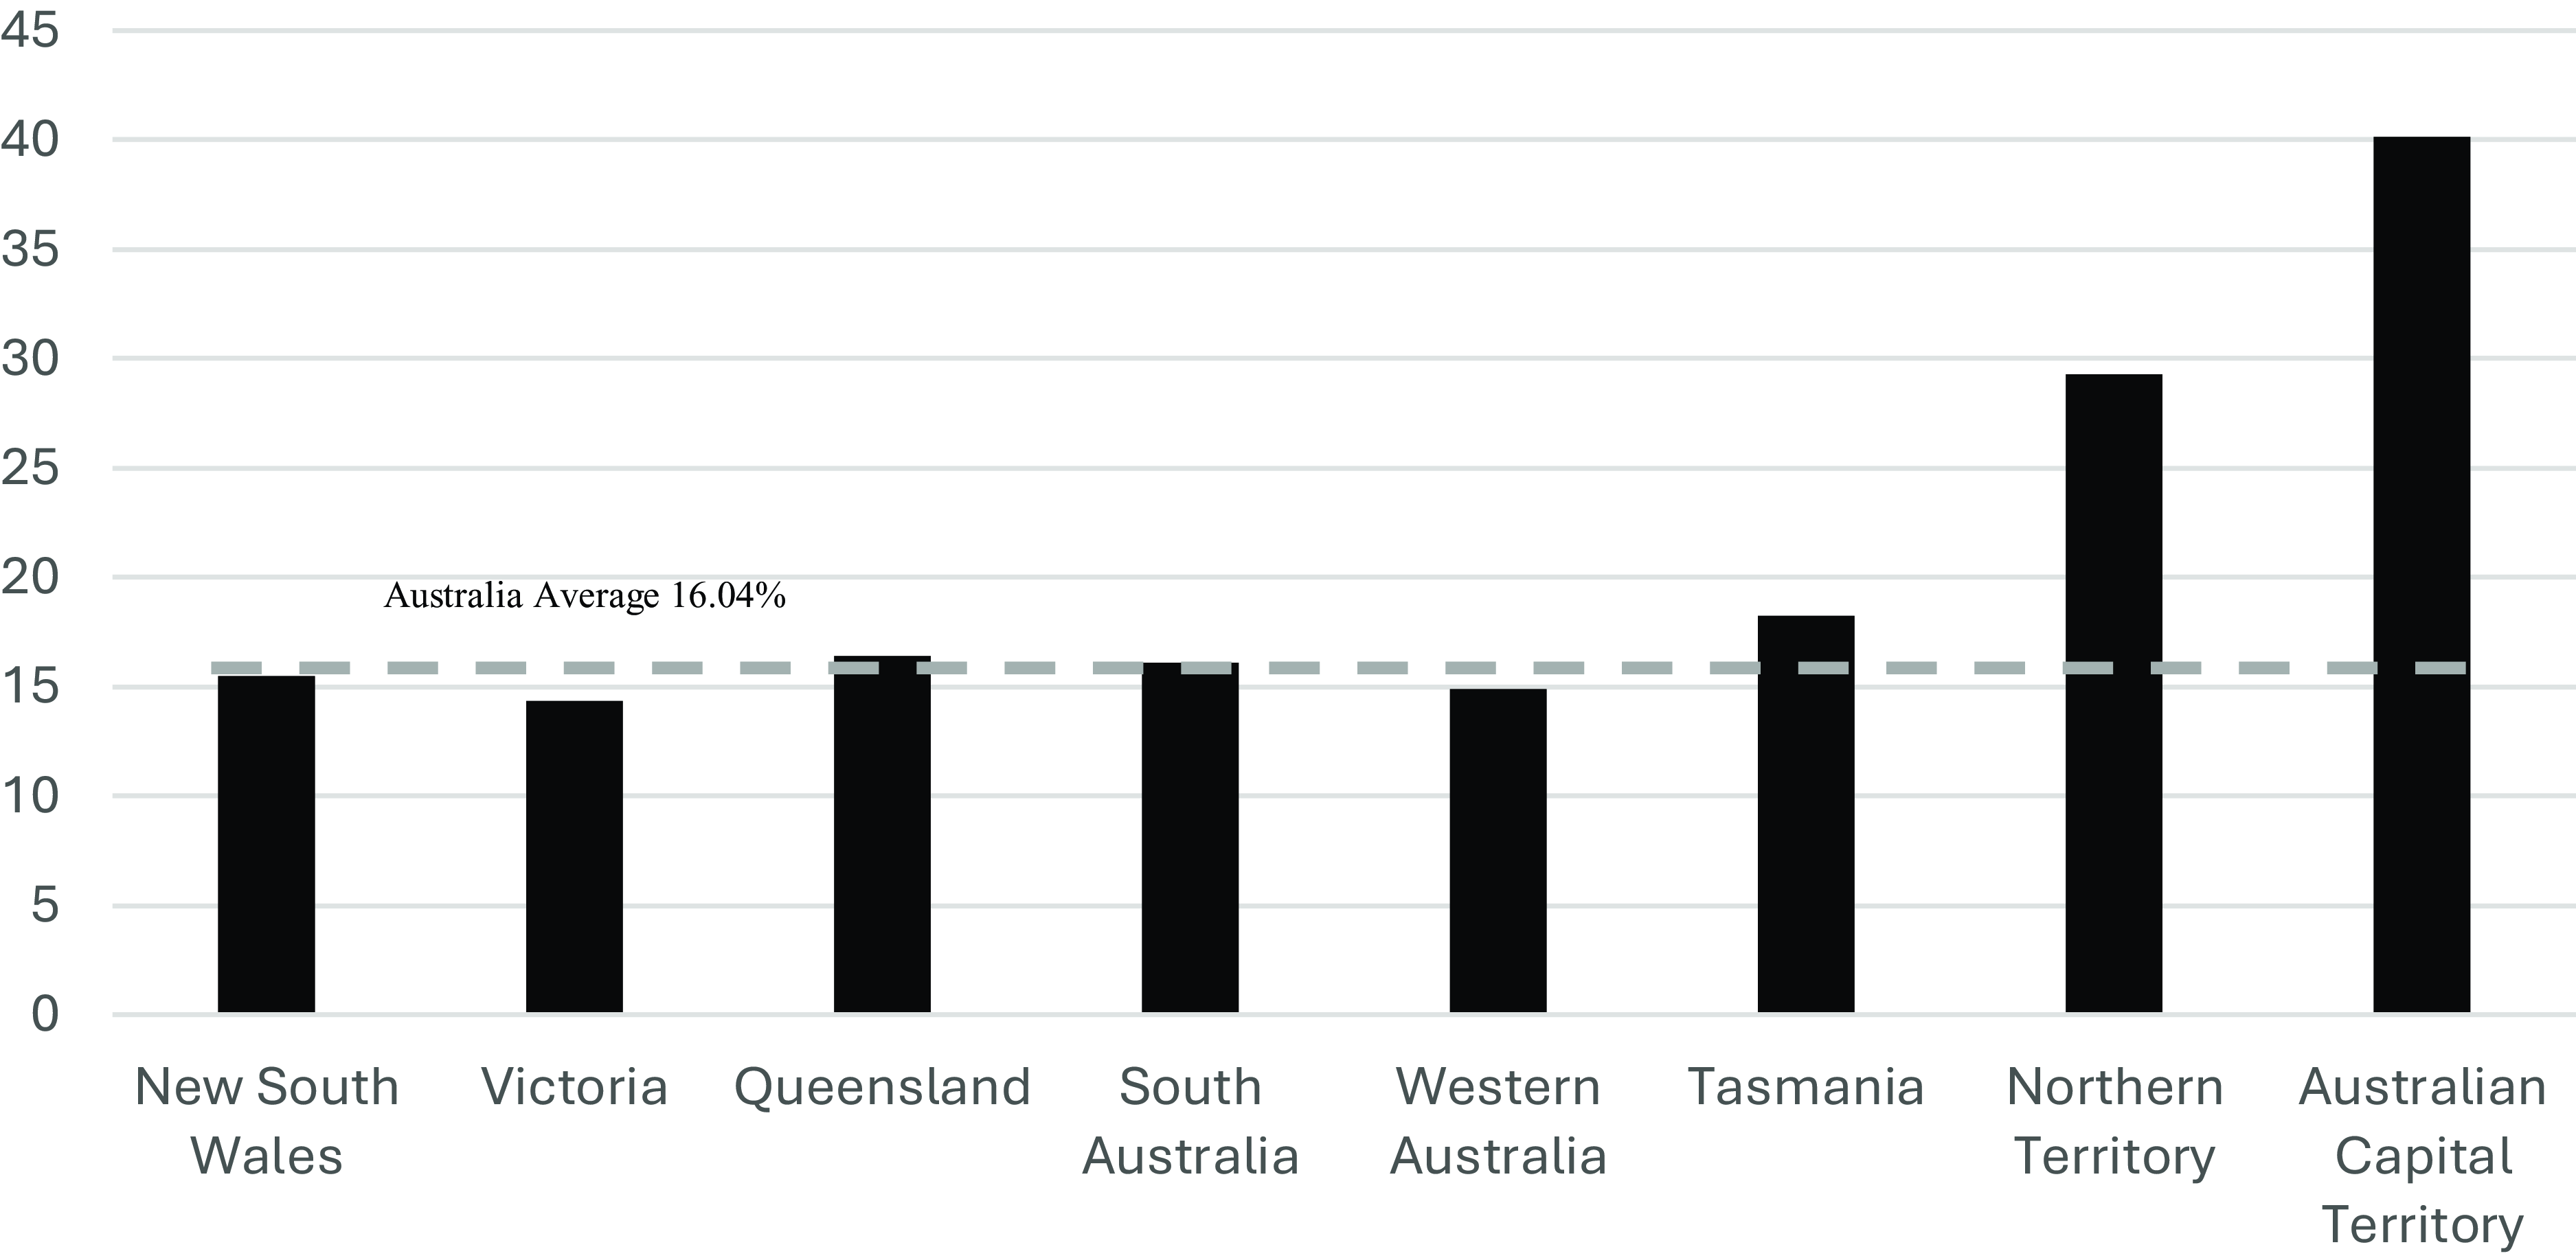
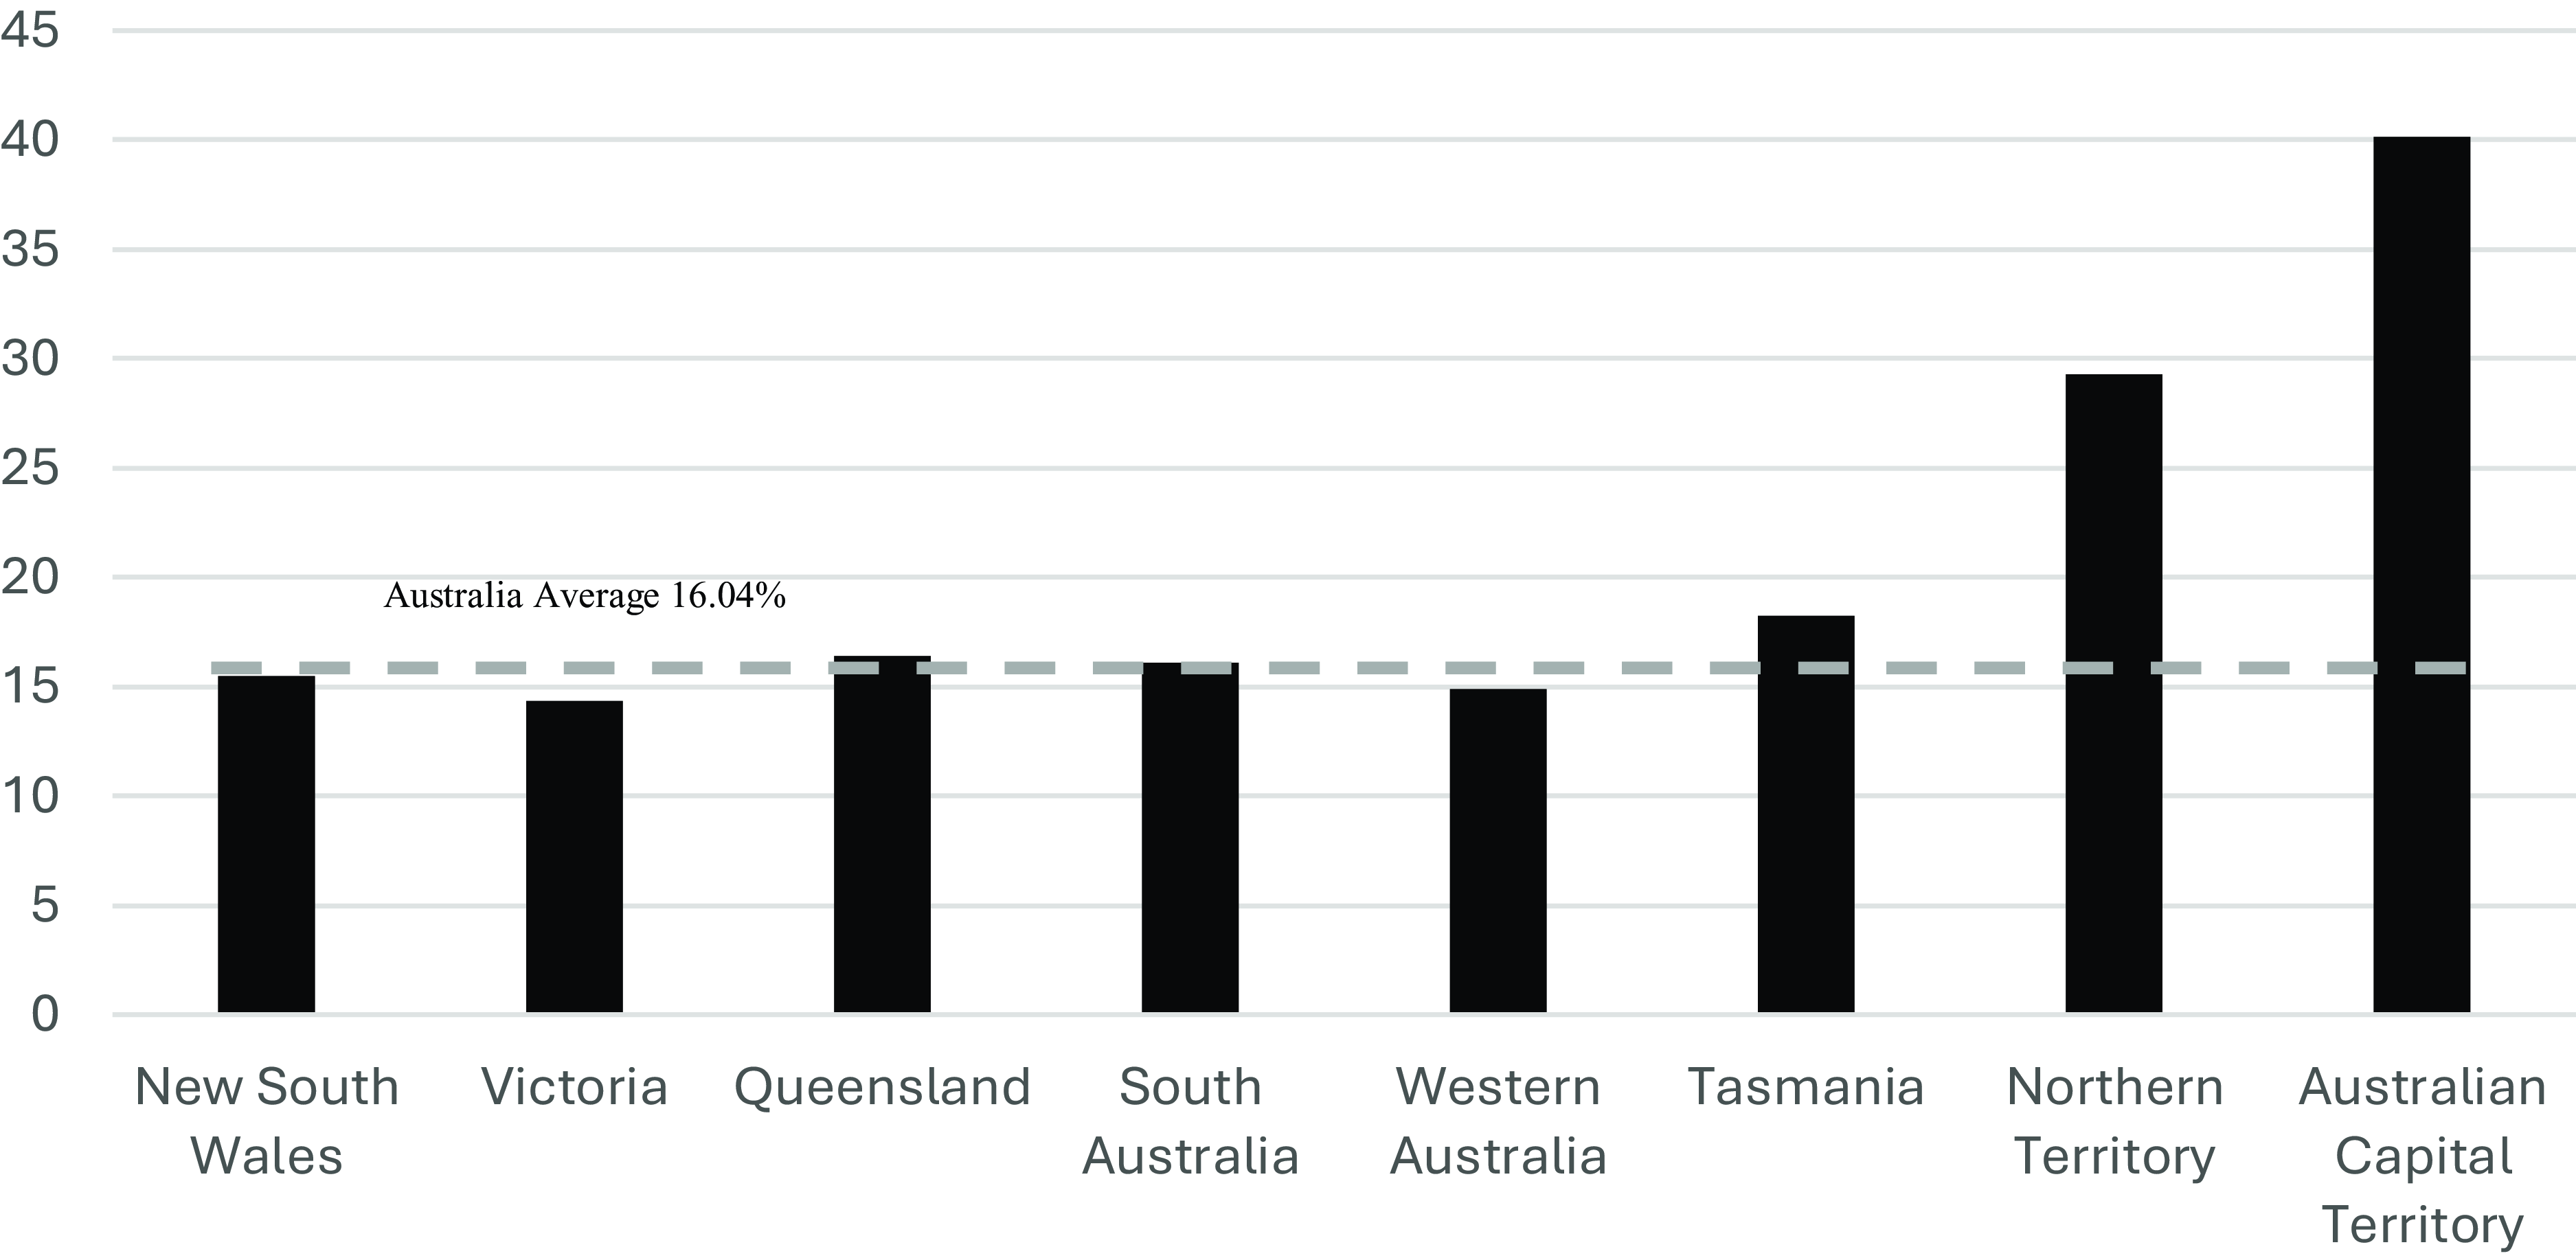
Focusing on the different levels or jurisdictions of government in Australia, the state or territory government is the largest employer, accounting for over half of public sector employment, followed by the Commonwealth (national level), and then local government. Other analysis in Figure 1 shows that there is little variation in the percentage of public sector employment across the six states of Australia, with noticeably higher public sector representation in the Northern Territory and Australian Capital Territory.
Public sector employment (% of total employment) by State and Territory, 2021. Data source: ABS (2021).
Finally, public sector employment is concentrated in a somewhat small number of industries. The industries where public sector employment is relatively high include Health Care and Social Assistance (25.56%), Electricity, Gas, Water and Waste Services (33.85%), Education and Training (51.47%), and Public Administration and Safety (88.72%), with other industries generally containing less than 10% of public sector workers (ABS 2021).
In terms of wage setting, Commonwealth public servants are covered under the national industrial relations tribunal and regulator, known as the Fair Work Commission (Australian Public Service Commission 2018). Most Commonwealth public sector employees are covered by collective agreements for individual departments or agencies, meaning that pay levels vary, even for those employed at the same job classification level (Mannheim Reference Mannheim2019). State government public sector wages are typically governed by the respective state’s industrial relations commission, which is the state equivalent of the Fair Work Commission, and in turn guided by state government policies. Most contain a number of agreements or Awards that cover different occupations or agencies such as police, nurses, and teachers. Finally, local councils are generally covered by their own Award agreement under their respective state’s industrial relations commission, with a minority covered by enterprise agreements. Public sector pay setting is characterised by collective bargaining. In 2000, 94.5% of public sector workers were covered by collective agreements, increasing to 97% in 2023 (ABS 2000, 2023b).
Public sector wage policies in Australia are typically underpinned by general principles relating to performance of the national or state economy and sustainability of public finances. However, it has become increasingly common for public sector wages to be set by fixed maximum wage growth rates, known as wage caps. Colley (Reference Colley2012) and Colley et al (Reference Colley, Woods and Head2022) characterise wage caps as a direct response to the GFC, intended to address cost containment, set an example for the broader labour market, and be seen as an austerity measure. However, unlike temporary pay cuts or freezes linked to the GFC (Michael and Christofides Reference Michael and Christofides2020), it has become common for these wage caps to be imposed for substantial time periods.
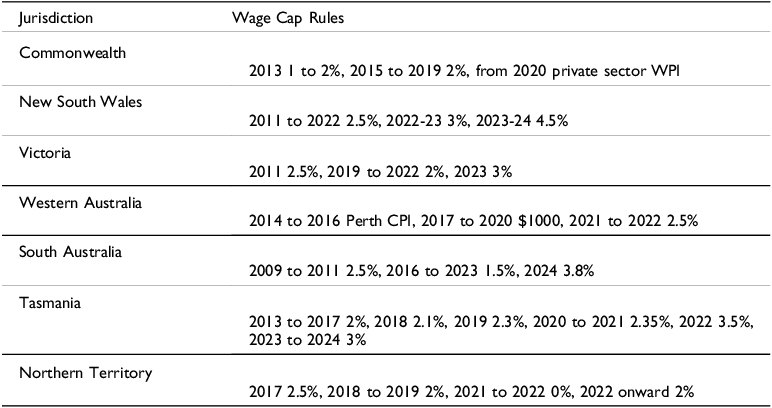
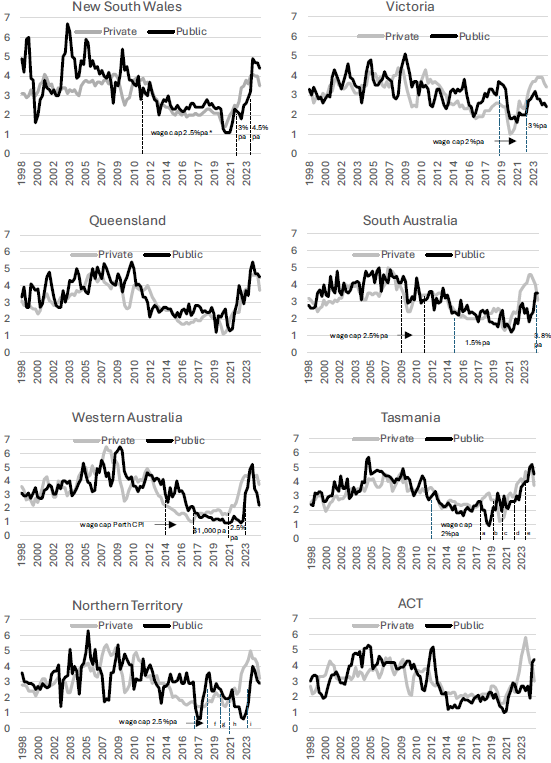
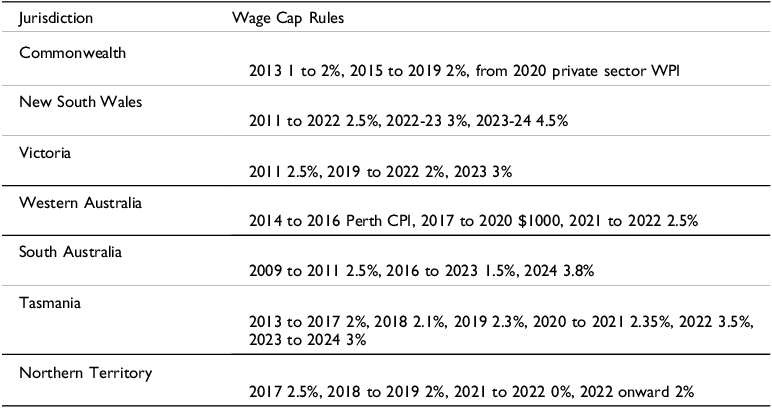
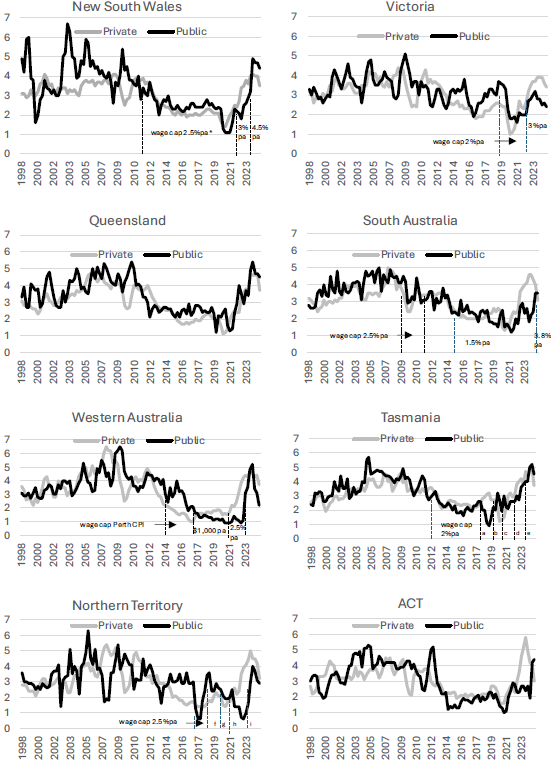
Table 2 lists a number of the wage caps implemented at Commonwealth and state and territory levels. States with long lasting wage caps that persisted into the COVID-19 period include New South Wales (2011 to 2022), South Australia (2016 to 2024), Tasmania (2013 to 2024) and the Northern Territory (2017 to 2024). Wage growth rates are presented for each state and territory in Figure A1 in the Appendix, highlighting the main wage cap periods. In general, the data shows that the imposition of wage caps coincided with decreases to public sector wage growth rates in their respective jurisdictions. Furthermore, observed public sector wage growth rates have generally adhered to the stated wage caps. For example, in NSW public sector wage growth declined to 2.5% per annum within two years of the imposition of the 2.5% wage cap and remained at approximately this level for the duration of the public sector wage policy. Notably, when wage growth was temporarily restricted to 0.3% in 2020 at the onset of the COVID-19 period, wage growth fell rapidly before rebounding in 2021. Similarly, public sector wage growth fell to 2% per annum when a 2% wage cap was introduced in Victoria and Tasmania. However, we also observe other time periods where the observed public sector wage growth and the state’s wage cap do not coincide. For example, when a 2.5% wage cap was introduced in Western Australia and South Australia, wage growth remained closer to 1% per annum in Western Australia, and 3% per annum in South Australia.
A summary of public sector wage caps in Australia
Data source: Henderson (Reference Henderson, Steward, Stanford and Hardy2018), Colley et al (Reference Colley, Woods and Head2022), Australian Public Service Commission (2020), NSW Treasury (2014), NSW IRC (2022), Victoria Government (2023), Western Australia Attorney General (2013), Western Australia Government (2023), South Australia Attorney General (2021), Tasmanian Department of Premier and Cabinet (2019).
While public sector wage caps are binding for all workers in a given public sector jurisdiction and generally coincide with that jurisdiction’s observed wage growth, there are a number of reasons why the observed public sector wage growth rates in a given state or territory will not coincide exactly with the wage cap for that geographic area. First, a minority of agreements for specific occupations contain annual or skill-based increments. For example, it is relatively common for state and territory public sector nurses to receive annual increments for the first few years of service. Secondly, those workers receiving a promotion can earn a higher wage increase than the wage cap in a given year. Thirdly, some wage caps can be bypassed in exceptional circumstances due to labour shortages. Fourthly, higher level management in the public sector are typically covered by individual agreements that are independent of public sector wage policy. Similarly, employees of multi-jurisdictional units such as universities would be classified as public sector workers but are covered by enterprise level agreements independent of state or territories’ public sector wage policies. Finally, in addition to the considerations above, the wage data reported for a given state or territory by the ABS comprises all of Commonwealth, state and local government public sector workers. For example, public sector wage growth patterns in NSW should be predominantly affected by NSW government public sector wage policy, as state public sector employment comprises 70% of public sector employment (ABS 2021). However, the observed wage patterns will also be influenced by the wage outcomes for Commonwealth and local government workers working in NSW, comprising the other 30% of public sector employment. In comparison, the public sector wage growth outcome for Australia would be affected by wage policies at the Commonwealth level as well as all states and territories.
In contrast to public sector workers, private sector wages are determined within a tiered approach within the national industrial relations system. National Employment Standards in the Fair Work Act establish a safety net for workers by imposing both minimum wages and conditions, covering approximately 2% of the lowest paid workers. Sitting above minimum wages are Modern Awards, consisting of industry level collective agreements incorporating higher wages rates and a greater range of employment benefits such as penalty rates for work on weekends and public holidays. Modern Awards cover approximately 24% of workers (ABS 2023b). Both minimum wages and Modern Award wage rates are set by the Fair Work Commission on an annual basis, following Section 284 of the Fair Work Act, with commissioners taking into account factors such as the performance and competitiveness of the macroeconomy and living standards of the low paid. Finally, enterprise agreements (collective agreements at the individual company level) cover approximately 25% of employees, with individual contracts covering the remaining 50% of private sector workers (ABS 2023b). The proportion of workers covered by each type of agreement has been relatively stable since 2000 (ABS 2000). For enterprise agreements to be legal they must be registered with the Fair Work Commission and satisfy the Better Off Overall Test (BOOT), leaving all workers better off than their respective industry’s Modern Award. In theory, increases made to minimum wages and Modern Awards should indirectly filter through to enterprise agreements and individual contracts to maintain BOOT conditions.
Data and methodology
Public and private sector wage data were taken from the Australian Bureau of Statistics (ABS) Wage Price Index (WPI), providing quarterly data from September 1997 to September 2024. While some researchers have used nominal or real wage levels, the use of wage index data has also been deemed appropriate in other research (D’Adamo Reference D’Adamo2014). Analysis was conducted using the annual wage growth rate data, otherwise known as the ‘percentage change from corresponding quarter of previous year’ series. This data was available at the aggregate Australia level, and for all (eight) states and territories. Similar to the consumer price index (CPI), the WPI tracks the wages of a basket of jobs and is unaffected by changes to the composition of the workforce. It is therefore the best data source to measure wage inflation. However, we are unable to focus on specific groups of interest such as by gender or age, nor can we focus individually on Commonwealth, state or local government wage data.
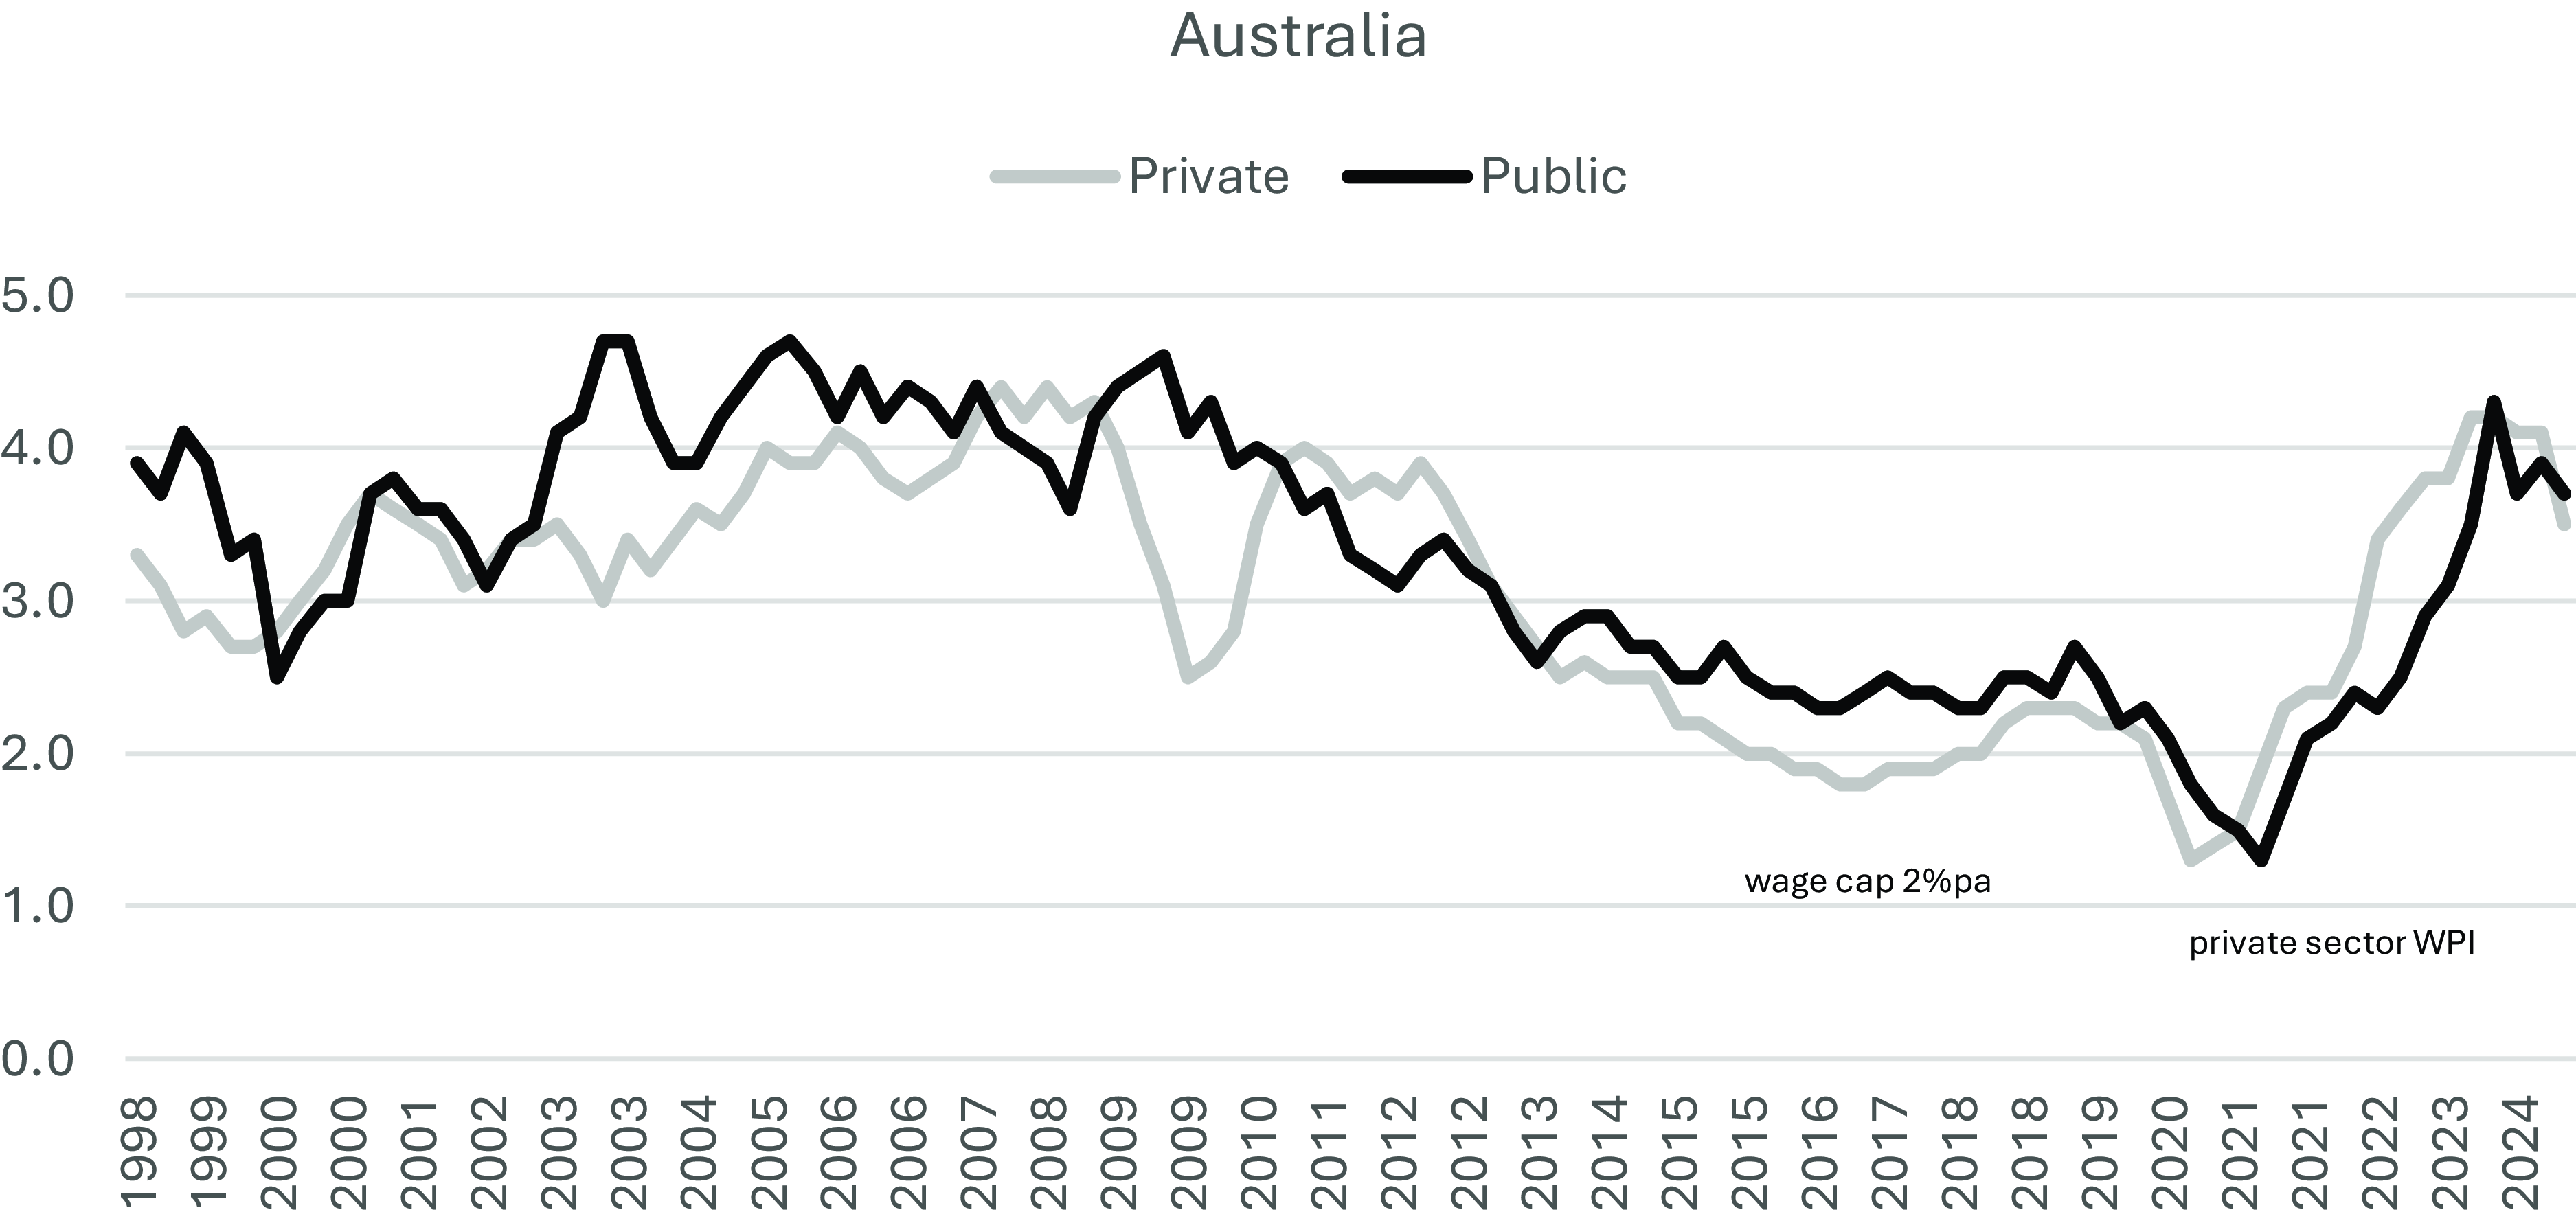
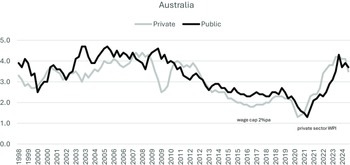
Given the disparate wage setting mechanisms for private and public sectors, one may expect little correlation between wage growth in each sector. However, Figure 2 displays similar common broad trends in both series. Wage growth generally increased from 3 to 4.5% in the decade from 1998 until the GFC, subsequently falling to 2 to 2.5% throughout the 2010s, before displaying some volatility during COVID-19 and the subsequent recovery period. Relatively close resemblance between private and public sector wage growth patterns was also evident in state and territory series (see Figure A1 in the Appendix).
Wage price index (WPI) Annual growth rate (%) for private and public sector wages in Australia, September quarter 1998 to September quarter 2024. Data source: ABS (2024).
The VECM provides a convenient empirical methodology to test for both the existence and direction of wage spillovers between sectors. After first testing that private sector ( $W_t^{pri}$
) and public sector (
$W_t^{pri}$
) and public sector ( $W_t^{pub}$
) wage growth series are non-stationary (I(1)) and cointegrated, and selecting the optimal lag length using lag exclusion tests, a VECM specification may be estimated as:
$W_t^{pub}$
) wage growth series are non-stationary (I(1)) and cointegrated, and selecting the optimal lag length using lag exclusion tests, a VECM specification may be estimated as:
 $$\left[ {\matrix{ {\Delta W_t^{pri}} \cr {\Delta W_t^{pub}} \cr } } \right] = \alpha \beta '\left[ {\matrix{ {W_{t - 1}^{pri}} \cr {W_{t - 1}^{pub}} \cr } } \right] + \;\sum\limits_{i = 1}^n {{\Gamma _i}} \left[ {\matrix{ {\Delta W_{t - i}^{pri}} \cr {\Delta W_{t - i}^{pub}} \cr } } \right] + \;\mu + \;{\varepsilon _t}$$
The main coefficients of interest are the adjustment coefficients ( $\alpha $
) (D’Adamo Reference D’Adamo2014). Testing the adjustment coefficients
$\alpha $
) (D’Adamo Reference D’Adamo2014). Testing the adjustment coefficients ${\alpha ^{pri}}\;$
and
${\alpha ^{pri}}\;$
and ${\alpha ^{pub}}\;$
determines the long run wage leader. Following a shock, if one sector adjusts wage growth to the other it will be deemed to be a long run wage follower. The sector that does not adjust to the other is deemed as the long run wage leader. In other words, long run leadership is determined by a test of weak exogeneity, when a sector’s adjustment coefficient is equal to zero. In contrast, the long run follower should have an adjustment coefficient that is statistically significant. This is tested using a simple t test on the adjustment coefficient. Using a standard test of a coefficient’s statistical significance (
${\alpha ^{pub}}\;$
determines the long run wage leader. Following a shock, if one sector adjusts wage growth to the other it will be deemed to be a long run wage follower. The sector that does not adjust to the other is deemed as the long run wage leader. In other words, long run leadership is determined by a test of weak exogeneity, when a sector’s adjustment coefficient is equal to zero. In contrast, the long run follower should have an adjustment coefficient that is statistically significant. This is tested using a simple t test on the adjustment coefficient. Using a standard test of a coefficient’s statistical significance ( ${H_0}:\;{\alpha ^{sector}} = 0$
), we reject the null hypothesis for a wage follower and do not reject the null hypothesis for the wage leader. In the case that both sectors adjust to each other and both
${H_0}:\;{\alpha ^{sector}} = 0$
), we reject the null hypothesis for a wage follower and do not reject the null hypothesis for the wage leader. In the case that both sectors adjust to each other and both ${\alpha ^{pri}}\;$
and
${\alpha ^{pri}}\;$
and ${\alpha ^{pub}} \ne 0$
, we have bi-directional or joint wage leadership (Lamo et al Reference Lamo, Pérez and Schuknecht2012).
${\alpha ^{pub}} \ne 0$
, we have bi-directional or joint wage leadership (Lamo et al Reference Lamo, Pérez and Schuknecht2012).
In addition to estimating the basic VECM model over the full period from 1998 to 2024 we are particularly interested in the identification of structural breaks, particularly those that may be associated with the GFC and COVID-19 epochs. If present, the structural breaks are likely to be quite different in nature. The GFC was associated with the application of wage caps for many state governments and a subsequent depression in wage growth. However, the COVID-19 period coincided with labour shortages, inflation and rapid wage growth. Whether the relationship between private and public wage growth was affected at these key points in time will be determined empirically within our model specification. In common with past literature incorporating structural breaks into VECMs, we start with unit root tests that incorporate endogenously determined structural breaks. The structural breaks can subsequently be incorporated into the VECM model by adding a suitable time specific dummy variable to the model specification (Dogan Reference Dogan2016; Elijah and Hamza Reference Elijah and Hamza2019) or by splitting the sample and reporting results for each sub-sample (Pala Reference Pala2013). Given the relative recency of the COVID-19 period and short sample size from 2020 onwards, the most appropriate strategy in our case is to use the dummy variable method.
VECM model results
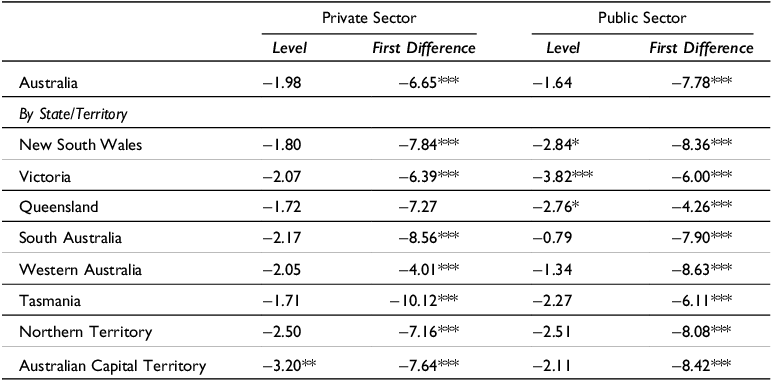
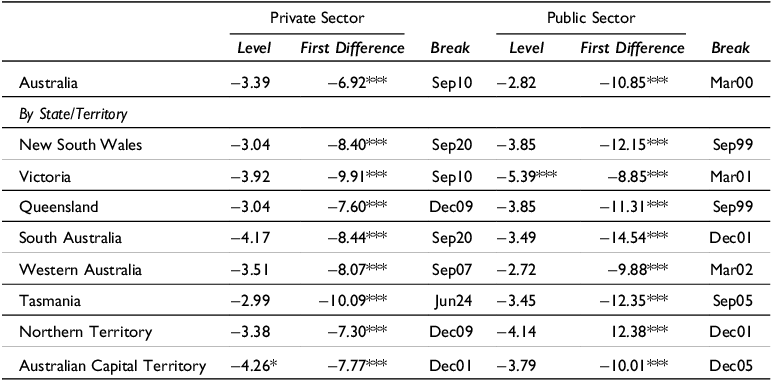
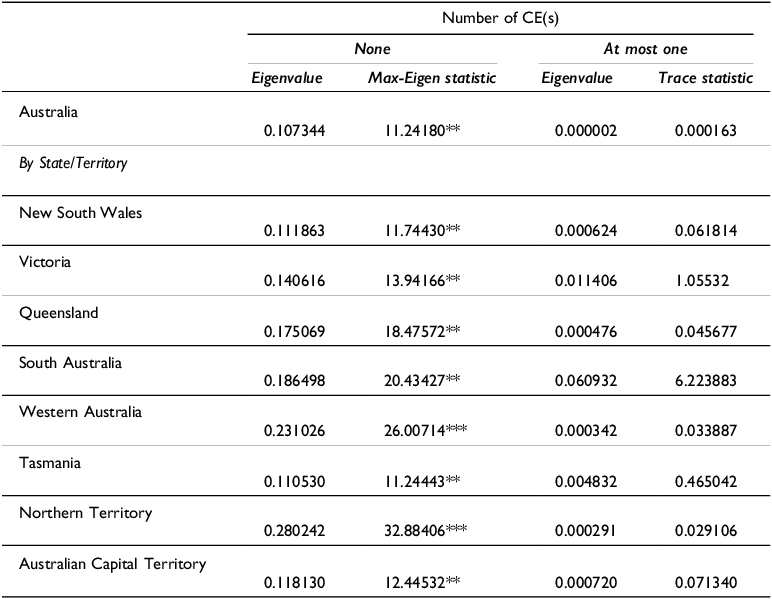
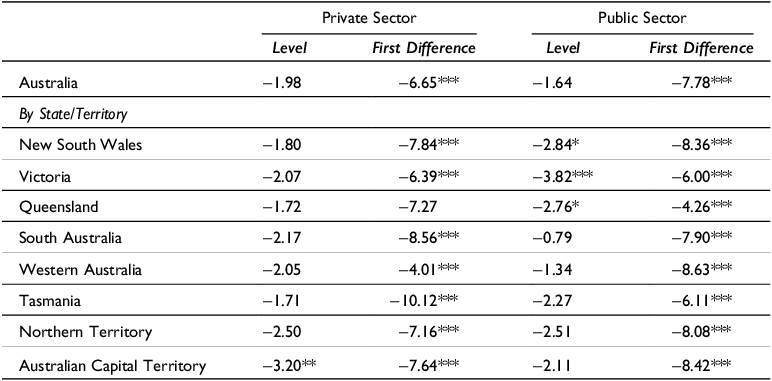
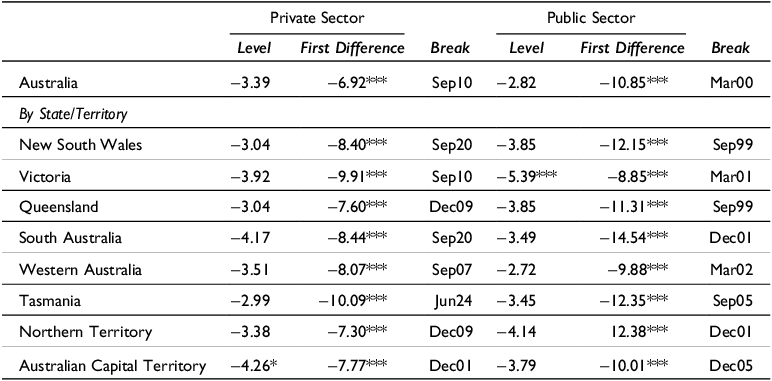
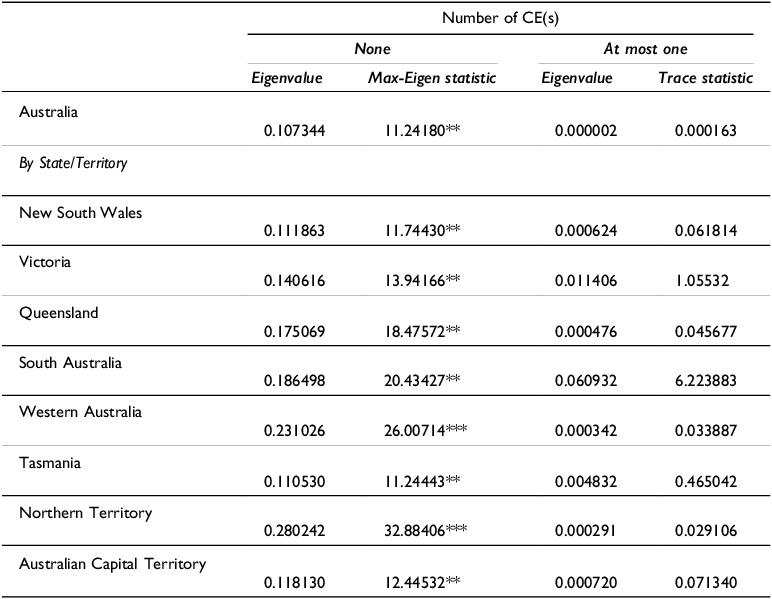
Standard unit root tests, unit root tests incorporating structural breaks and cointegration test results are presented in Tables A.1 to A.3 within the Appendix. It was established that the national, as well as state and territory private and public sector series were all I(1) with corresponding regions’ private and public sectors cointegrated. Furthermore, unit root tests incorporating structural breaks determined that structural break occurred in private sector wage series, coinciding with either the GFC aftermath or COVID-19 crisis periods. In contrast, structural breaks identified in public wage growth series generally predated both the GFC and COVID-19 periods. A COVID-19 era dummy variable was created, taking the value 1 from September quarter 2020 onward, consistent with test results and visual observation of data in Figures A1 and 2.Footnote 1 This variable was added as an exogenous variable into the model specification. A number of attempts were made to add a GFC dummy variable to our model specification, with start dates varying from 2007 to 2011, however, none proved to be statistically significant in subsequent model specifications and are therefore not included in our model estimation results below.
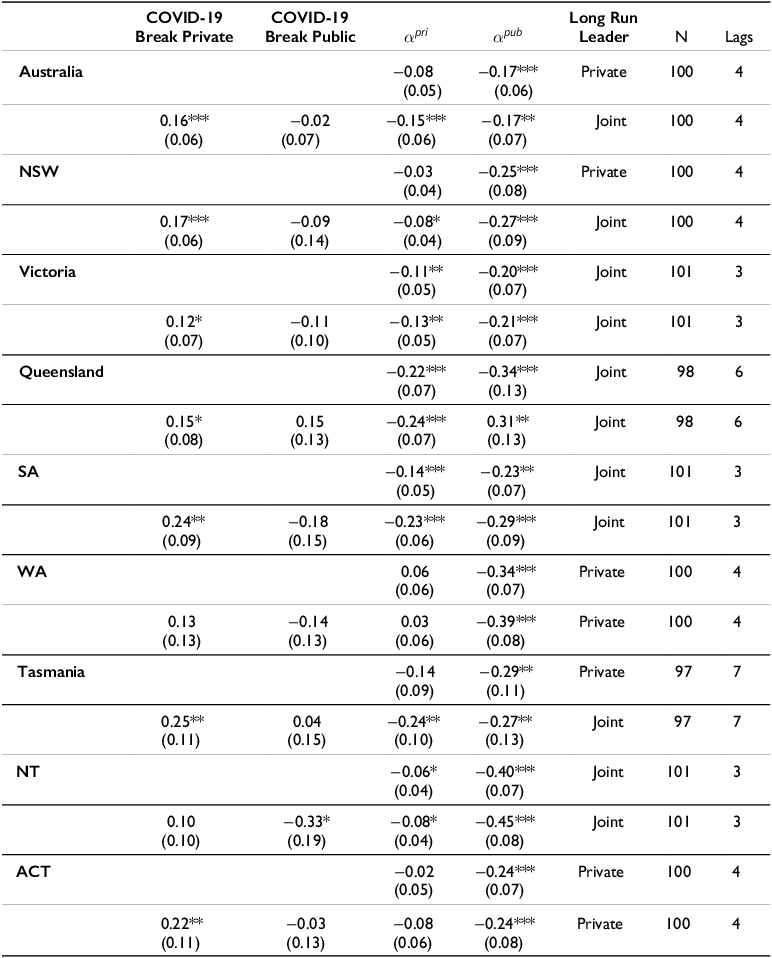
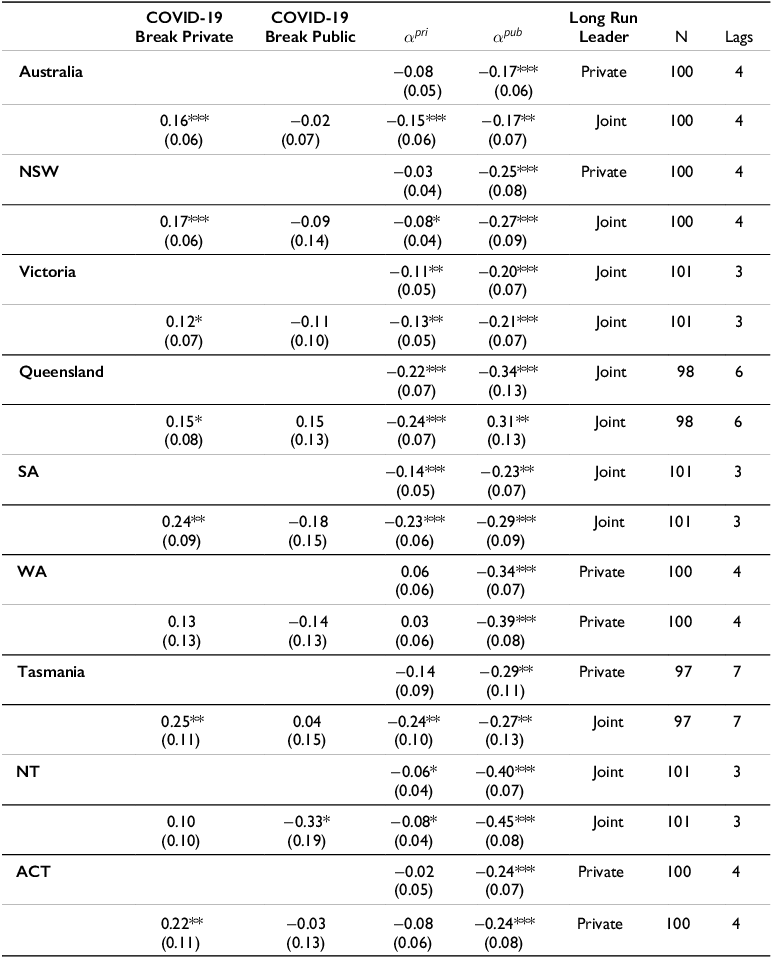
Two models are presented for Australia as a whole and all states and territories in Table 3. The basic model consists of private and public wages only, with the second model augmented with the COVID-19 era structural break variable. Starting with the results for Australia as a whole, the optimal lag was determined as four quarters using lag exclusion tests, indicating that changes in one sector’s wage growth can affect the other sector for up to one year. Only ${\alpha ^{pub}}$
was statistically significant, implying that the public sector adjusts to shocks to the long run relationship but the private sector does not. In other words, the private sector was deemed to be the long run wage leader. However, the magnitude of adjustment was relatively low, suggesting that any shock was corrected by only 17% in the following time period.
${\alpha ^{pub}}$
was statistically significant, implying that the public sector adjusts to shocks to the long run relationship but the private sector does not. In other words, the private sector was deemed to be the long run wage leader. However, the magnitude of adjustment was relatively low, suggesting that any shock was corrected by only 17% in the following time period.
VECM state and territory annual wage growth series (september 1998 to september 2024)
Data Source: ABS (2024), author’s calculations.
When adding the dummy variable representing the structural break during the COVID-19 era to the Australian model, we observe a statistically significant and positive coefficient in the private sector wage growth model and a negative but statistically insignificant coefficient in the public sector model. This finding is in keeping with the observation that private sector wage growth increased rapidly after COVID-19. Of greater importance to this study, after we allow for the COVID-19 era structural break, the public sector adjustment coefficient ( ${\alpha ^{pub}}\;)$
remained unchanged at 0.17; however, the private sector adjustment coefficient (
${\alpha ^{pub}}\;)$
remained unchanged at 0.17; however, the private sector adjustment coefficient ( ${\alpha ^{pri}}\;)\;$
almost doubles in magnitude and becomes statistically significant, indicating bi-directional or joint wage leadership in the presence of the structural break. This may be interpreted as follows, bi-directional or joint wage leadership appears to be prevalent at the aggregate Australia level, but, there was a positive shock to the private sector’s wage growth rate from September 2020 onwards. If left unaccounted for, this structural break is erroneously identified as private sector wage leadership. As the Australia level data represent the aggregation of data from each individual state and territory, we now shift focus to this regional level to attain a deeper understanding of our results.
${\alpha ^{pri}}\;)\;$
almost doubles in magnitude and becomes statistically significant, indicating bi-directional or joint wage leadership in the presence of the structural break. This may be interpreted as follows, bi-directional or joint wage leadership appears to be prevalent at the aggregate Australia level, but, there was a positive shock to the private sector’s wage growth rate from September 2020 onwards. If left unaccounted for, this structural break is erroneously identified as private sector wage leadership. As the Australia level data represent the aggregation of data from each individual state and territory, we now shift focus to this regional level to attain a deeper understanding of our results.
The optimal lag ranged between three to seven lags in the state and territory models according to lag exclusion tests. The private sector was determined as the long run wage leader in the basic models for New South Wales, Western Australia, Tasmania and the ACT. In comparison, joint long run wage leadership was established in Victoria, Queensland, South Australia and the Northern Territory. It was also observed that the adjustment coefficient for the public sector ( ${\alpha ^{pub}})\;$
always exceeded that of the private sector (
${\alpha ^{pub}})\;$
always exceeded that of the private sector ( ${\alpha ^{pri}}$
), indicating that the public sector reacted more rapidly or with greater magnitude to any shocks to the long run relationship between private and public sector wage growth.
${\alpha ^{pri}}$
), indicating that the public sector reacted more rapidly or with greater magnitude to any shocks to the long run relationship between private and public sector wage growth.
The coefficient capturing the COVID-19 era structural break was positive and statistically significant in all states and territories’ private sector models except Western Australia and the Northern Territory. In contrast, the structural break was not statistically significant in any of the public sector models, with the exception of the Northern Territory. Consistent with the finding for Australia as a whole, the declaration of the long run leader changed from private to joint wage leadership in NSW and Tasmania in the presence of the structural break. However, the evidence for NSW was relatively weak, with the private sector adjustment coefficient statistically significant at the 10% level only, and less than one third the size of the public sector adjustment coefficient. In contrast to the findings for Australia, the adjustment coefficient for the private sector remained noticeably smaller than the public sector coefficient for most states and territories after incorporating the structural break. Western Australia and the ACT were the only two states or territories that were still associated with private sector wage leadership after the structural break was included. Finally, public sector wage leadership was not observed in any model.
Discussion and conclusion
Australia provides a unique setting for the study of wage leadership, with the wages of the majority of public sector workers being determined at a regional state and territory government level. Using wage price index data we were able to investigate wage growth leadership and spillovers between private and public wage growth at the national level and for all state and territories. Despite disparate wage setting mechanisms, our analyses demonstrated a close relationship between private and public wage growth at the national and state and territory level, with similar trends over time revealed in graphical displays of data subsequently reinforced by cointegration analysis. Our basic VECM specification established the private sector as the long run wage leader in Australia and in half of the states and territories, with the remainder displaying joint leadership. However, after controlling for the structural break coinciding with COVID-19 and labour shortages, both Australia and most states and territories displayed bi-directional or joint wage leadership between private and public sectors, although the adjustment coefficient for the private sector remained lower than that for the public sector in all models. The results suggest there is some evidence to support the claim that wage caps imposed by governments to restrain public sector wage growth also impacted private sector wages and thus contributed to the wage stagnation experienced throughout the 2010s. This finding may also have been influenced or exacerbated by weakened private sector union bargaining over the same time period (Stewart et al Reference Stewart, Stanford and Hardy2018)
The structural break from mid-2020 indicated that there was an anomaly captured in our model compared to the norm that had prevailed in previous decades. When viewing the wage growth patterns for private and public sectors in Australia (Figure 2), there is clear a gap that emerges after mid-2020 with private wages accelerating rapidly before public sector wages follow suit. Importantly, these features are largely captured in our model specification and estimates. Using our estimation results, we know that changes to the private sector can take between three to seven quarters to permeate through to public sector wages. The adjustment coefficient ${\alpha ^{pub}}$
suggests that 17% of any shock to the long run model is corrected in the following time period at the aggregate Australia level, and by between 20 to 40% for the states and territories. Given the relatively large nature of the shock to the economy in terms of labour shortages and inflation, the private sector experienced a relatively quick and large price adjustment, with the public sector adjusting gradually, consistent with the adjustement coefficients estimated.
${\alpha ^{pub}}$
suggests that 17% of any shock to the long run model is corrected in the following time period at the aggregate Australia level, and by between 20 to 40% for the states and territories. Given the relatively large nature of the shock to the economy in terms of labour shortages and inflation, the private sector experienced a relatively quick and large price adjustment, with the public sector adjusting gradually, consistent with the adjustement coefficients estimated.
Any significant gap between private and sector wage growth has now largely dissipated at the aggregate Australia level. Similarly, when looking at the private and public sector wage growth patterns for states and territories (Figure A1) the gap between most series has largely disappeared, although the size and duration of the wage growth gap varied across regions. It is likely that wage caps became an unsustainable policy in the face of persistent labour shortages and market wage pressure. Not surprisingly, we have seen wage cap rules abandoned for some state and territory jurisdictions in more recent times.
On the surface, our findings appear to be at odds with those from previous Australian research at the individual state and industry level that established the public sector as the wage leader (O’Brien et al Reference O’Brien, Gollan and Gerth2024). However, it is likely that wage dynamics differ in the small number of industries dominated by large public sector employment. At the aggregate level, the smaller relative magnitude and occasional lack of statistical significance of private sector adjustment coefficients in our models indicated a greater role for private sector wage leadership.
While the finding of joint wage leadership or bi-directional causality in this study is consistent with previous international research, new insights have been gained in this paper by focusing on a number of unique layers to this story using regional analysis and incorporating time specific events. However, data limitations included the inability to include other relevant aspects such as gender, labour market mobility between sectors, or to pinpoint the specific transmission mechanisms for wage growth between sectors. Furthermore, future research is recommended on the investigation of asymmetry in the influence of the business cycle on wage leadership.
Appendix A
Annual Wage Growth by State, September 1998 to September 2024. Data source: ABS 2024.
* wage cap reduced to 0.3% temporarily in 2020.
a − 2.1%pa, b − 2.3%pa, c − 2.35%pa, d − 3.5%pa, e − 3.5%pa
f − 2%pa, g − no wage cap information available, h − 0%pa, i − 2%pa
Augmented Dickey Fuller Unit Root Test Results
Dickey-Fuller min-t Breakpoint Unit Root Test
Johansen Cointegration Results

 Open access

