

Nutrient deficiency in any species can be difficult to determine accurately because of the difficulties in feeding a deficient diet. Early studies have specifically looked at fatty acid deficiency in fish( Reference Castell, Sinnhuber and Wales 1 ), whereas others studying nutrient requirements have reached conclusions about deficiency signs and symptoms( Reference Catacutan and Coloso 2 ). There is a vast amount of literature on lipids and their constituent fatty acids in fish diets, and a focal point has been on their complexity, uniqueness and biological importance( Reference Sargent, Tocher and Bell 3 ). The barramundi or Asian sea bass (Lates calcarifer) are reported to have limited de novo capability to synthesise long-chain PUFA (LC-PUFA)( Reference Alhazzaa, Bridle and Nichols 4 – Reference Mohd-Yusof, Monroig and Mohd-Adnan 6 ). Moreover, the requirement of total lipid and LC-PUFA is thought to be low based on the compositional status of wild caught specimens compared with that of cultured barramundi( Reference Nichols, Glencross and Petrie 7 , Reference Nichols, Elliott and Mooney 8 ).
Clinical signs of nutrient deficiency become an important indicator of fish health and productivity. If fish are fed a diet that is deficient in a particular nutrient that cannot be synthesised endogenously, then their physical condition will begin deteriorating once all body reserves become depleted. Further, secondary pathological conditions may take hold as the animal becomes compromised and without treatment premature death often follows. To avoid this situation arising, commercially produced feeds need to ensure an adequate supply of all essential nutrients, often achieved by the addition of fish meal (FM) and fish oil (FO). However, global supply of these resources is under increasing environmental and economic pressure. Therefore, it is important to determine critical inclusion levels of all essential nutrients in dietary formulations for cultured species.
Several studies have induced essential fatty acid (EFA) deficiency in a range of fish species. One of the earliest was that of Castell et al. ( Reference Castell, Sinnhuber and Wales 1 ) who documented the feeding of rainbow trout (Oncorhynchus mykiss) over a prolonged time course. These authors described a range of deficiency symptoms such as poor growth, fin erosion, changing pigmentation, swollen livers and hearts and fainting or shock syndrome. A later study by Ruyter et al. ( Reference Ruyter, Røsjø and Einen 9 ) observed that Atlantic salmon (Salmo salar) exhibited poor growth, increased mortality and changed blood and liver condition after 1 month of feeding an EFA-deficient diet. In other species such as channel catfish (Ictalurus punctatus)( Reference Satoh, Poe and Wilson 10 ), red drum (Sciaenops ocellatus)( Reference Lochmann and Gatlin 11 ), turbot (Psetta maxima)( Reference Bell, Henderson and Pirie 12 ) and gilthead sea bream (Sparus aurata)( Reference Ibeas, Cejas and Gómez 13 ), signs of EFA deficiency include a consistent range of symptoms, with the most prominent being reduced growth performance and survival.
The precursors to LC-PUFA, linoleic acid (18 : 2n-6) and linolenic acid (18 : 3n-3) are considered essential or at least conditionally essential in all vertebrates, including fish, as they lack the desaturase enzymes required for their synthesis( Reference Cunnane 14 , Reference Tocher 15 ). Typically, fresh water and some diadromous species are able to synthesise sufficient LC-PUFA from these precursor fatty acids, whereas in most marine fish species the pathway of fatty acid biosynthesis is incomplete( Reference Tocher 15 ). However, there are distinct differences that exist between the marine fish in their capacity to biosynthesise fatty acids. Recently, the presence of an alternative Δ4 pathway to LC-PUFA was identified in the herbivorous marine fish Siganus canaliculatus ( Reference Li, Monroig and Zhang 16 ). The authors suggested that the trophic level rather than the habitat of a species is a more important indicator of LC-PUFA biosynthesis capacity. Cell lines of the marine fish turbot were used to demonstrate that elongation activity was limiting, whereas in gilthead sea bream Δ5 desaturase activity was limiting the conversion of precursor fatty acids to LC-PUFA( Reference Tocher and Ghioni 17 , Reference Ghioni, Tocher and Bell 18 ). The barramundi (L. calcarifer), a high trophic order carnivore, also lack Δ5 desaturase activity and is known to have a desaturase with Δ6/Δ8 dual activity in vitro ( Reference Tu, Muhlhausler and James 5 , Reference Mohd-Yusof, Monroig and Mohd-Adnan 6 ). Therefore, this evidence supports that in vivo this species should succumb to EFA deficiency because of this inability to produce the reputedly required LC-PUFA including EPA (20 : 5n-3), DHA (22 : 6n-3) and ARA (arachidonic acid; 20 : 4n-6).
The lipid, and to a lesser degree the fatty acid requirements, were examined in barramundi by a number of studies, yet there is still no clear documentation of the onset and progression of deficiency symptoms. Early studies demonstrated that the performance of larval barramundi was improved by incorporating preformed LC-PUFA into enriched live prey( Reference Dhert, Lavens and Duray 19 , Reference Rimmer, Reed and Levitt 20 ). Other juvenile barramundi studies have reported signs of EFA deficiency such as abnormal reddening of the fins and reduced growth performance associated with low levels of n-3 LC-PUFA( Reference Catacutan and Coloso 2 , Reference Buranapanidgit and Boonyaratpalin 21 ). More recently, Williams et al. ( Reference Williams, Barlow and Rodgers 22 ) demonstrated improvements in barramundi productivity with increasing n-3 LC-PUFA at either 20 or 29°C. Williams et al. ( Reference Williams, Barlow and Rodgers 22 ) described a ‘fainting attack’ from a small number of their fish, and this effect has also previously been observed in rainbow trout fed EFA-deficient diets( Reference Castell, Sinnhuber and Wales 1 ). Glencross and Rutherford( Reference Glencross and Rutherford 23 ) showed for the first time that barramundi performance was clearly affected by the presence or absence of certain EFA. These authors also reported symptoms such as reddening of the fins and the opercular region; however, this was attributed to increasing DHA in the absence of an equivalent increase of EPA.
Among these results, it is clear that EFA have an important physiological role in both larval and juvenile barramundi, whereas less is known about the effects on larger fish. Despite the efforts of numerous studies so far, there remains to be a clear analysis of the onset and progression of EFA deficiency in barramundi. Therefore, the aim of this experiment was to document the aetiology of EFA deficiency in juvenile barramundi. It was hypothesised that once the endogenous reserves of LC-PUFA were progressively depleted, then sub-clinical EFA deficiency symptoms would develop before further gross clinical signs become evident.
Methods
Ingredient and diet preparation
A single basal diet was formulated and prepared without the addition of dietary lipids. The dry ingredients were passed separately through a hammermill (type 1 SH; Mikro Pulverizer) such that the maximum particle size was less than 750 µm. All dry ingredients were then thoroughly mixed using an upright commercial mixer (Model 60 A-G; Bakermix). FM was defatted before use by manually mixing hexane and FM (2:1) in a large drum. The mix was left to soak for 3 h before draining the excess hexane and repeating the process a second time. The FM was oven-dried overnight at 60°C to a constant DM. The chemical composition of the main dietary ingredients is presented in Table 1. The basal diet was then separated into smaller batches, and aliquots of lipid (8·2 % diet) were added to form the three treatment diets. Fresh water was added at approximately 30 % of dry mash weight and mixed to form consistent dough, and then the dough was subsequently screw-pressed through a 4 mm die. The pellets were dried overnight at 60°C to a constant DM. The dietary treatments provided protein at 60 % and lipid at 13 % with an energetic value of 22 MJ/kg. The three dietary treatments consisted of a control diet with added FO (designated as FO CTRL), a diet containing only 1 % FO and a blend of olive and palm oil (designated as FO LOW) and a diet devoid of any FO and a blend of olive and palm oil (designated as FO FREE). The diets were then stored at −20°C until required. The formulation and chemical composition of the three diets are presented in Table 2.
Chemical composition of ingredients used in experimental dietsFootnote *
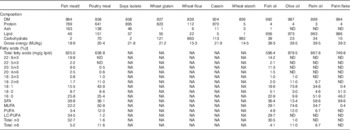
LC-PUFA, long-chain PUFA; NA, not analysed; ND, not detected.
* All values are g/kg unless otherwise stated. Any values <0·01 are reported as 0·1.
† Fish meal was defatted using hexane.
‡ Quantitative data can be obtained by multiplying the total fatty acids (mg/g lipid) by specific fatty acids (%). 18:1, sum of 18 : 1n-7, 18 : 1n-9 cis, 18 : 1n-9 trans; SFA, sum of 12 : 0, 14 : 0, 16 : 0, 18 : 0, 20 : 0, 22 : 0, 24 : 0; MUFA, sum of 14 : 1n-5, 16 : 1n-7, 18 : 1n-7, 18 : 1n-9 (cis and trans), 20 : 1n-7, 20 : 1n-9, 22 : 1n-9, 24 : 1n-9; PUFA, sum 18 : 2n-6 (cis and trans), 18 : 3n-6, 18 : 3n-3, 18 : 4n-3; LC-PUFA, sum 20 : 2n-6, 20 : 3n-6, 20 : 4n-6, 22 : 4n-6, 2 : 3n-3, 20 : 5n-3, 22 : 5n-3, 22 : 6n-3; n-3, sum of n-3 PUFA and LC-PUFA; n-6, sum of n-6 PUFA and LC-PUFA.
Formulation and composition of experimental dietsFootnote *
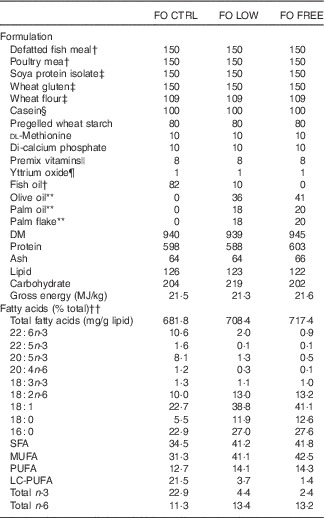
FO CTRL, control diet containing only fish oil; FO FREE, fish oil with no n-3 LC-PUFA; FO LOW, low inclusion of fish oil; LC-PUFA, long-chain PUFA; NA, not analysed.
* All values are g/kg unless otherwise stated. Any values <0·01 are reported as 0·1.
† Ridley aquafeeds. Fish meal defatted with hexane (see the ‘Methods’ section).
‡ Manildra Group.
§ Bulk Powders, www.bulkpowders.com.au
|| Vitamin and mineral premix (g/kg of premix): vitamin A, 0·75 mg; vitamin D3, 6·3 mg; vitamin E, 16·7 g; vitamin K3, 1·7 g; vitamin B1, 2·5 g; vitamin B2, 4·2 g; vitamin B3, 25 g; vitamin B5, 8·3 g; vitamin B6, 2·0 g; vitamin B9, 0·8 g; vitamin B12, 0·005 g; biotin, 0·17 g; vitamin C, 75 g; choline, 166·7 g; inositol, 58·3 g; ethoxyquin, 20·8 g; Cu, 2·5 g; ferrous Fe, 10·0 g; Mg, 16·6 g; Mn, 15·0 g; Zn, 25·0 g.
¶ Yttrium oxide; Stanford Materials.
** Sydney Essential Oil Co.
†† Please refer to Table 1 for details.
Barramundi husbandry and growth
Juvenile barramundi (L. calcarifer) were sourced from the Betta Barra fish hatchery, on-grown in a 10 000 litre tank and fed a commercial diet (Marine Float; Ridley Aquafeed). Before commencement of the experiment, the fish were transferred to a series of experimental tanks (300 litre) with flow-through seawater (salinity=35 PSU; dissolved oxygen 4·6 (sd 0·15) mg/l) of 30·0 (sd 0·01)°C at a flow rate of about 3 l/min being supplied to each of the tanks. At the beginning of the experiment, each of the tanks held twenty-six fish of 47·0 (sd 0·3) g (n 624 individually weighed fish). The three experimental diets were randomly distributed among the nine tanks, with each treatment having three replicate tanks.
Sample collection, preparation and digestibility analysis
Ethical clearance was approved for the experimental procedures by the CSIRO animal ethics committee A10/2013. Six fish of similar size from the original stock were euthanised by an overdose of AQUI-S™ at the beginning of the experiment and stored at −20°C until analysis. A further six fish were dissected, and a sample of whole blood was removed from the caudal vein using 1 ml of pre-heparinised syringes and an 18 G needle. Blood from three fish was pooled in a single Vacutainer™ tube and then centrifuged at 10 000 rpm for 5 min to settle the erythrocytes. The plasma was then drawn off and transferred to a 1·5 ml Eppendorf™ tube and frozen at −80°C before being sent for chemical analysis. A sample of liver tissue for molecular analysis was removed from the initial fish and then FO CTRL and FO FREE fish at each fortnightly sampling event. We anticipated relatively minor changes in gene expression and therefore omitted the FO LOW samples from analysis. Samples were placed into 1·5 ml screw-top vials and kept on dry ice before being transferred to a −80°C freezer until analysis. All sampling procedures occurred 24 h after feeding in the post-absorptive phase( Reference Wade, Skiba-Cassy and Dias 24 ). Interim samples of individual fish (n 3) were collected in the same manner after each fortnightly period and upon termination after 56 d, and the remaining fish were returned to their respective tank after a short recovery.
Before the termination of the growth assay, faeces were collected using established settlement protocols( Reference Blyth, Tabrett and Bourne 25 ). Briefly, a collection chamber was filled with water and frozen and then attached to the evacuation line of a swirl separator and left overnight. The following morning, the collection chamber was removed and the chilled faeces were captured in a plastic sample container and stored at −20°C until analysis.
Abnormalities and behaviour assessment
The physical condition of individual fish was recorded at each fortnightly sampling event. Any fish that had symptoms such as erosion of the fins, reddening of the fins and extremities, gross lesions and physical deformities were recorded. For the assessment, fish were considered either normal or abnormal based on the presence or absence of at least one symptom. A percentage score was given to each tank, and each tank was used as a replicate within each treatment. The behaviour of each tank of fish was assessed by an operator holding a hand over the corner of a tank to simulate commencement of a feeding event. Fish activity was scored as being either cryptic (0), ambivalent to the hand (1) or actively searching for food (2). This assessment was carried out before feeding on the same day of each week by the same operator to maintain consistency, and the results were averaged across time to give a repeated measures response to each tank. Each tank was used as a replicate within each treatment( Reference Glencross and Rutherford 23 ).
Chemical analysis
Before analysis, the diets were each ground to a fine powder using a bench grinder (KnifeTec™ 1095; FOSS). The initial and final fish were processed using the following method. The whole fish were passed through a commercial meat mincer (MGT-012) twice to obtain a homogeneous mixture. A sample was taken for DM analysis, and another sample was freeze-dried along with the faecal samples until no further loss of moisture was observed (Alpha 1–4). DM was calculated by gravimetric analysis following oven drying at 105ºC for 24 h. Crude protein was calculated after the determination of total N by organic elemental analysis (CHNS-O Flash 2000; Thermo Scientific), based on N×6·25. Total lipid content was determined gravimetrically following extraction of the lipids using chloroform–methanol (2:1) according to the method by Folch et al. ( Reference Folch, Lees and Sloane Stanley 26 ). Gross ash content was determined gravimetrically following loss of mass after combustion of a sample in a muffle furnace at 550°C for 24 h. Gross energy was determined by adiabatic bomb calorimetry (Parr 6200 Calorimeter). Total yttrium concentration in the diets and faeces was determined after nitric acid digestion in a laboratory microwave digester (Ethos One; Milestone) using inductively coupled plasma (ICP)-MS (ELAN DRC II; Perkin Elmer).
Plasma samples were sent to the West Australian Animal Health Laboratories for enzyme and chemistry assessment. The assays were run on an Olympus AU400 automated chemistry analyser (Olympus Optical Co. Ltd). Each of the assays used was a standard kit developed for the auto-analyser. The tests performed included alanine aminotransferase (ALT, EC.2.6.1.2) (Olympus kit Cat. No. OSR6107), creatine kinase (CK, EC 2.7.3.2) (Olympus kit Cat. No. OSR6179), glutamate dehydrogenase (GLDH, EC.1.4.1.2) (Randox kit Cat. No. GL441), total protein (Olympus kit Cat. No. OSR6132), creatinine (Olympus kit Cat. No. OSR6178), alkaline phosphatase (Olympus kit Cat. No. OSR6004), glucose (Olympus kit Cat. No. OSR6121), Hb (Randox kit Cat. No. HG1539) and haptoglobin (Randox kit Cat. No. HP3886). Trace elements were determined after mixed acid digestion using ICP-MS.
Fatty acid composition was determined according to the methods of Christie( Reference Christie 27 ). Lipids were esterified by an acid-catalysed methylation, and 0·3 mg of an internal standard was added to each sample (21:0 Supelco). The fatty acids were identified relative to the internal standard following separation by GC. An Agilent Technologies 6890 N GC system (Agilent Technologies) fitted with a DB-23 capillary column and flame ionisation detection was used. The temperature program was 50–175°C at 25°C/min and then 175–230°C at 2·5°C/min. The injector and detector temperatures were set at 250 and 320ºC, respectively. The column head pressure was set to constant pressure mode at 170 kPa using H2 as the carrier gas. The peaks were identified by comparing retention times with the internal standard and further referenced against known standards (37 Comp. FAME mix; Supelco). The resulting peaks were then corrected by the theoretical relative flame ionization detector response factors( Reference Ackman 28 ) and quantified relative to the internal standard.
RNA extraction and normalisation
Total RNA was extracted from the FO CTRL and FO FREE liver samples using Trizol reagent (Invitrogen) according to the manufacturer’s instructions. RNA was precipitated using equal volumes of precipitation solution (1·2 m sodium chloride and 0·8 m-disodium citrate) and isopropyl alcohol( Reference Green and Sambrook 29 ). To eliminate any residual traces of DNA, total RNA was DNase-digested with the Turbo DNA free kit (Applied Biosystems). To verify that RNA was not contaminated, an aliquot of DNase-digested RNA from each sample was pooled (n 54) and later PCR-amplified as a negative control. A NanoDrop spectrophotometer (NanoDrop Technologies) was used to asses RNA quantity, and a Bioanalyser (Agilent Technologies) using RNA nanochips (Agilent #5067-1511) was used to asses RNA quality. All RNA samples were normalised to 200 ng/µl.
Quantitative real-time RT-PCR
Reverse transcription was performed on 1 µg of total RNA using Superscript III (Invitrogen) with 25 µm oligo (dT)20 and 25 µm random hexamers( Reference Resuehr and Spiess 30 ). Expression of a range of genes involved in fatty acid metabolism was analysed by real-time PCR, as described below. Real-time PCR amplification reactions were carried out using 2X SYBR Green PCR Master Mix (Applied Biosystems), 0·2 µm Real-Time PCR primers specific to each gene (Table 3) and the equivalent of 7·5 ng of reverse-transcribed RNA. Amplification cycle conditions were 2 min at 50°C, 10 min at 95°C followed by forty cycles of 15 s at 95°C and 40 s at 60°C. After amplification, a melt curve analysis was routinely performed to verify the specificity of the target gene. Reactions were set up using the epMotion 5070 robot (Eppendorf) and run in triplicate on a Viia7 real-time PCR system (Applied Biosystems). Changes in expression levels of each gene over the 8-week trial (denoted WK0, WK2, WK4, WK6 and WK8) were determined by normalising the cycle threshold values for each gene to elongation factor 1α (EF1α) and Luciferase reference genes, and then to the cycle threshold of each gene at time zero (WK0). The variation in amplification of EF1α was 1·24 cycles and Luciferase was 0·58 cycles, and this did not significantly change over time. The EF1α and Luciferase genes are routinely used as a reference in this species( Reference Wade, Skiba-Cassy and Dias 24 , Reference De Santis, Smith-Keune and Jerry 31 ).
Real-time quantitative PCR (qPCR) primer pairs for target genes involved in fatty acid metabolism

NA, not analysed.
Calculations and statistical analysis
Differences in the ratio of DM, protein, lipid and energy to yttrium in the diet and faeces were calculated to determine the apparent digestibility coefficients following Maynard and Loosli( Reference Maynard and Loosli 32 ). Nutrient retention efficiencies were calculated as the ratio of the nutrient or specific fatty acid gained relative to their respective consumption during the study period following Maynard and Loosli( Reference Maynard and Loosli 32 ). The computation of apparent in vivo fatty acid β-oxidation was performed using the whole-body fatty acid balance method following Turchini et al. ( Reference Turchini, Francis and De Silva 33 ).
All data were checked for normal distribution and homogeneity of variance by qualitative assessment of residual and normal Q-Q plots using the RStudio package version 0.98.501( 34 ). Any percentage data were arcsine transformed before analysis. All growth performance, digestibility and fatty acid data were analysed by one-way ANOVA using the RStudio package version 0.98.501( 34 ). Levels of significance were compared using Tukey’s honest significant difference a posteriori test with significance among treatments defined as P<0·05. In addition, repeated-measures analysis was used for growth performance parameters (live-weight, gain, feed intake and feed conversion ratio (FCR)), plasma chemistry and gene expression data using the RStudio package version 0.98.501( 34 ). Pairwise comparisons using paired t tests with Holm adjusted P values were used to compare levels of significance.
Results
Growth and feed utilisation
During the 56 d growth assay, the fish responded readily to the experimental diets, and growth in the control group was consistent with the predicted model growth, achieving 106 % of the modelled potential( Reference Glencross and Bermudes 35 ). When analysed by one-way ANOVA, there was a significant difference in live weight after 2 weeks of feeding on the experimental diets, with the fish fed the FO LOW and FO FREE diets being smaller from those fed the FO CTRL diet. By 6 weeks of feeding, there was a significant difference among all three groups of fish, and this remained the same at 8 weeks. The same results were found with weight gained (Table 4). When the live weight, weight gain and FCR data were analysed with a repeated measures design, there was a significant interaction effect of the diets after controlling for time (repeated) measurements (Table 5). There was no difference in feed intake among the groups of fish; however, there was a significant difference in FCR between the FO CTRL- and FO FREE-fed fish (Tables 4 and 5). There were no differences in terms of survival with only one fish removed from the system.
Growth performance and feed utilisation of barramundi fed experimental diets for 8 weeks
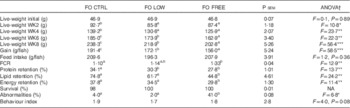
FCR, feed conversion ratio; FO CTRL, control diet containing only fish oil; FO FREE, fish oil with no n-3 LC-PUFA; FO LOW, low inclusion of fish oil; LC-PUFA, long-chain PUFA; NA, not analysed; P sem, pooled sem; WK, week.
a,b,c Values within a row with unlike superscript letters were significantly different.
* P<0·05, ** P<0·01, *** P<0·001.
† One-way ANOVA df 2,6, post hoc Tukey’s honest significant difference, percentage data were arcsine transformed before analysis, any values <0·01 are reported as 0·1.
Split-plot ANOVA for repeated measures design of growth performance and feed utilisation parameters in juvenile barramundi
FCR, feed conversion ratio.
† Two-way repeated measures ANOVA, df residuals 6,24 (live weight), df residuals 6,18 (gain, FCR, intake).
The total lipid was significantly more digestible in the FO CTRL-fed fish than in the FO FREE-fed fish (Table 6). There were several significant differences in specific fatty acid digestibility. The n-3 LC-PUFA including EPA and DHA were all completely digested by the fish fed FO LOW and FO FREE diets, whereas the FO CTRL-fed fish digested less of these fatty acids (Table 6). Although significant, the numerical differences were minor. The digestibility of total SFA was significantly different, with fish fed the FO FREE diet able to digest more than the fish fed the FO CTRL diet.
Apparent digestibility of macronutrients and fatty acids present in the experimental diets
FO CTRL, control diet containing only fish oil; FO FREE, fish oil with no n-3 LC-PUFA; FO LOW, low inclusion of fish oil; LC-PUFA, long-chain PUFA; NA, not analysed; P sem, pooled sem.
a,b Values within a row with unlike superscript letters were significantly different.
* P<0·05.
† One-way ANOVA df 2,6, post hoc Tukey’s honest significant difference, percentage data were arcsine transformed before analysis, any values <0·01 are reported as 0·1.
Biochemical analysis
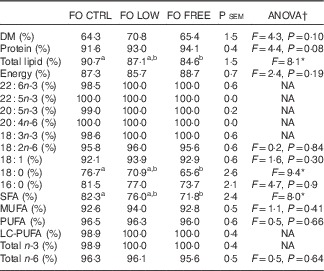
There were significant differences in macronutrient retention of the fish after 8 weeks of feeding, with the control-fed fish retaining more protein, lipid and gross energy than the FO LOW- and FREE-fed fish (Table 4). Generally, the fatty acid composition of the diets was reflected in the whole fish and also the liver tissue (Table 7). There were significant differences in most of the dominant fatty acids in the whole body, with the only exceptions being 18 : 3n-3 and 16 : 0 (Table 7). Similarly, in the liver, there were significant differences in most of the dominant fatty acids, with the exception of 18 : 2n-6, 18 : 3n-3 and 16 : 0 (Table 7).
Initial and final fatty acid composition of whole-body and liver tissue from juvenile barramundiFootnote †
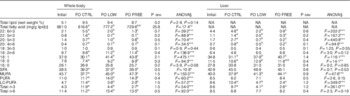
FO CTRL, control diet containing only fish oil; FO FREE, fish oil with no n-3 LC-PUFA; FO LOW, low inclusion of fish oil; LC-PUFA, long-chain PUFA; NA, not analysed; P sem, pooled sem.
a,b,c Values within a row with unlike superscript letters were significantly different.
* P<0·05, ** P<0·01, *** P<0·001.
† All fatty acid data are presented as percentage of total fatty acids (%) unless otherwise stated.
‡ Please refer to Table 1 for details.
§ One-way ANOVA df 2,6, post hoc Tukey’s honest significant difference.
Percentage data were arcsine transformed before analysis.
Any values <0·01 are reported as 0·1.
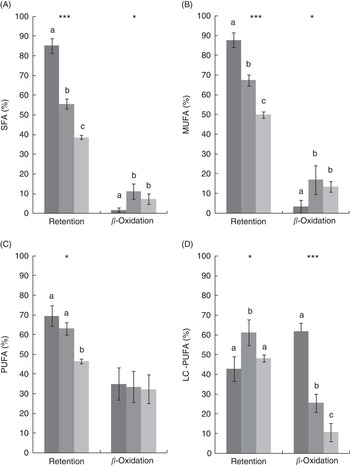
After 8 weeks, there was a significant decrease in the retention of SFA, MUFA and PUFA in the FO LOW- and FO FREE-fed fish compared with the FO CTRL-fed fish, whereas the LC-PUFA retention was highest in the FO LOW-fed fish (Fig. 1). In terms of calculated β-oxidation values, there was significantly less oxidation of total SFA and MUFA in the FO CTRL-fed fish. There was no difference in PUFA oxidation; however, significantly more LC-PUFA was oxidised in the FO CTRL-fed fish (Fig. 1).
(A–D) Mass–balance computations of fatty acid retention and β-oxidation in juvenile barramundi. Values are means (n 3), with their standard errors. SFA (A) retention F=82·5***, β-oxidation F=5·2*; MUFA (B) retention F=44·5***, β-oxidation F=7·0*; PUFA (C) retention F=10·8*, β-oxidation F=1·4, P=0·32; long-chain PUFA (D) retention F=6·1*, β-oxidation F=241·5***. Significant differences are indicated by asterisks (* P<0·05, *** P<0·001), one-way ANOVA df 2,6, post hoc Tukey’s honest significant difference. a,b,c Mean values with unlike letters were significantly different. ![]() , CTRL;
, CTRL; ![]() , LOW;
, LOW; ![]() , FREE.
, FREE.
Clinical observations
A range of abnormalities were observed during the experiment. These included red fins (typically caudal and pectoral), red skin, fin erosion, lesions and non-contributing (feed refusal) fish. The fish fed the FO FREE diet were significantly more affected by a range of abnormalities than the fish fed the FO LOW and FO CTRL diets (Table 4). There was no significant difference in the behavioural response of fish assessed by the methods described earlier (Table 4).
Sub-clinical parameters
A range of plasma chemistry parameters were assessed, and some significant differences were observed among the dietary treatments (Table 8). In all measured parameters, with the exception of GLDH and creatinine, there was a significant time effect. In most parameters, the numerical differences were relatively minor. Phosphate, Fe, Hb and haptoglobin all increased significantly after week 6. There was a significant diet effect on plasma cholesterol, with the lowest values recorded in the FO LOW- and FREE-fed fish. There was also a significant diet effect in plasma Fe being highest in the FO LOW-fed fish. Similarly, plasma haptoglobin was highest in the FO FREE-fed fish (Table 8).
Plasma chemistry parameters in juvenile barramundi fed experimental diets, sampled fortnightly for 8 weeks
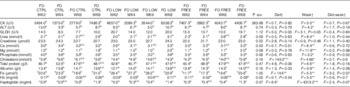
ALT, alanine transferase; CK, creatine kinase; FO CTRL, control diet containing only fish oil; FO FREE, fish oil with no n-3 LC-PUFA; FO LOW, low inclusion of fish oil; LC-PUFA, long-chain PUFA; GLDH, glutamate dehydrogenase; P sem, pooled sem; WK, week.
Two-way repeated measures ANOVA, df of residuals 6,18.
x,y,a,b Pre-superscript letters indicate significant differences among the diets and post-superscript letters indicate differences over time.
* P<0·05, ** P<0·01, *** P<0·001.
† Two-way repeated measures ANOVA, df of residuals 6,18.
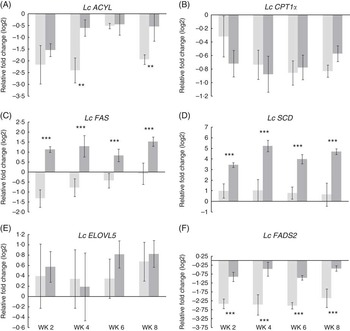
Expression of lipid metabolism-related genes in the liver of the FO CTRL and FO FREE fish were analysed by real-time quantitative PCR, and several significant differences were observed (Fig. 2). Repeated-measures analysis showed that there were no significant effects on the expression of carnitine palmitoyltransferase (Lc CPT1a) and elongation (Lc ELOVL5) genes. There was a significant diet effect on the expression of ATP citrate lyase (Lc ACYL), with the highest expression in the FO FREE-fed fish at week 4. Similarly, the expression of fatty acid synthase (Lc FAS) was approximately 2·5-fold higher in the FO FREE fish. The expression of steroyl CoA desaturase (Lc SCD) was significantly affected by the dietary treatment, with levels of expression in the FO FREE fish approximately 3- to 4-fold higher than the FO CTRL fish. There was a significant diet effect in the expression of fatty acid desaturase 6 (Lc FADS2), with approximately 2-fold higher expression among the FO FREE-fed fish. There were no significant time or interaction effects for the genes analysed.
(A–F) Expression of lipid metabolism genes in the liver of juvenile barramundi. All data are normalised to EF1α and Luc reference genes, log 2-transformed and expressed relative to the initial fish (week 0). Values are means (n 6), with their standard errors. The FO CTRL (control) groups are indicated by light bars, and the FO FREE groups are indicated by dark bars. Two-way repeated measures ANOVA, df of residuals 10,30. Lc ACYL, diet F=15·5**, week F=2·3, P=0·09, diet:week F=1·0, P=0·39; Lc CPT1a, diet F=0·2, P=0·69, week F=0·6, P=0·65, diet:week F=06, P=0·62; Lc FAS, diet F=48·5***, week F=1·4, P=0·28, diet:week F=0·8, P=0·50; Lc SCD, diet F=126·6***, week F=0·6, P=0·62, diet:week F=0·6, P=0·62; Lc ELOVL5, diet F=0·2, P=0·66, week F=0·4, P=0·78, diet:week F=0·2, P=0·92; Lc FADS2, diet F=75·4***, week F=0·7, P=0·59, diet:week F=0·2, P=0·91. Please refer to Table 3 for individual gene details.
Discussion
The onset of EFA deficiency on growth and feed utilisation in juvenile barramundi was evident after only 2 weeks of feeding the experimental diets. After 8 weeks, growth was clearly different among all three groups, suggesting that a primary feature of EFA deficiency is growth potential. In addition, there was a significant difference in the treatment by time interaction term for growth performance parameters. This interaction shows a clear progression towards the development of EFA deficiency in the FO LOW- and FO FREE-fed fish. This is in agreement with other studies showing reduced growth when carnivorous marine fish were fed with high levels of FO substitution( Reference Glencross, Hawkins and Curnow 36 – Reference Montero, Robaina and Caballero 38 ). In addition, consistent with the feed intake but with reduced growth, the feed conversion of FO FREE-fed fish was significantly poorer. The ability to define a response to a nutrient relies on being able to define any symptoms that may occur in its absence. The defatted FM used in the present study contained trace amounts of lipid and LC-PUFA. However, the inclusion of 15 % defatted FM was based on previous recommendations to achieve what is considered normal growth for this species( Reference Glencross and Bermudes 35 , Reference Glencross, Rutherford and Jones 39 ).
Early studies with barramundi demonstrated that decreased dietary lipid is associated with reduced growth, and in some cases EFA deficiency was inferred( Reference Catacutan and Coloso 2 , Reference Buranapanidgit and Boonyaratpalin 21 , Reference Williams, Barlow and Rodgers 22 , Reference Williams, Barlow and Rodgers 40 ). In the present study, the macronutrient levels were kept constant, as barramundi, similar to most other species, have an interdependent demand for energy and specific nutrients( Reference Glencross 41 ). The total lipid level was formulated to be lower than the known optimal requirement (>14 %) for fish of this size (<100 g) so that in this experimental design the lipid would theoretically be limiting and therefore cause the supply of this nutrient (and vagaries in its composition) to be the point of sensitivity in the study( Reference Glencross 41 ). Therefore, the differences in the present study are directly attributable to the fatty acid profile of the diets, resulting in EFA deficiency.
In the present study, the digestibility of total lipid was lowest in the FO FREE-fed fish consistent with other studies investigating FO replacement( Reference Caballero, Obach and Rosenlund 42 – Reference Ng, Sigholt and Bell 44 ). The apparent digestibility of specific fatty acids was not greatly modified by the dietary treatments, with the exception of the SFA. In the study of Olsen et al. ( Reference Olsen, Henderson and Ringø 45 ), 18 : 0 was reported to be less digestible than other saturates such as 16 : 0 and 14 : 0, and, in agreement, the reduction of total lipid digestibility of the present study is likely to be caused by the 18 : 0 composition of the feeds. Several studies have concluded that changes in lipid or fatty acid digestibility can result in reduced growth( Reference Karalazos, Bendiksen and Bell 46 – Reference Menoyo, Lopez-Bote and Diez 48 ), whereas others have found no such effect( Reference Caballero, Obach and Rosenlund 42 , Reference Torstensen, Lie and Froyland 43 ). The whole-body and liver fatty acid profiles in the present study showed some clear differences in terms of their composition; however, the tissue composition largely resembled that of the fed diet, also consistent with other studies( Reference Turchini, Francis and Senadheera 49 – Reference Glencross, Tocher and Matthew 51 ). A caveat of the present study was that the initial EFA composition of the fish was reflective of the commercial diet fed before experimentation. There was a slight reduction of total SFA in the whole body and a lack of any change in the liver, despite the different digestibility values and growth. Moreover, the LC-PUFA composition of the tissues in the FO FREE-fed fish was almost entirely depleted after 8 weeks, suggesting that the reduced digestibility of total SFA had no bearing on the overall composition of the fish.
Examination of the mass–balance relationship of dietary nutrients or indeed specific fatty acids in the tissues was used to reveal discrete differences in their utilisation. Improved protein retention and consequently weight gain was evident in the control group, consistent with previous studies on barramundi( Reference Williams, Barlow and Rodgers 22 ). The disproportionately low lipid and energy retention of the FO LOW- and FO FREE-fed fish is a response to the diets without adequate LC-PUFA. The FO CTRL-fed fish selectively retained more of the dietary SFA, MUFA and PUFA than the other fish; however, LC-PUFA were catabolised when in surplus to optimal tissue concentration, similar to observations from other carnivorous species such as Atlantic salmon, European sea bass, Murray cod and rainbow trout( Reference Turchini, Francis and Senadheera 49 , Reference Turchini and Francis 52 – Reference Stubhaug, Lie and Torstensen 54 ).
The aetiology of deficiency was less apparent in the FO LOW-fed fish. The total LC-PUFA concentration in the FO LOW diet with 1 % added FO was equivalent to 4·3 g/kg of the diet compared with 25·6 g/kg in the control diet. Currently available requirement data for barramundi suggest that an adequate dietary LC-PUFA supply should be at least 12 g/kg in growing barramundi( Reference Williams, Barlow and Rodgers 22 ). In agreement, Glencross and Rutherford( Reference Glencross and Rutherford 23 ) reasoned that provided EFA are kept in balance the total LC-PUFA requirement could be further revised. Despite the very low inclusion of LC-PUFA (FO LOW and FO FREE diets), there were no apparent effects of the diets on survival or behavioural changes. However, a range of physical abnormalities were observed in the FO FREE-fed fish, including erosion of the fins, reddening of the fins and extremities, gross lesions and physical deformities, symptoms that are associated with EFA deficiency in fish( Reference Castell, Sinnhuber and Wales 1 ). This observation suggests that even at very low inclusion levels of FO there was a marked improvement in the physical health of fish despite the reduced growth. Moreover, the whole-body composition data suggest that the FO LOW-fed fish maintained a proportion of LC-PUFA similar to that of the initial fish fed a commercially available diet. Therefore, in support of the previous studies on this species, we too support that LC-PUFA supply should be at least 12 g/kg in growing barramundi.
A range of plasma biochemical markers were used in the assessment of EFA deficiency over the 8-week time course. The results suggest that only minor changes occurred and mostly on a temporal basis. There were no significant diet or interaction effects observed for the enzyme markers CK, ALT or GLDH. Elevated ALT and GLDH activity is considered a reliable marker of liver cell necrosis that can be characterised by the depletion of hepatic LC-PUFA stores( Reference Van Waes and Lieber 55 – Reference Morton, Blyth and Bourne 57 ). However, in support of previous work with the same species, CK, ALT and GLDH levels in the present study were not affected by the lipid composition of the diets( Reference Glencross and Rutherford 23 ). In the identification of underlying organ failure or disease, there can be a concomitant change in concentration of circulating urea, Ca, Mg, phosphate and albumin( Reference Hjelte, Larsson and Alvestrand 58 ). However, in the present study, these markers only differed significantly on a temporal basis, generally increasing after week 2. It could be argued that the general increase in the markers is because of an adaptation to the experimental diets rather than a treatment effect.
In the present study, there was a marked decrease in plasma cholesterol levels in the FO LOW- and FO FREE-fed fish after only 2 weeks of feeding the experimental diets. Increasing DHA alone in barramundi did not result in any change in plasma cholesterol( Reference Morton, Blyth and Bourne 57 ). However, the replacement of FO with vegetable oil in Atlantic salmon diets led to hypocholesterolaemia( Reference Glencross, Tocher and Matthew 51 , Reference Richard, Mourente and Kaushik 59 ). In light of these findings, it is likely that cholesterol derived from FO is beneficial in fish, including the barramundi, as it can potentially modulate energy expenditure and fatty acid metabolic pathways( Reference Norambuena, Lewis and Hamid 60 ).
Consistent with other studies, nutritionally regulated gene expression in the FO CTRL-fed fish appear to follow a normal progression of desaturation and elongation of fatty acid to their longer-chain and less-saturated derivatives( Reference Tu, Muhlhausler and James 5 , Reference Mohd-Yusof, Monroig and Mohd-Adnan 6 , Reference Wade, Skiba-Cassy and Dias 24 ). Transcription of Lc ACYL produces acetyl-CoA, which is a substrate for many biosynthetic pathways including lipogenesis, and in the present study Lc ACYL was up-regulated in the EFA-deficient fish( Reference Dias, Alvarez and Diez 61 ). There was no significant effect in the expression of Lc ELOVL5 or Lc CPT1a; however, there was a tendency towards higher expression in the FO FREE-fed fish. CPT1a is considered a key enzyme in the regulation of mitochondrial oxidation, and in the present study CPT1a was down-regulated in both treatments compared with the initial fish( Reference Torstensen, Lie and Froyland 43 ). This effect is likely to be caused by the low lipid levels of all three diets, a strategy that was intended to highlight the potential effects of EFA deficiency. This study also found that desaturase enzymes (Lc SCD and Lc FADS2) in barramundi were significantly up-regulated in fish fed the FO FREE diet. This is in agreement with other studies, on a range of species, showing an up-regulation of desaturase enzymes (including both SCD and FADS2) in response to reduced FO( Reference Alhazzaa, Bridle and Nichols 62 – Reference Betancor, Howarth and Glencross 65 ). Lc FAS expression in the present study was also significantly up-regulated in fish fed the FO FREE diet. Although the FAS enzyme system has rarely been investigated in fish in response to FO replacement, it is an important step in the initial synthesis of palmitate from acetyl-CoA.
Conclusion
In conclusion, the results of this study report comprehensively the aetiology of the onset and progression of EFA deficiency in barramundi. The EFA-deficient diets clearly impacted growth performance and feed utilisation in as little as 2 weeks. Discrete differences in the utilisation of dietary lipid and also specific fatty acids suggest that in the absence of EFA signs of deficiency were evident, substantiating their essentiality in barramundi. In addition, a range of clinical abnormalities manifested in the fish fed the FO FREE diet. Transcription of genes involved in fatty acid metabolism consistently demonstrated that those fish receiving the FO FREE diet were compromised after as little as 2 weeks, lending support to the hypothesis that assessment on a temporal basis is important in fatty acid studies on fish.
Acknowledgements
The authors thank and acknowledge the technical assistance provided by Bruno Araujo, David Blyth, Natalie Habilay, Simon Irvin, Kinam Salee and Richard Thaggard at the Bribie Island Research Centre (BIRC), Queensland, Australia.
This research received no specific grant from any funding agency, commercial or not-for-profit sectors.
Authors’ responsibilities were as follows: M. J. S., G. M. T. and B. D. G. designed the experiment. M. J. S. conducted the experiment, laboratory analyses and analysed the data. N. M. W. provided valuable instruction on molecular techniques and analysis and M. J. S. wrote the manuscript. All authors read and approved the final version of the manuscript.
There are no conflicts of interest to declare.


