

Exercise results in an increase in energy expenditure, heat production and the initiation of the sweat response to help dissipate some of the heat produced. It has been commonly reported that during exercise, athletes lose more fluid through sweat than they gain through drink ingestion, and thus they finish exercise in a hypohydrated state( Reference Shirreffs, Armstrong and Cheuvront 1 ). In situations where two exercise bouts are completed in close proximity, effective and rapid rehydration after the first bout of exercise will be required if performance in the second bout is not to be affected( Reference Judelson, Maresh and Farrell 2 ). As long as a sufficient volume of a rehydration solution is consumed( Reference Shirreffs, Taylor and Leiper 3 ), the main factors that determine how much of the solution is retained are the rate at which it is consumed( Reference Jones, Bishop and Green 4 ) and its composition( Reference Maughan, Shirreffs and Leiper 5 – Reference Seifert, Harmon and DeClercq 14 ). It is likely that these factors exert their effects on rehydration via the inclusion of osmotic substances that enhance water retention or by influencing the rate of appearance in the peripheral circulation, thus attenuating serum osmolality and arginine vasopressin responses.
It has been shown that increasing the Na( Reference Maughan and Leiper 6 , Reference Shirreffs and Maughan 9 , Reference Merson, Maughan and Shirreffs 10 ) or carbohydrate( Reference Evans, Shirreffs and Maughan 7 , Reference Osterberg, Pallardy and Johnson 11 ) concentration of a rehydration solution consumed after exercise increases the fraction of the ingested solution that is retained. It has also been shown that low-fat milk is better retained than a carbohydrate–electrolyte sports drink( Reference Shirreffs, Watson and Maughan 12 , Reference Watson, Love and Maughan 13 ); however, the number of compositional differences between low-fat milk and sports drinks (energy density, carbohydrate content and type, protein content, Na content and K content) makes it difficult to determine the compositional factor in low-fat milk that increases drink retention. A number of recent studies have reported the specific effects of intact milk protein( Reference James, Clayton and Evans 8 ) or the whey fraction of milk protein( Reference Seifert, Harmon and DeClercq 14 , Reference James, Gingell and Evans 15 ) on rehydration after exercise. Seifert et al. ( Reference Seifert, Harmon and DeClercq 14 ) reported that the addition of 15 g/l whey protein to a 60 g/l carbohydrate–electrolyte solution increased the amount of solution retained compared with a 60 g/l carbohydrate solution or flavoured water. In contrast, James et al. ( Reference James, Gingell and Evans 15 ) reported that when matched for energy density, there was no difference in the retention of a 65 g/l carbohydrate solution or a 50 g/l carbohydrate, 15 g/l whey protein isolate solution. The methodological differences between these two investigations may account for the disparate results observed. Conversely, James et al. ( Reference James, Clayton and Evans 8 ) demonstrated that after exercise-induced dehydration, a solution containing 40 g/l carbohydrate, 25 g/l milk protein resulted in greater fluid retention than an isoenergetic 65 g/l carbohydrate solution.
It appears that at least some of the increased drink retention observed with the ingestion of low-fat milk( Reference Shirreffs, Watson and Maughan 12 , Reference Watson, Love and Maughan 13 ) compared with sports drinks might be related to the protein present in the milk. The study of James et al. ( Reference James, Clayton and Evans 8 ) used a protein content below that of low-fat bovine milk (approximately 36 g/l)( Reference Shirreffs, Watson and Maughan 12 , Reference Watson, Love and Maughan 13 ), and it is unknown whether increasing the protein content of a rehydration solution above 25 g/l might further increase drink retention. The purpose of the present study was therefore to compare solutions of systematically increasing milk protein concentrations (0, 20 and 40 g/l milk protein) on rehydration after exercise, with solutions matched for energy density, as well as Na and K concentrations.
Methods
Subjects
The present study was conducted according to the guidelines laid down in the Declaration of Helsinki, and all procedures involving human subjects were approved by the Nottingham Trent University School of Science and Technology Ethics Committee. Written and verbal informed consent was obtained from all subjects, and they completed a medical screening questionnaire. A total of eight healthy males (age 21·9 (sd 2·0) years, height 1·76 (sd 0·08) m and body mass 76·96 (sd 8·73) kg) volunteered to participate in the present investigation.
Experimental protocol
All subjects completed an initial familiarisation trial and three experimental trials, which were administered in a randomised, double-blind manner. All experimental trials were carried out on the same day of the week and were separated by at least 7 d.
In the 24 h preceding the first experimental trial, subjects recorded their dietary intake and physical activity, and then replicated these patterns of dietary intake and physical activity for the 24 h before the second and third experimental trials. Subjects also refrained from alcohol intake and strenuous exercise in the 24 h preceding each experimental trial.
During the familiarisation trial, subjects completed the dehydration and rehydration protocols described in detail below and remained in the laboratory for 1 h after rehydration. For the main trials, subjects arrived in the morning following an overnight fast, with the exception of 500 ml plain water, consumed 2 h before arriving at the laboratory.
Dehydration phase
Upon arrival at the laboratory, subjects voided their bladder (pre-exercise) and their body mass was measured (wearing dry boxer shorts only) to the nearest 10 g (Adam CFW150; Adam Equipment Co Limited). Subjects then exercised in a temperature- (35·0 (sd0·1)°C) and humidity (51·8 (sd5·9) % relative humidity)-controlled environmental chamber (Design Environmental Limited) until they had lost 1·6 % of their initial body mass. Due to continued sweating post-exercise and before the final body mass measurement, target body mass loss was approximately 2 % initial body mass. Exercise began at an intensity of approximately 2 W/kg body mass and was performed on a friction-braked cycle ergometer (Monark Ergomedic E874, Cranlea), with subjects completing 10 min blocks of exercise, separated by 5 min rest in the chamber. Body mass (wearing boxer shorts only) was measured during the rest periods, and this pattern of exercise and rest continued until subjects had achieved the desired body mass reduction. Subjects were then given 15 min to shower and after thoroughly towel drying, body mass was again measured (wearing dry boxer shorts only) to determine the total body mass reduction (target body mass loss approximately 2 %), before subjects provided a urine sample (post-exercise).
Rehydration phase
Subjects then ingested a volume of drink (in litres) equivalent to 150 % of the total body mass loss (in kg) over a period of 1 h. The volume of drink was provided in four aliquots of equal volume at 15 min intervals (0, 15, 30 and 45 min) over the 1 h rehydration period, and subjects consumed each aliquot within 15 min. At the end of the rehydration period, subjects provided a urine sample (0 h). Subjects consumed a different drink during each trial and the drinks were administered in a randomised, double-blind manner. Drinks (Table 1) were matched for energy and electrolyte content, with the only difference between the drinks being the carbohydrate and protein content. The protein contained in the drinks was in the form of a commercially available protein supplement derived from the cold ultrafiltration of skimmed bovine milk (Milk Protein Smooth; Myprotein.co.uk). The protein supplement contributed a small amount of fat (1·3 g/100 g), so a small amount of olive oil was added to two of the experimental drinks: carbohydrate (60 g/l) solution (C); and carbohydrate (40 g/l), milk protein (20 g/l) solution (CP20). The protein supplement also contributed a small amount of lactose (6·3 g/100 g), so maltodextrin added to the C and CP20 drinks was adjusted to match the drinks in terms of energy content. The drinks had a small amount (100 ml/l) of sugar-free squash added in an attempt to mask the drink contents. Furthermore, small amounts of NaCl and KCl were added to the drinks to give a final Na concentration of 20 mmol/l and a final K concentration of 5 mmol/l. The drinks were made up approximately 1 h before consumption and kept at room temperature. Each drink was mixed thoroughly and its temperature was measured before serving. The drink temperature at serving was 15·0 (sd 1·2)°C (C), 16·1 (sd 2·0)°C (CP20) and 16·2 (sd 1·9)°C (carbohydrate (20 g/l), milk protein (40 g/l) solution; CP40), and was not different between the trials (P= 0·433).
Energy density, osmolality, protein content, fat content, sodium concentration and potassium concentration of the experimental drinks (Mean values and standard deviations)
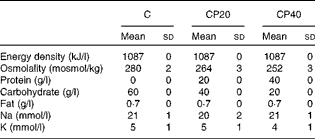
C, carbohydrate (60 g/l) solution; CP20, carbohydrate (40 g/l), milk protein (20 g/l) solution; CP40, carbohydrate (20 g/l), milk protein (40 g/l) solution.
Monitoring phase
Subjects then rested in the laboratory (20·4 (sd 1·7)°C and 33·3 (sd 7·7) % relative humidity) for a further 4 h, during which they provided a urine sample every hour (1, 2, 3 and 4 h). At the end of the monitoring phase, a final body mass measurement (wearing dry boxer shorts only) was made.
Subjects completed questionnaires related to their subjective feelings immediately before each urine sample (pre-exercise, − 1, 0, 1, 2, 3 and 4 h). Subjects were asked to rate their subjective feelings of stomach fullness, bloating and hunger using a 100 mm visual analogue scale, with 0 mm representing ‘not at all’ and 100 mm representing ‘very’. Additional questions on sweetness, saltiness, bitterness and pleasantness of the rehydration solutions were asked at 0 h.
Sample analysis
For each urine sample, subjects were instructed to completely empty their bladder into the container provided. The volume of each urine sample was measured and a small aliquot (approximately 5 ml) retained for subsequent analysis. A sample of each drink was also retained for subsequent analysis. Urine and drink samples were stored at 4°C, before being analysed for osmolality by freezing point depression (Gonotec Osmomat 030 Cryoscopic Osmometer; Gonotec), as well as Na and K concentrations by flame photometry (Corning Clinical Flame Photometer 410C; Corning Limited).
Statistical analysis
Data are presented as means and standard deviations. All data were analysed using SPSS 18.0 (SPSS, Inc.). All data were checked for the normality of distribution using a Shapiro–Wilk test. All data containing two variables were then analysed using a two-way repeated-measures ANOVA. Significant differences were located using Bonferroni-adjusted paired t tests for normally distributed data or Bonferroni-adjusted Wilcoxon signed-rank tests for non-normally distributed data. Variables containing one factor (e.g. drink perception) were analysed using one-way repeated-measures ANOVA followed by Bonferroni-adjusted paired t tests or Friedman's ANOVA followed by Bonferroni-adjusted Wilcoxon signed-rank tests as appropriate. Differences were accepted as being significant when P <0·05.
Results
Pre-trial measurements
At the beginning of each experimental trial, there was no difference in the subjects' body mass (77·12 (sd 8·08) kg (C), 76·76 (sd 7·73) kg (CP20) and 77·23 (sd 8·16) kg (CP40); P= 0·153) or urine osmolality (558 (sd 214) mosmol/kg (C), 399 (sd 202) mosmol/kg (CP20) and 484 (sd 201) mosmol/kg (CP40); P= 0·195). This indicates that subjects started each trial in a similar state of hydration.
Dehydration and rehydration phase
The exercise time required to reach the desired body mass reduction (approximately 1·6 % of initial body mass) was not different between the trials (P= 0·936) and amounted to 60 (sd 6) min (C), 60 (sd 12) min (CP20) and 59 (sd 12) min (CP40), with a total time for heat exposure of 84 (sd 11) min for overall trials. Similarly, workload during exercise was not different between the trials (P= 0·460) and over all trials was 127 (sd 22) W. The dehydration protocol resulted in similar total reductions in body mass (P= 0·340), which amounted to 1·41 (sd 0·13) kg over all trials, representing 1·85 (sd 0·10) % (C), 1·81 (sd 0·12) % (CP20) and 1·83 (sd 0·08) % (CP40) of subjects' pre-trial body mass. As body mass loss was not different between the trials, the total volume of the rehydration drink ingested was also similar between the trials (P= 0·510), amounting to 2115 (sd 199) ml (C), 2085 (sd 174) ml (CP20) and 2118 (sd 207) ml (CP40).
Urine volume, drink retention and net fluid balance
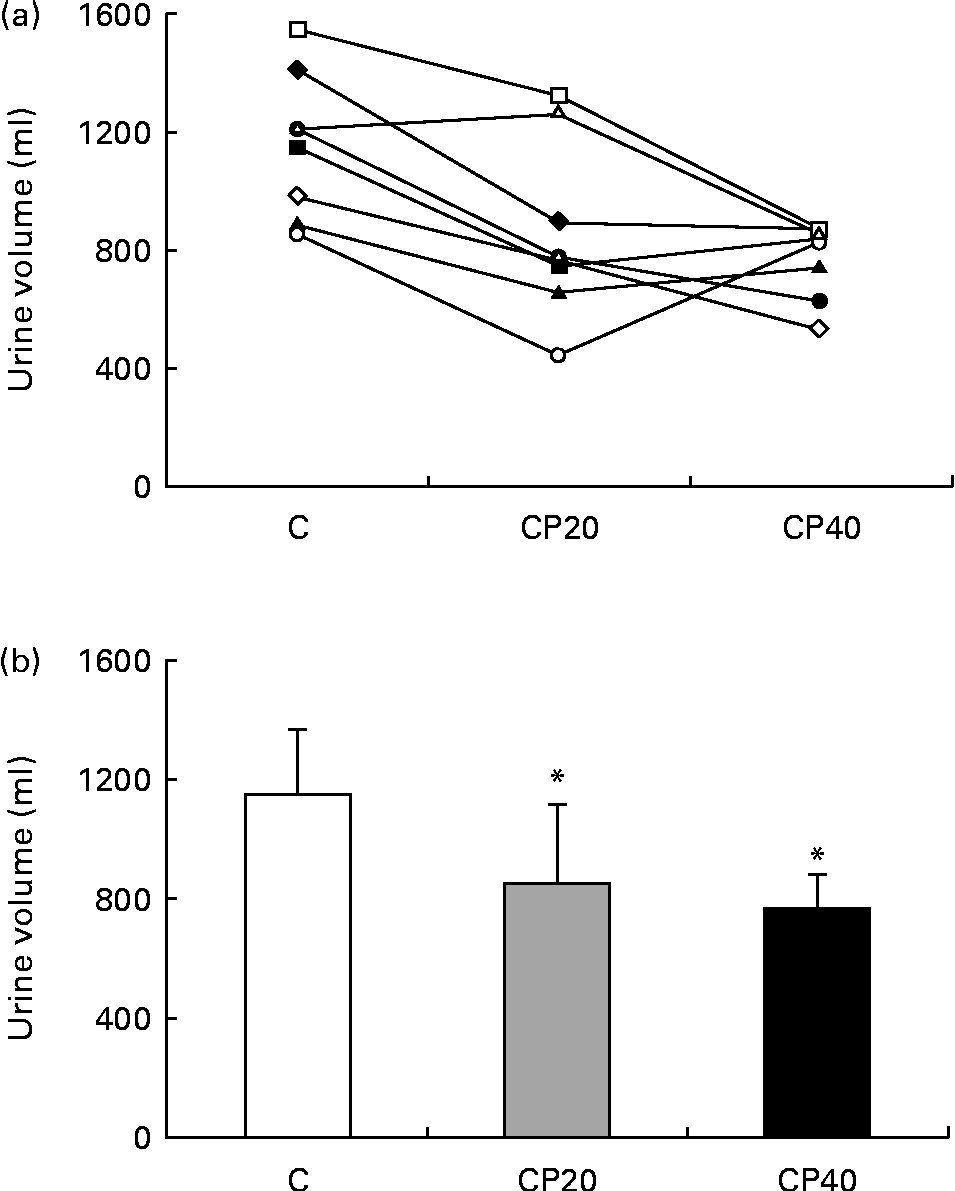
The total cumulative urine volume produced after drink ingestion (Fig. 1) was reduced during the CP40 and CP20 trials compared with the C trial (P< 0·01), but was not different between the CP20 and CP40 trials (P= 1). In line with this, the fraction of the ingested drink that had been retained at the end of the study (calculated from the volume of the drink ingested during rehydration and the volume of urine produced after/during drinking) was greater during trials CP20 (58 (sd 12) %) and CP40 (64 (sd 6) %) compared with trial C (46 (sd 9) %). Urine volume produced during each hour of the study (data not shown) peaked at 1 h during all trials, and compared with − 1 h, urine volume was greater at 1, 2 and 3 h during trials C and CP20 (P< 0·05), but was only greater at 1 h during trial CP40 (P< 0·001), although urine volume tended to be greater at 2 h (P= 0·090) and 3 h (P= 0·060). Furthermore, urine volume was greater during trial C compared with trial CP40 at 1 h (P< 0·01) and 2 h (P< 0·01) and with trial CP20 at 2 h (P< 0·01).
Total urine output after drinking (a) for each subject and (b) for the whole group. C, carbohydrate (60 g/l) solution; CP20, carbohydrate (40 g/l), milk protein (20 g/l) solution; CP40, carbohydrate (20 g/l), milk protein (40 g/l) solution. Values are means, with standard deviations represented by vertical bars. * Mean value was significantly different from that of trial C (P< 0·01).
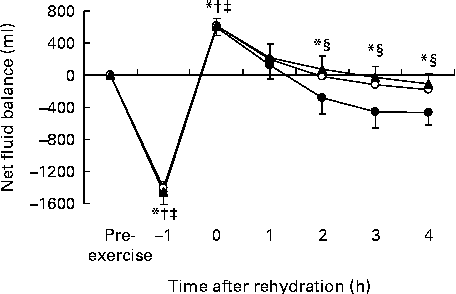
The whole-body net fluid balance (Fig. 2) was calculated from fluid losses through sweating during exercise (calculated from changes in body mass) and urine production, and fluid gain through drink ingestion. The whole-body net fluid balance was negative for all trials ( − 1461 (sd 150) ml (C), − 1432 (sd 150) ml (CP20) and − 1456 (sd 131) ml (CP40)) at the end of exercise ( − 1 h), and had become positive for all trials (591 (sd 96) ml (C), 598 (105) ml (CP20) and 615 (sd 96) ml (CP40)) at the end of rehydration (0 h). From the end of rehydration, continuing urine production meant that the net fluid balance decreased during all trials. The net fluid balance was greater from 2 h for both trials CP20 and CP40 compared with trial C, and tended to be greater at 1 h during trial CP40 compared with trial C (P= 0·072). There were no differences in net fluid balance between trials CP20 and CP40 (P>0·690). At the end of the study, the net fluid balance was − 470 (sd 154), − 181 (sd 280) and − 107 (sd 126) ml for trials C, CP20 and CP40, respectively.
Net fluid balance during trials C (●), CP20 (○) and CP40 (▲). C, carbohydrate (60 g/l) solution; CP20, carbohydrate (40 g/l), milk protein (20 g/l) solution; CP40, carbohydrate (20 g/l), milk protein (40 g/l) solution. Values are means, with standard deviations represented by vertical bars. * Mean value was significantly different for trial C from pre-exercise (P< 0·05). † Mean value was significantly different for trial CP20 from pre-exercise (P< 0·001). ‡ Mean value was significantly different for trial CP40 from pre-exercise (P< 0·001). § Mean value was significantly different for trial C from both trials CP20 and CP40 (P< 0·01).
Urine osmolality and electrolyte excretion
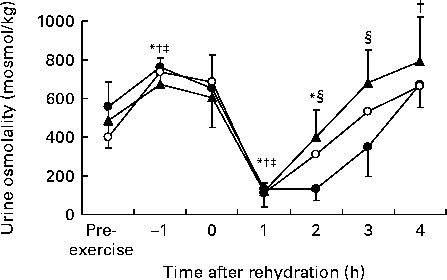
The exercise-induced dehydration phase of the protocol resulted in an increase in urine osmolality (Fig. 3) in all trials (P< 0·05) and over all trials was 480 (sd 207) mosmol/kg pre-exercise and 709 (sd 107) mosmol/kg at − 1 h. Compared with pre-exercise, urine osmolality was significantly decreased at 1 h during all trials (P< 0·05) and remained significantly decreased at 2 h during trial C (P< 0·01). Additionally, at 4 h, urine osmolality increased compared with pre-exercise during trial CP20 (P< 0·05) and tended to be increased during trial CP40 (P= 0·061). Furthermore, urine osmolality was greater at 2 h (P< 0·01) and 3 h (P< 0·05) during both trials CP20 and CP40 compared with trial C.
Urine osmolality during trials C (●), CP20 (○) and CP40 (▲). C, carbohydrate (60 g/l) solution; CP20, carbohydrate (40 g/l), milk protein (20 g/l) solution; CP40, carbohydrate (20 g/l), milk protein (40 g/l) solution. Values are means, with standard deviations represented by vertical bars. * Mean value was significantly different for trial C from pre-exercise (P< 0·05). † Mean value was significantly different for trial CP20 from pre-exercise (P< 0·05). ‡ Mean value was significantly different for trial CP40 from pre-exercise (P< 0·05). § Mean value was significantly different for trial C from both trials CP20 and trial CP40 (P< 0·05).
There were no differences between the trials (P>0·345) for the cumulative amount of Na and K (Table 2) excreted in the urine after drink ingestion.
Urinary sodium (mmol) and potassium (mmol) excretion after drink ingestion during the experimental trials (Mean values and standard deviations)
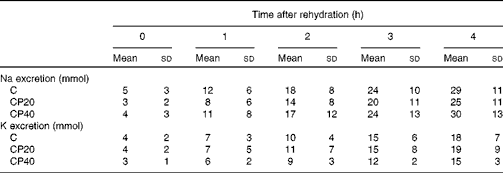
C, carbohydrate (60 g/l) solution; CP20, carbohydrate (40 g/l), milk protein (20 g/l) solution; CP40, carbohydrate (20 g/l), milk protein (40 g/l) solution.
Subjective feelings
Subjective feelings of stomach fullness, bloating and hunger demonstrated main effects for time (P< 0·01), but there were no main effects for trial (P>0·093) or any interaction (P>0·287). Subjects perceived no difference between the drinks in terms of sweetness (P= 0·077), saltiness (P= 0·262) and bitterness (P= 0·124), but perceived drink C (74 (sd 14) mm) to be more pleasant than drink CP20 (34 (sd 29) mm) (P< 0·05) and tended (P= 0·066) to perceive drink CP40 (62 (sd 19) mm) as more pleasant than drink CP20.
Discussion
The results of the present experiment demonstrate that after exercise in a hot environment, resulting in a 1·83 (sd 0·10) % reduction in body mass, the net fluid balance at the end of the study period was greater after the ingestion of a 20 g/l milk protein, 40 g/l carbohydrate solution ( − 181 (sd 280) ml) or a 40 g/l milk protein, 20 g/l carbohydrate solution ( − 107 (sd 126) ml) compared with after ingestion of a 60 g/l carbohydrate solution ( − 470 (sd 154) ml). However, although increasing the milk protein content from 20 to 40 g/l resulted in a slightly greater net fluid balance at the end of the trial period, there was no significant difference between the two protein-containing solutions for any of the measured variables. While there was a statistically significant difference in fluid balance between the C and the CP20 and CP40 trials, this equates to a difference in body mass of approximately 0·3–0·5 %, which is unlikely to confer any enhancement in exercise performance during trial CP20 or CP40 compared with trial C( Reference Watson, Love and Maughan 13 ).
It has previously been shown that after exercise in the heat, resulting in a reduction in body water equivalent to approximately 2 % of subjects' initial body mass, low-fat milk is better retained than a commercially available carbohydrate–electrolyte drink( Reference Shirreffs, Watson and Maughan 12 , Reference Watson, Love and Maughan 13 ). While there are numerous compositional differences between low-fat milk and a carbohydrate–electrolyte sports drink (energy density, carbohydrate content and type, protein content and electrolyte content), it has recently been demonstrated that the protein contained in low-fat milk is responsible for at least some of the increased fluid retention observed( Reference James, Clayton and Evans 8 ). The study of James et al. ( Reference James, Clayton and Evans 8 ) matched solutions in terms of energy density and electrolyte content, making it possible to directly compare the fluid-retaining properties of milk protein (25 g/l) with an isoenergetic amount of carbohydrate. The results of the present study agree with those of James et al. ( Reference James, Clayton and Evans 8 ), and demonstrate that the retention of a rehydration solution consumed after exercise-induced dehydration is increased when some of the carbohydrate in a carbohydrate–electrolyte solution is replaced with an isoenergetic amount of milk protein. The present study demonstrates that the inclusion of some (20–40 g/l) milk protein in a rehydration solution can augment rehydration to a greater extent than an isoenergetic amount of carbohydrate; however, there was no significant difference in any of the measured variables between the rehydration solutions containing either 20 or 40 g/l milk protein. This suggests that in the concentrations of milk protein measured in the present study, there does not appear to be a dose–response relationship with fluid balance after exercise-induced dehydration.
Low-fat milk has a protein content of approximately 36 g/l( Reference Shirreffs, Watson and Maughan 12 , Reference Watson, Love and Maughan 13 ); however, the present study, as well as previous research( Reference James, Clayton and Evans 8 ), suggests that any increases in drink retention caused by the protein content of low-fat milk can be produced by protein concentrations below that found in low-fat milk. Similarly, Seifert et al. ( Reference Seifert, Harmon and DeClercq 14 ) observed an increased retention of a commercially available carbohydrate–protein solution (containing 60 g/l carbohydrate, 15 g/l whey protein) compared with a commercially available carbohydrate solution (60 g/l carbohydrate) and flavoured water. Although, James et al. ( Reference James, Gingell and Evans 15 ) demonstrated that this increase in drink retention observed by Seifert et al. ( Reference Seifert, Harmon and DeClercq 14 ) might be related to the mismatched energy density of rehydration solutions, as when matched for energy density, no difference in drink retention was observed between a 65 g/l carbohydrate solution and a 50 g/l carbohydrate, 15 g/l whey protein isolate solution( Reference James, Gingell and Evans 15 ). Increasing the energy density of a solution reduces the rate at which it empties from the stomach( Reference Vist and Maughan 16 – Reference Evans, Shirreffs and Maughan 18 ), thus reducing the rate of water uptake into the circulation and offsetting the decline in serum osmolality that occurs with the ingestion of less energy-dense solutions( Reference Evans, Shirreffs and Maughan 7 , Reference Evans, Shirreffs and Maughan 18 ).
While the results of the present study and those of James et al. ( Reference James, Clayton and Evans 8 ) suggest that the inclusion of milk protein in a rehydration solution consumed after exercise-induced dehydration increases the fraction of the ingested solution that is retained, the mechanism by which this effect occurs is currently unknown. The rate at which a solution is emptied from the stomach and the rate at which fluid is absorbed in the small intestine are both affected by the addition of protein to a solution, suggesting that alterations in fluid absorption are likely to be the main reason for the success of these solutions. Careful consideration needs to be given to the interpretation of these data in the hours immediately after drink ingestion, as fluid in the stomach and intestines will not be contributing to fluid balance. Future studies should seek to quantify the volume of fluid contained in the gastrointestinal system to take account of this volume in any fluid balance calculations.
The most important factor affecting rehydration after exercise is the volume of fluid that is consumed, and it has been shown that for effective rehydration, a volume equivalent to approximately 150 % of fluid lost must be ingested( Reference Shirreffs, Taylor and Leiper 3 ). Failure to ingest sufficient fluid will make a return to euhydration impossible. In situations where drinks are consumed ad libitum, palatability and drink perception play an important role in determining the volume of fluid that is ingested. James et al. ( Reference James, Clayton and Evans 8 ) observed no difference in drink pleasantness or sweetness between a 65 g/l carbohydrate solution and a 40 g/l carbohydrate, 25 g/l milk protein solution. Interestingly, in the present study, subjects perceived drink C to be more pleasant than drink CP20, and there was a tendency for subjects to perceive drink CP40 as more pleasant than drink CP20 (P= 0·066), with no difference between the C and CP40 drinks. This suggests that if ad libitum fluid intake had been used during rehydration instead of the prescribed drinking that was imposed, then subjects might have ingested a greater amount of drink C or CP40 than drink CP20, which is an important consideration for rehydration in an applied setting.
In the present study, a prescribed volume of fluid of 150 % of body mass loss during exercise was ingested during rehydration. Therefore, although not measured, the observed differences in drink retention must be related to the drinks' effects on gastric emptying, intestinal absorption or fluid retention, all of which might influence serum osmolality and circulating agrinine vasopressin concentrations and thus urine production. Future studies should aim to also quantify these outcomes. Slowing the rate of gastric emptying and/or intestinal absorption might reduce the rate of influx of water into the circulation, offset the decline in serum osmolality that occurs with the ingestion of a large volume of dilute fluid and reduce urine production( Reference Evans, Shirreffs and Maughan 18 ). In contrast, adding ingredients to rehydration drinks that exert an osmotic effect in the extracellular space (e.g. Na) might result in an increase in serum osmolality and a reduction in urine production( Reference Shirreffs and Maughan 9 , Reference Nose, Mack and Shi 19 ). There is a rationale for milk protein, affecting all three of these components of the rehydration process.
Milk protein is comprised of approximately 80 % casein protein and approximately 20 % whey protein, and in the presence of gastric acid, the casein fraction of milk protein clots( Reference Billeaud, Guillet and Sandler 20 ), which might affect the rate at which a casein or milk protein-containing solution empties from the stomach. It has previously been demonstrated that solutions containing a high fraction of intact casein protein empty from the stomach (measured using a radioactive tracer) slower than solutions containing a low fraction of casein protein or containing casein protein that had been denatured by acidification( Reference Billeaud, Guillet and Sandler 20 ). A reduction in the gastric emptying rate of solutions containing casein or milk protein has also been demonstrated in comparison with glucose and/or lactose( Reference Burn-Murdoch, Fisher and Hunt 21 , Reference Bowen, Noakes and Trenerry 22 ). In contrast, other studies( Reference Calbert and MacLean 17 , Reference Calbet and Holst 23 ) have demonstrated no effect of milk protein or casein on gastric emptying, although these studies have used a modification of the double-sampling gastric aspiration technique of George( Reference George 24 ) as described by Beckers et al. ( Reference Beckers, Rehrer and Brouns 25 ), which involves repeated (at 5–20 min intervals) mixing of the stomach, via an orogastric/nasogastric tube. This repeated mixing is likely to disrupt any clot formation that might affect the rate of gastric emptying.
Calbet & Holst( Reference Calbet and Holst 23 ) added 3H to solutions ingested and reported that 3H appearance in the peripheral blood was reduced following the ingestion of a casein protein-containing solution compared with an isoenergetic whey protein-containing solution. As gastric emptying rate of the solutions was not different, this reduced 3H appearance indicates that the rate of intestinal water absorption was reduced in the casein protein-containing solution. As with high-concentration glucose solutions( Reference Evans, Shirreffs and Maughan 18 ), the potential slower delivery of water to the peripheral circulation with a solution containing casein protein might offset the reduction in serum osmolality that occurs with the ingestion of a large volume of a dilute solution( Reference Nose, Mack and Shi 19 ).
Finally, the inclusion of milk protein in a rehydration solution will result in an increase in plasma amino acid concentration( Reference Hall, Millward and Long 26 ), exerting an osmotic effect (oncotic pressure)( Reference Okazaki, Hayase and Ichinose 27 ) that would be expected to increase water retention. In line with this, Watson et al. ( Reference Watson, Love and Maughan 13 ) reported greater serum osmolality after the ingestion of low-fat milk compared with a 60 g/l carbohydrate solution ingested after exercise-induced dehydration, although this might be accounted for by the greater Na and K contents of low-fat milk. Similarly, Seifert et al. ( Reference Seifert, Harmon and DeClercq 14 ) reported greater plasma osmolality after the ingestion of a 60 g/l carbohydrate, 15 g/l whey protein solution compared with a 60 g/l carbohydrate solution after exercise-induced dehydration. Taken together, these results have suggested that the inclusion of milk-derived proteins in a post-exercise rehydration solution might increase plasma osmolality, via an increase in plasma amino acid concentration.
Similar to previous research( Reference James, Clayton and Evans 8 , Reference Shirreffs, Watson and Maughan 12 ), the osmolality of urine produced after drinking in the present study (2 and 3 h) was greater after the ingestion of milk protein-containing solutions (CP20 and CP40) compared with a carbohydrate–electrolyte solution (C). A change in plasma arginine vasopressin concentration of 1 pg/ml (resulting from a change in plasma osmolality of approximately 3 mosmol/kg) has been shown to lead to a change in urine osmolality of 250 mosmol/kg( Reference Robertson 28 ), and although serum osmolality was not measured in the present study, the increase in urine osmolality observed after drinking during the CP20 and CP40 trials suggests that serum osmolality and circulating arginine vasopressin concentrations would be expected to be greater after ingestion of the protein-containing drinks.
In conclusion, the results of the present study confirm those of James et al. ( Reference James, Clayton and Evans 8 ) and suggest that after exercise in a hot environment, the substitution of some of the carbohydrate contained in a carbohydrate–electrolyte rehydration solution with an isoenergetic amount of milk protein can increase the amount of the rehydration solution that is retained. Furthermore, these results demonstrate that there does not appear to be any additional increase in rehydration of increasing the milk protein concentration from 20 to 40 g/l.
Acknowledgements
The authors would like to thank Mr Terrance Campion for his assistance in the data collection aspect of the present study. The present study received no specific grant from any funding agency in the public, commercial or not-for-profit sectors. L. J. J., D. J. C., J. M., D. S., M. S., R. H. and R. S. conceived the study design. All authors contributed to the data collection and analysis. L. J. J. wrote the manuscript, with assistance from G. H. E. and D. J. C. The authors had no conflicts of interest.


