





Hypertension, dyslipidaemia, hyperglycaemia and overweight are major risk factors for non-communicable diseases and premature death on a global scale(Reference Vaduganathan, Mensah and Turco1,Reference Roth, Mensah and Johnson2) . Unhealthy diet is a significant contributor to the development of hypertension, dyslipidaemia and hyperglycaemia and is one of the largest modifiable risk factors in the global burden of disease(Reference Murray, Aravkin and Zheng3). The WHO has highlighted the adoption of front-of-pack nutrition labelling as an important strategy to help prevent non-communicable diseases through assisting consumers in making healthier food choices and by encouraging the food industry to develop healthier products(4).
Pregnancy represents a period of considerable metabolic and physiological stress for women, during which the risk of developing hypertension is elevated(Reference Morales-Suarez-Varela and Guillen-Grima5). Dietary habits assessed during pregnancy may also serve as a proxy for long-term diet, reflecting patterns that existed before and persist beyond the gestational period(Reference Crozier, Robinson and Godfrey6). Hypertension during pregnancy is a strong predictor of later development of hypertension and cardiovascular disease(Reference Egeland, Skurtveit and Staff7). Understanding the association between diet quality during pregnancy and later risk of hypertension is therefore highly relevant, as it may provide insights into long-term cardiovascular risk and opportunities for early prevention.
The Nutri-Score, a front-of-pack nutrition label, is a graded, colour-coded system to classify foods and beverages from A/dark green to E/dark orange, indicating nutritional quality(Reference Julia and Hercberg8). Nutri-Score was first implemented as a nutrition label in 2017(Reference Julia and Hercberg8) (hereafter referred to as the Nutri-Score 2017) and updated in 2023(9,10) (hereafter referred to as the Nutri-Score 2023). As part of the Norwegian NewTools project, aiming to promote more sustainable and healthy food systems(Reference Abel, Lund-Iversen and Olsen11), minor but important revisions to the Nutri-Score 2023 have been suggested in the two algorithms for foods (not for beverages) to better align with the Nordic Nutrition Recommendations 2023 and the Nordic Keyhole label. In this article, we refer to the proposed revised Nutri-Score as the NewTools-Score (Reference Amberntsson, Mohn Paulsen and Angela Bianchi12). Briefly, minor amendments are suggested to improve discrimination between whole grain and refined grain products, to better discriminate creams and cheeses by fat content, to prevent products high in sugar from getting a favourable score (A or B), to reward the content of fish and to include unprocessed/unpackaged fruits and vegetables by assigning an A for all such foods. Among 26 610 pre-packed food products in the Norwegian market, 89 % had the same NewTools-Score and Nutri-Score(Reference Amberntsson, Mohn Paulsen and Angela Bianchi12).
A 2024 meta-analysis concluded that there is strong evidence supporting the criterion validity of the Nutri-Score model(Reference Barrett, Afrin and Rayner13). A better nutritional quality, as indicated by the nutrient profiling model underlying the Nutri-Score 2017, has been associated with decreased prospective risk of cardiovascular risk factors(Reference Khoury, Gómez-Donoso and Martínez14–Reference Donat-Vargas, Sandoval-Insausti and Rey-García16), weight gain or overweight and obesity(Reference Egnell, Seconda and Neal17,Reference Julia, Ducrot and Lassale18) , cancer(Reference Khoury, Gómez-Donoso and Martínez14–Reference Donat-Vargas, Sandoval-Insausti and Rey-García16) and mortality(Reference Egnell, Seconda and Neal17,Reference Julia, Ducrot and Lassale18) . We have previously investigated the Nutri-Score 2023 in a Norwegian setting, revealing an overall acceptable discriminatory ability and alignment with the Norwegian food based dietary guidelines(Reference Deschasaux, Huybrechts and Murphy19). We have also evaluated the convergent validity of the Nutri-Score 2023 and the NewTools-Score by evaluating their agreement with a reference standard, created based on how qualified Norwegian nutrition experts rank the healthiness of foods(Reference Paulsen, Bucher Holm and Amberntsson20). Both scores aligned well with the experts’ ratings, but the NewTools-Score demonstrated better agreement compared with the Nutri-Score(Reference Paulsen, Bucher Holm and Amberntsson20).
The aim of this study was to investigate the predictive criterion validity of a proposed revision of the Nutri-Score (the NewTools-Score) and the current Nutri-Score by investigating associations between the diet quality scores measured in mid-pregnancy and the risk of dispensed prescription of medications for hypertension up to 11 years following delivery. A secondary aim was to cross-sectionally investigate the association between the diet quality scores and systolic and diastolic blood pressure in mid-pregnancy.
Methods
Study population
The MoBa study is a population-based pregnancy cohort study conducted by the Norwegian Institute of Public Health(Reference Magnus, Birke and Vejrup21). Participants were recruited from all over Norway from 1999 to 2008. Women were invited to participate through a postal invitation prior to the ultrasound examination offered free of charge to all pregnant women. The only inclusion criterion was that the mothers had to be fluent in Norwegian as all questionnaires were in Norwegian. Of those invited, 41 % of the women consented to participate. The cohort includes approximately 114 500 children, 95 200 mothers and 75 200 fathers. The current study is based on version 12 of the quality-assured data files released for research in January 2019.
For the current study, the MoBa database was linked to the Medical Birth Registry of Norway (MBRN), the National Population Register and the Norwegian Prescription Database (NorPD). MBRN is a registry of pregnancies, collecting relevant information on mother and child health before and during pregnancy, including pregnancy and delivery-related complications. The National Population Register contains information on everyone that resides or has resided in Norway. NorPD is a nation-wide research database that captures all dispensed drug prescriptions in Norway since 1 January 2004. In the current study, data from NorPD were available from 1 January 2004 to 31 December 2013.
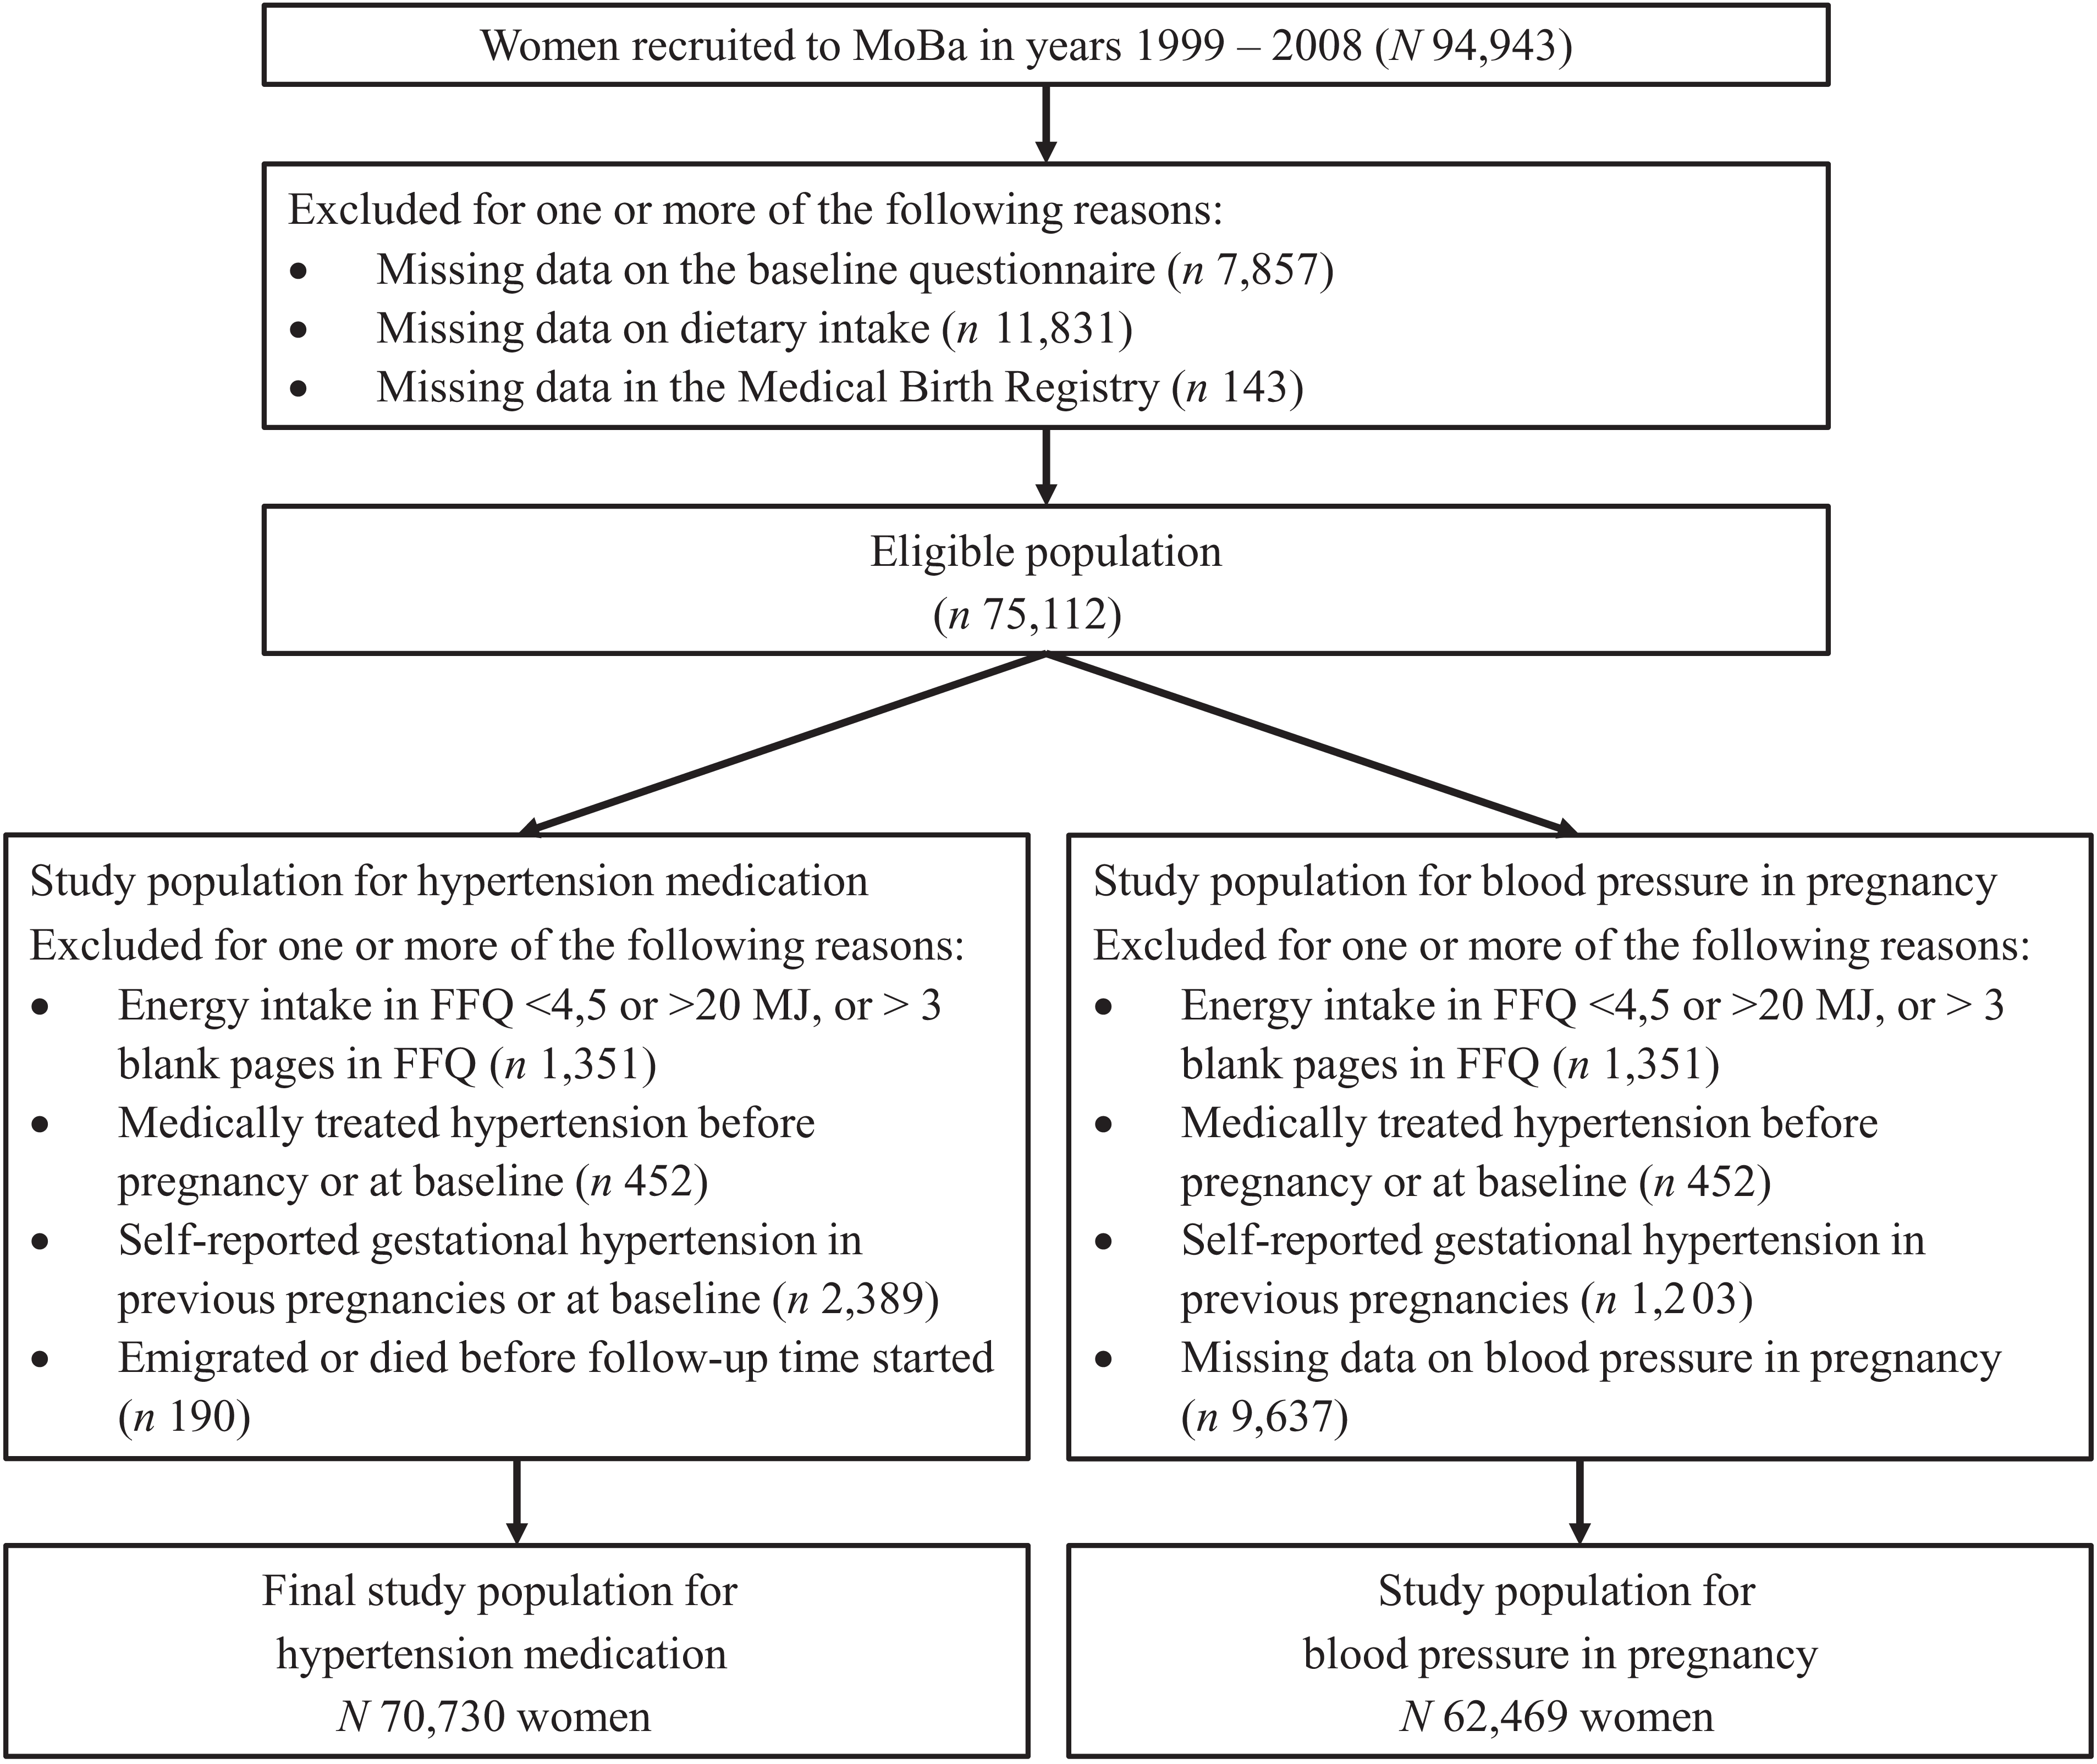
The inclusion criteria for the current study were (1) having responded to the baseline questionnaire around gestational week 15, covering overall health and socio-demographic information; (2) having completed the FFQ around gestational week 22 and (3) being registered in MBRN. The current study population was restricted to pregnant women recruited from 2002 to 2008 because the FFQ in MoBa was first introduced in 2002. Some women participate in MoBa with more than one pregnancy. In this case, the earliest pregnancy with available data from the baseline questionnaire and the FFQ was included, to maximise the follow-up time. Exclusion criteria were (1) history of medically treated hypertension at baseline, identified from the baseline questionnaire or the MBRN; (2) self-reported gestational hypertension in previous pregnancies (from the baseline questionnaire) and (3) non-reliable FFQ defined as energy intakes outside the range of 4·5–20 MJ/d(Reference Meltzer, Brantsæter and Ydersbond22) or ≥ 4 blank pages in the FFQ. The final study population comprised 70 730 women (Figure 1). For the cross-sectional analysis of self-reported blood pressure, the final study population comprised 62 469 women, due to missing data on blood pressure.
The selection of participants from The Norwegian Mother, Father and Child Cohort Study. For women who participated with more than one pregnancy, the earliest pregnancy with available data from the baseline questionnaire and the FFQ was included.

Data collection
Dietary data
Dietary intake was estimated using a 255-item semiquantitative FFQ around gestational week 22. The MoBa FFQ was developed specifically for MoBa and estimated the participants’ dietary habits. Participants were asked to recall their average intake from the start of their pregnancy until week 22. The reported food frequencies were then converted into specific food amounts using standard portion sizes in Norway. FoodCalc v1.3 and the Norwegian food composition table were used to calculate the daily food and nutrient intake(Reference Brantsæter, Haugen and Alexander23).
The FFQ has been validated against a 4-days weighed food diary, activity monitoring and dietary biomarkers, in a sub-sample of participants(Reference Brantsæter, Haugen and Alexander23). Results from the validation studies showed acceptable agreement for total energy intake, saturated fat, added sugar, protein and fibre(Reference Brantsæter, Haugen and Alexander23). The validation studies also showed acceptable agreement for foods(Reference Brantsæter, Haugen and Alexander23,Reference Brantsæter, Haugen and Rasmussen24) .
Other variables
Maternal characteristics were obtained from the baseline questionnaire, including self-reported information about years of education, pre-pregnancy physical activity (i.e., 3 months prior to pregnancy: how often were you so physically active in your leisure time that you get out of breath or sweat; never, less than once a week, once a week, 2 times/week, 3–4 times/week and ≥ 5 times/week), pre-pregnancy smoking (no, occasionally and daily), pre-pregnancy alcohol consumption (never, more seldom than once a month, 1–3 times/month, once a week, 2–3 times/week, 4–5 times/week and 6–7 times/week), pre-pregnancy body weight and height, history of medically treated hypertension at baseline or previous or current gestational hypertension, and systolic and diastolic blood pressure measured at the first pregnancy care visit. MBRN provided information on maternal age at delivery, parity, year of childbirth and history of medically treated hypertension at baseline or previous or current gestational hypertension.
Calculation of the diet quality scores
A diet quality score for each participant was calculated using the NewTools-Score and the Nutri-Score 2023 with an energy-weighted approach. Each food and beverage item in the FFQ was scored using the algorithms for the NewTools-Score(Reference Amberntsson, Mohn Paulsen and Angela Bianchi12) and Nutri-Score 2023(9,10) . In brief, the nutritional scores are based on the content (per 100 g) of the following unfavourable components: energy, saturated fat, salt, total sugar and non-nutritive sweeteners (for beverages) and of the following favourable components: protein, fibre and percentage of fruits, vegetables and legumes. In addition, there are also specific rules for cheese as well as red and processed meat. The percentage content of fruits, vegetables and legumes was estimated using standard recipes. Both the NewTools-Score and the Nutri-Score consist of three algorithms: the main algorithm for general foods, an algorithm for fats, oils, nuts and seeds (the algorithm for high-fat foods for the NewTools-Score), and the algorithm for beverages. Details on the Nutri-Score and NewTools-Score algorithms are given in online Supplementary Texts 1 and 2, respectively. The NewTools-Score ranges between –17 and +63 for foods and the Nutri-Score ranges between –17 and +55 for foods. Both scores range between –18 and +54 for beverages, since the algorithms are equal for beverages. Higher scores reflect lower nutritional quality of a food product. Among the food items in the FFQ, 73 % had the same NewTools-Score and Nutri-Score.
To harmonise the scales of the three different algorithms, all scales were standardised to a 0–100 range by assigning the lowest scoring food (i.e., healthiest) to 0 and the highest scoring food (i.e., unhealthiest) to 100. After standardisation, an energy-weighted arithmetic mean score was computed for each participant: $Energy\;-\;weighted\;diet\;quality\;score\;EWS=\frac{{{\mathop \sum \nolimits_{i=1}^n {FS_i}{E_i}}}}{{{\mathop \sum \nolimits_{i=1}^n E_i}}}$
Here, i represents a food or beverage consumed by the participant, FS i is the standardised nutritional score of the food or beverage score (using the NewTools-Score(Reference Amberntsson, Mohn Paulsen and Angela Bianchi12) or the Nutri-Score 2023(9,10) ), E is the mean daily energy intake (in kJ) and n is the number of foods. The energy-weighted diet quality scores (i.e., NewTools diet quality score and Nutri-Score diet quality score) represented the exposures in the subsequent analyses. A higher diet quality score reflects a lower nutritional quality of the individual’s overall diet.
An alternative method for weighting the final diet quality score was also explored since foods and beverages with low energy density, such as water and some fruits and vegetables, obtain none to minimal weight by the energy-weighted method. This alternative score was obtained by averaging the energy-weighted diet quality score and a weight-weighted diet quality score and is referred to as the mixed-weights approach. The conclusion was that the mixed-weights approach was not superior to the energy-weighted score alone. Details on the methods used to calculate the diet quality score with the mixed-weights approach are described in online Supplementary Text 3.
Outcomes
Data on prescriptions of drugs used to treat hypertension from NorPD were used as the outcome variable. The following Anatomical Therapeutic Chemical classification codes were considered to define medications to treat hypertension: antihypertensives (C02), diuretics (C03), beta-blockers (C07), calcium channel blockers (C08) and renin-angiotensin system medications (C09). The outcome variable was defined as a dispensed prescription of any of the above-mentioned medications starting 2 years after delivery for all participants, since we included participants recruited from 2002 but had data on prescriptions from 2004. The prescriptions were assessed for up to 11 years after childbirth (until 31 December 2013).
A secondary outcome was systolic and diastolic blood pressure measured at the first pregnancy care visit and recorded in the pregnancy health card all pregnant women carry during pregnancy. The participants were asked to report this blood pressure in the baseline questionnaire (around gestational week 15).
Statistical analysis
Hazard ratios (HRs) and 95 % CIs obtained from Cox proportional hazards regression models were used to estimate the association between the dietary indices and dispensed prescription of medications for hypertension. Time in days from 2 years after delivery to date of dispensed prescription of any of the above-mentioned drugs, or to censoring, or to end of follow-up was the primary time variable. If a woman moved or died during the follow-up period, the date of emigration or death was used to censor the woman out.
Associations were modelled flexibly using restricted cubic splines (four knots at percentiles 5, 35, 65 and 95) to check for non-linear associations. P values are reported for overall associations between the continuous exposures and outcomes by testing the coefficients of all spline transformations equal to zero. The tests for non-linearity were performed by testing the coefficients of the second and third spline transformations equal to zero. If no evidence of non-linearity was found, the variables were modelled linearly.
Covariates were included in the models based on previous knowledge and a directed acyclic graph (online Supplementary Text 4). The models were adjusted for the following confounders measured at baseline: age, education (≤ 12, 13–16 and ≥ 17 years), parity (0, 1, and ≥ 2), pre-pregnancy BMI (restricted cubic splines), pre-pregnancy smoking (no, occasionally and daily), pre-pregnancy physical activity (never, less than once a week, 1–2 times per week, ≥ 3 times per week), pre-pregnancy alcohol consumption (never, more seldom than once a week and ≥ 1 time per week) and year of childbirth. Differences in crude means between quartiles of the NewTools diet quality score were investigated by ANOVA and difference in proportions by χ 2 test.
We checked the assumption of proportional hazards through examination of the Schoenfeld residuals. The residuals indicated violation of the assumptions, and all covariates were therefore checked for potential time variance. Year of childbirth showed significant interaction with time and was therefore included as a time-varying covariate in the final model.
Missing data on covariates (3·4 % on pre-pregnancy BMI, 2·9 % on maternal education, 9·1 % on pre-pregnancy smoking, 5·3 % on alcohol intake and 3·7 % on physical activity) were handled through multiple imputation by chained equations, and twenty imputed datasets were generated for analyses. The outcome variable and the Nelson–Aalen estimator of the cumulative baseline hazard function to the survival time were included in the imputation model, as proposed by White and Royston(Reference White and Royston25).
The following sensitivity analyses were performed: (1) restricting the outcome variable to women with two or more dispensed prescriptions of blood pressure medication to strengthen the outcome definition, (2) not including BMI as a confounder, as it is also a mediator, (3) excluding women reporting an eating disorder before or during pregnancy (n 2268), (4) excluding women with self-reported chronic kidney disease (n 378), (5) excluding sugar-sweetened beverages from calculations of the dietary index, as this exposure has previously been investigated in the current study population and with a similar outcome and (6) restricting analyses to complete-cases only (n 56 786), not including participants with imputed values.
The cross-sectional association between diet quality scores and blood pressure in pregnancy was investigated using logistic regression models. The associations were modelled flexibly by restricted cubic splines (four knots at percentiles 5, 35, 65 and 95) to check for non-linear associations. Systolic and diastolic blood pressure were modelled as binary outcomes (systolic blood pressure < or ≥ 140 mmHg and diastolic blood pressure < or ≥ 90 mmHg). Reported systolic blood pressure < 40 mmHg and diastolic blood pressure < 20 mmHg were considered misreporting and coded as missing (< 0·01 % for both exposures).
Prior to the analysis, we performed a power calculation. Assuming a standard deviation (sd) of 5·9 of the NewTools diet quality score, a HR of 1·05 for the primary outcome, an expected event rate of 1·1 %, a two-sided significance level of 0·05 and a population of 70 730 women, the study was estimated to have sufficient power (> 90 %) to detect the specified effect size. The assumptions for this calculation were based on previously published data with CVD outcomes(Reference Deschasaux-Tanguy, Huybrechts and Julia26).
Results were reported including robust 95 % CIs. A P value < 0·05 was considered statistically significant. Statistical analyses were performed using Stata (StataCorp Stata Statistical Software: Release 17).
Results
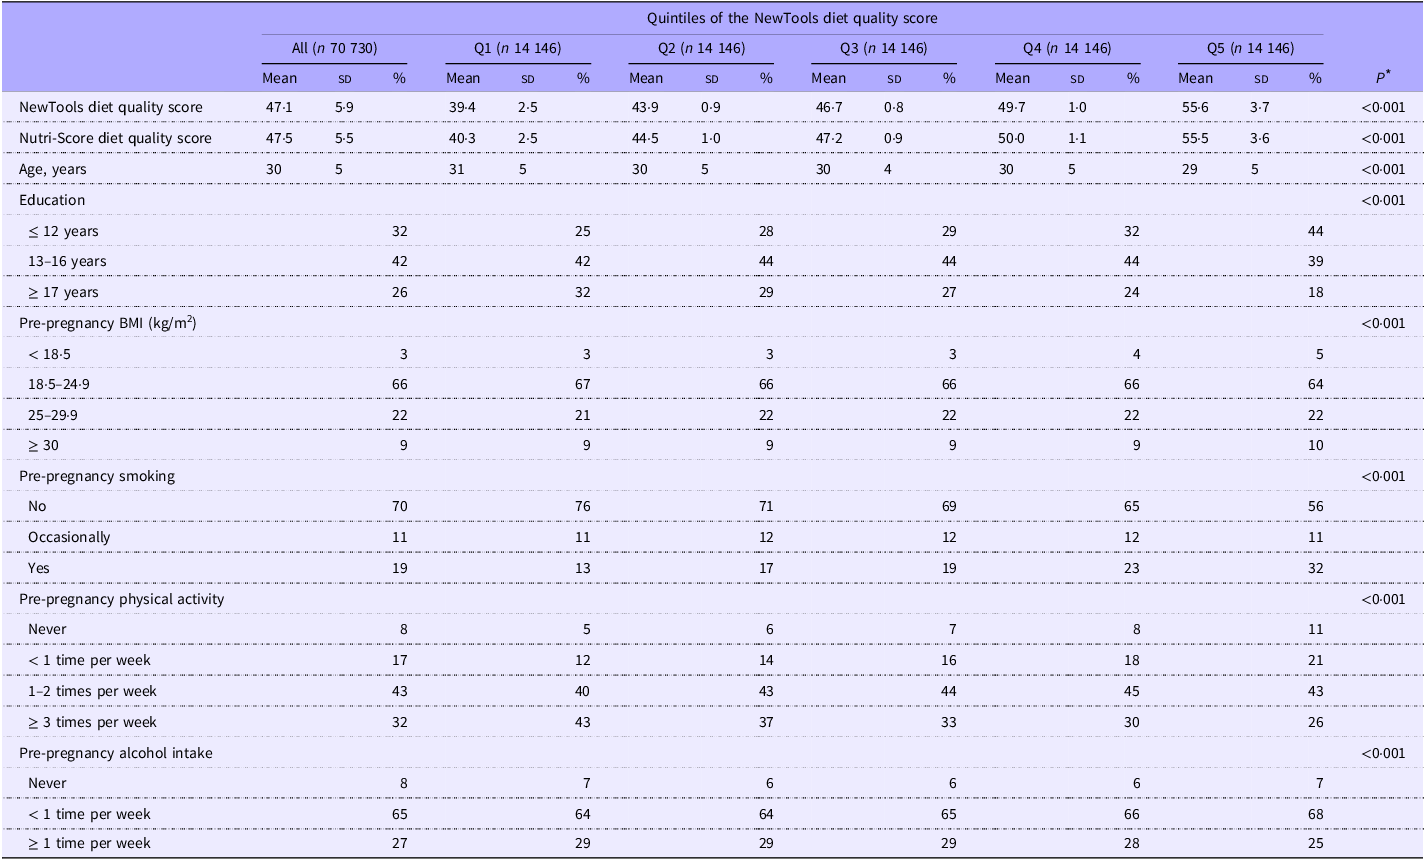
The mean age of the study participants at inclusion was 30 years (sd: 4·6) and most women were non-smokers and had a pre-pregnancy BMI between 18·5 and 24·9 kg/m2 (Table 1). The mean NewTools diet quality score was 47·1 (5·9) and the score correlated significantly (P < 0·01) with the intake of energy (r 0·21), saturated fat (r 0·43), sugar (r 0·62), Ca (r 0·10), fibre (r –0·30) and β-carotene (r –0·16), as well as with an index developed to measure adherence to the Norwegian food based dietary guidelines (r –0·64, online Supplementary Table 1)(Reference Totland, Øvrebø and Brantsæter27). The NewTools and Nutri-Score diet quality scores were highly correlated (r 0·99).
Baseline characteristics of the participants overall and by quintiles of the NewTools diet quality score in the Norwegian Mother, Father and Child Cohort Study (n 70 730). Higher diet quality score indicates poorer nutritional quality

Q, quintile.
* Difference in means investigated by ANOVA and difference in proportions by χ 2 test.
The association between diet quality and risk of dispensed prescriptions of medication for hypertension
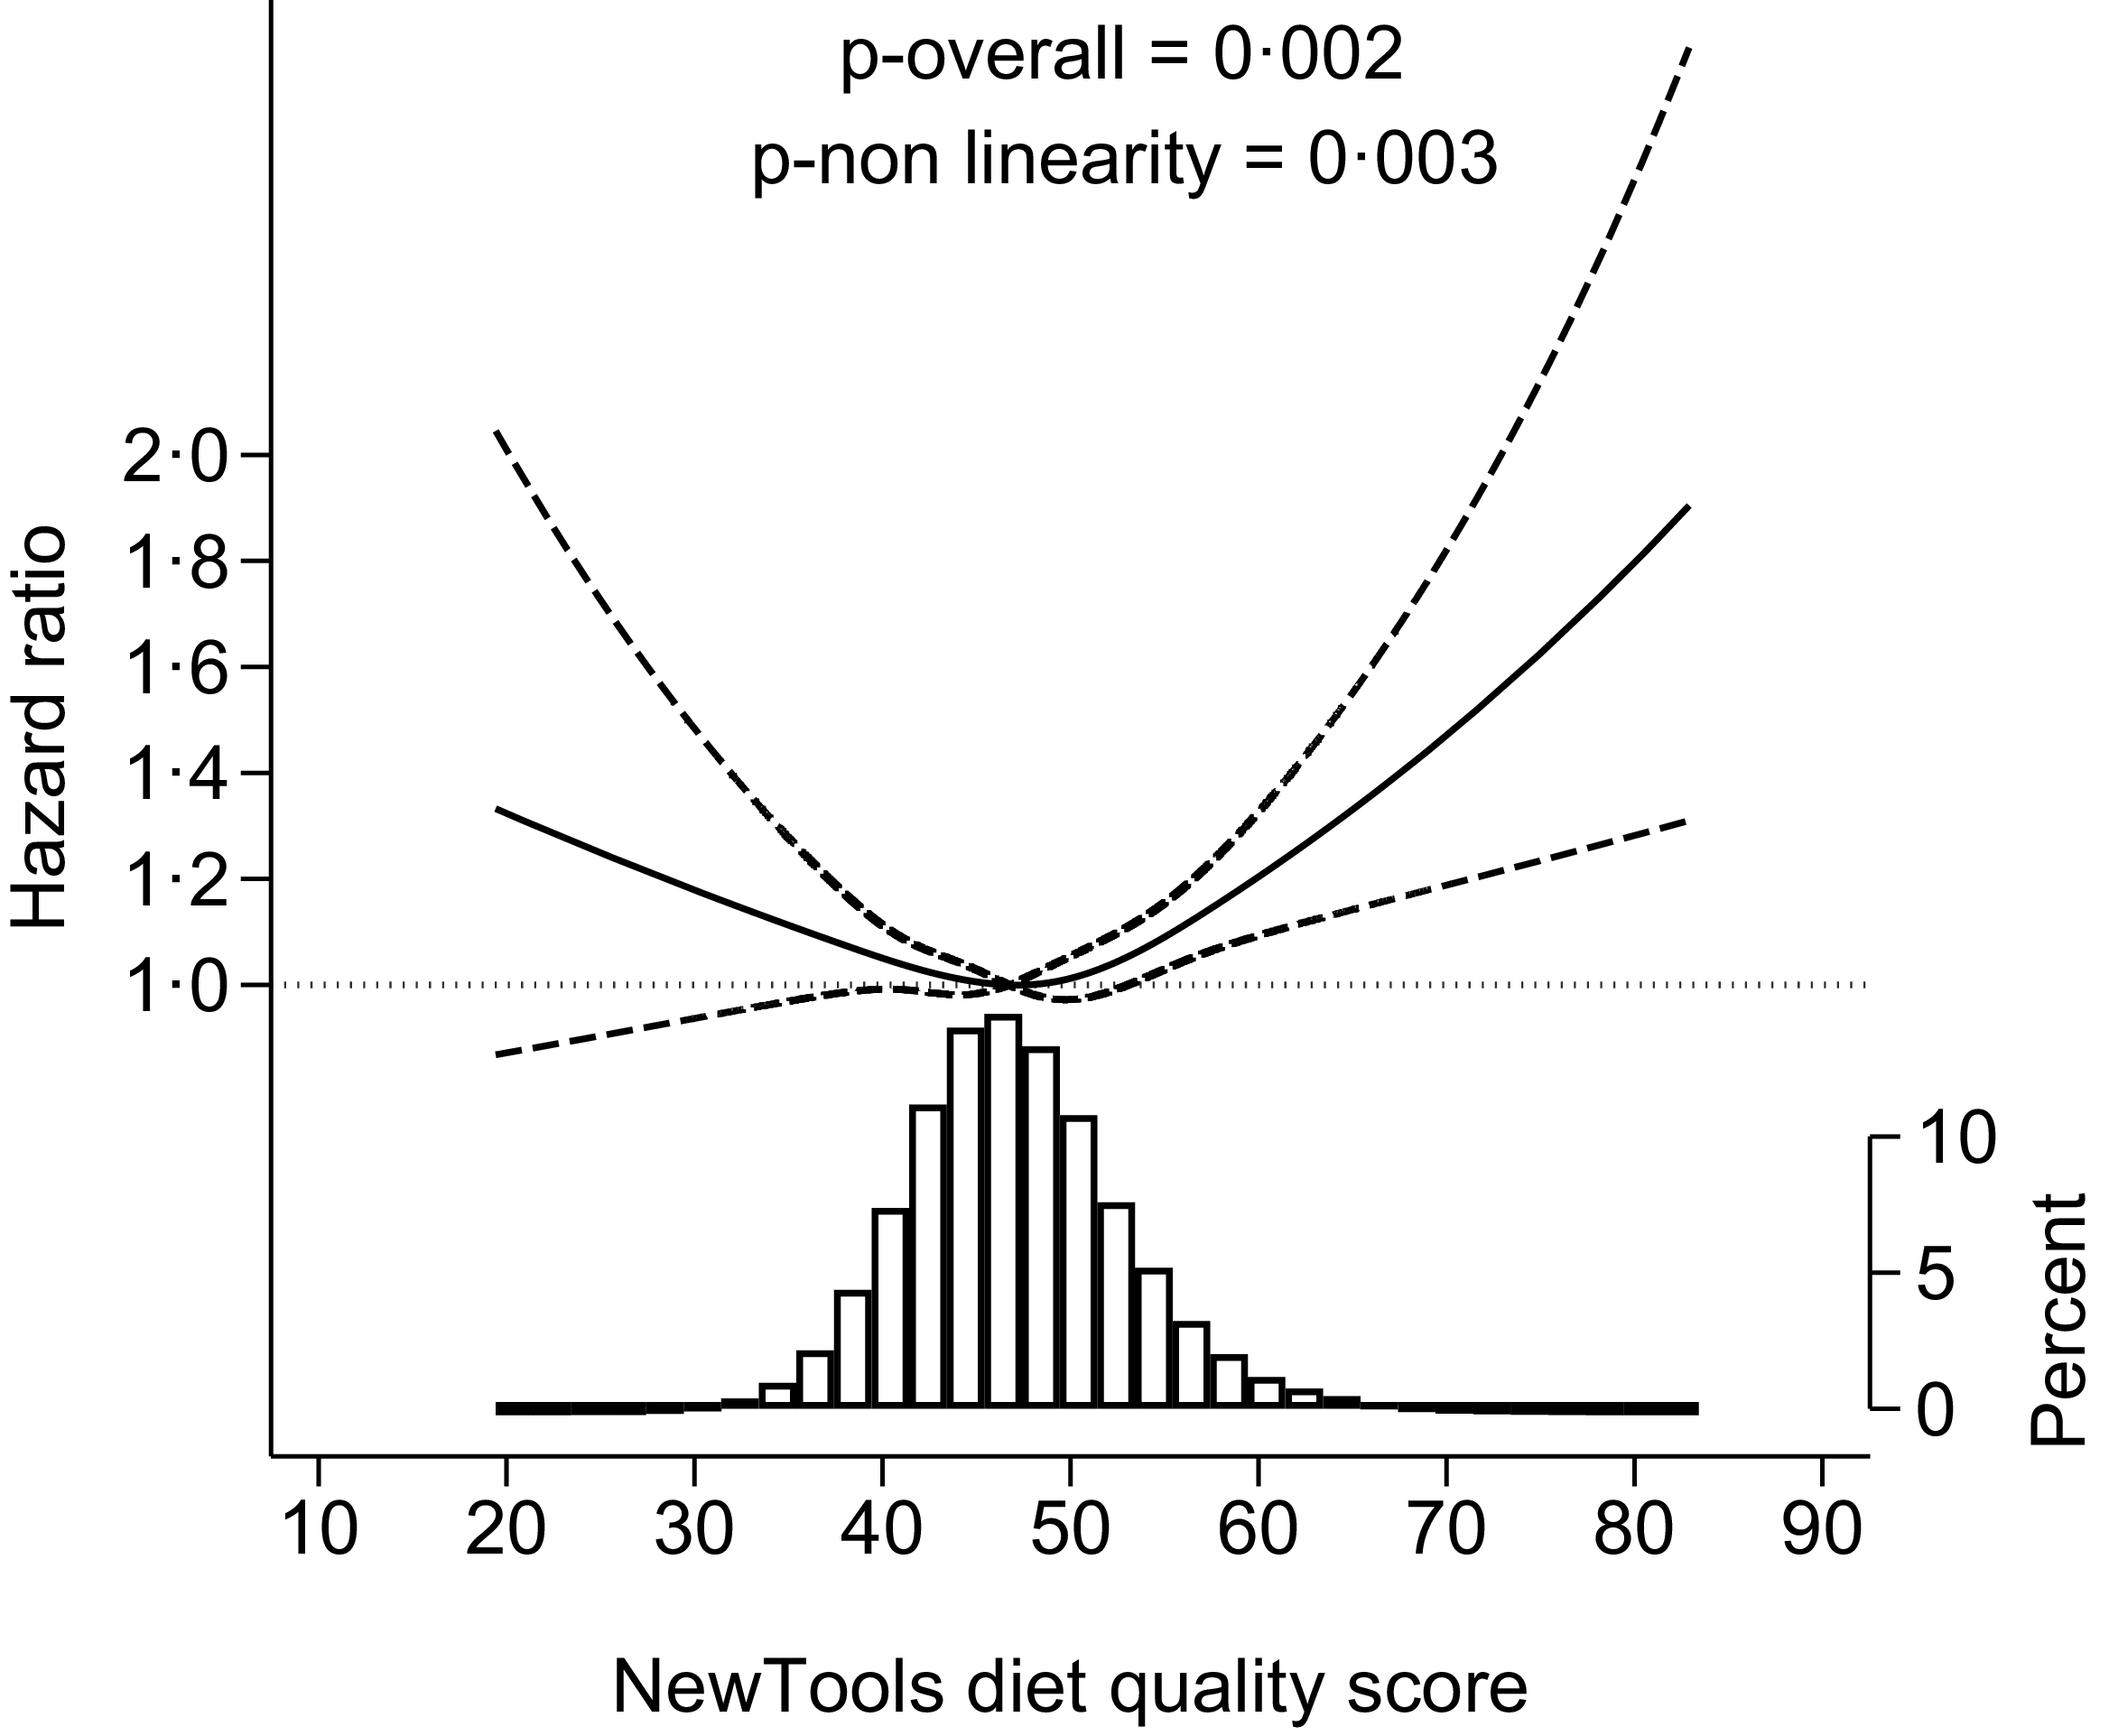
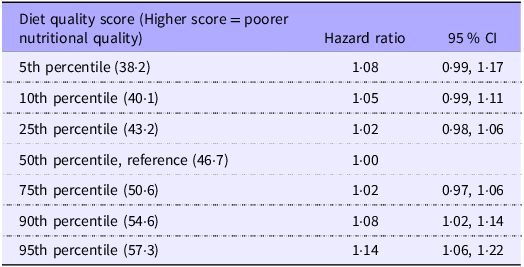
There were 4736 women (6·7 %) who dispensed prescriptions of medication for hypertension in the follow-up period. In addition, 492 (0·7 %) women were censored during the period since they had emigrated or died. The mean follow-up time of the women was 6 years (8 years after childbirth), and the total follow-up time was 423 597 person years. Poorer diet quality (higher NewTools diet quality score) was significantly associated with higher risk of hypertension medication (adjusted P value overall = 0·002, P value non-linearity = 0·003) (Figure 2). Tabular results of the estimated associations for specific percentiles of the diet quality score are provided in Table 2. Compared with having a diet quality at the median, women with a NewTools diet quality score corresponding to the 90th percentile had a HR of 1·08 (95 % CI 1·02, 1·14) of being prescribed medication for hypertension. Crude models yielded similar results as the adjusted models (online Supplementary Figure 4). Results for the Nutri-Score are almost identical to those for the NewTools-Score and presented in online Supplementary Figure 5 and 6.
The NewTools diet quality score and risk of dispensed prescription of medications for hypertension up to 11 years after delivery, adjusted Cox proportional hazards regression model. A higher diet quality score reflects a lower nutritional quality of the diet. The diet quality score was modelled by restricted cubic splines (four knots at percentiles 5, 35, 65 and 95). The reference level (hazard ratio = 1) was set to the median diet quality score. The dashed lines are 95 % CI. The histogram represents the distribution of the diet quality score.

NewTools diet quality score and risk of dispensed prescription of medications for hypertension up to 11 years after delivery (n 70 730)

Predicted estimates after adjusted Cox proportional hazards regression model. Diet quality scores were modelled flexibly using restricted cubic splines (four knots at percentiles 5, 35, 65 and 95). The models used time in days from 2 years after delivery as the time scale and was adjusted for age at baseline, education (≤ 12, 13–16 and ≥ 17 years), parity (0, 1 and ≥ 2), pre-pregnancy BMI (restricted cubic splines), pre-pregnancy smoking (no, occasionally, daily), pre-pregnancy physical activity (never, less than once a week, 1–2 times per week and ≥ 3 times per week), pre-pregnancy alcohol consumption (never, more seldom than once a week and ≥ 1 time week) and year of childbirth.
Sensitivity analyses provided similar results overall (online Supplementary Tables 2 and 3). The association was significantly non-linear through all sensitivity analyses, and poorer diet quality (higher score) was significantly associated with higher risk of dispensed prescriptions for hypertension. There was no significant difference between a median score and having a more favourable diet score.
Association between diet quality and blood pressure in mid-pregnancy
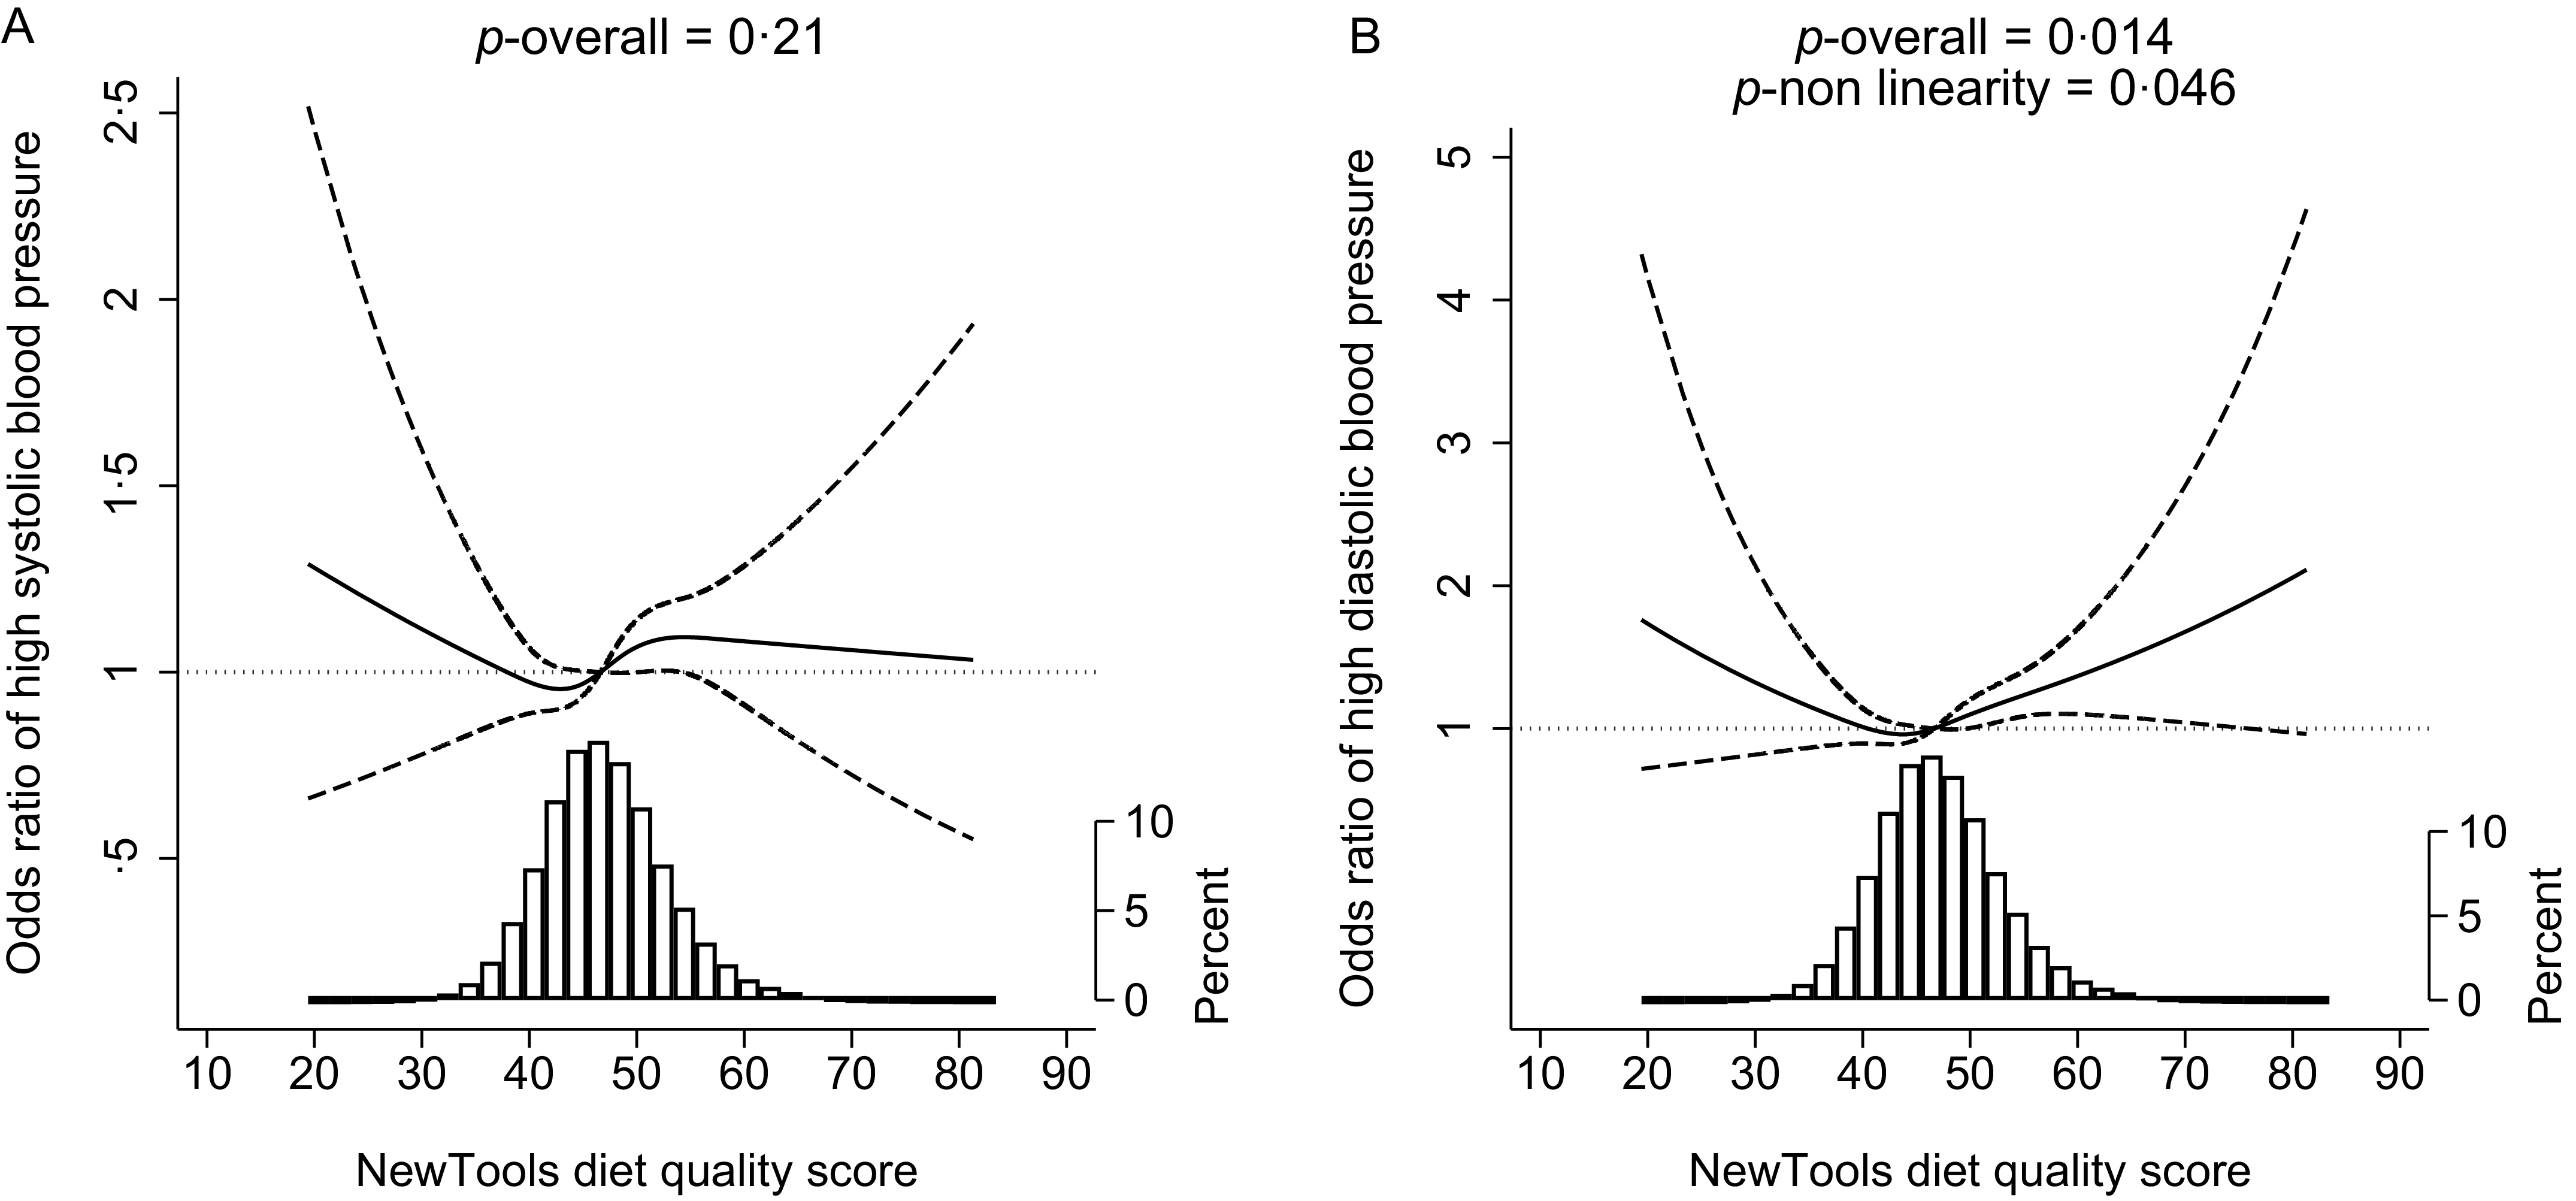
The overall prevalence of high systolic (1·5 %) and diastolic (0·6 %) blood pressure in this population was low. Poor diet quality was associated with higher odds of high diastolic blood pressure in pregnancy (adjusted P value overall = 0·014, P value non-linearity = 0·046), but not significantly associated with higher odds of a high systolic blood pressure (adjusted P value overall = 0·21, Figure 3). Compared with having a diet quality at the median, women with a NewTools diet quality score corresponding to the 90th percentile had an OR of 1·18 (95 % CI 1·03, 1·32) for high diastolic blood pressure. Results for the Nutri-Score diet quality score were similar and are presented in online Supplementary Figure 7.
The NewTools diet quality score and risk of high systolic (a) and diastolic (b) blood pressure in pregnancy, adjusted logistic regression models (n 62 469). A higher diet quality score reflects a lower nutritional quality of the diet. The diet quality score was modelled by restricted cubic splines (four knots at percentiles 5, 35, 65 and 95). The reference level (OR = 1) was set to the median diet quality score. The dashed lines are 95 % CI. The histogram represents the distribution of the diet quality score.

Discussion
In this large prospective cohort study of 70 730 pregnant women in Norway, with an average follow-up duration of 6 years, poor diet quality (i.e., NewTools-Score and Nutri-Score diet quality scores) was associated with a higher risk of dispensed prescription of medications for hypertension. Both diet quality scores yielded similar results overall since the correlation between the scores was close to perfect (r 0·99). The results from the cross-sectional analysis of blood pressure assessed at the first pregnancy check-up indicated that poorer diet quality scores were associated with higher diastolic blood pressure, but the associations were weak.
Our results are in line with previous studies prospectively investigating the association between diet quality, assessed using the nutrient profile underlying the Nutri-Score and risk of CVD. A cohort study from seven European countries found a higher risk of CVD in individuals with poorer diet quality, assessed with the Nutri-Score 2023 (HR 1·03 per sd increment, 95 % CI: 1·01, 1·05)(Reference Deschasaux-Tanguy, Huybrechts and Julia26). Previous research has used earlier versions of the Nutri-Score and has found similar results. For instance, higher diet index scores, indicating lower nutritional quality, were linked to increased cardiovascular risks in the French SU.VI.MAX (HR for 4th v. 1st quartile = 1·61, 95 % CI 1·05, 2·47)(Reference Adriouch, Julia and Kesse-Guyot28) and the NutriNet-Santé cohorts (HR for 4th v. 1st quartile =1·40, 95 % CI 1·06, 1·84)(Reference Adriouch, Julia and Kesse-Guyot15). In contrast, in the EPIC-Norfolk(Reference Mytton, Forouhi and Scarborough29) and Whitehall II cohorts(Reference Masset, Scarborough and Rayner30), using a binary healthier/less healthy classification of foods, an association between the consumption of less healthy foods and CVD incidence or mortality was not observed. However, two recent meta-analyses have concluded that lower diet quality was associated with higher risk of CVD (HR 1·08 for 2-unit increase in the Nutri-Score dietary index, 95 % CI 1·00, 1·18, P = 0·05)(Reference Montericcio, Bonaccio and Ghulam31), and with CVD incidence and mortality comparing the highest with the lowest diet quality quantile (HR 0·74, 95 % CI 0·59, 0·93)(Reference Barrett, Afrin and Rayner13). Additionally, in concordance with the results from our study, the Spanish PREDIMED-plus study showed that poorer diet quality was associated with unfavourable change in diastolic blood pressure (β coefficient for 3rd v. 1st tertile = 0·56, 95 % CI 0·08, 1·05), and also with greater change in BMI (β 0·51, 95 % CI 0·41, 0·60), waist circumference (β 1·19, 95 % CI 0·89, 1·50), plasma glucose (β 1·67, 95 % CI 0·43, 2·90) and triglycerides (β 6·27, 95 % CI 2·46, 10·09) after 1 year of follow-up(Reference Khoury, Gómez-Donoso and Martínez14). Further, a lower diet quality has been associated with weight gain(Reference Egnell, Seconda and Neal17,Reference Julia, Ducrot and Lassale18,Reference Julia, Fezeu and Ducrot32) , which could be a potential pathway for the association between diet quality and CVD.
Only one previous study has investigated non-linearity in the association between the Nutri-Score diet quality score and risk of CVD incidence or CVD risk factors(Reference Deschasaux-Tanguy, Huybrechts and Julia26). Similar to our study, a significant non-linear association was found with a U-shaped curve for the association with myocardial infarction, but not with other specific CVD subtypes. However, neither in the above-mentioned study(Reference Deschasaux-Tanguy, Huybrechts and Julia26) nor in our study was the tendency towards a risk increase in individuals with the best diet quality significant.
We have identified one important methodological difference between our study and previous similar research. Unlike other studies, we chose to not adjust for energy intake in our statistical analyses. Our decision was informed by a directed acyclic graph, which indicated that energy intake is not a confounder, as it does not necessarily affect diet quality. Instead, it was identified as a potentially important mediator and therefore excluded from the final model, as including it in the model could lead to biased estimates(Reference Etminan, Brophy and Collins33).
We have previously proposed some minor revisions to the Nutri-Score 2023, here referred to as the NewTools-Score(Reference Amberntsson, Mohn Paulsen and Angela Bianchi12). In the current study, 92 % of the foods covered in the FFQ had the same NewTools-Score and Nutri-Score (A-E) and 73 % had identical points on the underlying scales, indicating high similarities between the two scoring systems. We also observed a very high correlation of 0·99 between the diet quality scores based on the Nutri-Score and the NewTools-Score. Thus, results for correlations with single nutrients and the index measuring coherence with dietary guidelines, as well as associations with outcomes, were similar for the two scores (online Supplementary Table 1). This high degree of similarity suggests that, while the NewTools-Score offers a somewhat better alignment with the Nordic nutrition recommendations on a food level, it largely aligns with the Nutri-Score when converted into a diet quality score. The difference between the Nutri-Score and the NewTools-Score may seem small, but contributes to addressing important limitations of the Nutri-Score(Reference Amberntsson, Mohn Paulsen and Angela Bianchi12). The additional information required to calculate the NewTools-Score is readily available to producers and does not introduce any further practical challenges in the calculation.
Previous studies on Nutri-Score and health outcomes have used energy-weighting when calculating the average diet Nutri-Score. Weighting by energy has been shown to correlate well with both healthy and less healthy foods in expected directions(Reference Julia, Mejean and Touvier34–Reference Khoury, Sarda and Touvier36). An alternative approach is weighting by weight. Weighting a diet quality score by weight will put excessive weight to foods with high water content. However, an approach solely based on weighting by energy intake might not adequately capture the intake of such foods, which often are foods with high nutritional quality and low energy density, such as fruits and vegetables. Different weighting approaches have previously been investigated, where weighting by energy yielded a wider score distribution compared with weighting by weight intake(Reference Masset37). Both approaches were highly correlated (r 0·79). Based on the wider score distribution, weighting by energy intake was concluded to be the most suitable reference unit(Reference Masset37). We tested a novel approach for weighting the dietary index score both by energy and weight and used the average of the two. Based on our results, a mixed weights approach for weighting of the dietary index scores did not yield a better representation of the individual diet compared with energy intake alone, as mainly assessed by a poorer correlation to the dietary guideline index score.
The importance of a healthy diet, low in salt, sugar and saturated fat and high in fibre and fruits and vegetables, for prevention of non-communicable diseases has been known for a long time(Reference Vaduganathan, Mensah and Turco1). The WHO has pointed out that front-of-pack nutrition labels are important tools to help consumers make healthy food choices and ultimately decrease the risk of non-communicable disease(38). Predictive criterion validity of nutrient profile models is an important step in transferring the relevance of the label into actual disease risk(Reference Barrett, Afrin and Rayner13). This study adds to the current literature on the health relevance of the Nutri-Score and indicates the potential health relevance of the NewTools-Score for prevention of CVD. This study also proposes that the Nutri-Score and the NewTools-Score can be valid nutrient profiling models in a population of healthy and highly educated women for estimating later disease risk.
Strengths and limitations
Strengths of this study include its large sample size, prospective design and long follow-up period. Moreover, there was minimal loss to follow-up and few missing data points on covariates. The richness of the data allows for thorough control of potential confounding factors. Additionally, the study utilised a validated FFQ that included detailed questions about various foods and dietary items(Reference Brantsæter, Haugen and Alexander23). The outcome measures used were objective and did not rely on self-reporting, enhancing the accuracy of the data. Furthermore, the dietary index employed in the study showed a strong correlation with other indicators of a healthy diet, corroborating its relevance and reliability. Some limitations should be acknowledged. Women participating in MoBa are generally older, better educated, leaner and include fewer smokers than the general population of pregnant women(Reference Nilsen, Vollset and Gjessing39). Overall, the study population is well nourished, and the effect estimates can thus be expected to be weaker than in a more representative group of the population(Reference Nilsen, Vollset and Gjessing39). The data collection via questionnaires may have induced some misclassification from imprecision in the reporting of exposure and covariates. Particularly, dietary intakes were estimated via FFQ, a method that provides a reflection of habitual dietary intakes but with more limited variation of the nutritional quality of individual food products. Self-reporting is subject to reporting bias. Due to the prospective design, any measurement errors were probably similar between cases and non-cases. Nonetheless, these errors could have caused some degree of underestimation or overestimation of the relationships being studied. The evaluation of dietary intakes was conducted solely at baseline, and we were not able to account for any possible changes in food consumption over time. Although most women follow recommendations to reduce their intake of coffee and alcohol during pregnancy, evidence suggests, including from MoBa, that dietary patterns do not change substantially due to pregnancy(Reference Crozier, Robinson and Godfrey6,Reference Meltzer, Brantsæter and Ydersbond22) . However, the lack of repeated dietary data is likely to attenuate the estimated associations between diet and later health outcomes. In addition, estimation of habitual diet in pregnancy might not be representative for long-term diet. There is also a risk of systematic measurement error in the exposure related to, for example, BMI. This study utilised an observational design, which inherently includes some level of residual and unmeasured confounding and/or misspecification of the model (e.g., not acyclic associations). This study might have lacked power for some of the sensitivity analyses conducted. We cannot rule out the presence of selection bias for the outcome variables (not random who gets diagnosed and/or buy the prescribed medication), which might also be associated with diet quality. Further, we have some imprecision in the hypertension outcome as the blood-pressure-lowering medication may be prescribed for other reasons. Since previous and current medically treated hypertension was an exclusion criterion, this may have affected the small effect estimates seen in the cross-sectional analysis of blood pressure.
Conclusion
In this large Norwegian mother–child cohort study, poorer diet quality scores during pregnancy, assessed with a proposed revised version (the NewTools-Score) and the current Nutri-Score, were associated with a higher risk of prescription for medications for hypertension up to 11 years after childbirth. Our findings indicate that the two scores are viable and useful tools for characterising the nutritional quality of food products, reinforcing their potential as valuable tools for guiding consumers and ultimately improving public health.
Supplementary material
For supplementary material/s referred to in this article, please visit https://doi.org/10.1017/S0007114526107697
Acknowledgements
The Norwegian Mother, Father and Child Cohort Study is supported by the Norwegian Ministry of Health and Care Services and the Ministry of Education and Research. We are grateful to all the participating families in Norway who take part in this on-going cohort study. We thank Grace Egeland for her initiation and development of the research project ‘Determinants of hypertension following pregnancy’, Svetlana Skurtveit for her assistance in identifying pharmacologically treated hypertension in the NorPD and Inger Kristina Holtermann Ariansen for her input regarding the statistical modelling.
This work is a part of the NewTools project. ‘The NewTools project—Developing tools for food system transformation, including food summary scores for nutrition and sustainability’ is funded by the Research Council of Norway (Project No. 326888). The Norwegian Research Council had no role in the design, analysis or writing of this article. The twenty-eight project partners also contribute to a varying degree through self-financing of their own activities.
Conceptualisation: A. A., A. L. B., M. H. A., M. M. P., L. F. A. Methodology: A. A., A. L. B., M. H. A., M. M. P., L. F. A. Preparation of data and analysis: A. A., A. L. B., M. H. A. Visualisation: A. A., M. H. A. Interpretation of data: All authors. Writing original draft: A. A. Writing, reviewing and editing: All authors. Funding acquisition: A. L. B., M. H. A., L. F. A. All authors have read and approved the submitted version of the manuscript.
The authors have no conflict of interest to disclose.
The consent given by the participants does not open for storage of data on an individual level in repositories or journals. Researchers who want access to data sets for replication should apply through helsedata.no. Access to data sets requires approval from The Regional Committee for Medical and Health Research Ethics in Norway and an agreement with MoBa.
This study was conducted according to the guidelines laid down in the Declaration of Helsinki, and all procedures involving human subjects were approved by the Regional Committees for Medical and Health Research Ethics (2013/740). Written informed consent was obtained from all subjects. The establishment of MoBa and initial data collection was based on a license from the Norwegian Data Protection Agency and approval from The Regional Committees for Medical and Health Research Ethics. The MoBa cohort is currently regulated by the Norwegian Health Registry Act.
Consent for publication: Not applicable.


 Open access

