


Introduction
For more than two decades now, polar ice cores have been logged electrically using various methods to record the chemical stratigraphy of ice (e.g. Reference Wolff, Miners, Moore and ParenWolff and others, 1997). High-frequency (HF) methods such as dielectric profiling (DEP) are sensitive to the bulk concentrations of lattice-soluble acid (H+), chloride (Cl–) and ammonium (NH4 +) ions (Reference Moore, Reid and KipfstuhlMoore and others, 1994a; Stillman and others, in press). As a result, an empirical relationship for the HF electrical conductivity σ∞ of polar ice at -15°C now exists (Reference Wolff, Miners, Moore and ParenWolff and others, 1997):

However, this relationship is based on the bulk concentration (mol L–1) of these impurities only, and not directly on the number of protonic point defects created in the ice lattice by each impurity, as implied by theory (Reference JaccardJaccard, 1964). Without adequate knowledge of specific model parameters (e.g. defect mobility and activation energy), efforts to reconcile this relationship with Jaccard theory remain incomplete (Reference Moore, Reid and KipfstuhlMoore and others, 1994a; Reference Wolff, Miners, Moore and ParenWolff and others, 1997). Thus, significant uncertainty remains in our ability to predict the HF conductivity of ice from its chemistry, which is of particular importance for efforts to infer impurity partitioning in ice from electrical logs (Stillman and others, in press), to quantify englacial dielectric attenuation (e.g. Reference Corr, Moore and NichollsCorr and others, 1993; Reference MacGregor, Winebrenner, Conway, Matsuoka, Mayewski and ClowMacGregor and others, 2007) and to predict the performance of extraterrestrial orbital radar sounders (e.g. Reference Blankenship, Young, Moore, Moore, Pappalardo, McKinnon and KhuranaBlankenship and others, 2009).
Of the lattice-soluble ions common in polar meteoric ice, the electrical behavior of NH4 + in ice is the most poorly understood. The covalent radius of NH4 + allows it to substitute into the lattice to replace an H2O molecule. This replacement creates two Bjerrum D-defects (hereafter simply D-defects) in the ice lattice, which are hydrogen bonds that violate the Bernal-Fowler ice rules because they possess an H+ ion at both ends (e.g. Reference Petrenko and WhitworthPetrenko and Whitworth, 1999). Reference Moore, Reid and KipfstuhlMoore and others (1994a) found that, for the Greenland Ice Core Project (GRIP) ice core from central Greenland, the DEP response to NH4 + was about twice that per unit concentration of the response to Cl– (Eqn (1)). They concluded that NH4 + must be remarkably efficient at generating D-defects if their mobility is similar to extrinsic Bjerrum L-defects (hydrogen bonds with no H + ions) formed by Cl–. Previous measurements of frozen NH4 +-doped solutions with lattice-insoluble anions found that NH4 + increases HF conductivity (Reference Gross and SvecGross and Svec, 1997). Frozen NH4F and NH4Cl solutions also have a much higher HF conductivity than similar solutions of NaCl or HCl (fluoride’s electrical behavior in ice is similar to Cl–) (Reference Gross, Hayslip and HoyGross and others, 1978; Reference Gross and SvecGross and Svec, 1997). Despite this evidence, Reference Petrenko and WhitworthPetrenko and Whitworth (1999) concluded that the D-defect mobility is much less than L-defect mobility and should not affect the HF conductivity of ice, contrary to Eqn (1). However, they acknowledged that there is much uncertainty regarding D-defects and that additional data are needed.
Given the uncertainty surrounding a potentially important contributor to the HF conductivity of ice, here we revisit the electrical response of NH4 +-rich ice using broadband dielectric spectroscopy (e.g. Reference Grimm, Stillman, Dec and BullockGrimm and others, 2008). A broadband approach is crucial, because it permits unambiguous determination of the dielectric relaxations associated with the HF response observed by Reference Moore, Reid and KipfstuhlMoore and others (1994a) using DEP, along with calculation of the key Jaccard parameters.
Theory and Experimental Approach
Jaccard theory
Reference JaccardJaccard (1964) developed a theoretical model of the electrical properties of ice that described how each individual type of protonic point defect influences the frequency and temperature dependence of the electrical properties. Extrinsic Bjerrum defects are formed by lattice-soluble impurities (e.g. Cl– and NH4 +) that can replace an H2O molecule in the ice lattice. Jaccard theory does not consider the effect of any impurities excluded to grain boundaries or triple junctions. However, impurities excluded from the lattice do not typically affect the HF conductivity of ice (Stillman and others, in press), with important exceptions discussed below.
The conductivity a i due to each defect type is the product of the defect’s volumetric concentration ni , mobility µi and effective charge ei:

The values of mobility and charge have been constrained for most defects (e.g. Reference Camplin, Glen and ParenCamplin and others, 1978; Reference Petrenko and WhitworthPetrenko and Whitworth, 1999), but no value has been reported for the mobility of D-defects, µD .
The individual defect conductivities are summed by their defect group (ionic or Bjerrum). The HF conductivity of ice is the sum of these group conductivities. Thus, D-defects formed by NH4 + could affect the HF conductivity if their mobility is non-negligible, if their defect concentration is large or if they increase substitution of other impurities into the lattice. The latter scenario in particular merits consideration, as Reference Gross, Wong and HumesGross and others (1977) observed that NH4 + increased partitioning of Cl– into the lattice by a factor of ∼5 compared to all other monovalent, mono-atomic cations (e.g. H+, Na+).
Jaccard theory assumes that ice possesses a Debye dielectric relaxation, i.e. the Cole-Cole distribution parameter a equals zero (Reference Cole and ColeCole and Cole, 1941). However, the measured relaxation is rarely so ideal (a ≈ 0.1) . In a Debye relaxation, HF conductivity plateaus, whereas for a non-Debye relaxation HF conductivity continues to increase slightly with frequency. We therefore analyze our results in terms of the relaxation time τ rather than the frequency-dependent HF conductivity. When Bjerrum defects dominate, τ is defined as
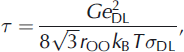
where G≈3, e DL is the charge of either a D- or L-defect (6.088 x 10⁻²⁰ C), r OO is the mean distance between oxygen ions in the ice lattice (2.764 x 10⁻¹⁰ m), kB is the Boltzmann constant (1.38 x 10⁻²³J K–1), T is temperature, and σDL is the sum of the D- and L-defect conductivities (e.g. Reference Petrenko and WhitworthPetrenko and Whitworth, 1999). Relaxation time is related to relaxation frequency fr as fr = 1/2πτ.
If a single defect type is dominant, the temperature dependencies of both the HF conductivity and the relaxation time are equivalent to the temperature dependence of that defect’s mobility, because both defect charge and concentration are temperature-independent (Eqn (2)). This temperature dependence is used to discriminate between defect types. At low extrinsic Bjerrum defect concentrations and/or high temperatures (>-40°C), the activation energy of intrinsic L-defects is high (∼0.58eV). At low to moderate concentrations of extrinsic L-defects or low temperatures (<–40°C), their activation energy is ∼0.19-0.24eV (Reference Takei and MaenoTakei and Maeno, 1987; Reference Grimm, Stillman, Dec and BullockGrimm and others, 2008). In this regime, the HF conductivity is proportional to the defect concentration (Eqn (2)). For high extrinsic L-defect concentrations (up to the solubility limit) and/or very low temperatures, the activation energy increases to 0.294 eV because these defects begin to interfere with one another (Reference Grimm, Stillman, Dec and BullockGrimm and others, 2008). No activation energy for extrinsic D-defects has been reported previously.
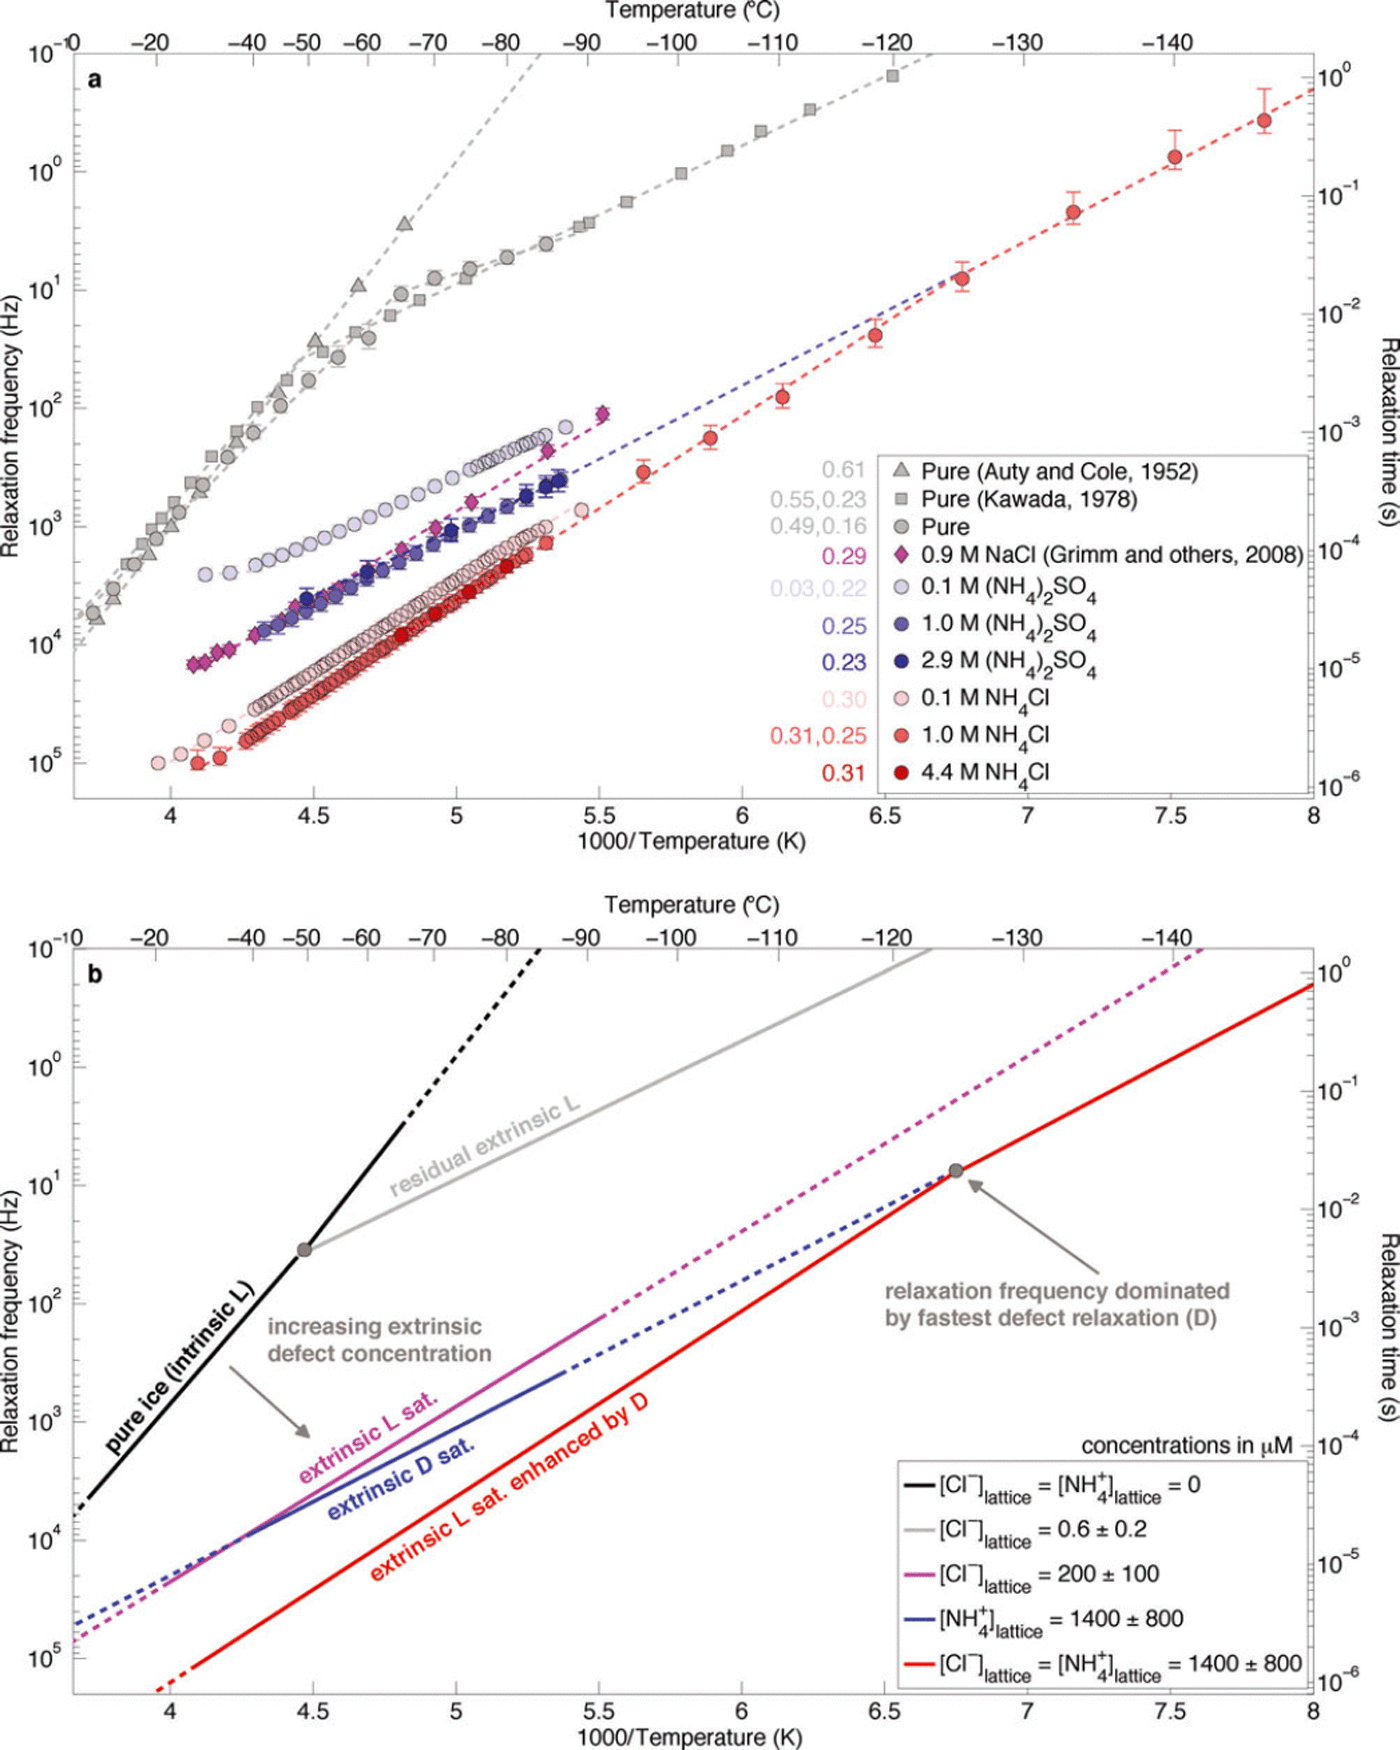
Because of the high activation energy of intrinsic L-defects, even in extremely pure ice extrinsic L-defects control the relaxation time at low temperatures. Reference KawadaKawada (1978) measured the dielectric properties of ice frozen from triply deionized water and observed this transition between intrinsic and extrinsic L-defects near-50°C (Fig. 1). Assuming μexL = 2 x 10⁻⁸m2 V–1 s–1 at-20°C and adjusting the mobility to -50°C with an unsaturated L-defect activation energy of 0.232 eV (Reference KawadaKawada, 1978; Reference Grimm, Stillman, Dec and BullockGrimm and others, 2008), we find that the residual extrinsic L-defect concentration is equivalent to a Cl– lattice concentration of 0.6 ± 0.2 μM.
(a) Temperature dependence of the relaxation frequency of NH4 +-rich laboratory-frozen ices. Initial solution concentrations of the laboratory-frozen samples (which are also the bulk ice concentration) are given in the legend. Error bars represent the 95% confidence intervals for each value, estimated using x 2 distributions. Activation energies (eV) are shown in the same colour adjacent to the legend. Uncertainties for these values are typically <0.01 eV. Where two activation energies are given, the temperature dependence is fit across two adjacent temperature ranges, and the high temperature value is given first. (b) Schematic interpretation of observations.
Sample preparation and dielectric measurements
(NH4)2SO4 solutions were chosen to determine unambiguously the electrical response to defects formed by NH4 +only, because the covalent radius of SO4 2– is too large to substitute for H2O in the ice lattice and form protonic point defects. Conversely, measurement of frozen NH4Cl solutions permits investigation of the possible co-substitution of both ions.
The sample holder was placed into an insulated, temperature-adjustable freezer for the dielectric measurements. (NH4)2SO4 (0.1, 1.0 and 2.9 M) and NH4Cl (0.1, 1.0 and 4.4 M) solutions were frozen directly onto the electrodes. The laboratory-frozen samples were cylindrical disks 3 cm in diameter and 0.6cm thick and frozen slowly to produce polycrystalline ice free of bubbles and cracks. Solutions were held at 2 K below their freezing point for 1 hour to initialize crystallization and then 10 K below their freezing point for an additional 2 hours to crystallize any meta-stable water. The sample was reheated and annealed at 2 K below their freezing point for 3 hours. This process was then repeated at the sample’s eutectic temperature. The lowest measurement temperature was reached slowly (0.1 K min–1) to impede crack formation. Measurements during subsequent warming were typically made at 5 K intervals, while stabilizing temperature to within 0.2 K for at least 30 min. See Reference Grimm, Stillman, Dec and BullockGrimm and others (2008) for additional details regarding sample preparation.
We measured the broadband (10–2-106Hz) dielectric properties of these ices at various temperature ranges between -145°C and -1°C. We used a three-electrode sample holder with a Solartron 1260A impedance analyzer and a Solartron 1296A dielectric interface. The complex impedance was converted into complex dielectric permittivity using the electrode geometry, and the Cole-Cole parameters describing each observed dielectric relaxation were modeled by nonlinear curve fitting, following Reference Grimm, Stillman, Dec and BullockGrimm and others (2008).
The lattice concentration of the laboratory-frozen ice samples is inevitably much less than the concentration of the solution from which they were frozen. For example, Reference Gross, Wong and HumesGross and others (1977) reported a partition coefficient of 1.4 x 10⁻² for slowly frozen NH4Cl solutions with the rest excluded to grain boundaries or inclusions. At higher concentrations the ice lattice saturates in defects formed by NH4 + and/or Cl– and yet larger fractions of the initial concentration are excluded from the lattice. In the presence of any cation other than NH4 + , the solubility limit of Cl– in ice is 200 ± 100 mM (Reference SeidenstickerSeidensticker, 1972; Reference Gross, Wong and HumesGross and others, 1977; Reference Domine, Thibert, Van Landeghem, Silvente and WagnonDomine and others, 1994; Reference Moore, Wolff, Clausen, Hammer, Legrand and FuhrerMoore and others, 1994b). However, the solubility limits of either NH4 + alone or Cl– in the presence of NH4 + have not yet been reported. Reference Gross, Wong and HumesGross and others (1977) inferred the solubility limits of HCl and NaCl accurately by observing when the partition coefficient of those impurities decreased despite increasing solution concentration. Similarly, we infer from measurements of the relaxation time of NH4Cl-doped ice by Reference Gross, Wong and HumesGross and others (1977) (their fig. 11) that the solubility limit of NH4Cl in ice is 400–2000 μM. Because the defects formed by Cl– are expected to co-substitute with those formed by NH4 + , we infer that this solubility limit is also that of NH4 + alone.
The HF conductivity of ice is affected by excluded impurities under two conditions only: (1) The bulk salt concentration is sufficiently high (typically >10–3 M) and the temperature is above the eutectic temperature so that electrolytic conduction through the interconnected brine channels becomes non-negligible (Reference Grimm, Stillman, Dec and BullockGrimm and others, 2008). (2) The salt-hydrate volume fraction is greater than a few percent, so soluble impurities also create extrinsic defects in the salt hydrates and hence a dielectric relaxation that is faster than that of the ice lattice (Reference Grimm, Stillman, Dec and BullockGrimm and others, 2008). The first scenario is avoided by analysis of data at temperatures well below the eutectic temperatures of the frozen solutions (–9°C and –5°C for NH4Cl and (NH4)2SO4, respectively). The second scenario is avoided by using the lowest solution concentration with a defect-saturated lattice, so that the possible presence of salt-hydrate relaxation is minimized, but this relaxation can also be detected using Cole–Cole modeling.
Results
Relaxation-frequency behaviour
The relaxation frequency of the (NH4)2SO4-doped samples is more than an order of magnitude larger than that of classic measurements of pure laboratory-frozen ice, even at the lowest solution concentration (Fig. 1a). This observation demonstrates clearly that NH4 + affects the HF conductivity of ice, independent of other lattice-soluble ions, by increasing the relaxation frequency. Because the relaxation frequency did not change significantly between the frozen 1.0 and 2.9 M original liquid concentration of (NH4)2SO4 ([(NH4)2SO4]liq) solutions, the solubility limit (or saturation concentration) of D-defects for our freezing procedure must lie at 1.0M, or below, times an unknown partition coefficient. The temperature dependence of the relaxation frequency of the D-defect-dominated samples (0.247 eV) is lower than that of L-defect-saturated ice frozen from Cl–-rich solutions (0.294 eV; Reference Grimm, Stillman, Dec and BullockGrimm and others, 2008), suggesting that significant Cl– contamination did not occur. Note that the formal uncertainties for these activation energies are generally <0.01 eV.
The relaxation frequency of the NH4Cl-doped samples is much larger than that of either (NH4)2SO4- or NaCl-doped samples that are saturated in Bjerrum defects generated by NH4 + or Cl–, respectively (Fig. 1a). These observations are consistent with previous measurements of frozen NH4F and NH4Cl solutions (Reference Gross, Hayslip and HoyGross and others, 1978; Reference Gross and SvecGross and Svec, 1997). Above –125°C, the temperature dependence of the relaxation frequency of both saturated NH4Cl-doped samples is 0.310 eV. This value is close to that of Cl–-saturated ice, suggesting that the mechanism causing the higher relaxation frequencies is simply increased solubility of Cl– into the ice lattice due to co-substitution of NH4 + . Below –125°C, the relaxation-frequency temperature dependence decreases to 0.253 eV, indicating that D-defects have a higher mobility than L-defects at low temperatures.
Jaccard analysis
We now use Jaccard theory to determine the mobility of D-defects, but first we verify that our data are consistent with earlier experiments that determined the mobility of L-defects. Because the solubility limit of L-defects formed by Cl– is well constrained, but that of D-defects formed by NH4 + is poorly constrained, the mobility of the latter cannot be determined from the (NH4)2SO4 experiments alone.
To calculate defect mobilities, we assume that the lattice is saturated with the relevant defect once the relaxation frequency plateaus despite increasing solution concentration. As explained above, in the presence of any cation other than NH4 + , the solubility limit of Cl– is 2 0 0 ± 100μM and the activation energy of the saturated L-defect mobility is 0.294eV (Reference Grimm, Stillman, Dec and BullockGrimm and others, 2008). Combining Eqns (2) and (3) yields μL= 1.0±0.5 × 10⁻⁸m2 V–1 s–1 at -20°C (Table 1; see Appendix for detailed analysis), which is slightly lower than that synthesized by Reference Petrenko and WhitworthPetrenko and Whitworth (1999) (2 × 10⁻⁸ m2 V–1 s–1). This difference could be due to experimental error or the L-defect mobility may depend on concentration, as does the activation energy. The latter behavior also occurs for ionic defects (Reference Camplin, Glen and ParenCamplin and others, 1978).
The increase in the relaxation frequency of the NH4Cl-saturated ice is equivalent to a factor of 7.2 ± 2 . 5 increase in the solubility of extrinsic L-defects formed by Cl–. Thus, the solubility limit of Cl– when it co-substitutes into the ice lattice with NH4 + is 1400 ±800 mM (Table 1). This solubility limit is within the range for NH4Cl (400-2000μM) that we inferred earlier from the reanalysis of the partitioning data of Reference Gross, Wong and HumesGross and others (1977).
Summary of the Jaccard parameters derived in this study. See table 6.4 of Reference Petrenko and WhitworthPetrenko and Whitworth (1999) (p. 154) for Jaccard parameters of other protonic point defects

The temperature dependence of the 1.0M [NH4Cl]liq sample changes below -125°C from the L-defect value (0.310eV) to the saturated D-defect value inferred from the 1.0 and 2.9M [(NH4)2SO4]liq samples (0.253 eV). This temperature, where D-defects begin to dominate the relaxation, matches that predicted by extrapolation of the temperature dependence of the (NH4)2SO4 samples (Fig. 1b). This observation indicates that the lattice concentration of D-defects in the saturated (NH4)2SO4-doped samples is equal to that in the saturated NH4Cl samples. Because NH4 + and Cl– ions co-substitute and these ions form two D- and two L-defects, respectively, we assume that their defect concentrations are equal in the frozen NH4Cl solutions. Thus, the co-substitution of Cl– does not increase the solubility limit of NH4 + , and the solubility limit of NH4 + with or without co-substituted Cl– is also 1400±800μM. We then calculate the saturated mobility of D-defects to be 1.4 ± 0.8 x 10⁻⁹ m2 V–1 s–1 at -20°C (Table 1; Appendix), or about an order of magnitude lower than that of L-defects at the same temperature.
Discussion and Conclusions
We determined the D-defect mobility and its temperature dependence at saturation for the first time. We further constrained the solubility limit of co-substituted NH4 + and Cl– in ice to be 1400 ± 800 μM. There can now be no doubt that D-defects are mobile in the lattice and that they can affect the HF conductivity of ice significantly not only through their relatively small mobility but also through the associated co-substitution of Cl–.
These results explain the vexing ammonium-DEP relationship observed by Reference Moore, Reid and KipfstuhlMoore and others (1994a) and show that the relationship between ice chemistry and DEP is not yet fully understood. For example, if we consider a 10% increase in at-15°C, which is large enough to distinguish the DEP response to NH4 + , then following Eqns (1), (2) and (A1) and the Jaccard parameters determined above, a 10% increase in is equivalent to an NH4 + lattice concentration of 7.0 μM. Critically, this calculation assumes that no Cl–-produced L-defects are present, so that NH4 + is balanced by another anion. The Cl– lattice concentration necessary to produce an equivalent increase in is only 0.50 mm. Alternatively, if both NH4 + and Cl– co-substitute into the lattice equally, then the lattice concentration of both ions necessary to produce a 10% increase in is slightly lower (0.46 M).
Bulk NH4 + concentrations greater than 7 μM occur in <0.02% of all samples measured in the Greenland Ice Sheet Project 2 (GISP2) ice core (Reference Yang, Mayewski, Twickler and WhitlowYang and others, 1997), which is similar to the GRIP ice core from which the empirical relationship (Eqn (1)) was derived. Hence, it is unlikely that the GRIP DEP response to NH4 + was detected due to that impurity’s HF response alone. The background value of bulk Cl– concentration from the same core (GISP2) is ∼0.3 M, and bulk Cl– and NH4 + concentrations are not well correlated (Reference Yang, Mayewski, Twickler and WhitlowYang and others, 1997). Therefore, the DEP response is most likely not due to D-defects formed by NH4 + , but rather due to the increase in L-defects formed by the increased lattice concentration of Cl–. This increased concentration occurs because the NH4 + cation allows increased partitioning of the Cl– anion into the lattice by co-substitution.
We suggest that the covariance of these two impurities (Cl– and NH4 +) must be taken into account both when interpreting DEP logs of ice cores and when modeling englacial radar attenuation for ice masses that contain non-negligible concentrations of both impurities. NH4 + concentrations are about an order of magnitude higher in the Greenland ice sheet than in Antarctica, while Cl– concentrations can be high in both ice sheets, particularly in coastal regions (Reference Legrand and MayewskiLegrand and Mayewski, 1997). Thus, these complications in both interpretation and prediction of the HF conductivity of ice are likely of greater concern for Greenland and the coastal regions of Antarctica.
Acknowledgements
This work was supported by NASA’s Planetary Geology and Geophysics Program (NNX10AJ65G, NNX08AM92G). We thank the editor and two anonymous reviewers for comments that improved the manuscript significantly.
Appendix
The extrinsic L- and D-defect mobilities are calculated by first finding the volumetric defect concentration n and then using the modeled data to find the relaxation time τ:

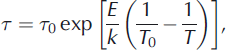
where A is the Avogadro constant (6.0221 x 10²³ mol–1 ), p = 2 is the number of defects per substitution for either Cl– or NH4 + , S is the defect’s molarity in the lattice, τ 0 is the relaxation time at a reference temperature (T 0 = -20°C), and E is the activation energy. The factor of 1000 in Eqn (A1) arises from the conversion between standard units used for S (L) and n (m3). We calculated n N L H 4 Clsat and thus S for NH4 + in our frozen solutions at temperatures above -125°C as

The mobility is then calculated by combining Eqns (2) and (3):

Table 1 summarizes the results of these calculations.



