


1. Introduction
The atomisation of a liquid jet has driven interest in the fluid mechanics community because of its occurrence in both natural and industrial applications (e.g. propellant combustion, pharmaceutical sprays). The process results in a ‘cascade mechanism’ for fluid fragmentation (Plateau Reference Plateau1873; Eggers Reference Eggers1997; Marmottant & Villermaux Reference Marmottant and Villermaux2004; Constante-Amores et al. Reference Constante-Amores, Kahouadji, Batchvarov, Seungwon, Chergui, Juric and Matar2020a): from the growth of linear modes through a Kelvin–Helmholtz instability to the development of nonlinearities leading to capillary breakup events via long-filament pinch-off that can be modulated by a Rayleigh–Plateau instability or controlled by an ‘end-pinching’ mechanism. Understanding the interfacial dynamics relies on the characterisation of the vortex–interface interactions. For instance, Jarrahbashi et al. (Reference Jarrahbashi, Sirignano, Popov and Hussain2016), Zandian, Sirignano & Hussain (Reference Zandian, Sirignano and Hussain2018, Reference Zandian, Sirignano and Hussain2019) and Constante-Amores et al. (Reference Constante-Amores, Kahouadji, Batchvarov, Shin, Chergui, Juric and Matar2021b) reported that their interplay determines the interfacial dynamics for turbulent jets; Hoepffner & Paré (Reference Hoepffner and Paré2013) showed that vorticity production results in a change in the capillary retraction of a liquid thread. Theoretically, Longuet-Higgins (Reference Longuet-Higgins1992), Wu (Reference Wu1995) and Lundgren & Koumoutsakos (Reference Lundgren and Koumoutsakos1999) demonstrated that vorticity production depends on the velocity field and the interfacial curvature for the condition of zero shear stress at a free surface. Additionally, Brøns et al. (Reference Brøns, Thompson, Leweke and Hourigan2014) and Terrington, Hourigan & Thompson (Reference Terrington, Hourigan and Thompson2020, Reference Terrington, Hourigan and Thompson2021) extended the previous results to show that interfacial curvature effects, viscosity and density difference across the interface are the only mechanisms driving vorticity production. Recently, Fuster & Rossi (Reference Fuster and Rossi2021) also demonstrated the role of interfacial curvature and density differences across the interface with identical dynamical viscosity via two-dimensional, non-axisymmetric numerical studies.
We note that the studies mentioned in the foregoing involve a constant surface tension and therefore do not support the formation of Marangoni gradients. Liquid streams, however, are invariably contaminated with surface-active agents (surfactants), deliberately placed or naturally occurring, which give rise to surface tension gradients, and subsequently Marangoni-induced flow (Manikantan & Squires Reference Manikantan and Squires2020). While the atomisation of uncontaminated liquid jets has received significant attention in the literature (Desjardins & Pitsch Reference Desjardins and Pitsch2010; Herrmann Reference Herrmann2010; Jarrahbashi & Sirignano Reference Jarrahbashi and Sirignano2014; Jarrahbashi et al. Reference Jarrahbashi, Sirignano, Popov and Hussain2016; Zandian et al. Reference Zandian, Sirignano and Hussain2018, Reference Zandian, Sirignano and Hussain2019; Constante-Amores et al. Reference Constante-Amores, Kahouadji, Batchvarov, Shin, Chergui, Juric and Matar2020b, Reference Constante-Amores, Kahouadji, Batchvarov, Shin, Chergui, Juric and Matar2021b), the effect of surfactant on their dynamics remains far less studied.The multi-scale nature of the flow, and the complex coupling between the surfactant concentration fields and interfacial topology, complicate its experimental scrutiny. This can be alleviated via the use of high-fidelity simulations that can unravel the delicate interplay among the different physical mechanisms across the relevant scales.
Through the use of state-of-the-art imaging techniques, Kooij et al. (Reference Kooij, Sijs, Denn, Villermaux and Bonn2018), Sijs, Kooij & Bonn (Reference Sijs, Kooij and Bonn2021) and Sijs et al. (Reference Sijs, Kooij, Holterman, van de Zande and Bonn2021) showed that the presence of surfactants influences the interfacial fragmentation during atomisation and decreases the mean droplet size in agreement with Butler Ellis, Tuck & Miller (Reference Butler Ellis, Tuck and Miller2001) and Ariyapadi, Balachandar & Berruti (Reference Ariyapadi, Balachandar and Berruti2004). All the previous studies, however, have not reported the role of Marangoni stresses, which the present paper will address for the case of an insoluble surfactant. Although the presence of surfactants can also induce both shear and dilatational surface rheological effects (discussed below), these effects will not be considered in this study. Nonetheless, we will use transient numerical simulations to demonstrate that the Marangoni stresses influence the production of vorticity near the interface, and modify the interface–vortex interactions and the three-dimensional destabilisation of the jet. In order to focus on the role of Marangoni stresses in the jet dynamics, we will study the case of a jet of one fluid issuing into another characterised by equal densities and viscosities.
There has been significant scientific interest in studying the role of surfactants in the destabilisation and fragmentation of non-turbulent liquid jets of pure Newtonian fluids; see, for example, Eggers (Reference Eggers1993), Lister & Stone (Reference Lister and Stone1998), Craster, Matar & Papageorgiou (Reference Craster, Matar and Papageorgiou2002); Craster, Matar & Papageoriou (Reference Craster, Matar and Papageoriou2009) and Liao et al. (Reference Liao, Subramani, Franses and Basaran2004). Those authors have shown the existence of multiple intermediate or transient scaling regimes that are not altered by the presence of surfactants as they are convected away from the pinch-off region. However, McGough & Basaran (Reference McGough and Basaran2006) and Kamat et al. (Reference Kamat, Wagoner, Thete and Basaran2018) showed the formation of micro-threads, which connect drops during the surfactant-induced thinning. Additionally, the presence of surfactants not only gives rise to gradients in surface tension and hence tangential interfacial stresses, but also induces both shear and dilatational surface rheological effects. Recently, works by Wee et al. (Reference Wee, Wagoner, Garg, Kamat and Basaran2021) and Martínez-Calvo & Sevilla (Reference Martínez-Calvo and Sevilla2020) have analysed theoretically the influence of surface viscosities on the pinch-off dynamics of a jet of an incompressible Newtonian liquid that is surrounded by a passive gas.
The rest of this paper is structured as follows. In § 2, the problem formulation, governing dimensionless parameters and numerical method are introduced. Section 3 provides a discussion of the results, and concluding remarks are given in § 4.
2. Problem formulation and theoretical considerations
Since the aim here is to shed light on the different mechanisms that influence the production of vorticity near the interface in the presence of surfactants, we present a general theoretical description of vorticity and circulation in a three-dimensional (3-D) control volume enclosing an interface using Lighthill's and Lyman's flux definitions (Terrington et al. Reference Terrington, Hourigan and Thompson2021). We also provide a brief description of the numerical technique that is used to carry out the computations. Finally, we provide motivation for the choice of physical and physico-chemical parameters made in the present work.
2.1. Formulation and numerical method
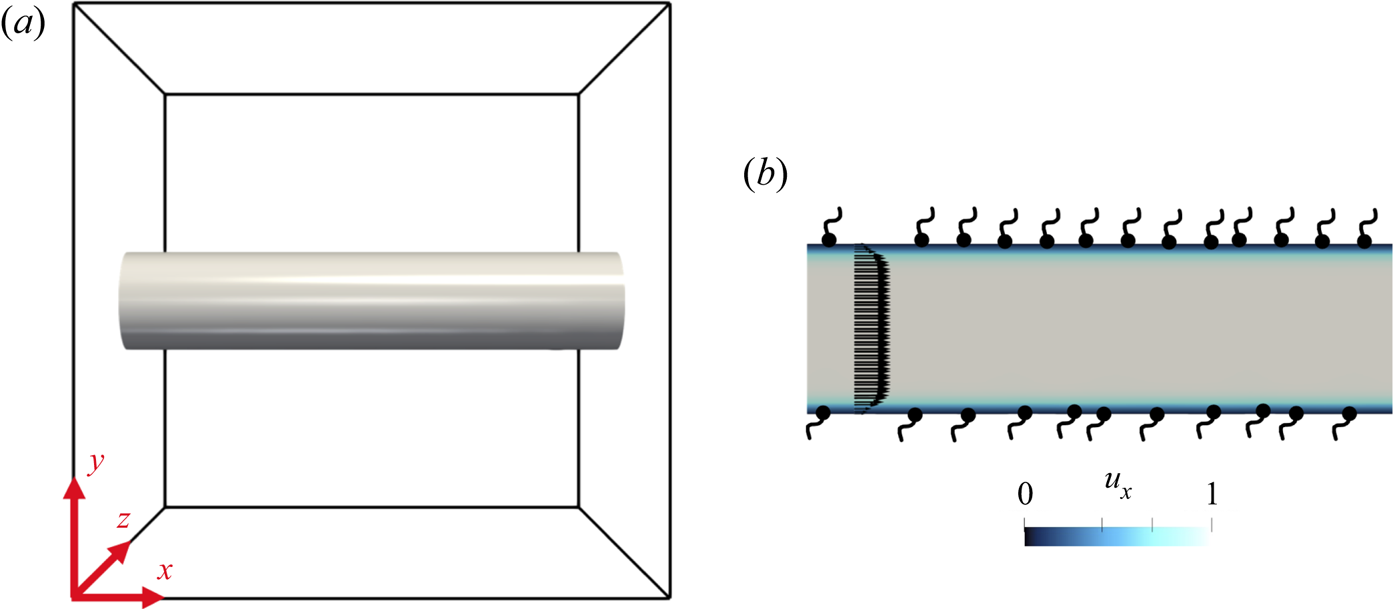
Figure 1 shows a representation of the flow configuration considered in this study in a 3-D Cartesian domain  $\boldsymbol {x} = (x, y, z )$: a liquid segment is initialised as a cylinder of diameter
  $D$, with a finite length, i.e.
  $5D$, in the positive
  $x$ (streamwise) direction. Such an approach has been used by Desjardins & Pitsch (Reference Desjardins and Pitsch2010), Jarrahbashi et al. (Reference Jarrahbashi, Sirignano, Popov and Hussain2016) and Zandian et al. (Reference Zandian, Sirignano and Hussain2018) for planar and cylindrical jets. Appendix A shows the effect of varying the domain size. We will focus on the case of insoluble surfactants, which enables us to isolate the surfactant-induced Marangoni dynamics during the atomisation of the jet. We acknowledge, however, that experimental studies feature soluble surfactants that are dissolved in the liquid that issues from a nozzle to form the jet, and that the sorption kinetics controls the surfactant interfacial concentration, adding extra layers of complexity.
(a) Initial interfacial shape, highlighting the computational domain of size  $(5D)^3$ in a 3-D Cartesian space
  $\boldsymbol {x} = (x, y, z)$. (b) Schematic representation of the problem in the
  $x$–
$x$– $y$ plane (
 $z=2.5D$) showing the initial (
 $t=0$) streamwise velocity profile
  $u_x$, and a representation of a monolayer of an insoluble surfactant.
The dimensional governing equations, which can be found in the work of Shin et al. (Reference Shin, Chergui, Juric, Kahouadji, Matar and Craster2018), are rendered dimensionless using the following scalings:
 \begin{equation} \tilde{\boldsymbol{x}}=\frac{\boldsymbol{x}}{D}, \quad \tilde{t}=\frac{t}{t_{r}}, \quad \tilde{\boldsymbol{u}}=\frac{\boldsymbol{u}} {U}, \quad \tilde{p}=\frac{p}{\rho U^2}, \quad \tilde{\sigma}=\frac{\sigma}{\sigma_s}, \quad \tilde{\varGamma}=\frac{\varGamma}{\varGamma_\infty}, \end{equation}
where  $t$,
$t$,  $\boldsymbol {u}$ and
  $p$ stand for time, velocity and pressure, respectively; here, the dimensionless variables are designated using tildes. The physical parameters correspond to the liquid density
  $\rho$, viscosity
  $\mu$, surface tension
  $\sigma$, surfactant-free surface tension
  $\sigma _s$, initial jet diameter
  $D$, and injection velocity
  $U$. Hence the characteristic time scale based on the injection velocity is
  $t_r=D/U$. The interfacial surfactant concentration
  $\varGamma$ is scaled with the saturation interfacial concentration
  $\varGamma _{\infty }$.
Using the relations in (2.1a–f), the dimensionless forms of the continuity and momentum equations are respectively expressed as
 \begin{gather} \boldsymbol{\nabla} \boldsymbol{\cdot} \tilde{\boldsymbol{u}}=0,\end{gather}
 \begin{gather} \tilde{\rho}\left(\frac{\partial \tilde{\boldsymbol{u}}}{\partial \tilde{t}}+\tilde{\boldsymbol{u}} \boldsymbol{\cdot}\boldsymbol{\nabla} \tilde{\boldsymbol{u}}\right) ={-} \boldsymbol{\nabla} \tilde{p} + \frac{1}{{\textit{Re}}}\boldsymbol{\nabla}\boldsymbol{\cdot} \left [ \tilde{\mu} (\boldsymbol{\nabla} \tilde{\boldsymbol{u}} +\boldsymbol{\nabla} \tilde{\boldsymbol{u}}^{\rm T}) \right ] \nonumber\\ +\frac{1}{{\textit{We}}} \int_{\tilde{A}(\tilde{t})} \left( \tilde{\sigma} \tilde{\kappa} \hat{\boldsymbol{s}} + \boldsymbol{\nabla}_s \tilde{\sigma}\right)\delta (\tilde{\boldsymbol{x}} - \tilde{\boldsymbol{x}}_{f} ) \,{\rm d}\tilde{A} , \end{gather}
where  $\tilde \kappa$ represents the interface curvature,
  $\boldsymbol {\nabla }_s$ is the surface gradient operator, and
  $\hat {\boldsymbol {s}}$ is the outward-pointing unit normal to the interface. Here,
  $\tilde {\boldsymbol {x}}_f$ is the parametrization of the time-dependent interface area
  $\tilde {A}(\tilde {t})$, where
  $\delta (\tilde {\boldsymbol {x}}-\tilde {\boldsymbol {x}}_f)$ is the 3-D Dirac delta function. The density
  $\tilde {\rho }$ and viscosity
  $\tilde {\mu }$ are given by the expressions
 \begin{equation} \tilde{\rho}( \tilde{\boldsymbol{x}},\tilde{t})=\frac{\rho_g}{\rho_l} + \left(1 -\frac{\rho_g}{\rho_l}\right) H( \tilde{\boldsymbol{x}},\tilde{t}),\quad \tilde{\mu}( \tilde{\boldsymbol{x}},\tilde{t})=\frac{\mu_g}{\mu_l}+ \left(1 -\frac{\mu_g}{\mu_l}\right) H( \tilde{\boldsymbol{x}},\tilde{t}), \end{equation}
where  $H( \tilde {\boldsymbol {x}},\tilde {t})$ represents a smoothed Heaviside function, which is zero in the gas phase and unity in the liquid phase, while the subscripts
  $l$ and
  $g$ designate the individual liquid and gas phases, respectively.
The dimensionless surfactant transport is given by
 \begin{equation} \frac{\partial \tilde{\varGamma}}{\partial \tilde{t}}+\boldsymbol{\nabla}_s \boldsymbol{\cdot} \left(\tilde{\varGamma}\tilde{\boldsymbol{u}}_{t}\right)=\frac{1}{Pe_s} \nabla^2_s \tilde{\varGamma}, \end{equation}
where  $\tilde {\boldsymbol {u}}_{t}=(\tilde {\boldsymbol {u}}_{s}\boldsymbol {\cdot }\boldsymbol {t})\boldsymbol {t}$ is the tangential velocity vector in which
  $\tilde {\boldsymbol {u}}_{s}$ is the surface velocity and
  ${\boldsymbol {t}}$ is the unit tangent to the interface. The scaling results in the following dimensionless groups:
 \begin{equation} {\textit{Re}} =\frac{\rho U D}{\mu}, \quad {\textit{We}} =\frac{\rho U^2 D}{\sigma_s}, \quad Pe_s=\frac{ U D}{\mathcal{D}_s},\quad \beta_s= \frac{\Re \,T \varGamma_\infty}{\sigma_s}, \end{equation}
where  $ {\textit {Re}}$,
  $ {\textit {We}}$ and
  $Pe_s$ denote the Reynolds, Weber and (interfacial) Péclet numbers, respectively, while
  $\beta _s$ is a surfactant elasticity number that represents a measure of the sensitivity of
  $\sigma$ to
  $\varGamma$; here,
  $\Re $ is the ideal gas constant value
  $8.314$ J K
 $^{-1}$ mol
 $^{-1}$,
  $T$ denotes temperature, and
  $\mathcal {D}_s$ refers to the diffusion coefficient.
To describe the relation between  $\tilde {\sigma }$ and
  $\tilde {\varGamma }$, we use the nonlinear Langmuir equation:
 \begin{equation} \tilde{\sigma}=1 + \beta_s \ln(1 -\tilde{\varGamma}). \end{equation}
Surface tension gradients are expressed as a function of  $\tilde {\varGamma }$ as
 \begin{equation} \boldsymbol{\nabla}_s \tilde{\sigma} /{\textit{We}} ={-}{\textit{Ma}} / (1-\tilde{\varGamma})\, \boldsymbol{\nabla}_s\tilde{\varGamma}, \end{equation}
where  $ {\textit {Ma}}=\beta _s/ {\textit {We}}=\Re \, T \varGamma _\infty /\rho U^2 D$ is a Marangoni parameter.
The 3-D numerical simulations were performed by solving the two-phase Navier–Stokes equations in the Cartesian domain  $\boldsymbol {x} = (x, y, z )$. A hybrid front-tracking/level-set method was used to treat the interface where surfactant transport was resolved in the plane of the interface (Shin et al. Reference Shin, Chergui, Juric, Kahouadji, Matar and Craster2018). The simulations are initialised with a turbulent velocity profile in the liquid jet segment (i.e.
  $u(r) = 15/14 U (1- (r/ (D/2))^{28}$) (Constante-Amores et al. Reference Constante-Amores, Kahouadji, Batchvarov, Shin, Chergui, Juric and Matar2021b). Solutions are sought subject to Neumann boundary conditions on all variables at the lateral boundaries, and periodic boundary conditions in the
  $x$ (streamwise) direction. The computational domain is a cube with dimensions
  $(5D)^3$ resolved globally by a uniform grid of
  $(786)^3$ cells; see appendix of Constante-Amores et al. (Reference Constante-Amores, Kahouadji, Batchvarov, Shin, Chergui, Juric and Matar2021b) for details of mesh-refinement studies and validation of the numerical method. This method has also been widely tested for surfactant-laden flows (Shin et al. Reference Shin, Chergui, Juric, Kahouadji, Matar and Craster2018; Constante-Amores et al. Reference Constante-Amores, Kahouadji, Batchvarov, Seungwon, Chergui, Juric and Matar2020a, Reference Constante-Amores, Kahouadji, Batchvarov, Shin, Chergui, Juric and Matar2021a, Reference Constante-Amores, Chergui, Shin, Juric, Castrejón-Pita and Castrejón-Pita2022; Batchvarov et al. Reference Batchvarov, Kahouadji, Constante-Amores, Norões Gonçalves, Shin, Chergui, Juric, Craster and Matar2021), and the numerical simulations in this study conserve fluid volume and surfactant mass with a relative error of less than
  $10^{-3}\,\%$.
Next, we motivate the values of material properties by looking into the sources for vorticity production at an interface in a 3-D framework. These sources are due to differences in density (i.e. baroclinic effect) and viscosity, surface tension forces (due to gradients of curvature along the interface) and Marangoni stresses. Thus to unravel the importance of the surfactant-induced Marangoni stresses on the vortex–surface–surfactant interactions, we focus on situations in which surface tension forces and Marangoni stresses are the only physical mechanisms responsible for vorticity production at the interface, i.e. the jump in material properties across the interface is zero (Fuster & Rossi Reference Fuster and Rossi2021). This is a realistic assumption for immiscible liquid–liquid systems exemplified by the silicone oil–water pairing used by Ibarra (Reference Ibarra2017) and Ibarra, Shaffer & Savaş (Reference Ibarra, Shaffer and Savaş2020) in their two-phase, stratified pipe flow experiments.
The values of the dimensionless quantities are consistent with experimentally realisable systems and are chosen to ensure a full coupling between surfactant-induced Marangoni stresses and interfacial diffusion, and inertia. We set  $ {\textit {Re}}=5000$ to ensure a rich dynamics (Constante-Amores et al. Reference Constante-Amores, Kahouadji, Batchvarov, Shin, Chergui, Juric and Matar2021b), and focus on the range
  $50 < {\textit {We}}< 1000$ to account for realistic values of
  $\sigma _s$, i.e.
  $O(10^{-3}) < \sigma _s < O(10^{-1})\,{\rm N}\,{\rm m}^{-1}$. The parameter
  $\beta _s$ is related to
  $\varGamma _\infty$ and therefore to the critical micelle concentration (CMC), i.e.
  $\varGamma _\infty \sim O(10^{-6})$ mol m
 $^{-2}$ for NBD-PC (1-palmitoyl- 2-12-[(7-nitro-2-1,3-benzoxadiazol-4-yl)amino]dodecanoyl-sn-glycero-3-phosphocholine) (Strickland, Shearer & Daniels Reference Strickland, Shearer and Daniels2015); thus we have explored the range
  $0.1 <\beta _s<0.9$, which corresponds to CMC in the range
  $O(10^{-7}) < {\rm CMC} < O(10^{-6})$ mol m
 $^{-2}$, for typical values of
  $\sigma _s$. We have set
  $Pe_s=10^2$ following Batchvarov et al. (Reference Batchvarov, Kahouadji, Magnini, Constante-Amores, Craster, Shin, Chergui, Juric and Matar2020) and Constante-Amores et al. (Reference Constante-Amores, Kahouadji, Batchvarov, Seungwon, Chergui, Juric and Matar2020a), who showed that the interfacial dynamics are weakly dependent on
  $Pe_s$ beyond this value.
2.2. Vorticity and circulation
This subsection aims to present a general description of vorticity generation in a 3-D framework. We present a theoretical formulation that builds upon the inviscid theory presented by Morton (Reference Morton1984) for near-interface vorticity generation in three dimensions. For inviscid fluids, the rate of generation of vorticity is a result of the relative tangential acceleration of fluid on each side of the interface, which is caused by tangential pressure gradients or body forces. The present theoretical formulation is expressed as a conservation law for circulation in a control volume that includes a general surface. The total circulation is expressed as the vorticity from the fluids from both sides of the interface as well as circulation contained in the interface.
It is well known that curvature induces the generation of vorticity as the normal viscous stress at an interface is balanced by the capillary pressure. However, the presence of surfactant leads to a reduction in surface tension, which influences this mechanism. Furthermore, surfactant interfacial concentration variations induce surface tension gradients, and, as we will show, lead to a new route for vorticity generation near the interface. Once we have presented our theoretical expressions for a general 3-D surface, we will simplify them for the limiting case in which the jumps in the tangential and normal components of the velocity across the interface vanish; this is the case for identical material properties such as density and viscosity. This assumption will help to shed some light on the crucial role of the Marangoni-induced vorticity generation mentioned above. Future studies should extend our work to situations featuring density and viscosity contrasts.
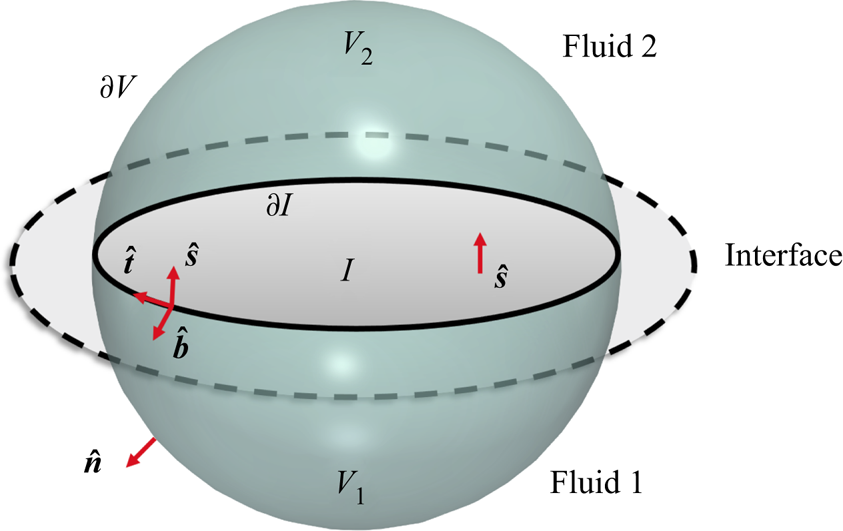
In order to examine the effect of the surfactant on the vorticity near the interface, we consider a fixed 3-D control volume  $V$ bounded by a closed surface of area
  $\partial V$ with an outward-pointing unit normal
  $\hat {\boldsymbol {n}}$ (see figure 2). This volume encloses regions of the incompressible fluids 1 and 2, of volumes
  $V_1$ and
  $V_2$, separated by an interfacial surface
  $I$ whose intersection with
  $V$ defines the curve
  $\partial I$. The vector
  $\hat {\boldsymbol {s}}$ is the outward-pointing unit normal to the surface
  $I$, while
  $\hat {\boldsymbol {t}}$ and
  $\hat {\boldsymbol {b}}$ are two orthogonal unit tangent vectors to the interface. We proceed below using dimensional variables and then apply the scalings in (2.1a–f) to render the final equations dimensionless.
Schematic showing a volume  $V$ with a surface
  $\partial V$ that encloses two fluids separated by an interface surface
  $I$. Here, the two smaller control volumes
  $V_1$ and
  $V_2$ refer to the control volume of each fluid. Local unit vectors to the interface are
  $\hat {\boldsymbol {b}}$,
  $\hat {\boldsymbol {s}}$ and
  $\hat {\boldsymbol {t}}$;
  $\hat {\boldsymbol {n}}$ corresponds to the unit normal vector to the control volume
  $\partial V$;
  $\hat {\boldsymbol {b}}$ is a vector tangent to
  $I$, but orthogonal to
  $\partial I$; and
  $\hat {\boldsymbol {t}}$ is the unit tangent vector to the boundary curve
  $\partial I$.
For fluid  $i$, it is possible to write down expressions for
  $\omega _{b,i}$ and
  $\omega _{t,i}$, which represent the components of the vorticity
  $\boldsymbol {\omega }_i$ in the
  $\hat {\boldsymbol {b}}$ and
  $\hat {\boldsymbol {t}}$ directions, respectively:
 $$\begin{gather} \omega_{b,i}=(\hat{\boldsymbol{s}}\times\hat{\boldsymbol{t}})\boldsymbol{\cdot}(\boldsymbol{\nabla}\times\boldsymbol{u}_i), \end{gather}$$
 $$\begin{gather}\omega_{t,i}=(\hat{\boldsymbol{s}}\times\hat{\boldsymbol{b}})\boldsymbol{\cdot}(\boldsymbol{\nabla}\times\boldsymbol{u}_i), \end{gather}$$
where  $\boldsymbol {u}_i$ denotes the velocity fields. These expressions may be recast as
 $$\begin{gather} \omega_{b,i}= \hat{\boldsymbol{s}}\boldsymbol{\cdot}\boldsymbol{\nabla} \boldsymbol{u}_i\boldsymbol{\cdot} \hat{\boldsymbol{t}} -\hat{\boldsymbol{t}}\boldsymbol{\cdot}\boldsymbol{\nabla}\boldsymbol{u}_i\boldsymbol{\cdot}\hat{\boldsymbol{s}}, \end{gather}$$
 $$\begin{gather}\omega_{t,i}=\hat{\boldsymbol{s}}\boldsymbol{\cdot}\boldsymbol{\nabla} \boldsymbol{u}_i\boldsymbol{\cdot} \hat{\boldsymbol{b}} -\hat{\boldsymbol{b}}\boldsymbol{\cdot}\boldsymbol{\nabla}\boldsymbol{u}_i\boldsymbol{\cdot}\hat{\boldsymbol{s}} \end{gather}$$
(using  $(\boldsymbol {a}\times \boldsymbol {b})\boldsymbol {\cdot }(\boldsymbol {c}\times \boldsymbol {d})=(\boldsymbol {a}\boldsymbol {\cdot }\boldsymbol {c})(\boldsymbol {b}\boldsymbol {\cdot }\boldsymbol {d})-(\boldsymbol {a}\boldsymbol {\cdot }\boldsymbol {d})(\boldsymbol {b}\boldsymbol {\cdot }\boldsymbol {c})$, valid for any vector
  $\boldsymbol {a}$,
  $\boldsymbol {b}$,
  $\boldsymbol {c}$ and
  $\boldsymbol {d}$).
In the presence of interfacial stresses arising from gradients of surface tension  $\sigma$ due to surfactant concentration gradients, the interfacial shear stress conditions are given by
 $$\begin{gather} \left[\left[\hat{\boldsymbol{t}}\boldsymbol{\cdot}\boldsymbol{\mathsf{T}}\boldsymbol{\cdot}\hat{\boldsymbol{s}}\right]\right]={-}\hat{\boldsymbol{t}}\boldsymbol{\cdot}\boldsymbol{\nabla}\sigma, \end{gather}$$
 $$\begin{gather}\big[\big[\hat{\boldsymbol{b}}\boldsymbol{\cdot}\boldsymbol{\mathsf{T}}\boldsymbol{\cdot}\hat{\boldsymbol{s}}\big]\big]={-}\hat{\boldsymbol{b}}\boldsymbol{\cdot}\boldsymbol{\nabla}\sigma, \end{gather}$$
where  $[[q]]=q_2-q_1$ represents the jump across the interface of a quantity
  $q$,
$q$,  $\boldsymbol{\mathsf{T}}_i=-p_i+\mu _i \boldsymbol{\mathsf{D}}_i$ is the total stress in fluid
  $i$ in which
  $p_i$ is the pressure,
  $\boldsymbol {D}_i=(\boldsymbol {\nabla }\boldsymbol {u}_i+\boldsymbol {\nabla } \boldsymbol {u}_i^{\rm T})/2$ is the rate of deformation tensor, and
  $\mu _i$ denote the viscosities, whence
 $$\begin{gather} \big[\big[\mu\big(\hat{\boldsymbol{t}}\boldsymbol{\cdot} \boldsymbol{\nabla}\boldsymbol{u}\boldsymbol{\cdot}\hat{\boldsymbol{s}}+\hat{\boldsymbol{s}}\boldsymbol{\cdot} \boldsymbol{\nabla}\boldsymbol{u}\boldsymbol{\cdot}\hat{\boldsymbol{t}}\big)\big]\big]={-}2\hat{\boldsymbol{t}}\boldsymbol{\cdot}\boldsymbol{\nabla}\sigma, \end{gather}$$
 $$\begin{gather}\big[\big[\mu\big(\hat{\boldsymbol{b}}\boldsymbol{\cdot} \boldsymbol{\nabla}\boldsymbol{u}\boldsymbol{\cdot}\hat{\boldsymbol{s}}+\hat{\boldsymbol{s}}\boldsymbol{\cdot} \boldsymbol{\nabla}\boldsymbol{u}\boldsymbol{\cdot}\hat{\boldsymbol{b}}\big)\big]\big]={-}2\hat{\boldsymbol{b}}\boldsymbol{\cdot}\boldsymbol{\nabla}\sigma. \end{gather}$$
Substitution of these results into (2.11) and (2.12) yields
 $$\begin{gather} \big[\big[\mu\big(\omega_b+2\hat{\boldsymbol{t}}\boldsymbol{\cdot}\boldsymbol{\nabla}\boldsymbol{u}\boldsymbol{\cdot}\hat{\boldsymbol{s}}\big)\big]\big]={-}2\hat{\boldsymbol{t}}\boldsymbol{\cdot}\boldsymbol{\nabla}\sigma, \end{gather}$$
 $$\begin{gather}\big[\big[\mu\big(\omega_t+2\hat{\boldsymbol{b}}\boldsymbol{\cdot}\boldsymbol{\nabla}\boldsymbol{u}\boldsymbol{\cdot}\hat{\boldsymbol{s}}\big)\big]\big]={-}2\hat{\boldsymbol{b}}\boldsymbol{\cdot}\boldsymbol{\nabla}\sigma. \end{gather}$$
 For the case  $[[\mu ]]=0$, which is the focus of this paper, we obtain
 $$\begin{gather} \left[\left[w_b\right]\right]={-}\frac{2}{\mu}\,\boldsymbol{\nabla}\sigma\boldsymbol{\cdot}\hat{\boldsymbol{t}} - 2 \left[\left[\hat{\boldsymbol{t}}\boldsymbol{\cdot} \boldsymbol{\nabla} \boldsymbol{u}\boldsymbol{\cdot}\hat{\boldsymbol{s}}\right]\right], \end{gather}$$
 $$\begin{gather}\left[\left[w_t\right]\right]={-}\frac{2}{\mu}\,\boldsymbol{\nabla}\sigma\boldsymbol{\cdot}\hat{\boldsymbol{b}} - 2 \big[\big[\hat{\boldsymbol{b}}\boldsymbol{\cdot} \boldsymbol{\nabla} \boldsymbol{u}\boldsymbol{\cdot}\hat{\boldsymbol{s}}\big]\big], \end{gather}$$
where  $\mu _2=\mu _1=\mu$. Noting that
  $\hat {\boldsymbol {t}}\boldsymbol {\cdot } \boldsymbol {\nabla } = \partial /\partial s$ and
  $\hat {\boldsymbol {b}}\boldsymbol {\cdot }\boldsymbol {\nabla } = \partial /\partial b$, it can be shown that
 $$\begin{gather} \left[\left[\omega_b\right]\right]={-}\frac{2}{\mu}\,\frac{\partial\sigma}{\partial s}-2\left[\frac{\partial}{\partial s}\left[\left[\boldsymbol{u}\boldsymbol{\cdot}\hat{\boldsymbol{s}}\right]\right]-\kappa_1\left[\left[\boldsymbol{u}\boldsymbol{\cdot}\hat{\boldsymbol{t}}\right]\right]\right], \end{gather}$$
 $$\begin{gather}\left[\left[\omega_t\right]\right]={-}\frac{2}{\mu}\,\frac{\partial\sigma}{\partial b}-2\left[\frac{\partial}{\partial b}\left[\left[\boldsymbol{u}\boldsymbol{\cdot}\hat{\boldsymbol{s}}\right]\right]-\kappa_2\big[\big[\boldsymbol{u}\boldsymbol{\cdot}\hat{\boldsymbol{b}}\big]\big]\right], \end{gather}$$
where the curvatures  $\kappa _1$ and
  $\kappa _2$ are defined as
 \begin{equation} \kappa_1=\hat{\boldsymbol{t}}\boldsymbol{\cdot}\frac{\partial\hat{\boldsymbol{s}}}{\partial s}, \quad \kappa_2=\hat{\boldsymbol{b}}\boldsymbol{\cdot}\frac{\partial\hat{\boldsymbol{s}}}{\partial b}. \end{equation}
From continuity of the normal and tangential components of the velocity at the interface, i.e.  $[[\boldsymbol {u}\boldsymbol {\cdot }\hat {\boldsymbol {s}}]]=0$ and
  $[[\boldsymbol {u}\boldsymbol {\cdot }\hat {\boldsymbol {t}}]]=[[\boldsymbol {u}\boldsymbol {\cdot }\hat {\boldsymbol {b}}]]=0$, respectively, it is seen that the interfacial jumps in the vorticity components are directly related to the Marangoni stresses:
 $$\begin{gather} \left[\left[\omega_b\right]\right]={-}\frac{2}{\mu}\,\frac{\partial\sigma}{\partial s}, \end{gather}$$
 $$\begin{gather}\left[\left[\omega_t\right]\right]={-}\frac{2}{\mu}\,\frac{\partial\sigma}{\partial b}. \end{gather}$$
 We now consider the circulation vector  $\boldsymbol {\varOmega }$ for 3-D flows given by
 \begin{equation} \boldsymbol{\varOmega}=\int_V \boldsymbol{\omega}\,{\rm d}V, \end{equation}
for the fixed 3-D control volume  $V$ shown in figure 2. The 3-D vorticity equation is given by
 \begin{equation} \frac{\partial\boldsymbol{\omega}}{\partial t}+\boldsymbol{\nabla}\boldsymbol{\cdot} (\boldsymbol{u}\boldsymbol{\omega})=\boldsymbol{\nabla} \boldsymbol{\cdot} (\boldsymbol{\omega}\boldsymbol{u})+\nu\,\nabla^2\boldsymbol{\omega}, \end{equation}
and the total rate of change of  $\boldsymbol {\varOmega }$ is then expressed by
 $$\begin{gather} \frac{{\rm D}\boldsymbol{\varOmega}}{{\rm D}t}=\int_V \frac{{\rm D}\boldsymbol{\omega}}{{\rm D}t}\,{\rm d}V=\frac{{\rm D}}{{\rm D}t}\int_V\boldsymbol{\omega}\,{\rm d}V=\int_V \boldsymbol{\nabla} \boldsymbol{\cdot} \left( \boldsymbol{\omega}\boldsymbol{u}+\nu\,\boldsymbol{\nabla}\boldsymbol{\omega}\right)\,{\rm d}V\nonumber\\ =\int_{\partial V} \hat{\boldsymbol{n}} \boldsymbol{\cdot} (\boldsymbol{\omega}\boldsymbol{u})\,{\rm d}S+\int_{\partial V}\hat{\boldsymbol{n}}\boldsymbol{\cdot} (\nu\,\boldsymbol{\nabla}\boldsymbol{\omega})\,{\rm d}S. \end{gather}$$
The first term on the right-hand side of (2.28) corresponds to vortex stretching/tilting and is present only in three dimensions. We now write
 $$\begin{gather} \frac{{\rm D}}{{\rm D}t}\int_{V_1\cup V_2} \boldsymbol{\omega}\,{\rm d}V=\oint_{\partial V_1}\hat{\boldsymbol{n}}\boldsymbol{\cdot} (\boldsymbol{\omega}\boldsymbol{u}+\nu\,\boldsymbol{\nabla}\boldsymbol{\omega})\,{\rm d}S+\oint_{\partial V_2}\hat{\boldsymbol{n}}\boldsymbol{\cdot} (\boldsymbol{\omega}\boldsymbol{u}+\nu\,\boldsymbol{\nabla}\boldsymbol{\omega})\,{\rm d}S\nonumber\\ +\oint_{\partial V_1'}\hat{\boldsymbol{n}}\boldsymbol{\cdot} (\boldsymbol{\omega}_1\boldsymbol{u}_1+\nu_1\,\boldsymbol{\nabla}\boldsymbol{\omega}_1)\,{\rm d}S+\oint_{\partial V_2'}\hat{\boldsymbol{n}}\boldsymbol{\cdot} (\boldsymbol{\omega}_2\boldsymbol{u}_2+\nu_2\,\boldsymbol{\nabla}\boldsymbol{\omega}_2)\,{\rm d}S, \end{gather}$$
and let  $V_1\cup V_2 \rightarrow V$,
  $\hat {\boldsymbol {n}}\rightarrow \hat {\boldsymbol {s}}$ from fluid 1,
  $\hat {\boldsymbol {n}}\rightarrow -\hat {\boldsymbol {s}}$ from fluid 2, and
  $(\partial V_1,\partial V_2) \rightarrow I$. It follows that
 \begin{align} \frac{{\rm D}}{{\rm D}t}\int_{V} \boldsymbol{\omega}\,{\rm d}V=\oint_{\partial V}\hat{\boldsymbol{n}}\boldsymbol{\cdot} (\boldsymbol{\omega}\boldsymbol{u}+\nu\,\boldsymbol{\nabla}\boldsymbol{\omega})\,{\rm d}S -\left[\oint_I\,[[\hat{\boldsymbol{s}}\boldsymbol{\cdot}(\boldsymbol{\omega}\boldsymbol{u})]]\,{\rm d}S+\oint_I\,[[\nu \hat{\boldsymbol{s}}\boldsymbol{\cdot} \boldsymbol{\nabla}\boldsymbol{\omega}]]\,{\rm d}S \right]. \end{align}
 It is important to establish a connection between  $\oint _I\,[[\nu \hat {\boldsymbol {s}}\boldsymbol {\cdot } \boldsymbol {\nabla }\boldsymbol {\omega }]]\,{\rm d}S$, which represents the jump across the plane of the interface of the vorticity flux, and the momentum conservation equation given by
 \begin{equation} \frac{{\rm D}\boldsymbol{u}}{{\rm D}t}={-}\frac{\boldsymbol{\nabla} p}{\rho}-\nu\, \boldsymbol{\nabla}\times \boldsymbol{\omega}. \end{equation}
In order to relate this term to the  $\nu \,\boldsymbol {\nabla }\times \boldsymbol {\omega }$ term in (2.31), we first write down the general result
 $$\begin{gather} -\oint_{\partial
V}\hat{\boldsymbol{s}}\boldsymbol{\cdot}\boldsymbol{\nabla}\boldsymbol{\omega}
\,{\rm d}S={-}\int_V\nabla^2\boldsymbol{\omega} \,{\rm
d}V={-}\int_V\bigl(\boldsymbol{\nabla}(\boldsymbol{\nabla}\boldsymbol{\cdot}\boldsymbol{\omega})-
\boldsymbol{\nabla}\times\boldsymbol{\nabla}\times\boldsymbol{\omega}\bigr)\,{\rm
d}V\nonumber\\ {}=\int_V \boldsymbol{\nabla}\times\boldsymbol{\nabla}\times\boldsymbol{\omega}
\,{\rm d}V={-}\oint_{\partial
V}(\boldsymbol{\nabla}\times\boldsymbol{\omega})\times\hat{\boldsymbol{s}}
\,{\rm d}S=\oint_{\partial V}\hat{\boldsymbol{s}}\times\boldsymbol{\nabla}\times\boldsymbol{\omega}
\,{\rm d}S. \end{gather}$$
$$\begin{gather} -\oint_{\partial
V}\hat{\boldsymbol{s}}\boldsymbol{\cdot}\boldsymbol{\nabla}\boldsymbol{\omega}
\,{\rm d}S={-}\int_V\nabla^2\boldsymbol{\omega} \,{\rm
d}V={-}\int_V\bigl(\boldsymbol{\nabla}(\boldsymbol{\nabla}\boldsymbol{\cdot}\boldsymbol{\omega})-
\boldsymbol{\nabla}\times\boldsymbol{\nabla}\times\boldsymbol{\omega}\bigr)\,{\rm
d}V\nonumber\\ {}=\int_V \boldsymbol{\nabla}\times\boldsymbol{\nabla}\times\boldsymbol{\omega}
\,{\rm d}V={-}\oint_{\partial
V}(\boldsymbol{\nabla}\times\boldsymbol{\omega})\times\hat{\boldsymbol{s}}
\,{\rm d}S=\oint_{\partial V}\hat{\boldsymbol{s}}\times\boldsymbol{\nabla}\times\boldsymbol{\omega}
\,{\rm d}S. \end{gather}$$
(We have used the vector identity  $\int _V\boldsymbol {\nabla }\times \boldsymbol {A}\,{\rm d}V=-\oint _{\partial V}\boldsymbol {A}\times {\rm d}\boldsymbol {S}=-\oint _{\partial V}\boldsymbol {A}\times \boldsymbol {n}\,{\rm d}S=\oint _{\partial V}$
  $\boldsymbol {n}\times \boldsymbol {A}\,{\rm d}S$, for any vector
  $\boldsymbol {A}$ and volume
  $V$ enclosed by a surface
  $\partial V$ with a unit normal
  $\boldsymbol {n}$.) Note that this relation links Lighthill's vorticity flux to Lyman's flux, the latter being another form of the former (see Terrington et al. (Reference Terrington, Hourigan and Thompson2021) and references therein).
Inspired by the form of Lyman's flux, the natural way to proceed is to take the cross-product of  $\hat {\boldsymbol {s}}=\hat {\boldsymbol {t}}\times \hat {\boldsymbol {b}}$ with the left-hand side of (2.31) and its pressure gradient term (where we have exploited the fact that
  $\hat {\boldsymbol {t}}\times \hat {\boldsymbol {b}}\times \boldsymbol {c}=\hat {\boldsymbol {b}}(\hat {\boldsymbol {t}}\boldsymbol {\cdot }\boldsymbol {c})-\boldsymbol {c}(\hat {\boldsymbol {t}}\boldsymbol {\cdot }\hat {\boldsymbol {b}})=\hat {\boldsymbol {b}}(\hat {\boldsymbol {t}}\boldsymbol {\cdot }\boldsymbol {c})$ since
  $\hat {\boldsymbol {t}}\boldsymbol {\cdot }\hat {\boldsymbol {b}}=0$) and a cross-product of
  $\hat {\boldsymbol {s}}$ with its
  $\nu \,\boldsymbol {\nabla }\times \boldsymbol {\omega }$ term to arrive at
 \begin{align} -\nu\hat{\boldsymbol{s}}\times\boldsymbol{\nabla}\times\boldsymbol{\omega}&=\hat{\boldsymbol{b}}\hat{\boldsymbol{t}}\boldsymbol{\cdot} \frac{{\rm D}\boldsymbol{u}}{{\rm D}t}-\hat{\boldsymbol{b}}\hat{\boldsymbol{t}}\boldsymbol{\cdot}\boldsymbol{\nabla}\left(\frac{p}{\rho}\right)\nonumber\\ &=\hat{\boldsymbol{b}}\left[\left(\frac{{\rm D}}{{\rm D}t}(\boldsymbol{u}\boldsymbol{\cdot}\hat{\boldsymbol{t}})-\boldsymbol{u}\boldsymbol{\cdot}\frac{{\rm D}\hat{\boldsymbol{t}}}{{\rm D}t}\right)+\hat{\boldsymbol{t}}\boldsymbol{\cdot}\boldsymbol{\nabla}\left(\frac{p}{\rho}\right)\right]\nonumber\\ &=\nu\hat{\boldsymbol{s}}\boldsymbol{\cdot}\boldsymbol{\nabla}\boldsymbol{\omega}; \end{align}
here, we note that the sources of vorticity are due to acceleration in the plane of the interface, which we can think of as a vortex sheet, and interfacial pressure gradients. Making use of this relation in (2.30), we arrive at
 $$\begin{gather} \frac{{\rm D}}{{\rm D}t}\left[\int_V\boldsymbol{\omega} \,{\rm d}V+\hat{\boldsymbol{b}}\oint_I\, [[\boldsymbol{u}\boldsymbol{\cdot}\hat{\boldsymbol{t}}]]\,{\rm d}S\right]=\oint_{\partial V}\hat{\boldsymbol{n}}\boldsymbol{\cdot}\left(\boldsymbol{\omega}\boldsymbol{u}+\nu\,\boldsymbol{\nabla}\boldsymbol{\omega}\right)\,{\rm d}S\nonumber\\ {}-\oint_I\,[[\hat{\boldsymbol{s}}\boldsymbol{\cdot}(\boldsymbol{\omega}\boldsymbol{u})]]\,{\rm d}S +\oint_I\,\hat{\boldsymbol{b}}\left[\left[\boldsymbol{u}\boldsymbol{\cdot}\frac{{\rm D}\hat{\boldsymbol{t}}}{{\rm D}t}\right]\right]{\rm d}S-\oint_I\hat{\boldsymbol{b}}\frac{\partial}{\partial s}\left[\left[\frac{p}{\rho}\right]\right]{\rm d}S, \end{gather}$$
where we have set  $\hat {\boldsymbol {t}}\boldsymbol {\cdot }\boldsymbol {\nabla }(p/\rho )=\partial (p/\rho )/\partial s$. An expression for
  $\boldsymbol {u}\boldsymbol {\cdot } ({\rm D}\hat {\boldsymbol {t}}/{\rm D}t)$ can be developed (the details are in Appendix B), given by
 \begin{align} \boldsymbol{u}\boldsymbol{\cdot}\frac{{\rm D}\hat{\boldsymbol{t}}}{{\rm D}t}=\frac{1}{2}\,\frac{\partial}{\partial s}\left[(\boldsymbol{u}\boldsymbol{\cdot}\hat{\boldsymbol{s}})^2+(\boldsymbol{u}\boldsymbol{\cdot}\hat{\boldsymbol{b}})^2\right] + \frac{1}{2}\,\frac{\partial}{\partial b}\left[(\boldsymbol{u}\boldsymbol{\cdot}\hat{\boldsymbol{s}})^2+(\boldsymbol{u}\boldsymbol{\cdot}\hat{\boldsymbol{b}})^2\right] -\kappa_1(\boldsymbol{u}\boldsymbol{\cdot}\hat{\boldsymbol{t}})(\boldsymbol{u}\boldsymbol{\cdot}\hat{\boldsymbol{s}}). \end{align}
Furthermore, for  $[[\rho ]]=0$, the remaining term required to close (2.34) is one for
  $[[p]]$ (the details are in Appendix C):
 \begin{equation} [[\,p]]={-}\sigma(\kappa_1+\kappa_2)-2\left[\left[\mu\left(\frac{\partial}{\partial s}\left[(\boldsymbol{u}\boldsymbol{\cdot}\hat{\boldsymbol{t}})+(\boldsymbol{u}\boldsymbol{\cdot}\hat{\boldsymbol{b}})\right]+(\kappa_1+\kappa_2)(\boldsymbol{u}\boldsymbol{\cdot}\hat{\boldsymbol{s}})\right)\right]\right]. \end{equation}
 To collapse these equations to their two-dimensional (2-D) equivalents, we first note that  $\hat {\boldsymbol {s}}\boldsymbol {\cdot }\boldsymbol {\omega }=\hat {\boldsymbol {n}}\boldsymbol {\cdot }\boldsymbol {\omega }=\boldsymbol {u}\boldsymbol {\cdot }\hat {\boldsymbol {b}}=0$ in two dimensions, and set
  $\partial /\partial b =0$; the latter leads to
  $\kappa _2=0$. We then take a dot product of (2.34) with
  $\hat {\boldsymbol {b}}$ (and convert the volume and area integrals to area and line integrals, respectively) to arrive at a 2-D analogue involving the vorticity scalar
  $\omega$. Moreover, in the case studied here, characterised by
  $[[\mu ]]=0$,
  $[[\boldsymbol {u}\boldsymbol {\cdot }\hat {\boldsymbol {s}}]]=0$,
  $[[\boldsymbol {u}\boldsymbol {\cdot }\hat {\boldsymbol {t}}]]=0$ and
  $[[\boldsymbol {u}\boldsymbol {\cdot }\hat {\boldsymbol {b}}]]=0$, (2.34) reduces to
 \begin{equation} \frac{{\rm D}}{{\rm D}t}\left[\int_V\boldsymbol{\omega} \,{\rm d}V\right]=\oint_{\partial V}\hat{\boldsymbol{n}}\boldsymbol{\cdot}\left(\boldsymbol{\omega}\boldsymbol{u}+\nu\,\boldsymbol{\nabla}\boldsymbol{\omega}\right)\,{\rm d}S-\oint_I\,[[\hat{\boldsymbol{s}}\boldsymbol{\cdot}(\boldsymbol{\omega}\boldsymbol{u})]]\,{\rm d}S+\frac{1}{\rho}\oint_I\,\hat{\boldsymbol{b}}\,\frac{\partial}{\partial s}(\sigma[\kappa_1+\kappa_2])\,{\rm d}S. \end{equation}
 We note that the term involving  $[[\hat {\boldsymbol {s}}\boldsymbol {\cdot }(\boldsymbol {\omega }\boldsymbol {u})]]$ on the right-hand-side of this equation is zero. To see this, we first note that
  $[[\hat {\boldsymbol {s}}\boldsymbol {\cdot }\boldsymbol {\omega } \boldsymbol {u}]]$ can be re-expressed as
 \begin{align} [[\hat{\boldsymbol{s}}\boldsymbol{\cdot}\boldsymbol{\omega} \boldsymbol{u}]]&=(\hat{\boldsymbol{s}}\boldsymbol{\cdot}\boldsymbol{\omega}_2)\boldsymbol{u}_2-(\hat{\boldsymbol{s}}\boldsymbol{\cdot}\boldsymbol{\omega}_1)\boldsymbol{u}_1\nonumber\\ &=(\hat{\boldsymbol{s}}\boldsymbol{\cdot}\boldsymbol{\omega}_2-\hat{\boldsymbol{s}}\boldsymbol{\cdot}\boldsymbol{\omega}_1)\boldsymbol{u}_1\nonumber\\ &=(\hat{\boldsymbol{s}}\boldsymbol{\cdot}\boldsymbol{\omega}_2-\hat{\boldsymbol{s}}\boldsymbol{\cdot}\boldsymbol{\omega}_1)\boldsymbol{u}_2\nonumber\\ &=[[\hat{\boldsymbol{s}}\boldsymbol{\cdot}\boldsymbol{\omega}]]\boldsymbol{u}_1=[[\hat{\boldsymbol{s}}\boldsymbol{\cdot}\boldsymbol{\omega}]]\boldsymbol{u}_2, \end{align}
since  $[[\boldsymbol {u}]]=0$. We also note that
  $\hat {\boldsymbol {s}} \boldsymbol {\cdot } \boldsymbol {\omega }=(\hat {\boldsymbol {b}} \times \hat {\boldsymbol {t}})\boldsymbol {\cdot } (\boldsymbol {\nabla }\times \boldsymbol {u})$, which can be rewritten as
 \begin{align} \hat{\boldsymbol{s}}\boldsymbol{\cdot}\boldsymbol{\omega}&=\hat{\boldsymbol{b}}\boldsymbol{\cdot}\boldsymbol{\nabla}\boldsymbol{u}\boldsymbol{\cdot}\hat{\boldsymbol{t}} - \hat{\boldsymbol{t}} \boldsymbol{\cdot} \boldsymbol{\nabla}\boldsymbol{u}\boldsymbol{\cdot}\hat{\boldsymbol{b}}\nonumber\\ &=\hat{\boldsymbol{b}}\boldsymbol{\cdot}\frac{\partial\boldsymbol{u}}{\partial s}-\hat{\boldsymbol{t}}\boldsymbol{\cdot}\frac{\partial \boldsymbol{u}}{\partial b}\nonumber\\ &=\frac{\partial}{\partial s}(\hat{\boldsymbol{b}}\boldsymbol{\cdot}\boldsymbol{u})-\frac{\partial}{\partial b}(\hat{\boldsymbol{t}}\boldsymbol{\cdot}\boldsymbol{u}), \end{align}
since  $\hat {\boldsymbol {b}}\neq \hat {\boldsymbol {b}}(s)$ and
  $\hat {\boldsymbol {t}}\neq \hat {\boldsymbol {t}}(b)$. Thus we can write
 \begin{align} [[\hat{\boldsymbol{s}}\boldsymbol{\cdot}\boldsymbol{\omega}]]&=\left[\left[\frac{\partial}{\partial s}(\hat{\boldsymbol{b}}\boldsymbol{\cdot}\boldsymbol{u})\right]\right]-\left[\left[\frac{\partial}{\partial b}(\hat{\boldsymbol{t}}\boldsymbol{\cdot}\boldsymbol{u})\right]\right]\nonumber\\ &=\frac{\partial}{\partial s}[[\hat{\boldsymbol{b}}\boldsymbol{\cdot} \boldsymbol{u}]]-\frac{\partial}{\partial b}[[\hat{\boldsymbol{t}}\boldsymbol{\cdot}\boldsymbol{u}]]=0, \end{align}
since  $[[\hat {\boldsymbol {b}} \boldsymbol {\cdot }\boldsymbol {u}]]=0$ and
  $[[\hat {\boldsymbol {t}}\boldsymbol {\cdot }\boldsymbol {u}]]=0$, whence
  $[[\hat {\boldsymbol {s}}\boldsymbol {\cdot }\boldsymbol {\omega }\boldsymbol {u}]]=0$. Inspection of the terms remaining in (2.37) suggests that circulation is influenced by vorticity diffusion, vortex tilting/stretching, and gradients of curvature and interfacial tension.
The dimensionless versions of (2.25) and (2.24) are then expressed by
 $$\begin{gather} \left[\left[\tilde{\omega}_t\right]\right]=-2\,{\textit{Re}}\,{\textit{Ma}}\,\frac{1}{1-\tilde{\varGamma}}\,\frac{\partial\tilde{\varGamma}}{\partial b}, \end{gather}$$
 $$\begin{gather}\left[\left[\tilde{\omega}_b\right]\right]=-2\,{\textit{Re}}\,{\textit{Ma}}\,\frac{1}{1-\tilde{\varGamma}}\,\frac{\partial\tilde{\varGamma}}{\partial s}, \end{gather}$$
and the dimensionless equation (2.37) reads
 \begin{equation} \frac{{\rm D}}{{\rm D}\tilde{t}}\left[\int_{\tilde{V}}\tilde{\boldsymbol{\omega}} \,{\rm d}\tilde{V}\right]=\oint_{\partial \tilde{V}}\hat{\boldsymbol{n}}\boldsymbol{\cdot}\left(\tilde{\boldsymbol{\omega}}\tilde{\boldsymbol{u}}+\frac{1}{{\textit{Re}}}\,\boldsymbol{\nabla}\tilde{\boldsymbol{\omega}}\right)\,{\rm d}\tilde{S} +\frac{1}{{\textit{We}}}\oint_I\,\hat{\boldsymbol{b}}\,\frac{\partial}{\partial \tilde{s}}(\tilde{\sigma}[\tilde{\kappa}_1+\tilde{\kappa}_2])\,{\rm d}\tilde{S}, \end{equation}
and the tildes are dropped henceforth.
Note that in the case of non-isothermal systems,  $\tilde {\sigma }$ has a linear dependence on the local temperature
  $\mathcal {T}$, and a linear equation of state describes
  $\tilde {\sigma }(\tilde { \mathcal {T}})$ (see, for example, Williams et al. Reference Williams, Karapetsas, Mamalis, Sefiane, Matar and Valluri2021). It is possible to relate the present, surfactant-laden case to that involving thermal gradients by linearising our equation of state,
  $\sigma =1+\beta _s\ln (1-\varGamma )$, for
  $\varGamma \ll 1$ such that it reads
  $\sigma =1 -\beta _s \varGamma$. Although this analogy is useful, it is, however, incomplete since the non-isothermal case does not involve a surface species whose concentration evolves spatio-temporally for which a transport equation must be solved.
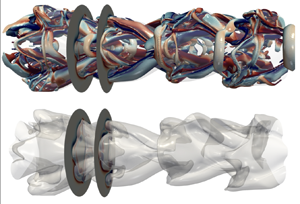
3. Results
Figure 3 shows a flow regime map for  $ {\textit {Re}}=5000$ that depicts the interfacial morphology associated with various regions of the
  $\beta _s\unicode{x2013} {\textit {We}}$ parameter space generated by over 100 transient simulations performed in the ranges
  $100< {\textit {We}}<1000$ and
 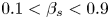 $0.1<\beta _s<0.9$. We have divided the map into two distinct regions depending on the morphology: for small
  $ {\textit {We}}$, capillary forces control the interfacial dynamics preventing the development of lobes that could result in the formation of large droplets; for large
  $ {\textit {We}}$, inertial forces dominate the dynamics, triggering the formation of interfacial lobes whose thinning eventually results in the generation of holes and eventually droplets. The resulting non-uniform surfactant distribution generates gradients in surface tension affecting the local dynamics. Surfactant accumulation takes places in high-curvature regions, giving rise to Marangoni stresses that drive surfactant redistribution from high- to low-concentration regions. Marangoni stresses, therefore, oppose the shear stresses produced by the flow field, the former exerting a restoring effect and the latter a perturbing effect in the local surfactant concentration field. The dimensionless Marangoni velocities induced by surface tension differences
  $\Delta \sigma$ are of
  $O( {\textit {Re}}\, {\textit {We}}^{-1} (\Delta \sigma /\sigma _s))$. Similarly, the dimensionless Marangoni stresses
  $\tau$ are of
  $O( {\textit {We}}^{-1}\,\tilde {\boldsymbol {\nabla }}\tilde {\sigma })$, or, equivalently,
  $O(\beta _s\, {\textit {We}}^{-1}\,\tilde {\boldsymbol {\nabla }}\tilde {\varGamma })$, namely (2.8), while capillary forces and shear stresses are of
  $O( {\textit {We}}^{-1})$ and
  $O( {\textit {Re}}^{-1})$, respectively. Furthermore, from (2.41) and (2.42), it is clear that the Marangoni-induced vorticity jumps across the interface are of
  $O( {\textit {Re}}\,\beta _s\, {\textit {We}}^{-1})$. Inspection of figure 3, which was generated for a fixed
  $ {\textit {Re}}$ value, reveals that the presence of Marangoni stresses counteracts the transition from the low- to high-
 $ {\textit {We}}$ regimes as the critical
  $ {\textit {We}}$ value increases with
  $\beta _s$ with a quasi-linear dependence. The latter is consistent with the scaling highlighted above,
  $\tau \sim \beta _s\, {\textit {We}}^{-1}$, which demonstrates that increasing
  $\beta _s$ and decreasing
  $ {\textit {We}}$ serves to enhance the restoring influence of the Marangoni stresses. The boundary demarcated in figure 3 was generated by examining the temporal evolution of the interfacial area normalised by its initial value over a range of
  $ {\textit {We}}$ values and with
  $\beta _s$ varying parametrically and
  $ {\textit {Re}}=5000$; this shows that the normalised area is maximised for an intermediate value of
  $ {\textit {We}}$, for fixed
  $\beta _s$ (and
  $ {\textit {Re}}$), which heralds the transition towards an inertia-dominated regime.
Regime map of the interfacial morphology in the  $\beta _s\unicode{x2013} {\textit {We}}$ space for
  $ {\textit {Re}}=5000$,
  $Pe_s=100$ and
  $\varGamma _o=\varGamma _\infty /2$. The capillary-dominated and inertia-dominated regimes, and their boundaries, are clearly demarcated; the symbols represent simulations carried out at the transition lines separating these regimes. Three-dimensional representations of the interface for both regimes are also shown.
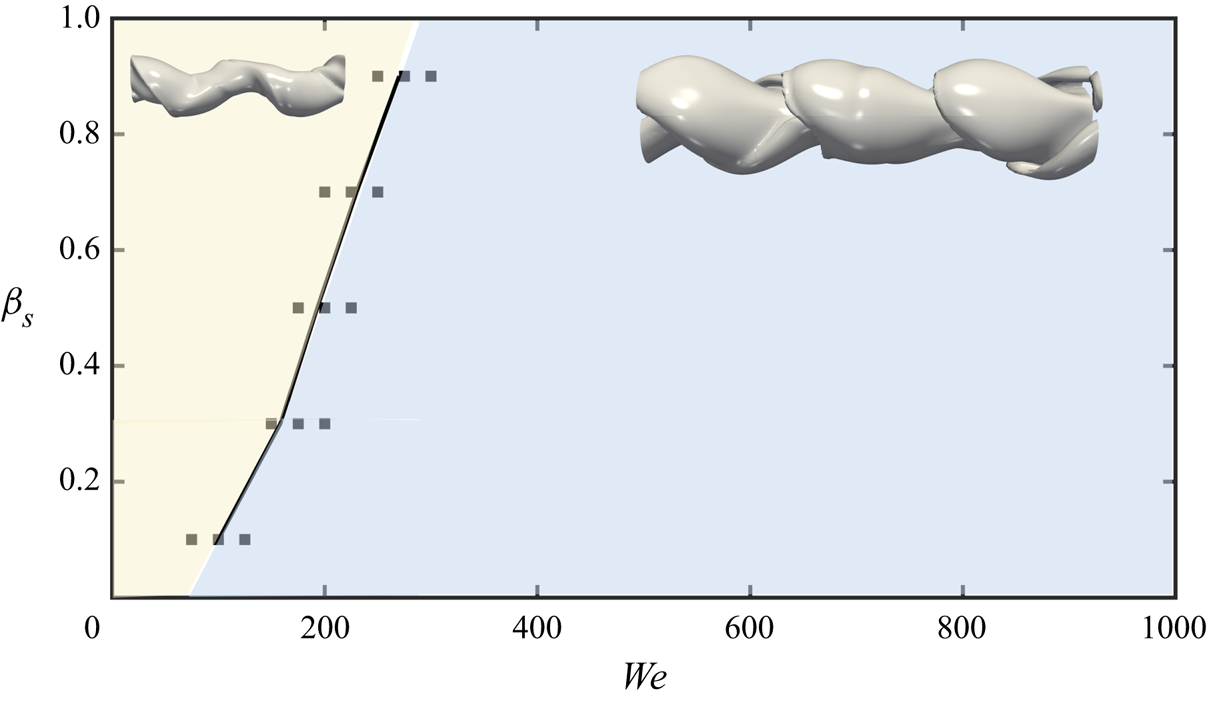
To assess the effect of Marangoni-induced flow, we have analysed the flow physics of the surfactant-free and surfactant-laden flows characterised by  $ {\textit {Re}}=5000$ and
  $ {\textit {We}}=500$. We start with the surfactant-free case depicted in figure 4, which shows the spatio-temporal interfacial dynamics for the surfactant-free case through the
  $Q$-criterion (e.g. a measure of the dominance of vorticity
  $\boldsymbol {\omega }$ over strain
  $\boldsymbol {s}$, i.e.
  $Q = (\|\boldsymbol {\omega }\|^2 -\|{\boldsymbol s}\|^2)/{2}$ (Hunt, Wray & Moin Reference Hunt, Wray and Moin1988). At early times, we observe the formation of a periodic array of quasi-symmetric Kelvin–Helmholtz (KH) driven vortex rings as a result of the difference in velocity in the shear layer located under the interface (see figure 4a). With increasing time, the 3-D instability starts with the deformation of the vortex rings, leading to a mutual induction between two consecutive vortex rings, resulting in their ‘knitting’ (see figure 4b); similar vortex pairing has been reported by Broze & Hussain (Reference Broze and Hussain1996) and da Silva & Métais (Reference da Silva and Métais2002). With increasing time, we observe the formation of inner and outer hairpin vortices whose pairing brings about a region where both overlap. The cascade mechanism resulting in the formation of hairpin vortices from KH rings is triggered by the magnitude of the streamwise vorticity
  $\omega _x$, which becomes comparable to its azimuthal counterpart
  $\omega _y$, in agreement with Jarrahbashi et al. (Reference Jarrahbashi, Sirignano, Popov and Hussain2016) and Constante-Amores et al. (Reference Constante-Amores, Kahouadji, Batchvarov, Shin, Chergui, Juric and Matar2021b), as shown in figure 4(b).
Spatio-temporal representations of the interfacial dynamics and the coherent vortical structures for  $ {\textit {Re}}=5000$ and
  $ {\textit {We}}=500$ at (a)
  $t=23.28$, (b)
  $t=28.12$, (c)
  $t=31.25$, and (d)
  $t=31.50$. (c (i), d (i)) The 3-D coherent structures with the location of the interface. (c (ii), d (ii)) The interface location. (c (iii), d (iii)) Two transversal cuts of the interface coloured by the magnitude of
  $\omega _x$ (the white lines represent the interface location). The 3-D coherent structures are visualised by the
  $Q$-criterion with values
  $Q =3, 220, 320, 320$, where the colour represents the streamwise vorticity field
  $\omega _x$. We also show
  $\omega _x$ in the
  $y$–
$y$– $z$ plane for each sampling location. Here, ‘HV’ stands for hairpin vortex.
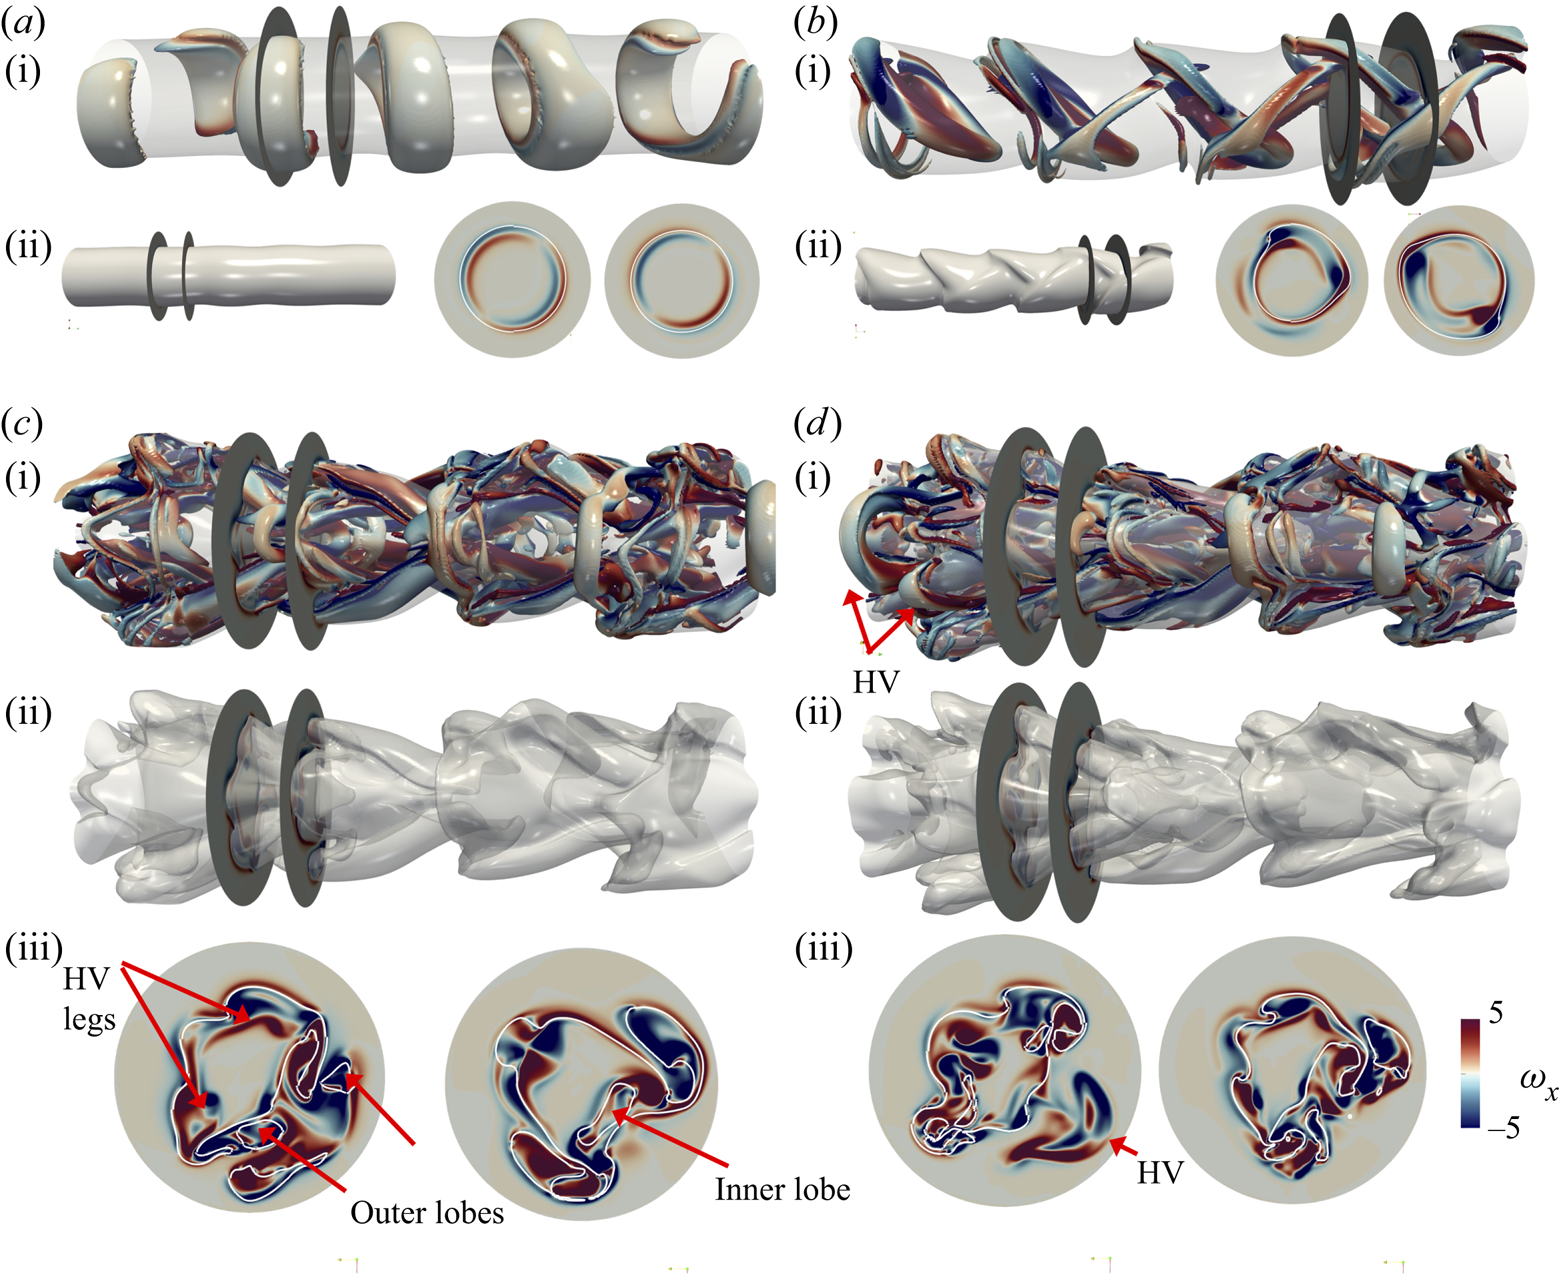
To provide more conclusive evidence of the existence of inner/outer hairpin vortices in the jet dynamics, a careful study of the distribution of vortex signs shows the assembling into counter-rotating vortex pairs (see  $\omega _x$ in the
  $y$–
$y$– $z$ plane for each sampled location in figure 4). By analysing the distribution of streamwise vorticity between the ring and braid regions of the jet core (see figure 4a), we observe that their distribution is
  ${\rm \pi}$-out-of-phase. The arrangement of the vorticity comes from vortex induction arguments, similar to those explained by Jarrahbashi et al. (Reference Jarrahbashi, Sirignano, Popov and Hussain2016), Zandian et al. (Reference Zandian, Sirignano and Hussain2018) and Constante-Amores et al. (Reference Constante-Amores, Kahouadji, Batchvarov, Shin, Chergui, Juric and Matar2021b), i.e. the upstream hairpin vortex from the ring overtakes the upstream hairpin vortex from the braid as the mutual induction takes place. Finally, the vortex–surface interaction triggers the formation of the interfacial structure as the interface adopts the shape of the vortex that is in its vicinity (see figures 4b–d)). The mutual induction between outer and inner hairpin vortices eventually leads to the thinning of the lobes to ultimately form inertia-induced holes whose capillary-driven expansion gives rise to the formation of droplets (Jarrahbashi et al. Reference Jarrahbashi, Sirignano, Popov and Hussain2016; Zandian et al. Reference Zandian, Sirignano and Hussain2018; Constante-Amores et al. Reference Constante-Amores, Kahouadji, Batchvarov, Shin, Chergui, Juric and Matar2021b).
Next, we turn our attention to the effect of surfactants on the flow dynamics. Figure 5 shows the early interfacial surfactant concentration together with the 3-D coherent vortical structures via the  $Q$-criterion. Similarly to the surfactant-free case, we observe the formation of a periodic array of quasi-axisymmetric KH vortex rings. These rings induce the formation of interfacial waves that are characterised by regions of radially converging and diverging motion that lead to higher and lower interfacial areas, and subsequently to lower and higher surfactant concentration regions, respectively; accumulation of
  $\varGamma$ is observed in the vicinity of the KH rings (see figure 5a). Figure 5(c) presents the interfacial concentration
  $\varGamma$ and Marangoni stresses
  $\tau$ along an arc length
  $s$, corresponding to
  $t=32.03$. We observe that the non-uniform distribution of
  $\varGamma$ gives rise to Marangoni-induced flow, which drives fluid motion from ring 1, ‘VR1’ (
 $\tau >0$), to ring 2, ‘VR2’, and vice versa (i.e. flow from VR2 to VR1,
  $\tau <0$). This flow is therefore accompanied by the retardation of the development of the interfacial waves and a subsequent delay of the onset of the 3-D instability of the jet observed in the surfactant-free case in figure 4.
Effect of surfactants on the early interfacial dynamics for  $ {\textit {Re}}=5000$,
  $ {\textit {We}}=500$,
  $\beta _s=0.5$,
  $Pe_s=100$ and
  $\varGamma _o=\varGamma _{\infty }/2$ at (a)
  $t=32.03$, and (b)
  $t=32.81$. (a (i), b (i)) Interface coloured by
  $\varGamma$, and (a (ii), b (ii)) coherent vortical structures visualised via the
  $Q$-criterion with
  $Q=10$. (c) A 2-D representation of
  $\varGamma$ and
  $\tau$ with respect to the arc length
  $s$ (see inset) at
  $t=32.03$. (d) A 2-D representation of the magnitude of vorticity
  $|\boldsymbol {\omega }|$ in the
  $x$–
$x$– $z$ plane (
 ${y} = 2.875$) at
  $t=32.81$. (e) Interface location and
  $\varGamma$, and ( f)
  $[[\omega _b]]$ and
  $[[\omega _t]]$, versus the arc length
  $s$ (e.g.
  $s$ corresponds to the
  $x$–
$x$– $z$ plane,
  $y = 2.875$, intersecting the interface). The centre of the jet core corresponds to
  $z = 2.5$. We denote a vortex ring by ‘VR’.
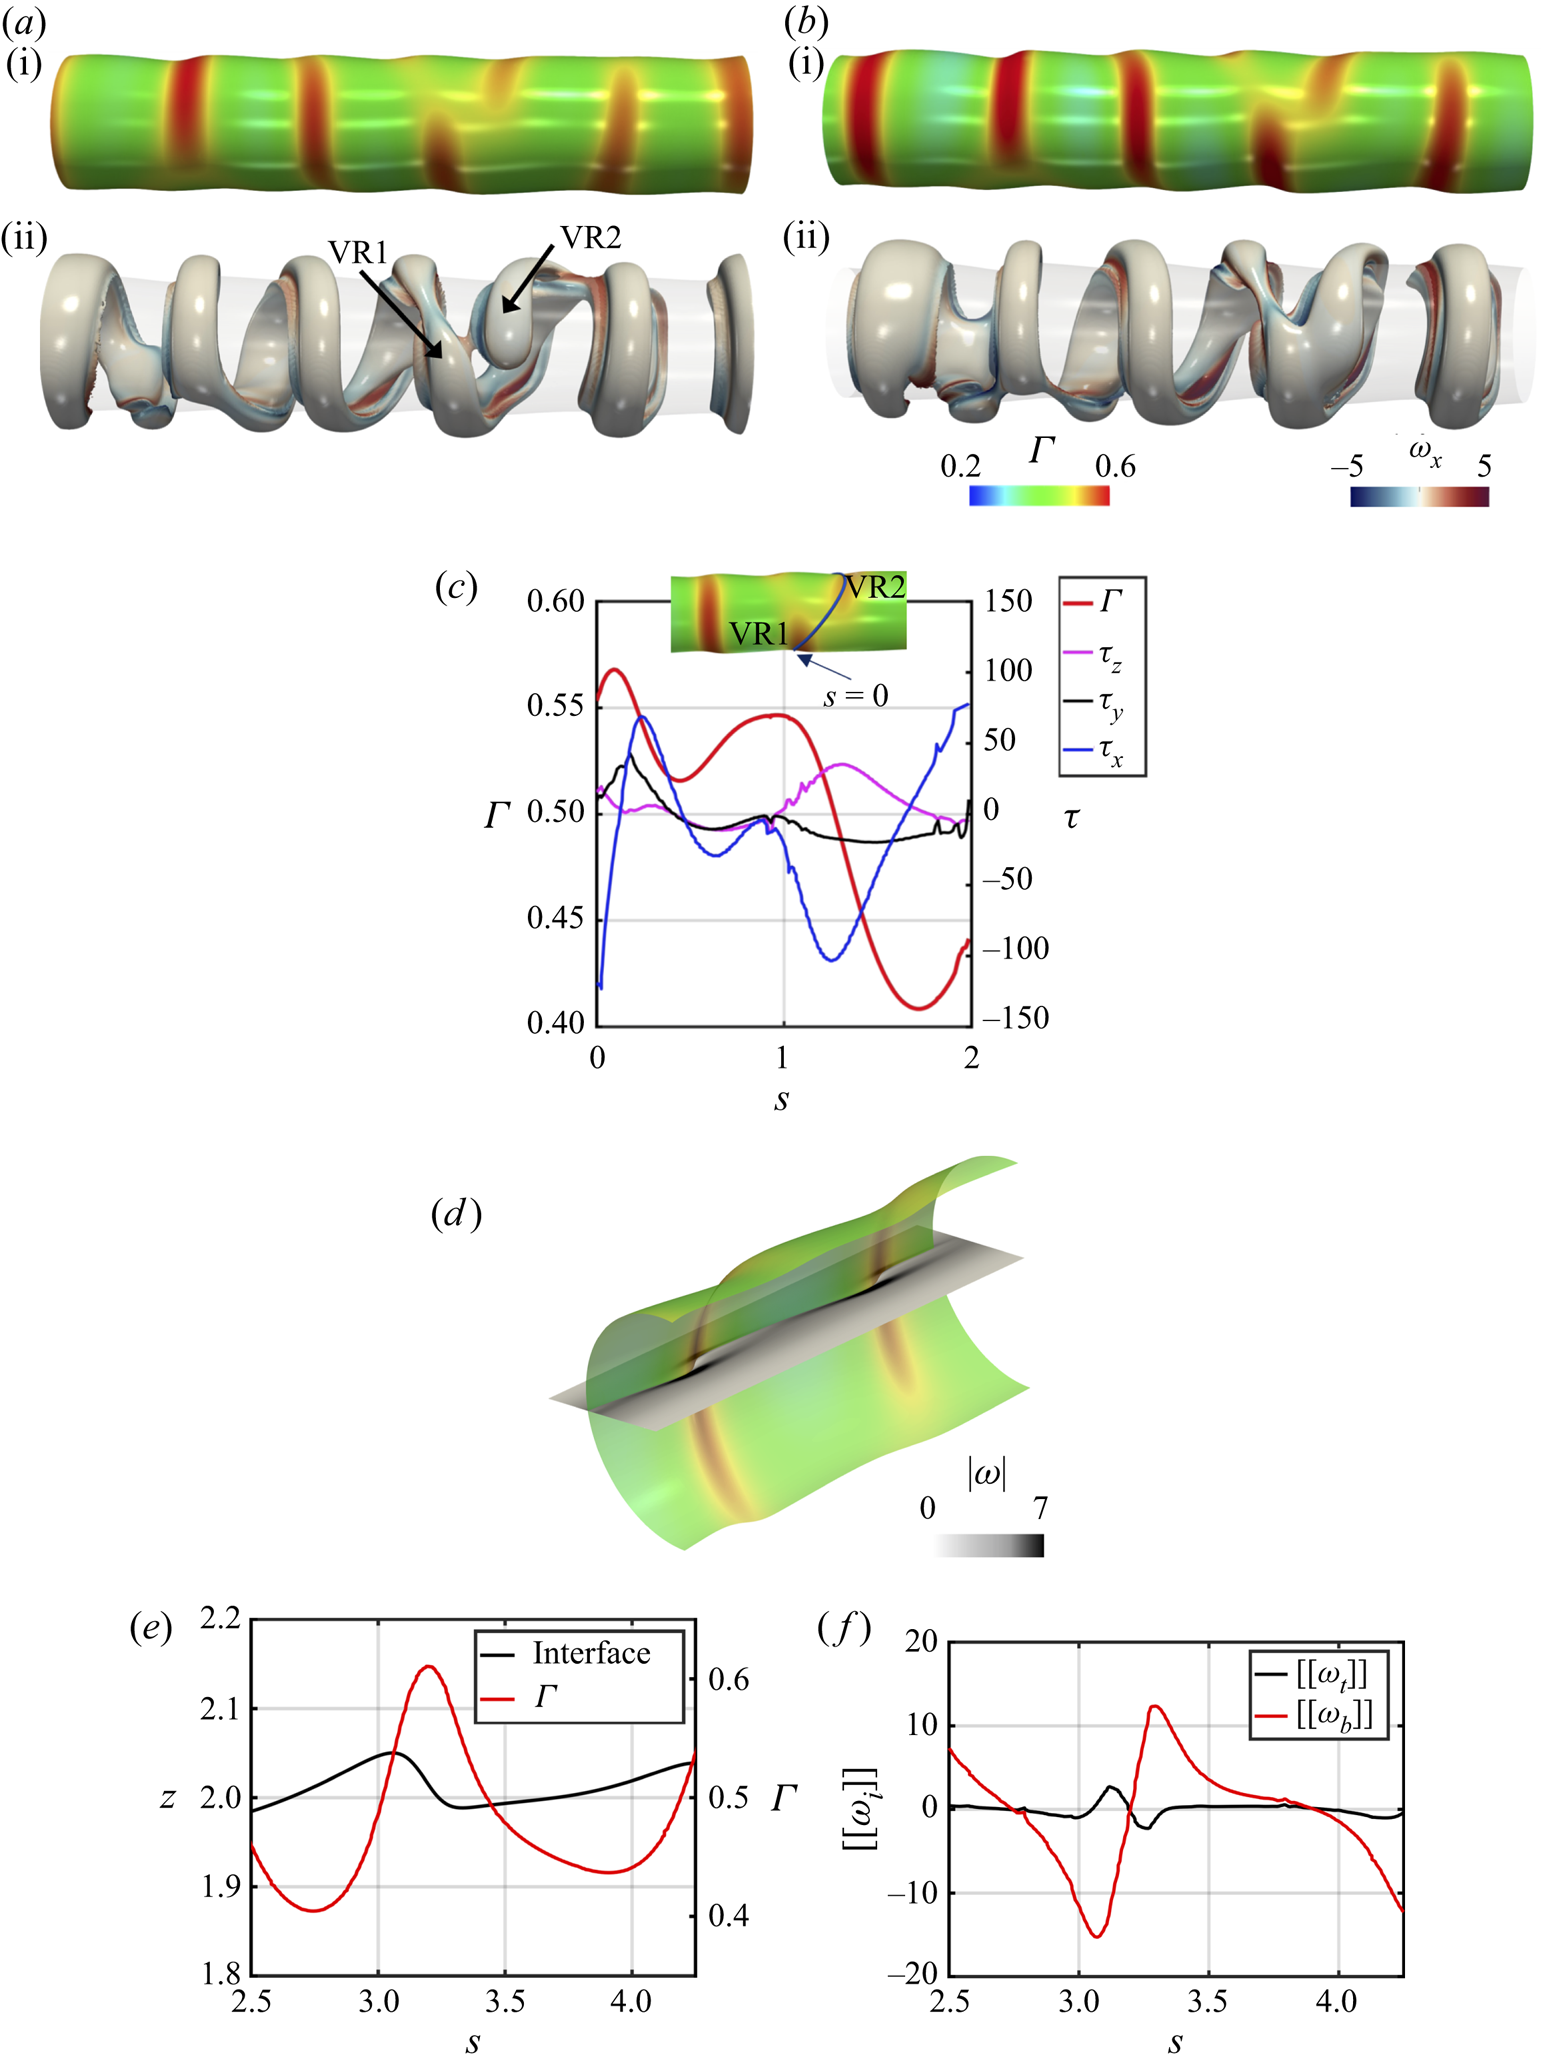
Additionally, these Marangoni stresses promote jumps in the vorticity across the interface that we can calculate using (2.24) and (2.25) in the location that coincides with the formation of vortices SV1 and SV2 from figure 6 at  $t=32.81$. Figure 5(d) shows a 3-D representation of the interface together with an
  $x$–
$x$– $z$ plane at
  $y = 2.875$ coloured by the magnitude of vorticity
  $|\boldsymbol {\omega }|$. Figures 5(e, f) show respectively the variation of the interface location and the
  $\varGamma$ profiles, and of the distribution of
  $[[\omega _b]]$ and
  $[[\omega _t]]$, along the arc length
  $s$ (not to be confused with
  $\hat {s}$, the unit vector in figure 2), in the plane cutting the interface shown in figure 5(d). From figure 5(e), it is seen that the surfactant accumulates in the down-sloping region immediately downstream of an interfacial wave peak; here, the gradients in
  $\varGamma$, and therefore in
  $\sigma$, are smallest, corresponding to the weakest vorticity jumps, while the largest such jumps are in the wave peak and trough regions where the
  $\varGamma$ (and
  $\sigma$) gradients are highest, as shown in figure 5( f). Inspection of figure 5( f) also shows that
  $[[\omega _b]] \gg [[\omega _t]]$, that is, near-interface vorticity production in the azimuthal direction is dominant. This acts to disrupt the dynamics of vortex pairing relative to the surfactant-free case as the ‘knitting process’ is promoted by streamwise rather than azimuthal vorticity production and the vortex ring deformation is replaced by vortex reconnection and merging in the azimuthal direction in the surfactant-laden case.
Surfactant-driven hairpin-vortical structures: temporal development of the HV1 and HV2 hairpin-like vortical structures via the  $Q$-criterion with
  $Q=200$ together with the interfacial location coloured by
  $\varGamma$ at times (a)
  $t=32.81$, (b)
  $t=33.59$, (c)
  $t=34.37$, (d)
  $t=36.71$, (e)
  $t=39.06$. Panel (e) shows the two transversal slices displayed in ( f,g), which depict the streamwise vorticity
  $\omega _x$ through the legs and head of HV1, respectively; arrows of in-plane velocity vectors have been added; the white lines represent the interface location. The parameter values are the same as in figure 5.
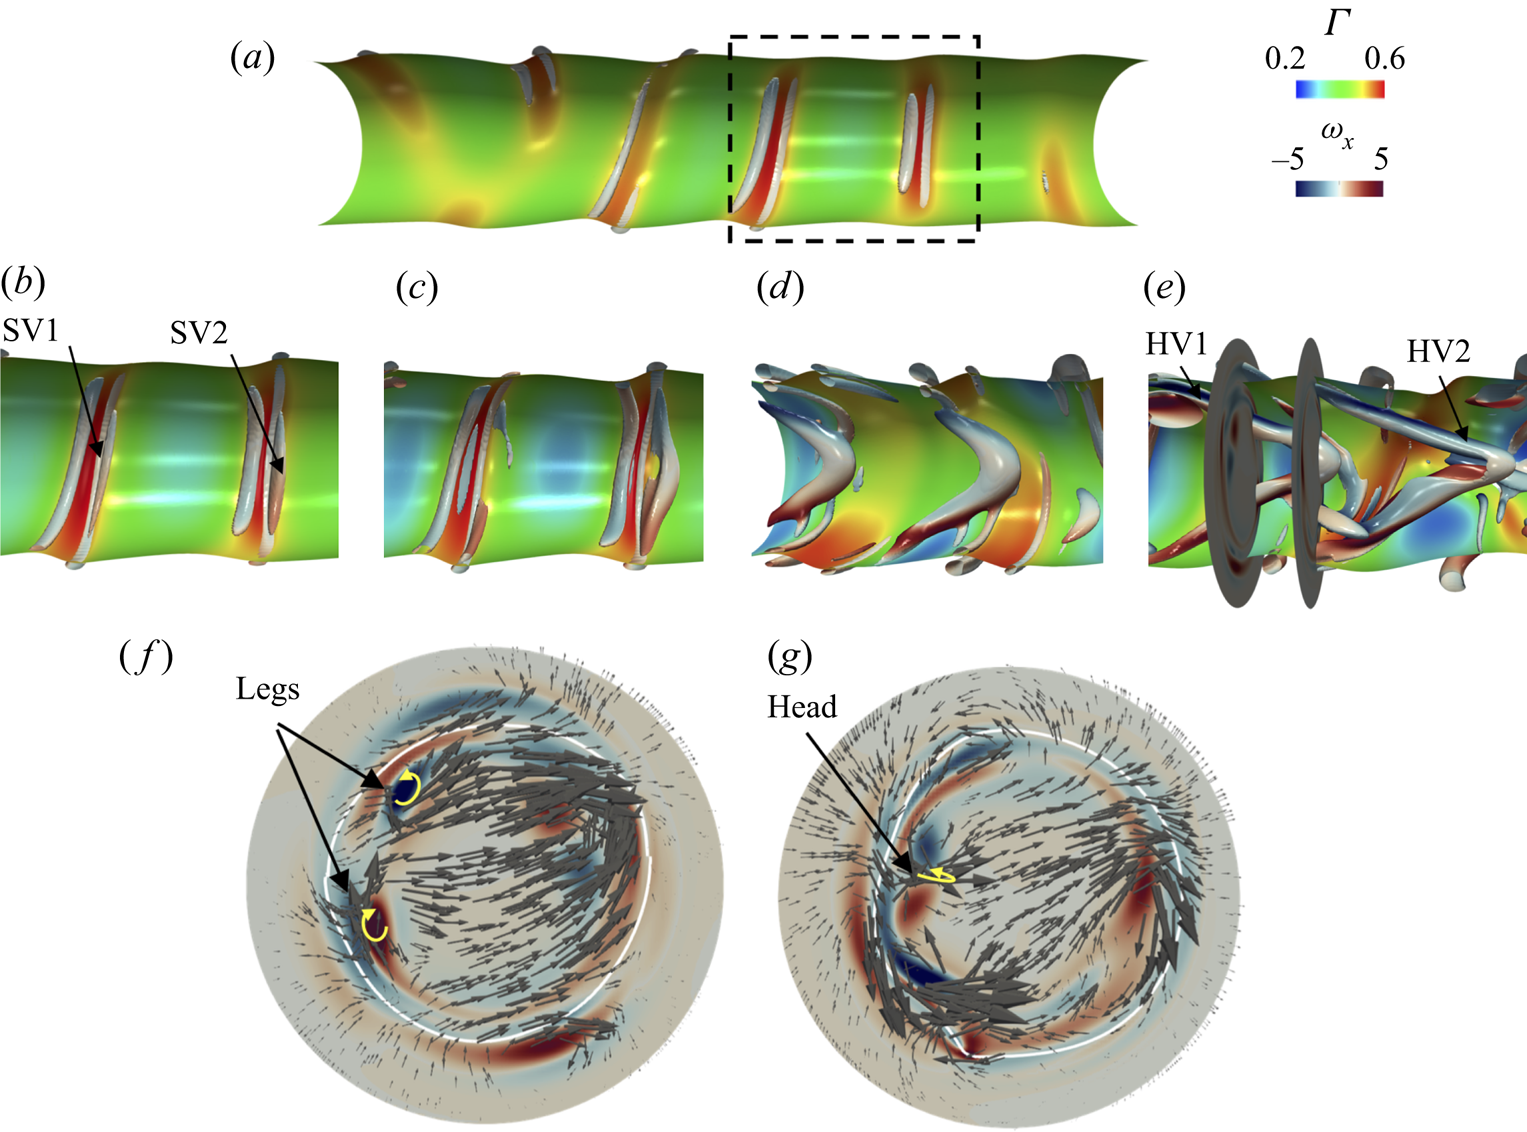
For increasing time, figure 6 shows the formation of surfactant-induced inner hairpin-like vortical structures. The shear stress, which is generated to balance the gradients in  $\sigma$, gives rise to counter-rotating streamwise vortices of similar magnitude to the KH rings (labelled ‘SV1’ and ‘SV2’ in figure 6b). These structures grow in the
  $x$-direction into a combination of streamwise vortices close to the interface, i.e. legs, and a hairpin-like head close to the centre-plane of the jet (see figure 6d). The hairpin legs extend from the regions of high to low values of
  $\varGamma$ on the surface, while the hairpin head points down in the positive
  $x$-direction (labelled ‘HV1’ and ‘HV2’ in figure 6e). To complete the presentation of these hairpin-like vortical structures, figures 6( f,g) show the directions of flow rotation of the legs and head for HV1. For comparison, we have added arrows to show velocity direction and to prove that this coherent vortical structure exhibits the same qualitative behaviour as the hairpin vortices proposed by Theodorsen (Reference Theodorsen1952) for near-wall turbulence. To the best of our knowledge, the formation of hairpin-like vortical structures induced by surfactant effects has not been reported yet. We have also observed surfactant-driven outer hairpin-like vortical structures (not shown) whose heads are in the negative
  $x$-direction (in the frame of reference of the legs).
At later times, figures 7(a–d) show the variation with arc length of the interfacial location  $\varGamma$, and
  $[[\omega _t]]$ and
  $[[\omega _b]]$ at
  $t=36.51$ and
  $t=44.68$; corresponding 3-D representations of the interface are also shown in figures 7(e, f) for
  $t=44.68$, coloured by the magnitude of
  $\varGamma$ and the
  $Q$-criterion, respectively. The flow is accompanied by radially converging and diverging motion due to vortex–surface interaction; interfacial convection drives surfactant towards the inner lobes (interfacial contraction), and away from the outer lobes (interfacial expansion). Vorticity jumps are highest in the interfacial regions with the largest gradients in
  $\varGamma$. As time evolves, the ratio of these Marangoni-driven
  $[[\omega _t]]$ to
  $[[\omega _b]]$ reduces, and this results in large coherent structures that merge to form counter-rotating streamwise vortical rings that eventually ‘knit’ with the adjacent vortex ring located in the
  $x$-direction (labelled VR1–VR4 in figure 7f); this pairing is similar to the surfactant-free case (in agreement with Urbin & Métais Reference Urbin and Métais1997; da Silva & Métais Reference da Silva and Métais2002).
The location of the interface together with the surfactant concentration and the jumps of the vorticity across the interface for (a,b)  $t=36.81$ and (c,d)
  $t=44.68$. (e) A 3-D representation of the interface location coloured by
  $\varGamma$ at
  $t=44.68$, and ( f) vortex knitting visualised via the
  $Q$-criterion with value
  $Q=1600$, where the colour represents
  $\omega _x$. The arc length
  $s$ corresponds to the
  $x$–
$x$– $z$ plane (
 $y = 2.5$) intersecting the interface. The centre of the jet core corresponds to
  $z=2.5$. The parameter values are the same as in figure 5.
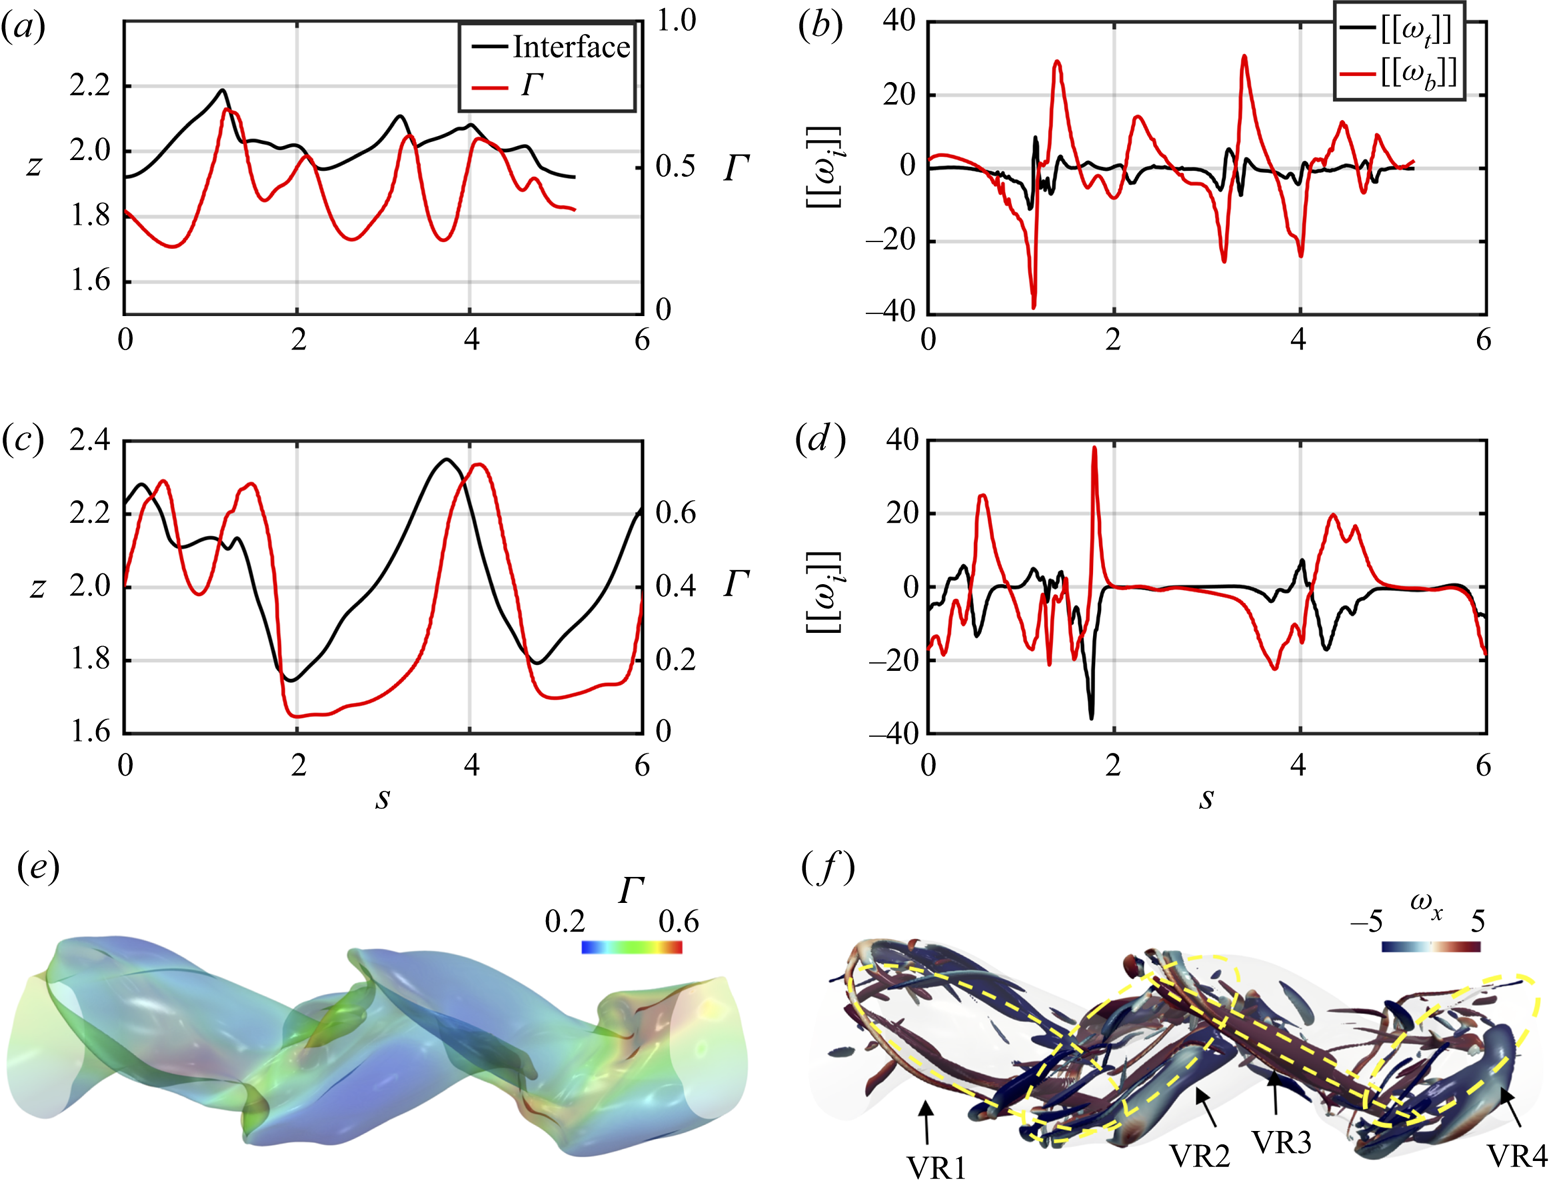
We now examine the dynamics of the circulation  $\boldsymbol {\varOmega }$ by considering (2.43), which we express as
 \begin{equation} \frac{{\rm D}\boldsymbol{\varOmega}}{{\rm D}\tilde{t}}= I_{tilt} + I_{diff} + I_{curv}, \end{equation}
where  $I_{tilt}$,
  $I_{diff}$ and
  $I_{curv}$ are defined as
 \begin{align} I_{tilt}\equiv \oint_{\partial \tilde{V}}\hat{\boldsymbol{n}}\boldsymbol{\cdot} \boldsymbol{\omega} \boldsymbol{u} \,{\rm d} S,\quad I_{diff}\equiv \frac{1}{{\textit{Re}}}\oint_{\partial V}\hat{\boldsymbol{n}}\boldsymbol{\cdot}\boldsymbol{\nabla} \boldsymbol{\omega} \,{\rm d} S ,\quad I_{curv}\equiv \frac{1}{{\textit{We}}}\oint_I\,\hat{\boldsymbol{b}}\,\frac{\partial}{\partial s}(\sigma[\kappa_1+\kappa_2])\,{\rm d} S, \end{align}
which correspond to vortex tilting/stretching, diffusion of vorticity, and circulation variation due to gradients in curvature and interfacial tension (in the case of surfactant-laden systems). Figure 8 shows the temporal evolution of  ${\rm D}\boldsymbol {\varOmega }/{\rm D}t$,
  $I_{tilt}$,
  $I_{diff}$ and
  $I_{curv}$, which allows us to identify the dominant physical mechanisms that contribute to the creation and dissipation of circulation. In figure 9, we also show snapshots of the 3-D representation of the interface corresponding to the volume used to carry out the computations necessary to calculate
  ${\rm D}\boldsymbol {\varOmega }/{\rm D}t$ and its constituent terms for the surfactant-laden and surfactant-free cases; this allows one to pinpoint the mechanisms primarily responsible for the interfacial structures observed. It is seen clearly from figure 8 that during the early stages of the flow,
  $\boldsymbol {\varOmega }$ remains approximately constant. Inspection of figures 8(c–h) shows clearly that the rate of change of circulation is dominated by the mechanisms related to vortex diffusion
  $I_{diff}$ and curvature
  $I_{curv}$, with vortex tilting/shielding playing a relatively minor role. It is also clear that in the surfactant-laden jet case, the Marangoni contribution to
  $I_{curv}$ dominates that associated with curvature derivatives. This observation further bolsters the claim that Marangoni stresses drive vorticity generation in the jet dynamics.
Total rate of change of circulation,  $\boldsymbol {\varOmega }$, according to (2.43): (a,b)
  ${\rm D}\boldsymbol {\varOmega }/{\rm D}t$, (c,d) vortex diffusion (
 $I_{diff}$), (e, f) vortex tilting (
 $I_{tilt}$), and (g,h) surface tension (
 $I_{curv}$); see (3.2a–c) for the definitions of
  $I_{tilt}$,
  $I_{diff}$ and
  $I_{curv}$. (a,c,e,g) Surfactant-laden cases, and (b,d, f,h) surfactant-free cases. For (g), we represent the contributions that arise from the gradients of curvature (solid lines) and the gradients of surface tension (dashed lines) to underscore the relative importance of the Marangoni stresses. Red, blue and black coloured lines represent components
  $x$,
$x$,  $y$ and
  $z$ of
  ${\rm D}\boldsymbol {\varOmega }/{\rm D}t$,
  $I_{tilt}$,
  $_{diff}$ and
  $I_{curv}$. The parameters are
  $ {\textit {Re}}=5000$,
  $ {\textit {We}}=500$, and for the surfactant-laden case,
  $\beta _s=0.5$,
  $Pe_s=100$ and
  $\varGamma _o=\varGamma _{\infty }/2$.
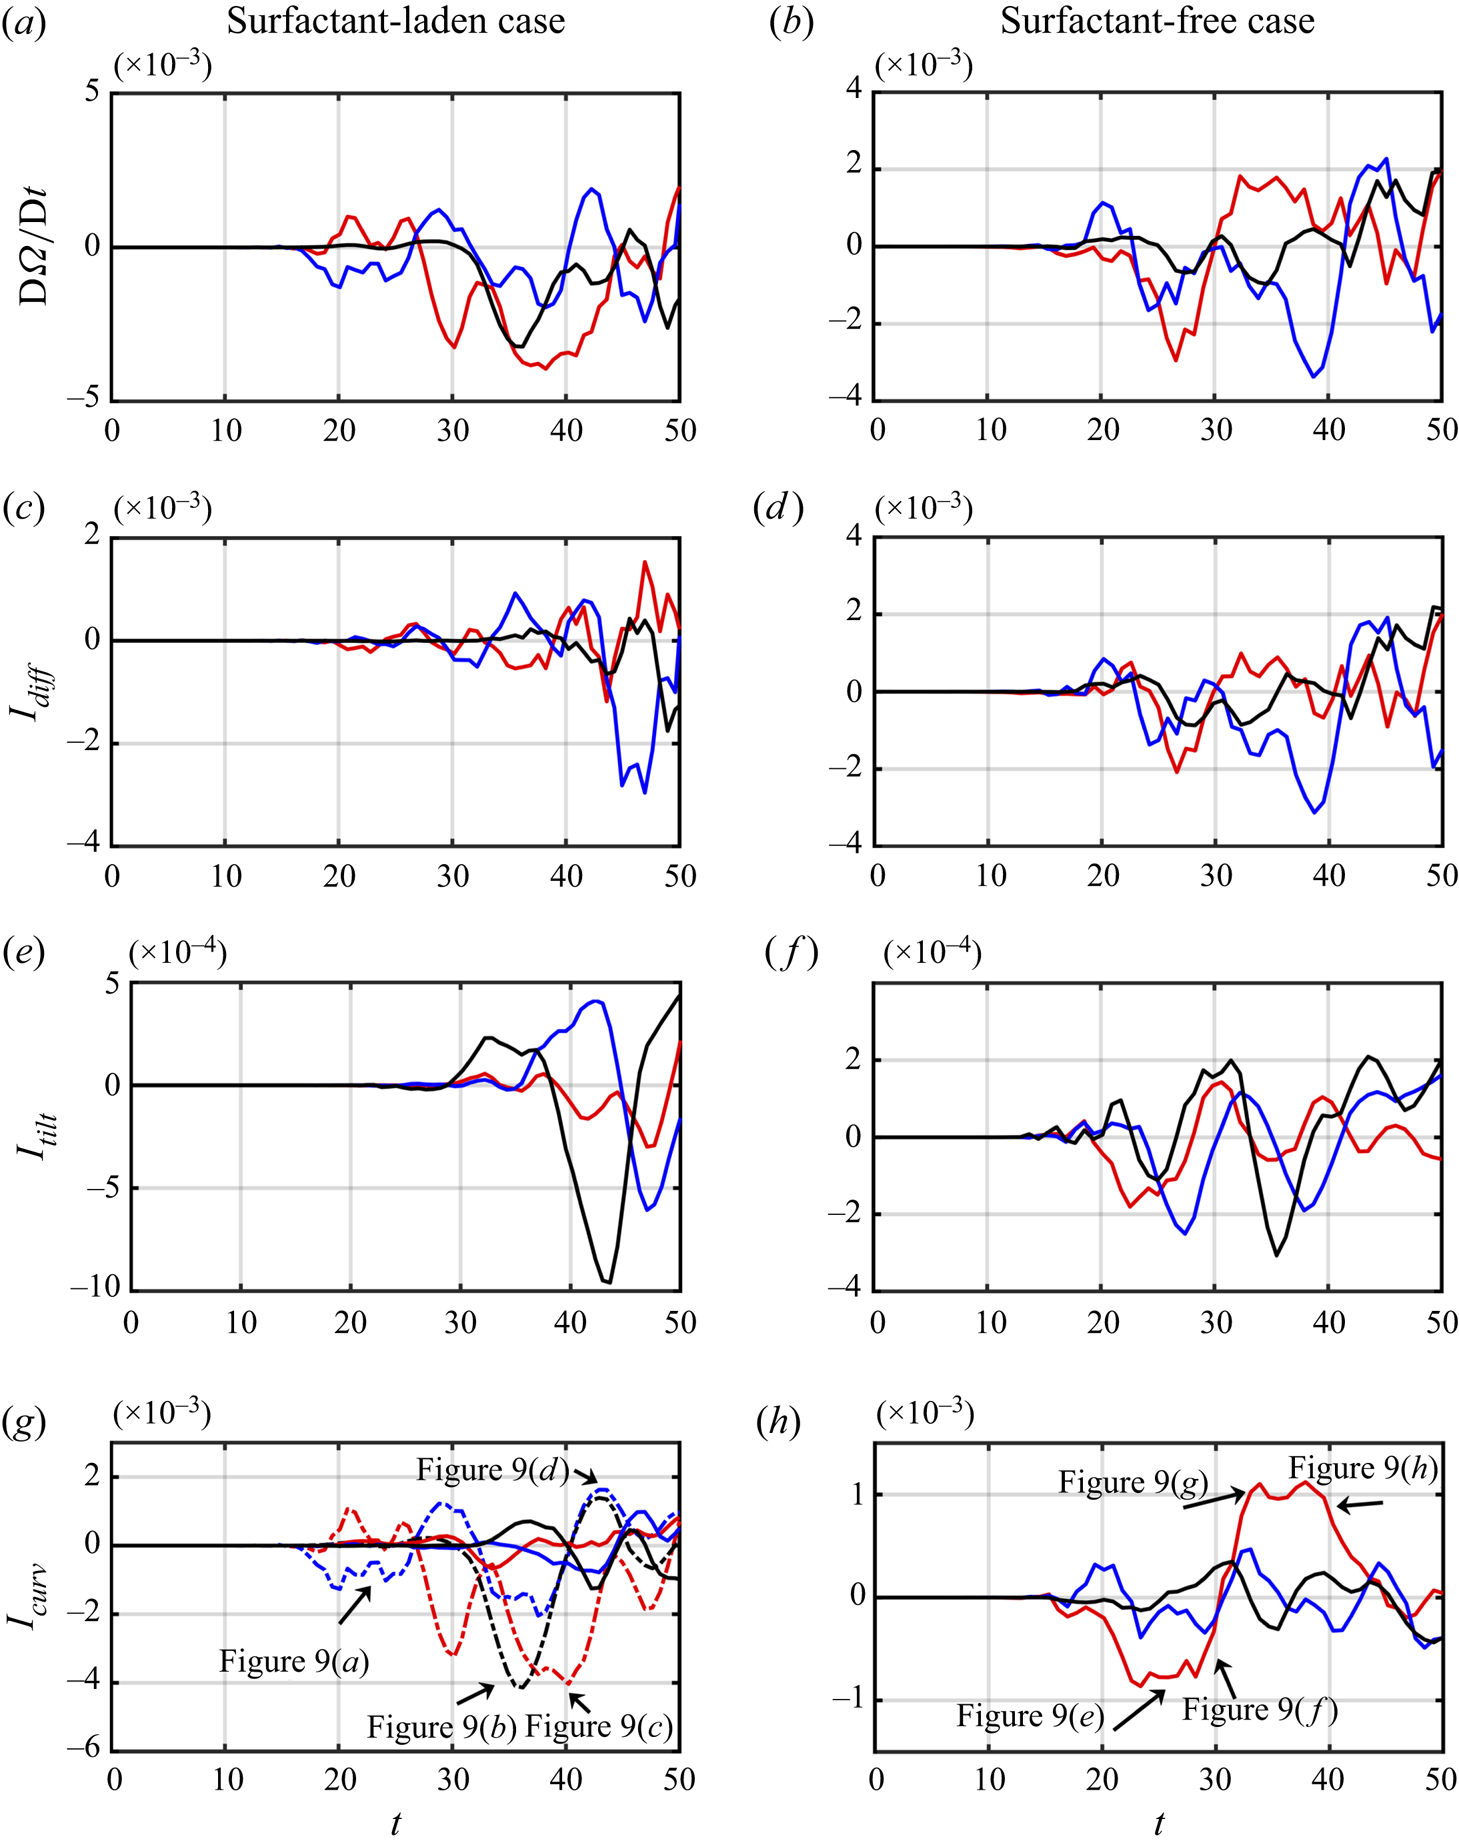
Spatio-temporal evolution of the control volume  $V$ with a surface
  $\partial V$ that encloses an interface plane
  $I$ used to calculate the rate of change of the circulation in figure 8. (a–d) Surfactant-laden cases, at
  $t=25.20, 35.50, 40.37, 43.75$, and (e–h) surfactant-free cases, at
  $t=27.12, 30.43, 34.37, 40.55$. The parameter values are the same as in figure 8.
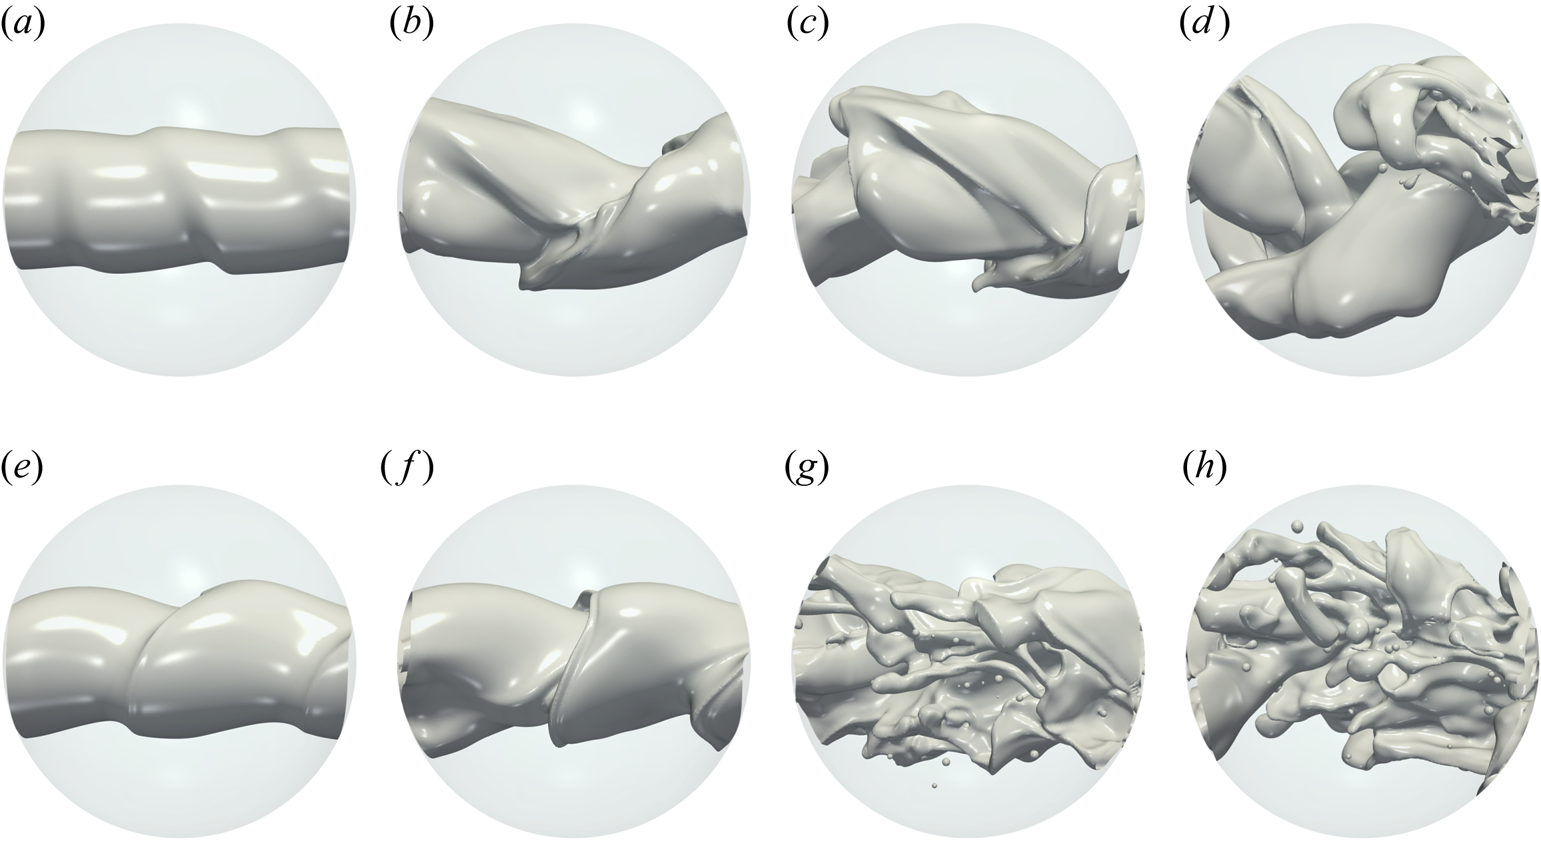
The snapshots for the surfactant-laden (figures 9a–d) and surfactant-free (figures 9e–h) cases have been chosen carefully so as to link the various stages of jet destabilisation to the prominent changes in the temporal variation of  $I_{diff}$,
  $I_{tilt}$,
  $I_{curv}$ and
  ${\rm D}\boldsymbol {\varOmega }/{\rm D}t$. Given the dominance of
  $I_{curv}$ over the time range considered (
 $0\leq t \leq 40$), we focus on the variations in this quantity and its signature effects on the interfacial shape. Inspection of figures 8(g) and 9(a) reveals that the relatively gentle interfacial undulations are linked to variations of the Marangoni contribution to
  $I_{curv}$ in the
  $x\unicode{x2013}y$ plane. The development of the more complex interfacial shapes, on the other hand, is accompanied by a concomitant rise in three-dimensionality of
  $I_{curv}$ (in addition to significant contributions from the
  $x$-component of
  $I_{curv}$). In the surfactant-free case, inspection of figures 8(d,h) and 9(e–h) shows that the interfacial jet evolution is accompanied by large variations in the
  $x$-component of
  $I_{curv}$, and vorticity diffusion characterised by
  $I_{diff}$.
Finally, we plot in figure 10 the effect of surfactants on the interfacial area, kinetic energy (defined as  $E_k=\rho \int _V ({\boldsymbol u}^2/2) \,{\rm d}V$) and enstrophy (
 $\varepsilon =\int _V |\boldsymbol {\omega }^2|\,{\rm d}V$), normalised by their initial values
  $A_0$,
  $E_{k0}$ and
  $\varepsilon _0$, respectively. After the onset of destabilisation (defined when the interfacial surface has reached
  $A=1.025$), we observe that the surfactant-induced effects discussed above – which include the interfacial vorticity jumps brought about by Marangoni stresses, and their effect on the production of circulation, and jet destabilisation mechanisms associated with vortex formation and spanwise reconnection – promote the delay in increase and subsequent reduction in interfacial area; these effects also lead to a delay in the decay of the jet kinetic energy as well as its enstrophy.
Temporal evolution of (a) surface area  $A$, (b) kinetic energy
  $E_k=\rho \int _V \boldsymbol {u}^2/2 \,{\rm d}V$, and (c) enstrophy
  $\varepsilon =\int _V |\boldsymbol {\omega }^2|\,{\rm d}V$, scaled by the initial interfacial area
  $A_0$, kinetic energy
  $E_{k0}$, and enstrophy
  $\varepsilon _0$, respectively. The parameter values are the same as in figure 5.
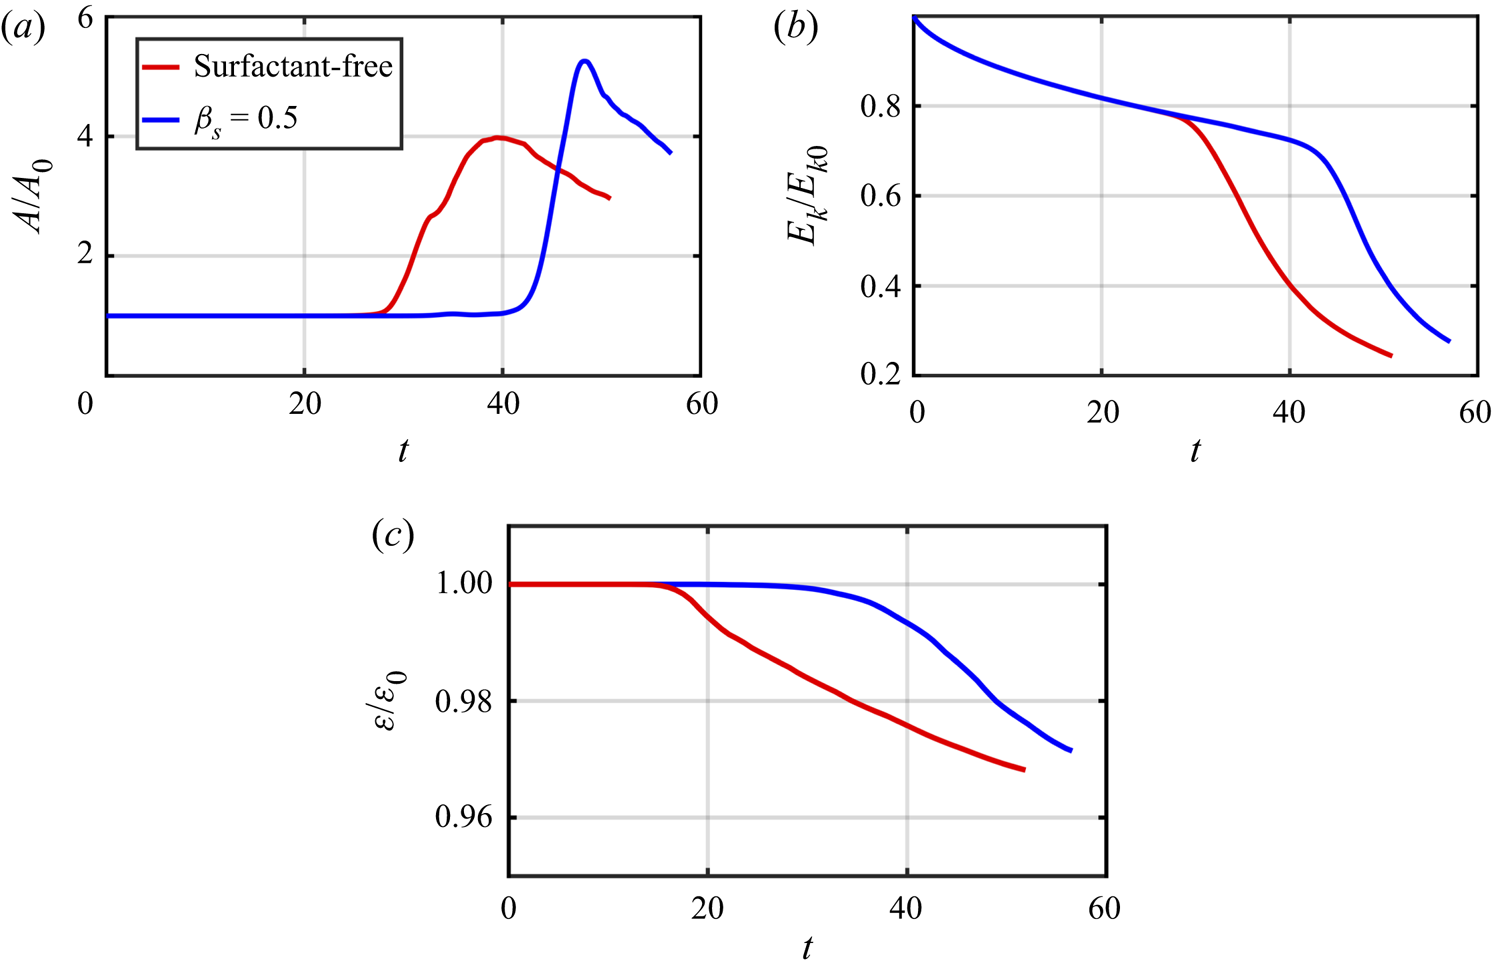
4. Concluding remarks
Three-dimensional numerical simulations of jet destabilisation and atomisation in the presence of a monolayer of insoluble surfactants have been carried out for the first time. A phase diagram in the space of dimensionless surfactant elasticity and Weber number in the inertia-dominated region is presented in the limiting case where there is no vorticity production associated with jumps in material properties such as fluid density and viscosity; in the present work, surface tension forces and Marangoni stress give rise to variations in vorticity and circulation in addition to the vortex tilting/shielding and diffusion mechanisms. We have also derived formulae for the vorticity jumps across the interface due to Marangoni stresses, and equations that provide a breakdown of the rate of production of circulation within the jet into constituent terms that we associate with vortex tilting/shielding, diffusion, and gradients in interfacial curvature and surface tension. The present theoretical formulation is expressed as a conservation law for circulation. We have focused on the limiting case where there is no vorticity production associated with jumps in material properties. Future studies should examine situations characterised by fluids with different material properties.
Then we have analysed in detail the vortex–interface–surfactant interactions in the flow dynamics. At early times, the presence of surfactants induces spanwise vortex reconnections brought about by Marangoni-induced flow resulting in the delay of the onset of destabilisation to the three-dimensional interfacial instabilities. We also show that surfactant-induced Marangoni stresses trigger the formation of hairpin-like structures whose head and legs extend in the streamwise direction. Finally, we have attempted to link the changes in interfacial topology to the mechanisms that influence the production of vorticity and circulation, demonstrating a balance between curvature gradients and diffusion for surfactant-free jets, and the dominance of Marangoni stresses in the surfactant-laden cases.
The present results have been obtained for insoluble surfactants, and we acknowledge that experimental and numerical studies feature soluble surfactants that are dissolved in the liquid that issues from a nozzle to form the jet (Constante-Amores Reference Constante-Amores2021b; Sijs et al. Reference Sijs, Kooij, Holterman, van de Zande and Bonn2021). It is well known that the addition of surfactant solubility will lead to additional richness and complexity. Although surfactant solubility does not affect the governing equations that describe the bulk fluid, it will change the boundary conditions resulting in a change in the flow dynamics. We can anticipate that a change of flow in the vicinity of the interface will have a detrimental effect on the coherent structures that emerge, subsequently affecting the close interplay between interface, vorticity and surfactant. These challenges will be the subject of future work.
Funding
This work is supported by the Engineering and Physical Sciences Research Council, United Kingdom, through the EPSRC MEMPHIS (EP/K003976/1) and PREMIERE (EP/T000414/1) Programme Grants. O.K.M. acknowledges funding from PETRONAS and the Royal Academy of Engineering for a research chair in multiphase fluid dynamics. We acknowledge the HPC facilities provided by the Research Computing Service (RCS) of Imperial College London for the computing time. A.A.C.-P. acknowledges the support from the Royal Society through a university research fellowship (URF/R/180016), an enhancement grant (RGF/EA/181002) and two NSF/CBET-EPSRC grants (nos EP/S029966/1 and EP/W016036/1). D.J. and J.C. acknowledge support for the HPC/AI computing time from the Institut du Developpement et des Ressources en Informatique Scientifique (IDRIS) of the Centre National de la Recherche Scientifique (CNRS), coordinated by GENCI (Grand Equipement National de Calcul Intensif), grant 2022 A0122B06721.
Declaration of interests
The authors report no conflict of interest.
Appendix A. Effect of domain size
To provide conclusive evidence that the lateral size of the domain is sufficiently large to avoid finite-size effects, we have performed additional simulations accounting for different domain sizes, and measured the wavelength between the emergent crests. The selected wavelength for panels for domain sizes  $(4D)^3$,
  $(5D)^3$ and
  $(6D)^3$ correspond to
  $\lambda \sim 1.52 D$,
  $1.55 D$ and
  $1.60 D$, respectively. Thus the wavelength values are very weakly dependent on the domain size, indicating the absence of finite-size effects. We also note that the size of the computational domain is in agreement with previous studies (see, for example, Jarrahbashi & Sirignano Reference Jarrahbashi and Sirignano2014; Jarrahbashi et al. Reference Jarrahbashi, Sirignano, Popov and Hussain2016; Zandian, Sirignano & Hussain Reference Zandian, Sirignano and Hussain2016; Desjardins & Pitsch Reference Desjardins and Pitsch2010), which have also used periodic boundary conditions for all three components of velocity in the streamwise direction.
Appendix B. Kinematics
We first develop an expression for  ${\rm D}\hat {\boldsymbol {t}}/{\rm D}t$. We consider the motion of an infinitesimal fluid parcel in the plane of the interface, which is treated as a material surface. The position vector is
  $\boldsymbol {x}=\boldsymbol {x}(s,b,t)$, where
  $s$ and
  $b$ represent arc length distances along the
  $\hat {\boldsymbol {t}}$ and
  $\hat {\boldsymbol {b}}$ directions, respectively. At time
  $t+\delta t$, to leading order in
  $\delta t$, we can write the following expression for the tangent to the interface at the fluid parcel that at time
  $t$ was located at
  $\boldsymbol {x}(0,0,t)$:
 \begin{equation} \tilde{\boldsymbol{t}}(t+\delta t)=\frac{\partial\boldsymbol{x}}{\partial s}(0,0,t)+\boldsymbol{\nabla} \boldsymbol{u}\boldsymbol{\cdot}\left(\frac{\partial\boldsymbol{x}}{\partial s}+\frac{\partial\boldsymbol{x}}{\partial b}\right)\delta t. \end{equation}
Noting that  $\hat {\boldsymbol {t}}=\partial \boldsymbol {x}/\partial s$,
  $\boldsymbol {b}=\partial \boldsymbol {x}/\partial b$,
  $\hat {\boldsymbol {t}}\boldsymbol {\cdot }\boldsymbol {\nabla }\boldsymbol {u}=\partial \boldsymbol {u}/\partial s$ and
  $\hat {\boldsymbol {b}}\boldsymbol {\cdot }\boldsymbol {\nabla }\boldsymbol {u}=\partial \boldsymbol {u}/\partial b$, this equation can be re-expressed as
 \begin{equation} \tilde{\boldsymbol{t}}(t+\delta t)=\hat{\boldsymbol{t}}+\left(\frac{\partial\boldsymbol{u}}{\partial s}+\frac{\partial\boldsymbol{u}}{\partial b}\right)\delta t. \end{equation}
The magnitude of  $\tilde {\boldsymbol {t}}(t+\delta t)$ is given by
 \begin{equation} |\tilde{\boldsymbol{t}}|=1+\hat{\boldsymbol{t}}\boldsymbol{\cdot}\left(\frac{\partial \boldsymbol{u}}{\partial s}+\frac{\partial \boldsymbol{u}}{\partial b}\right)\delta t + O(\delta t)^2, \end{equation}
and normalisation of  $\tilde {\boldsymbol {t}}(t+\delta t)$ by this magnitude gives the following tangent unit vector
  $\hat {\boldsymbol {t}}(t+\delta t)$:
 \begin{align} \hat{\boldsymbol{t}}(t+\delta t)&=\dfrac{\hat{\boldsymbol{t}}+\left(\dfrac{\partial\boldsymbol{u}}{\partial s}+\dfrac{\partial\boldsymbol{u}}{\partial b}\right)\delta t}{|\widetilde{\hat{\boldsymbol{t}}}(t+\delta t)|}=\dfrac{\hat{\boldsymbol{t}}+\left(\dfrac{\partial\boldsymbol{u}}{\partial s}+\dfrac{\partial\boldsymbol{u}}{\partial b}\right)\delta t}{1+\hat{\boldsymbol{t}}\boldsymbol{\cdot}\left(\dfrac{\partial \boldsymbol{u}}{\partial s}+\dfrac{\partial \boldsymbol{u}}{\partial b}\right)\delta t}\nonumber\\ &=\left(\hat{\boldsymbol{t}}+\left(\frac{\partial\boldsymbol{u}}{\partial s}+\frac{\partial\boldsymbol{u}}{\partial b}\right)\delta t\right)\left(1-\hat{\boldsymbol{t}}\boldsymbol{\cdot}\left(\frac{\partial\boldsymbol{u}}{\partial s}+\frac{\partial\boldsymbol{u}}{\partial b}\right)\delta t+O(\delta t)^2\right)\nonumber\\ &=\hat{\boldsymbol{t}}+\left(\frac{\partial\boldsymbol{u}}{\partial s}+\frac{\partial\boldsymbol{u}}{\partial b}-\hat{\boldsymbol{t}}\left(\hat{\boldsymbol{t}}\boldsymbol{\cdot}\left(\frac{\partial\boldsymbol{u}}{\partial s}+\frac{\partial\boldsymbol{u}}{\partial b}\right)\right)\right)\delta t + O(\delta t)^2. \end{align}
From this expression, we can arrive at an approximate formula for  ${\rm D}\hat {\boldsymbol {t}}/{\rm D}t$:
 \begin{equation} \frac{{\rm D}\hat{\boldsymbol{t}}}{{\rm D}t}\sim \frac{\hat{\boldsymbol{t}}(t+\delta t)-\hat{\boldsymbol{t}}(t)}{\delta t}=\frac{\partial\boldsymbol{u}}{\partial s}+\frac{\partial\boldsymbol{u}}{\partial b}-\hat{\boldsymbol{t}}\left(\hat{\boldsymbol{t}}\boldsymbol{\cdot}\left(\frac{\partial\boldsymbol{u}}{\partial s}+\frac{\partial\boldsymbol{u}}{\partial b}\right)\right)+O(\delta t). \end{equation}
We now insert the expression
 \begin{equation} \boldsymbol{u}=(\boldsymbol{u}\boldsymbol{\cdot}\hat{\boldsymbol{s}})\hat{\boldsymbol{s}}+(\boldsymbol{u}\boldsymbol{\cdot}\hat{\boldsymbol{t}})\hat{\boldsymbol{t}}+(\boldsymbol{u}\boldsymbol{\cdot}\hat{\boldsymbol{b}})\hat{\boldsymbol{b}} \end{equation}
into  $\boldsymbol {u}\boldsymbol {\cdot } {\rm D}\hat {\boldsymbol {t}}/{\rm D}t$, which yields
 \begin{equation} \boldsymbol{u}\boldsymbol{\cdot}\frac{{\rm D}\hat{\boldsymbol{t}}}{{\rm D}t}=(\boldsymbol{u}\boldsymbol{\cdot}\hat{\boldsymbol{s}})\hat{\boldsymbol{s}}\boldsymbol{\cdot}\frac{{\rm D}\hat{\boldsymbol{t}}}{{\rm D}t}+(\boldsymbol{u}\boldsymbol{\cdot}\hat{\boldsymbol{b}})\hat{\boldsymbol{b}}\boldsymbol{\cdot}\frac{{\rm D}\hat{\boldsymbol{t}}}{{\rm D}t}. \end{equation}
Substitution of (B5) into  $\hat {\boldsymbol {s}}\boldsymbol {\cdot } {\rm D}\hat {\boldsymbol {t}}/{\rm D}t$ and
  $\hat {\boldsymbol {b}}\boldsymbol {\cdot } {\rm D}\hat {\boldsymbol {t}}/{\rm D}t$ gives
 $$\begin{gather} \hat{\boldsymbol{s}}\boldsymbol{\cdot}\frac{{\rm D}\hat{\boldsymbol{t}}}{{\rm D}t}=\hat{\boldsymbol{s}}\boldsymbol{\cdot}\left(\frac{\partial\boldsymbol{u}}{\partial s}+\frac{\partial\boldsymbol{u}}{\partial b}\right), \end{gather}$$
 $$\begin{gather}\hat{\boldsymbol{b}}\boldsymbol{\cdot}\frac{{\rm D}\hat{\boldsymbol{t}}}{{\rm D}t}=\hat{\boldsymbol{b}}\boldsymbol{\cdot}\left(\frac{\partial\boldsymbol{u}}{\partial s}+\frac{\partial\boldsymbol{u}}{\partial b}\right), \end{gather}$$
where we have made use of  $\hat {\boldsymbol {s}}\boldsymbol {\cdot }\hat {\boldsymbol {t}}=0$ and
  $\hat {\boldsymbol {b}}\boldsymbol {\cdot }\hat {\boldsymbol {t}}=0$. We can re-express the right-hand sides of (B8) and (B9) as follows
 $$\begin{gather} \hat{\boldsymbol{s}}\boldsymbol{\cdot}\frac{\partial\boldsymbol{u}}{\partial s}=\frac{\partial}{\partial s}(\hat{\boldsymbol{s}}\boldsymbol{\cdot}\boldsymbol{u})-\boldsymbol{u}\boldsymbol{\cdot}\frac{\partial\hat{\boldsymbol{s}}}{\partial s}, \end{gather}$$
 $$\begin{gather}\hat{\boldsymbol{s}}\boldsymbol{\cdot}\frac{\partial\boldsymbol{u}}{\partial b}=\frac{\partial}{\partial b}(\hat{\boldsymbol{s}}\boldsymbol{\cdot}\boldsymbol{u})-\boldsymbol{u}\boldsymbol{\cdot}\frac{\partial\hat{\boldsymbol{s}}}{\partial b}, \end{gather}$$
 $$\begin{gather}\hat{\boldsymbol{b}}\boldsymbol{\cdot}\frac{\partial\boldsymbol{u}}{\partial s}=\frac{\partial}{\partial s}(\hat{\boldsymbol{b}}\boldsymbol{\cdot}\boldsymbol{u})-\boldsymbol{u}\boldsymbol{\cdot}\frac{\partial\hat{\boldsymbol{b}}}{\partial s}, \end{gather}$$
 $$\begin{gather}\hat{\boldsymbol{b}}\boldsymbol{\cdot}\frac{\partial\boldsymbol{u}}{\partial b}=\frac{\partial}{\partial b}(\hat{\boldsymbol{b}}\boldsymbol{\cdot}\boldsymbol{u})-\boldsymbol{u}\boldsymbol{\cdot}\frac{\partial\hat{\boldsymbol{b}}}{\partial b}. \end{gather}$$
Inserting (B6) into the second term on the right-hand sides of (B10)–(B13), we obtain
 $$\begin{gather} \boldsymbol{u}\boldsymbol{\cdot}\frac{\partial\hat{\boldsymbol{s}}}{\partial s}=\kappa_1(\boldsymbol{u}\boldsymbol{\cdot}\hat{\boldsymbol{t}}), \end{gather}$$
 $$\begin{gather}\boldsymbol{u}\boldsymbol{\cdot}\frac{\partial\hat{\boldsymbol{s}}}{\partial b}=\kappa_2(\boldsymbol{u}\boldsymbol{\cdot}\hat{\boldsymbol{b}}), \end{gather}$$
 $$\begin{gather}\boldsymbol{u}\boldsymbol{\cdot}\frac{\partial\hat{\boldsymbol{b}}}{\partial s}=0, \end{gather}$$
 $$\begin{gather}\boldsymbol{u}\boldsymbol{\cdot}\frac{\partial\hat{\boldsymbol{b}}}{\partial b}={-}\kappa_2(\boldsymbol{u}\boldsymbol{\cdot}\hat{\boldsymbol{s}}), \end{gather}$$
where the curvatures  $\kappa _1$ and
  $\kappa _2$ are defined as
 \begin{equation} \kappa_1=\hat{\boldsymbol{t}}\boldsymbol{\cdot}\frac{\partial\hat{\boldsymbol{s}}}{\partial s}, \quad \kappa_2=\hat{\boldsymbol{b}}\boldsymbol{\cdot}\frac{\partial\hat{\boldsymbol{s}}}{\partial b}. \end{equation}
In deriving (B14)–(B17), we have noted that  $\hat {\boldsymbol {t}}\neq \hat {\boldsymbol {t}}(b)$ and
  $\hat {\boldsymbol {b}}\neq \hat {\boldsymbol {b}}(s)$. Substitution of (B14)–(B17) into (B10)–(B13), and the resultant relations into (B8) and (B9), respectively, yields the expressions
 $$\begin{gather} \hat{\boldsymbol{s}}\boldsymbol{\cdot}\frac{{\rm D}\hat{\boldsymbol{t}}}{{\rm D}t}=\frac{\partial}{\partial s}(\boldsymbol{u}\boldsymbol{\cdot}\hat{\boldsymbol{s}})+\frac{\partial}{\partial b}(\boldsymbol{u}\boldsymbol{\cdot}\hat{\boldsymbol{s}})-\kappa_1 (\boldsymbol{u}\boldsymbol{\cdot}\hat{\boldsymbol{t}})-\kappa_2(\boldsymbol{u}\boldsymbol{\cdot}\hat{\boldsymbol{b}}), \end{gather}$$
 $$\begin{gather}\hat{\boldsymbol{b}}\boldsymbol{\cdot}\frac{{\rm D}\hat{\boldsymbol{t}}}{{\rm D}t}=\frac{\partial}{\partial s}(\boldsymbol{u}\boldsymbol{\cdot}\hat{\boldsymbol{b}})+\frac{\partial}{\partial b}(\boldsymbol{u}\boldsymbol{\cdot}\hat{\boldsymbol{b}})+\kappa_2 (\boldsymbol{u}\boldsymbol{\cdot}\hat{\boldsymbol{s}}). \end{gather}$$
Substitution of (B19) and (B20) into (B7), and rearranging, yields
 \begin{equation} \boldsymbol{u}\boldsymbol{\cdot}\frac{{\rm D}\hat{\boldsymbol{t}}}{{\rm D}t}=\frac{1}{2}\,\frac{\partial}{\partial s}\left[(\boldsymbol{u}\boldsymbol{\cdot}\hat{\boldsymbol{s}})^2+(\boldsymbol{u}\boldsymbol{\cdot}\hat{\boldsymbol{b}})^2\right] + \frac{1}{2}\,\frac{\partial}{\partial b}\left[(\boldsymbol{u}\boldsymbol{\cdot}\hat{\boldsymbol{s}})^2+(\boldsymbol{u}\boldsymbol{\cdot}\hat{\boldsymbol{b}})^2\right] -\kappa_1(\boldsymbol{u}\boldsymbol{\cdot}\hat{\boldsymbol{t}})(\boldsymbol{u}\boldsymbol{\cdot}\hat{\boldsymbol{s}}). \end{equation}
Appendix C. Near-interface normal stress jump
In order to generate a 3-D version of the pressure gradient term in (2.34), we first consider the jump in the normal stress across the plane of the interface:
 \begin{equation} p_2-p_1={-}\sigma(\kappa_1+\kappa_2)+[[\mu \hat{\boldsymbol{s}}\boldsymbol{\cdot} \boldsymbol{D}\boldsymbol{\cdot} \hat{\boldsymbol{s}}]], \end{equation}
where  $\kappa _1$ and
  $\kappa _2$ are given by (B18a,b). Substitution of (B6) into
  $\boldsymbol {\nabla }\boldsymbol {\cdot } \boldsymbol {u}=0$ yields
 \begin{align} \hat{\boldsymbol{s}}\boldsymbol{\cdot}\boldsymbol{\nabla}\boldsymbol{u}\boldsymbol{\cdot}\hat{\boldsymbol{s}}& ={-}\hat{\boldsymbol{t}}\boldsymbol{\cdot}\boldsymbol{\nabla}\boldsymbol{u}\boldsymbol{\cdot}\hat{\boldsymbol{t}}-\hat{\boldsymbol{b}}\boldsymbol{\cdot}\boldsymbol{\nabla}\boldsymbol{u}\boldsymbol{\cdot}\hat{\boldsymbol{b}}\nonumber\\ &={-}\hat{\boldsymbol{t}}\boldsymbol{\cdot}\frac{\partial \boldsymbol{u}}{\partial s}-\hat{\boldsymbol{b}}\boldsymbol{\cdot}\frac{\partial\boldsymbol{u}}{\partial b}, \end{align}
where we have set  $\hat {\boldsymbol {t}}\boldsymbol {\cdot } \boldsymbol {\nabla }\boldsymbol {u}=\partial \boldsymbol {u}/\partial s$ and
  $\hat {\boldsymbol {b}}\boldsymbol {\cdot }\boldsymbol {\nabla }\boldsymbol {u}=\partial \boldsymbol {u}/\partial b$. We can re-express
  $\hat {\boldsymbol {t}}\boldsymbol {\cdot } (\partial \boldsymbol {u}/\partial s)$ and
  $\hat {\boldsymbol {b}}\boldsymbol {\cdot } (\partial \boldsymbol {u}/\partial b)$ as
 $$\begin{gather} \hat{\boldsymbol{t}}\boldsymbol{\cdot}\frac{\partial \boldsymbol{u}}{\partial s}=\frac{\partial}{\partial s}(\boldsymbol{u}\boldsymbol{\cdot}\hat{\boldsymbol{t}})-\boldsymbol{u}\boldsymbol{\cdot}\frac{\partial\hat{\boldsymbol{t}}}{\partial s}, \end{gather}$$
 $$\begin{gather}\hat{\boldsymbol{b}}\boldsymbol{\cdot}\frac{\partial \boldsymbol{u}}{\partial b}=\frac{\partial}{\partial b}(\boldsymbol{u}\boldsymbol{\cdot}\hat{\boldsymbol{b}})-\boldsymbol{u}\boldsymbol{\cdot}\frac{\partial\hat{\boldsymbol{b}}}{\partial b}. \end{gather}$$
Substitution of (B6) into  $\boldsymbol {u}\boldsymbol {\cdot } (\partial \hat {\boldsymbol {t}}/\partial s)$ and
  $\boldsymbol {u}\boldsymbol {\cdot } (\partial \hat {\boldsymbol {b}}/\partial s)$ leads to
 $$\begin{gather} \boldsymbol{u}\boldsymbol{\cdot}\frac{\partial\hat{\boldsymbol{t}}}{\partial s}={-}\kappa_1(\boldsymbol{u}\boldsymbol{\cdot}\hat{\boldsymbol{s}}), \end{gather}$$
 $$\begin{gather}\boldsymbol{u}\boldsymbol{\cdot}\frac{\partial\hat{\boldsymbol{b}}}{\partial b}={-}\kappa_2(\boldsymbol{u}\boldsymbol{\cdot}\hat{\boldsymbol{s}}), \end{gather}$$
where, again, we have made use of the fact that  $\hat {\boldsymbol {t}}\neq \hat {\boldsymbol {t}}(b)$ and
  $\hat {\boldsymbol {b}}\neq \hat {\boldsymbol {b}}(s)$. Substitution of (C5) and (C6) into (C3) and (C4), and the resultant relations into (C2), gives
 \begin{equation} \hat{\boldsymbol{s}}\boldsymbol{\cdot}\boldsymbol{\nabla}\boldsymbol{u}\boldsymbol{\cdot}\hat{\boldsymbol{s}}={-}\frac{\partial}{\partial s}[(\boldsymbol{u}\boldsymbol{\cdot}\hat{\boldsymbol{t}})+(\boldsymbol{u}\boldsymbol{\cdot}\hat{\boldsymbol{b}})]-(\kappa_1+\kappa_2)(\boldsymbol{u}\boldsymbol{\cdot}\hat{\boldsymbol{s}}). \end{equation}
Since  $\hat {\boldsymbol {s}}\boldsymbol {\cdot }\boldsymbol {D}\boldsymbol {\cdot }\hat {\boldsymbol {s}}=2\hat {\boldsymbol {s}}\boldsymbol {\cdot }\boldsymbol {\nabla }\boldsymbol {u}\boldsymbol {\cdot }\hat {\boldsymbol {s}}$, it follows that
 \begin{equation} \hat{\boldsymbol{s}}\boldsymbol{\cdot}\boldsymbol{D}\boldsymbol{\cdot}\hat{\boldsymbol{s}}={-}2\,\frac{\partial}{\partial s}[(\boldsymbol{u}\boldsymbol{\cdot}\hat{\boldsymbol{t}})+(\boldsymbol{u}\boldsymbol{\cdot}\hat{\boldsymbol{b}})]-2(\kappa_1+\kappa_2)(\boldsymbol{u}\boldsymbol{\cdot}\hat{\boldsymbol{s}}). \end{equation}
Substitution of this equation into (C1) yields the following expression for the pressure jump:
 \begin{equation}
[[p]]={-}\sigma(\kappa_1+\kappa_2)-2\left[\left[\mu\left(\frac{\partial}{\partial
s}[(\boldsymbol{u}\boldsymbol{\cdot}\hat{\boldsymbol{t}})+(\boldsymbol{u}\boldsymbol{\cdot}\hat{\boldsymbol{b}})]+\left(\kappa_1+\kappa_2\right)\left(\boldsymbol{u}\boldsymbol{\cdot}\hat{\boldsymbol{s}}\right)\right)\right]\right].
\end{equation}
\begin{equation}
[[p]]={-}\sigma(\kappa_1+\kappa_2)-2\left[\left[\mu\left(\frac{\partial}{\partial
s}[(\boldsymbol{u}\boldsymbol{\cdot}\hat{\boldsymbol{t}})+(\boldsymbol{u}\boldsymbol{\cdot}\hat{\boldsymbol{b}})]+\left(\kappa_1+\kappa_2\right)\left(\boldsymbol{u}\boldsymbol{\cdot}\hat{\boldsymbol{s}}\right)\right)\right]\right].
\end{equation}


 Open access