


Numerous epidemiological studies have established that greater consumption of fruits and vegetables (FV) is associated with a reduced risk of chronic diseases, including CVD, heart disease and cancer(Reference Aune, Giovannucci and Boffetta1–Reference Madsen, Sen and Aune3). FV are rich in a variety of phytochemicals, including carotenoids and flavonoids, which are believed to contribute to their health benefits(Reference Eggersdorfer and Wyss4). However, much of the existing evidence is based on self-reported dietary data, which is often prone to inaccuracies and subject to recall and social desirability biases. These limitations underscore the need for objective measures of dietary intake to establish more reliable associations with health outcomes.
Serum biomarkers, such as vitamin C, potassium and carotenoids, provide an objective and quantifiable measure of FV intake(Reference Drewnowski, Rock and Henderson5,Reference Woodside, Draper and Lloyd6) . Among these, carotenoids are naturally occurring pigments found in a wide range of FV. However, since humans cannot synthesis carotenoids, blood carotenoid levels are considered one of the best biomarkers of FV intake(Reference Saini, Nile and Park7). Additionally, carotenoids function as antioxidants and some are vitamin A precursors, underscoring their significant role in promoting human health. Epidemiological studies have reported that higher intake of carotenoids is associated with improved immune function(Reference Chew and Park8), anti-inflammatory effects(Reference Ciccone, Cortese and Gesualdo9) and enhanced cognitive function(Reference Kesse-Guyot, Andreeva and Ducros10), as well as a reduced risk of chronic diseases such as CVD, cancer and age-related eye diseases(Reference Bungau, Abdel-Daim and Tit11–Reference Yao, Goh and Kim13). Vitamin C, an antioxidant found abundantly in FV, plays a crucial role in immune function, collagen synthesis and protection against oxidative stress(Reference Chambial, Dwivedi and Shukla14). Since vitamin C is rapidly absorbed and is largely excreted when consumed in excess, it is expected to reflect short-term FV intake(Reference Padayatty, Sun and Wang15). Potassium, another nutrient abundant in FV, is essential for maintaining normal blood pressure, muscle and renal function and cardiovascular health(Reference He and MacGregor16,Reference Weaver17) . Although potassium is rich in FV, its levels are constantly regulated under normal health conditions(Reference McDonough and Youn18), making it challenging to capture longer-term FV intake.
CVD and cancers are the leading causes of death worldwide, highlighting the importance of identifying dietary factors that could mitigate these risks. Despite the well-recognised benefits of FV consumption, few studies have utilised serum biomarkers to explore their relationship with cause-specific mortality in a large, nationally representative dataset. Our analytic dataset combines publicly available National Health and Nutrition Examination Survey (NHANES) data with National Death Index-linked mortality files. This study aims to elucidate the relationships between serum carotenoids, vitamin C and potassium and all-cause, cancer and CVD mortality among US adults aged 30 years and older using data from the NHANES spanning 1988–2006 with mortality follow-up through 2019.
Materials and methods
Study population
This study utilised data from the NHANES for US adults aged 30 years and older, spanning the periods 1988–1994 (n 13 065)(19) and 2001–2006 (n 12 062)(20–22). The combined dataset included a total of 25 127 participants. We focused on participants aged 30 years and older to avoid bias, as mortality due to chronic diseases is more prevalent in this age group, and deaths under the age of 30 are often due to external factors(Reference Curtin, Tejada-Vera and Bastian23). Participants were excluded if they met any of the following criteria: pregnancy or breast-feeding women (n 457), ineligible mortality follow-up status (n 23), unreliable or incomplete dietary recalls (n 1136) and daily energy intake outside of plausible ranges (< 500 or > 8000 kcal/d for men and < 500 or > 5000 kcal/d for women) (n 307). Additional exclusions were applied to individuals with less than 2 years of follow-up time (n 681), missing data on serum carotenoids and potassium levels (n 1312) or with a history of cancer at baseline (n 2043). As a result, we utilised data from 19 168 participants for the analysis (Fig. 1). NHANES study protocols were approved by the National Center for Health Statistics research ethics review board (Institutional Review Board approval and documented consent from participants for NHANES 1988–1994, Protocol #98-12 for NHANES 2001–2004 and Protocol #2005-06 for NHANES 2005–2006). This secondary analysis used publicly available, de-identified NHANES and National Death Index public-use linked mortality files and, per our institutional policies, did not require additional IRB review.
Estimation of dietary intake of carotenoids, vitamin C and potassium
Dietary intake of carotenoids was estimated using one-day 24-h dietary recalls collected from NHANES 1988–1994 to 2001–2006. For vitamin C and potassium, we used intake data as calculated and provided by NHANES. The estimation of carotenoid intake was performed using NHANES dietary data in conjunction with the USDA’s Food and Nutrient Database for Dietary Studies (FNDDS) versions 1.0(24), 2.0(25) and 3.0(26). The FNDDS serves as a resource for determining nutrient values in NHANES, drawing on data from the USDA National Nutrient Database for Standard Reference. The FNDDS provides details on the linkage between NHANES food items and standard reference entries, allowing for the estimation of carotenoid intake by summing the carotenoid content of each food item reported in the dietary recall. By using the FNDDS database, which includes detailed recipes for various foods, we were able to identify the carotenoid content of individual components in mixed dishes and aggregate these values to estimate the total and individual carotenoid intake from each food source. This approach allows for a comprehensive assessment of dietary intake by accurately capturing the carotenoid content in both whole foods and complex dishes. This calculation encompassed specific carotenoids, including α-carotene, β-carotene, β-cryptoxanthin, lycopene, lutein and zeaxanthin and total carotenoid consumption. Additionally, the dietary intake estimates for vitamin C and potassium were similarly derived, using FNDDS nutrient profiles to ensure accurate and reliable calculations for these essential nutrients.
Analysis of serum carotenoids, vitamin C and potassium
Serum concentrations of α-carotene, β-carotene, β-cryptoxanthin, lycopene and lutein and zeaxanthin were analysed using HPLC(Reference Gunter, Lewis and Koncikowski27,28) . Serum vitamin C was quantified using isocratic HPLC with electrochemical detection at 650 mV. Serum potassium levels were determined using an ion-selective electrode method. The ion-selective electrode method utilises a selective membrane that measures potassium ion concentration by detecting the potential difference across the membrane, ensuring precise and specific detection of serum potassium levels. Serum carotenoids were assayed by HPLC in both NHANES III (1988–1994) and NHANES 2001–2006; for 2003–2004, a comparable HPLC method at Craft Technologies was calibrated to the CDC method using CDC-published Deming regression equations to ensure cross-cycle comparability.
National Health and Nutrition Examination Survey linked mortality data
For mortality studies, longer-term datasets and larger sample sizes are essential. Therefore, we combined two public-use NHANES-linked mortality datasets from 1988–1994 to 2001–2006(29). The National Center for Health Statistics has linked publicly available data collected from several National Center for Health Statistics population surveys with death certificate records from the National Death Index. Follow-up time for each participant was calculated from the date of the interview until the date of death or censoring. NHANES-linked mortality data provide follow-up information from the date of survey participation through 31 December 2019. The causes of death for deaths occurring prior to 1999 were determined using the 9th revision of the International Statistical Classification of Diseases, Injuries, and Causes of Death (ICD-9) guidelines(30). For deaths occurring after 1998, the 10th revision (ICD-10) guidelines(31) were used.
Covariates
Covariates were selected based on previous literature, prioritising variables commonly used in similar studies. Race/ethnicity was coded as non-Hispanic White, non-Hispanic Black and Mexican American (NHANES public-use categories). Total energy intake and saturated fatty acid intake were derived from the 24-h dietary recall. Diabetes and hypertension were defined by self-reported physician diagnosis and/or medication use; hypertension was also identified when measured systolic BP ≥ 140 mmHg or diastolic BP ≥ 90 mmHg. History of CVD (coronary heart disease, myocardial infarction or stroke) was based on self-report. Aspirin use and dietary supplement use were self-reported current use at baseline. ‘Examination season’ (warm (May–October) v. cool (November–April)) was used only in sensitivity analyses. Smokers were classified as current smokers if they had smoked at least 100 cigarettes in their lifetime and currently smoked on some days or every day. Non-smokers were defined as those who had smoked fewer than 100 cigarettes in their lifetime, and former smokers were those who had smoked at least 100 cigarettes in their lifetime but had quit by the time of the interview. Alcohol consumption was categorised as no consumption (0 drinks), moderate consumption (up to two drinks per day for men and up to one drink per day for women) or heavy consumption (more than two drinks per day for men and more than one drink per day for women), based on participants’ self-reported daily intake of any alcoholic beverages(Reference Ronksley, Brien and Turner32). Physical activity was measured as the metabolic equivalent of tasks, calculated from weekly minutes of walking/bicycling and moderate/vigorous recreational activities. Metabolic equivalent of tasks-minutes per week were calculated by multiplying weekly minutes of activity by the assigned metabolic equivalent of task values. Participants who reported no walking/bicycling or moderate/vigorous recreational activities were classified as inactive. Poverty income ratio (PIR) was calculated as the ratio of family income to the poverty threshold. Participants were also categorised based on their PIR into three groups: PIR < 1·3, 1·3 ≤ PIR < 1·85, and PIR ≥ 1·85. Chronic kidney disease (CKD) was included as a covariate, categorised as ‘Yes’ or ‘No,’ based on the estimated glomerular filtration rate. We calculated estimated glomerular filtration rate using the 2021 CKD-EPI creatinine equation without race adjustment(Reference Inker, Eneanya and Coresh33). Individuals with estimated glomerular filtration rate less than 60 ml/min/1·73 m2 were classified as CKD ‘Yes’, and those with estimated glomerular filtration rate equal to or greater than 60 ml/min/1·73 m² were classified as CKD ‘No’. This categorisation was used to account for the role of kidney function in regulating potassium levels and its potential impact on mortality risk, acknowledging that CKD may influence these associations. Covariates for cause-specific mortality were selected based on previous studies(Reference Zhu, Cheang and Tang34–Reference Zhang, Li and Zheng36). Participants with missing covariate data were automatically excluded from analyses when relevant data were unavailable.
Statistical analysis
We compared serum concentrations of vitamin C, potassium and total and individual carotenoids according to participants’ baseline socio-demographic and health-related characteristics. Additionally, we compared dietary intakes of fruits, vegetables, vitamin C, potassium and carotenoids by categorising participants into tertiles based on their serum concentrations of vitamin C, potassium and total carotenoids. Given that NHANES collects data cross-sectionally without repeated measures, and that single biomarker measurements may lead to regression dilution over time, we evaluated the potential impact of this dilution by calculating HR and 95 % CI for all-cause mortality across different follow-up periods: less than 5 years, 5 to less than 10 years, 10 to less than 15 years and 15 years or more. These categories correspond to the quartiles of the overall person-time distribution. In this analysis, participants with follow-up periods of less than 2 years were excluded. We also performed stratified analyses according to sex, baseline BMI and smoking status.
All statistical analyses were conducted using SAS software, version 9.4 (SAS Institute Inc.), employing SAS PROC SURVEY procedures and incorporating the appropriate weights, strata, domain and cluster variables to account for the complex, multistage probability sampling design. Cox proportional hazards models were employed to calculate multivariable-adjusted hazard ratios (HR) and 95 % CI for all-cause, cancer and CVD mortality according to tertiles of serum carotenoids, vitamin C and potassium. Two models were fitted: model 1 adjusted for age, sex and race/ethnicity and model 2 additionally adjusted for energy intake, BMI, PIR, diabetes, hypertension, alcohol consumption, saturated fatty acid intake, aspirin use, supplement use, CKD and history of CVD (excluded in CVD-mortality models). Total energy intake was included to obtain an isocaloric interpretation and to reduce confounding by overall diet quantity and BMI to account for adiposity-related confounding. In additional analyses, we assessed temporal heterogeneity by testing biomarker × survey–period interactions (NHANES III 1988–1994 v. 2001–2006) in fully adjusted models. We also conducted a sensitivity analysis by adding 24-h dietary intakes of fruits, vegetables, vitamin C, potassium, total carotenoids and examination season to the fully adjusted model and assessed multicollinearity, to evaluate whether biomarker–mortality associations were independent of concurrent reported diet and seasonality. All reported P values are two sided with a significance level of α = 0·05.
Flow chart of the study population (NHANES III and 2001–2006).

Results
Table 1 presents the serum concentrations of vitamin C, potassium and carotenoids across various socio-demographic and health-related characteristics. Generally, higher serum concentrations of vitamin C and carotenoids were observed in older participants, females, those with normal weight, never smokers, moderate drinkers, those engaging in vigorous physical activity, individuals with a higher PIR, those without a history of diabetes mellitus, CHD or stroke and supplement users.
Mean serum concentrations of vitamin C, potassium and carotenoids by sociodemographic and health-related characteristics in USA. Adults aged ≥ 30 years participating in NHANES 1988–1994 and 2001–2006*

*Values are means (se). †For serum vitamin C, data from 15 716 participants in the 2001 to 2004 NHANES were used. ‡Smokers were defined as current smokers if they had smoked at least 100 cigarettes in their lifetime and smoked some days or every day, non-smokers if they had smoked fewer than 100 cigarettes in their lifetime and former smokers if they had smoked at least 100 cigarettes in their lifetime but had reported quitting by the time of the interview. §Alcohol consumption was defined as either no consumption (0 drinks), moderate consumption (no more than two drinks/day for men and no more than one drink/day for women) or heavy consumption (more than two drinks/day for men and more than one drink/day for women), based on the number of drinks of any type of alcoholic beverage participants reported drinking per day. ||Physical activity level, expressed using the metabolic equivalent of task score, was calculated by combining the intensity level of leisure time activities reported mean duration, and frequency. ¶Poverty income ratio. **Diabetes medication included insulin and/or medication to lower blood sugar. ††Hypertension was defined as systolic blood pressure exceeding 140 mmHg or diastolic pressure over 90 mmHg or taking prescribed medicine for high blood pressure. ‡‡Aspirin users defined as those using aspirin regularly during the past month. §§Supplement use defined as those using nutritional supplements during the past month. ||||CKD classified as ‘Yes’ for eGFR < 60 ml/min/1·73 m² ‘No’ for eGFR ≥ 60 ml/min/1·73 m².
In contrast, serum potassium concentrations exhibited a somewhat different pattern. Serum potassium concentrations were higher in males, former or current smokers, supplement non-users, those with a history of CHD or stroke and CKD compared with their counterparts.
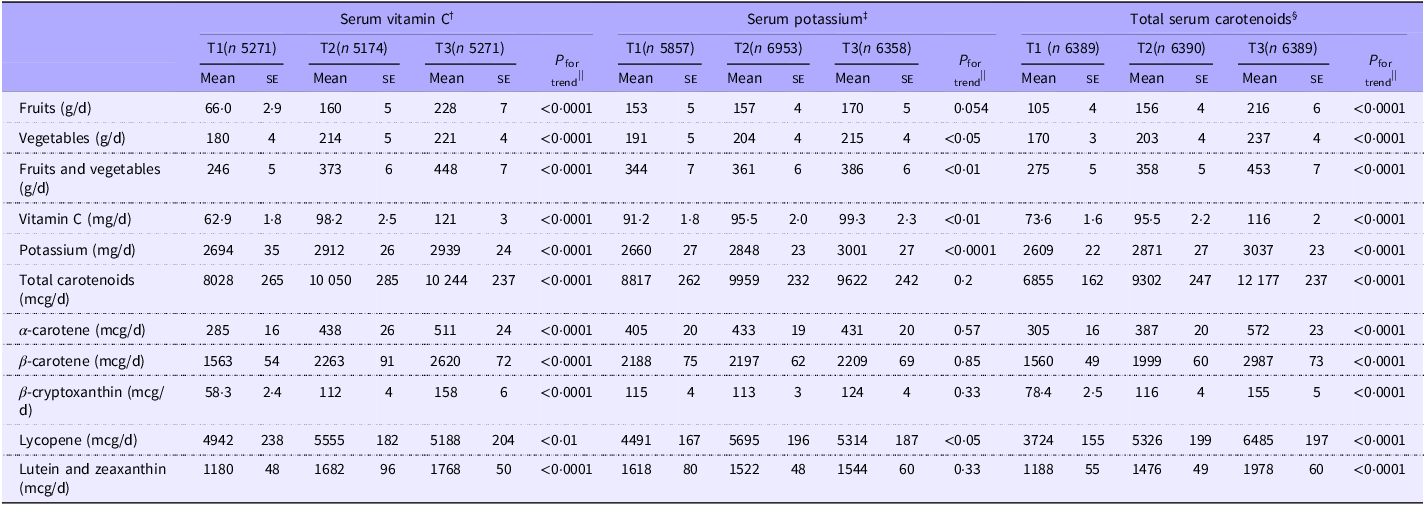
Averages of dietary intakes of fruits, vegetables, vitamin C, potassium and carotenoids across tertiles of serum concentrations of vitamin C, potassium and carotenoids are presented in Table 2. As serum concentrations of vitamin C and total carotenoids increased, dietary intakes of fruits, vegetables, vitamin C, potassium and total and individual carotenoids significantly increased (P for trend < 0·01 for all). However, as serum potassium concentrations increased, dietary intakes of vegetables, vitamin C, potassium and lycopene increased, but not fruits or other carotenoids.
Average intake of fruit, vegetable, vitamin C, potassium and carotenoids by tertiles of serum concentrations of vitamin C, potassium and total carotenoids among US adults aged ≥ 30 years participating in NHANES 1988–1994 and 2001–2006*

*Values are mean (se). Serum concentration ranges for each nutrient: †(0–268·0 µmol/l). ‡(2·5–6·2 mmol/l). §(0–15·0 µmol/l). ||Adjusted for age, gender and ethnicity.
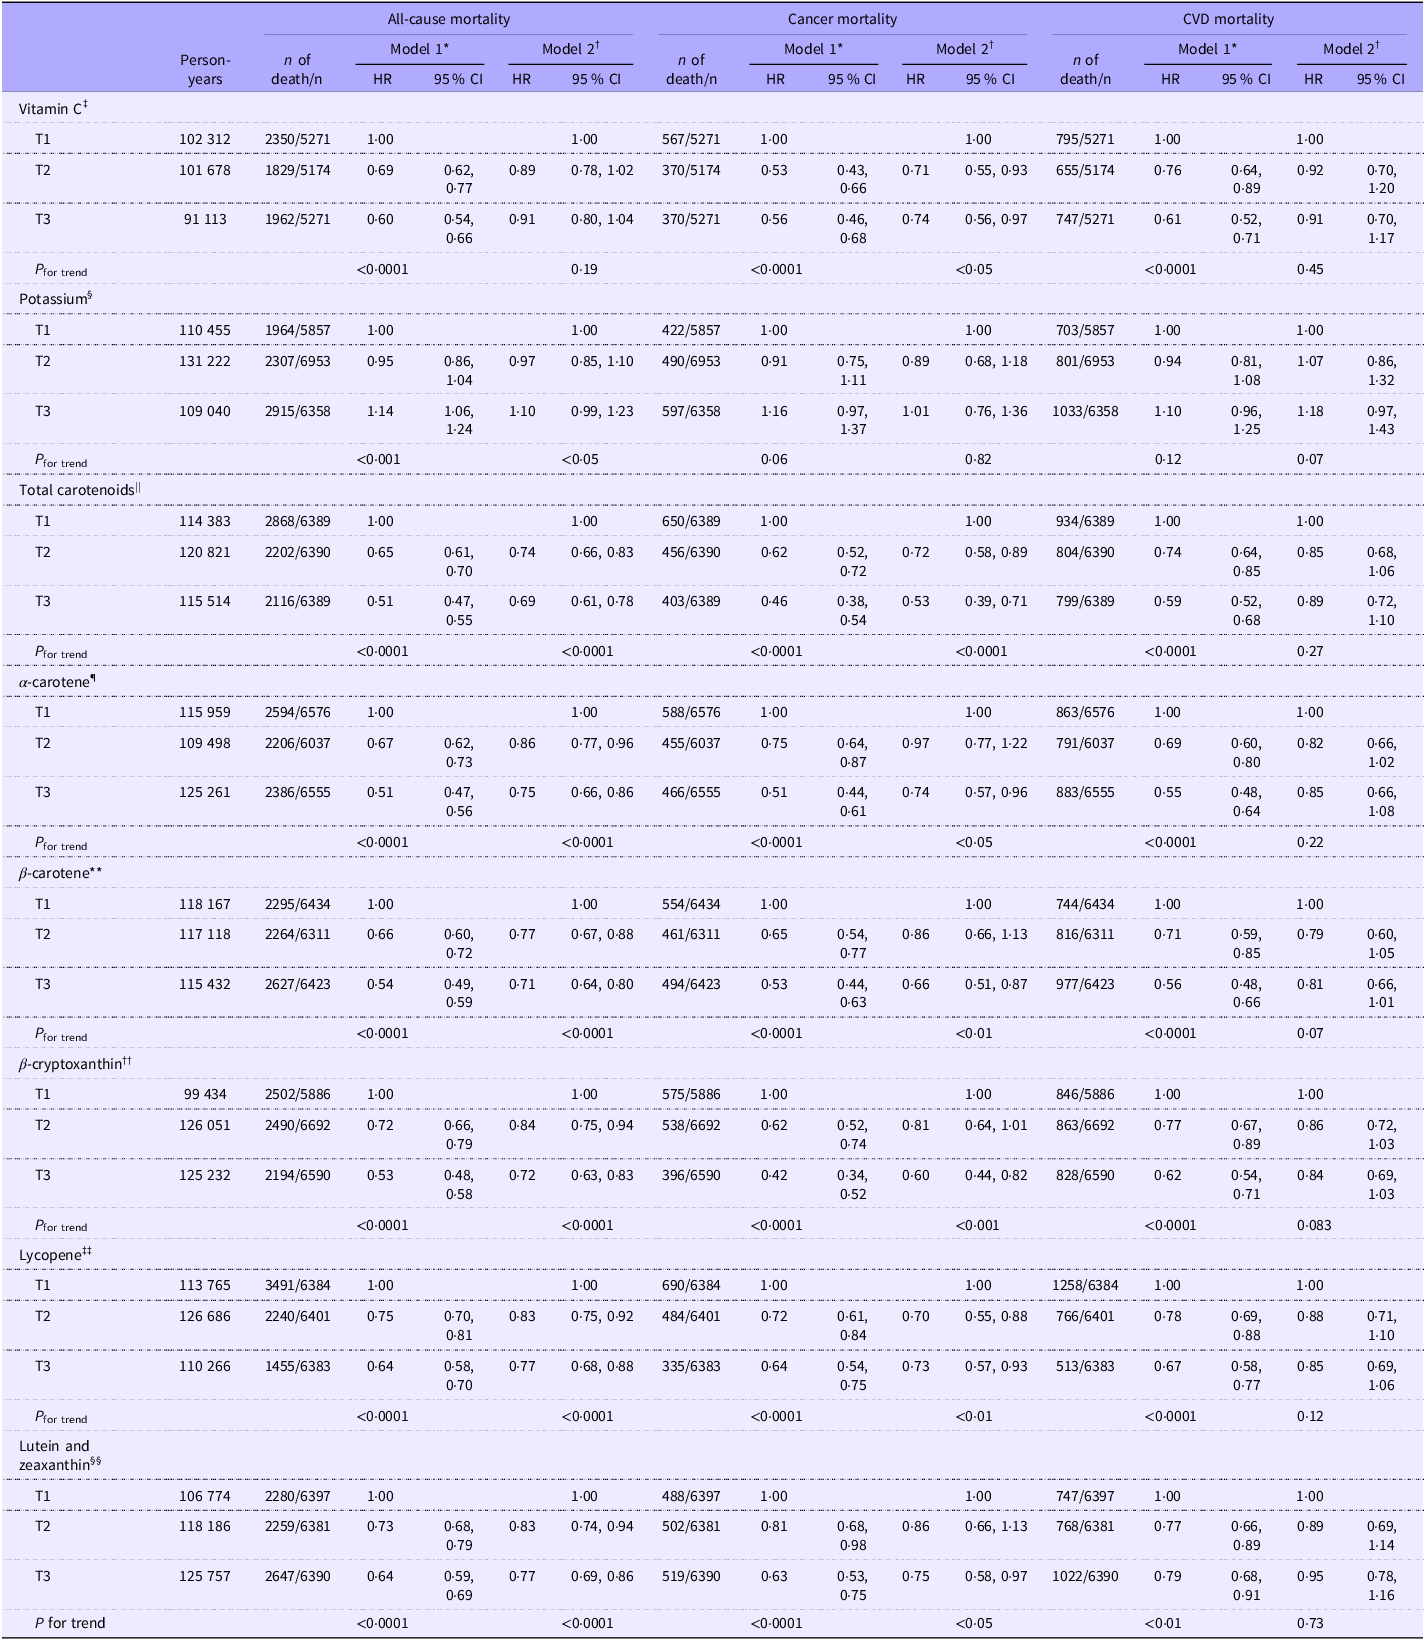
Hazard ratios and 95 % CI for all-cause, cancer and CVD mortality across tertiles of serum concentrations of vitamin C, potassium and total and individual carotenoids are presented in Table 3. All biomarker × period interaction tests were non-significant after adjustment for multiple comparisons; thus, pooled hazard ratios are presented as primary results. During a mean follow-up of 18·8 years, 7186 all-cause deaths, 1509 cancer deaths and 2537 CVD deaths were identified. In age, sex and ethnicity adjusted model (model 1), higher serum concentrations of vitamin C, total carotenoids, α-carotene, β-carotene, β-cryptoxanthin, lycopene and lutein and zeaxanthin were associated with all-cause, cancer and CVD mortality. After further adjustment for potential confounders in model 2, the inverse associations between serum concentrations of total carotenoids, α-carotene, β-carotene, β-cryptoxanthin, lycopene and lutein and zeaxanthin and all-cause and cancer mortality remained significant. The associations between serum concentrations of β-carotene and β-cryptoxanthin and CVD mortality also remained marginally significant. However, while the association between serum vitamin C and cancer mortality remained significant in model 2, the association between serum vitamin C and all-cause and CVD mortality was attenuated and no longer statistically significant. Conversely, while the association was no longer statistically significant in model 2, a higher serum potassium concentration showed an increasing trend with all-cause mortality.
Multivariable HRs and 95 % CI for all-cause, cancer and CVD mortality by tertiles of serum concentrations of vitamin C, potassium and total and individual carotenoids among US adults aged ≥ 30 years participating in NHANES 1988–2006

*Model 1: Adjusted for age, sex and ethnicity. †Model 2: Adjusted for age, sex, ethnicity, energy intake, BMI, PIR, diabetes, hypertension, alcohol consumption, saturated fatty acid intake, aspirin use, supplement use, CKD and history of CVD, excluding history of CVD for CVD death. Serum concentration ranges for each nutrient across tertiles: ‡T1(0–31·2), T2(31·2–55·6), T3(55·6–268·0) (µmol/l). §T1(2·5–3·9), T2(3·9–4·2), T3(4·2–6·2) (mmol/l). ||T1(0–1·1), T2(1·1–1·7), T3(1·7–15·0) (µmol/l). ¶T1(0–0·04), T2(0·04–0·09), T3(0·09–3·76) (µmol/l). **T1(0–0·2), T2(0·2–0·4), T3(0·4–12·6) (µmol/l). ††T1(0–0·1), T2(0·1–0·2), T3(0·2–2·7) (µmol/l). ‡‡T1(0–0·3), T2(0·3–0·6), T3(0·6–2·9) (µmol/l). §§T1(0–0·3), T2(0·3–0·4), T3(0·4–8·4) (µmol/l).
In a sensitivity analysis, additionally adjusting for 24-h intakes of fruit, vegetables, vitamin C, potassium, total dietary carotenoids and examination season, pooled hazard ratios changed only –1·5 % to +1·5 % for all-cause mortality, –3·6 % to +1·1 % for cancer mortality and –5·1 % to +1·2 % for CVD mortality (largest change for serum vitamin C), and all associations remained inverse and statistically significant. Multicollinearity diagnostics indicated no concerns (VIF ≤ 3·2; maximum condition index = 12·3), supporting retention of the pooled models as primary results.
When the associations between serum concentrations of vitamin C, potassium and carotenoids with all-cause mortality were stratified by follow-up period, no significant associations were observed in model 2 for the follow-up period of <5 years, except for β-carotene (online Supplementary Table 1). In the analysis using data from a follow-up period of 5 to less than 10 years, serum concentrations of total carotenoids and β-cryptoxanthin were associated with a reduced risk of all-cause mortality. Analyses of data from participants with follow-up periods of 15 years or more showed inverse associations between serum concentrations of total and individual carotenoids and all-cause mortality, while serum concentrations of vitamin C and potassium were not significantly associated with all-cause mortality.
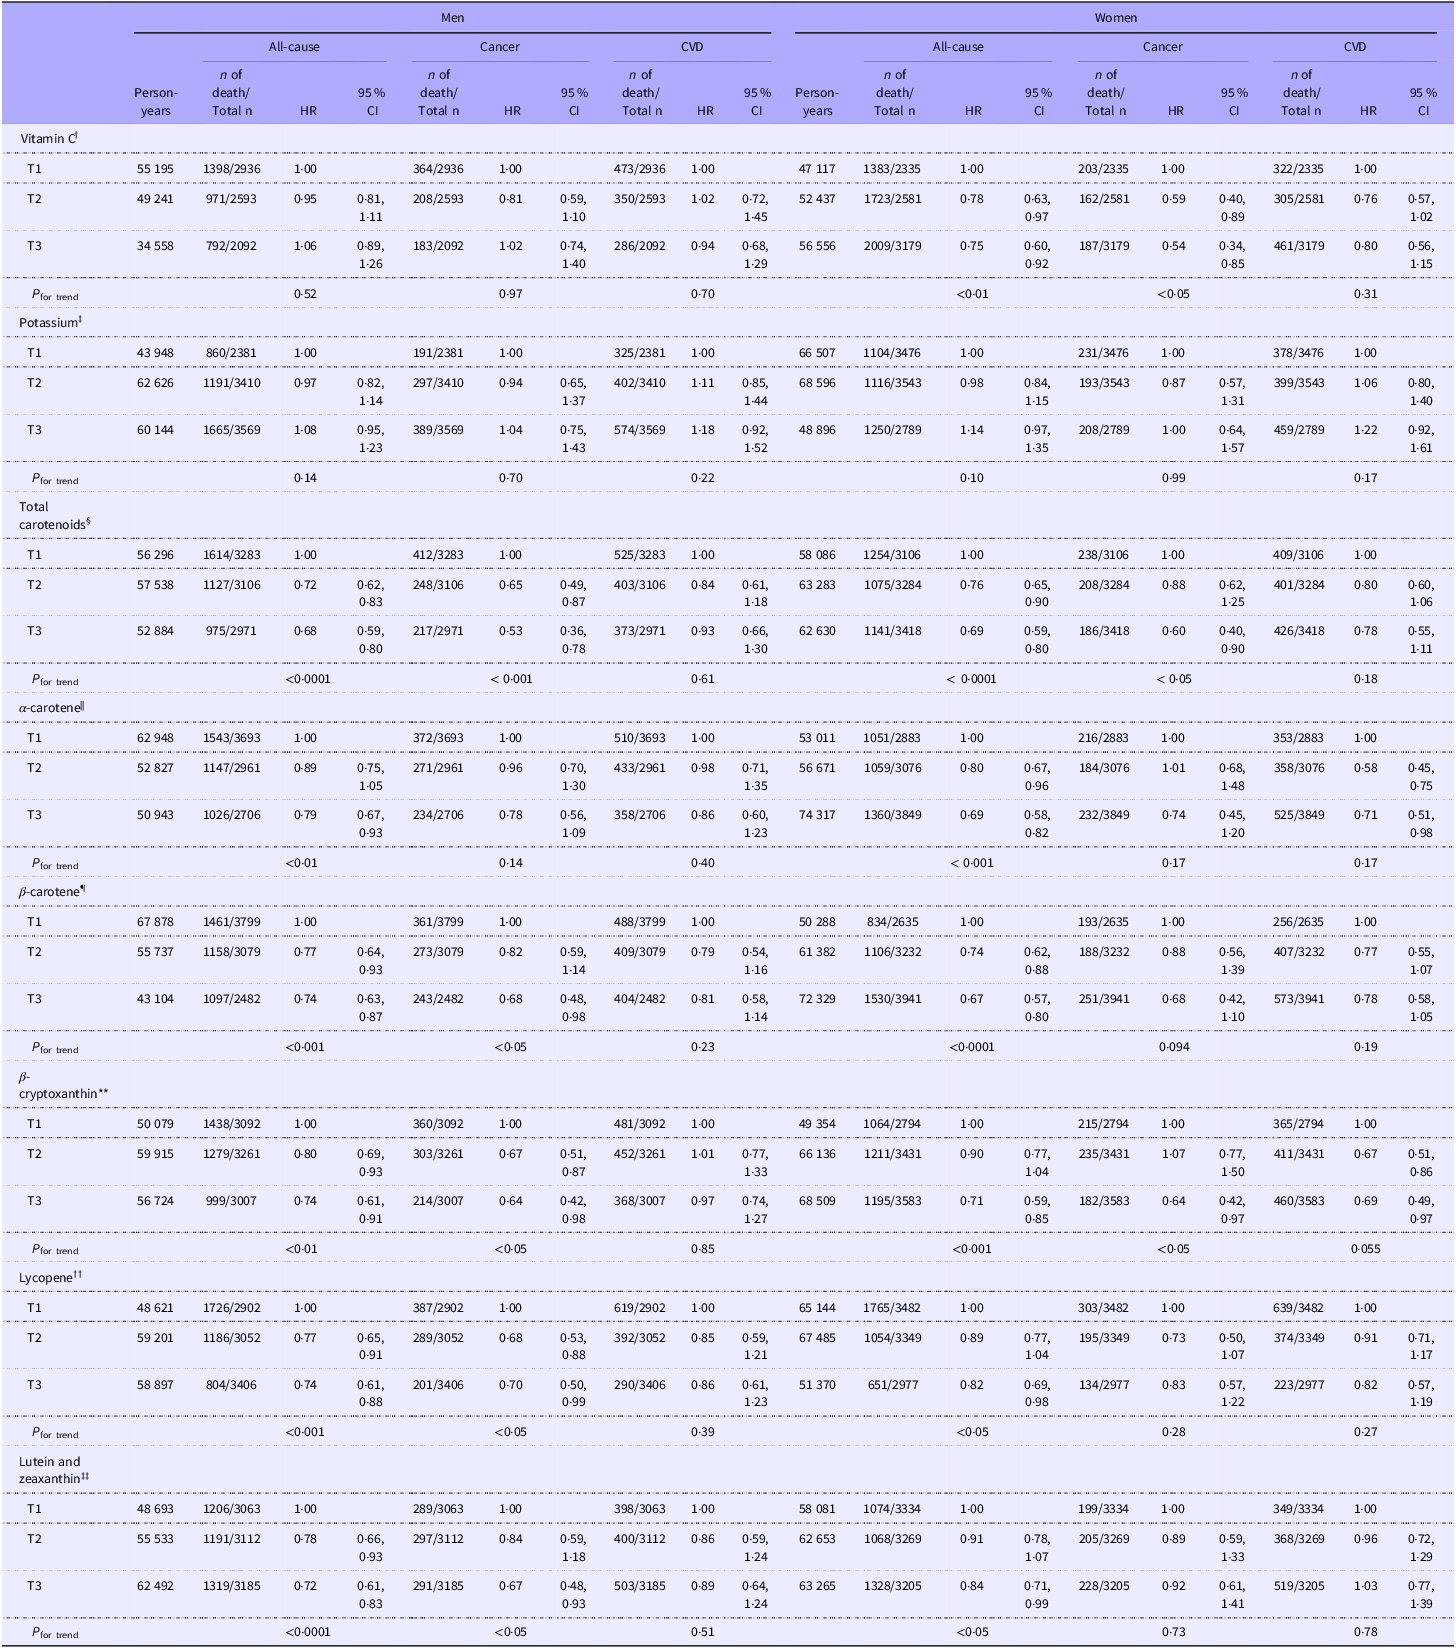
Table 4 shows the sex-stratified HR and 5 % CI for all-cause, cancer and CVD mortality across serum concentrations of potassium, vitamin C and carotenoids. In these analyses, inverse associations between serum vitamin C concentrations and all-cause and cancer mortality were observed only in women. The inverse associations between serum concentrations of lycopene and β-carotene with cancer mortality, as well as between lutein and zeaxanthin concentrations and cancer mortality, were observed only among men.
Sex-stratified multivariable HR and 95 % CI for all-cause, cancer and CVD mortality by tertiles of serum concentrations of vitamin C, potassium and total and individual carotenoids among US Adults aged ≥ 30 years participating in NHANES 1988–2006*

*HR and 95 % CI were adjusted for age, ethnicity, energy intake, BMI, PIR, diabetes, hypertension, alcohol consumption, saturated fatty acid intake, aspirin use, supplement use, CKD and history of CVD, excluding history of CVD for CVD death. Serum concentration ranges for each nutrient across tertiles: †T1(0–31·2), T2(31·2–55·6), T3(55·6–268·0) (µmol/l). ‡T1(2·5–3·9), T2(3·9–4·2), T3(4·2–6·2) (mmol/l). §T1(0–1·1), T2(1·1–1·7), T3(1·7–15·0) (µmol/l). ||T1(0–0·04), T2(0·04–0·09), T3(0·09–3·76) (µmol/l). ¶T1(0–0·2), T2(0·2–0·4), T3(0·4–12·6) (µmol/l). **T1(0–0·1), T2(0·1–0·2), T3(0·2–2·7) (µmol/l). ††T1(0–0·3), T2(0·3–0·6), T3(0·6–2·9) (µmol/l). ‡‡T1(0–0·3), T2(0·3–0·4), T3(0·4–8·4) (µmol/l).
The multivariable HR and 95 % CI for all-cause, cancer and CVD mortality across serum concentrations of potassium, vitamin C and carotenoids were further stratified by BMI (online Supplementary Table 2) and smoking status (online Supplementary Table 3). The BMI and smoking-adjusted results were mostly consistent with the overall analysis. Specifically, when stratified by BMI, the inverse associations between serum vitamin C concentration and all-cause and cancer mortality, as well as the inverse association between serum β-cryptoxanthin, lycopene and lutein and zeaxanthin concentration and cancer mortality, were more pronounced in individuals with a BMI ≥ 25 kg/m². In contrast, the inverse associations between serum β-carotene concentration and cancer mortality, as well as serum lycopene concentration and CVD mortality, were more prominent in individuals with a BMI < 25 kg/m². When stratified by smoking status, the inverse associations between serum α-carotene, β-carotene and lycopene concentrations and cancer mortality were particularly notable among non-smokers. While the inverse association between serum vitamin C concentration and cancer mortality was significant among current smokers, there was a trend suggesting an increased risk of CVD mortality with higher serum potassium levels, although this was not statistically significant.
Discussion
In this study, we aimed to examine the associations between serum concentrations of carotenoids, vitamin C and potassium, which are recognised as objective biomarkers of FV intake, and all-cause and cause-specific mortality, overcoming potential inaccuracies from self-reported dietary data. Before focusing on these associations, we first confirmed whether serum concentrations were significantly linked to actual dietary intakes of fruit, vegetables and nutrients. The analysis revealed that participants with higher serum concentrations of vitamin C and total carotenoids had significantly higher dietary intakes of fruits, vegetables, vitamin C, potassium and individual carotenoids compared with those with lower serum concentrations, which is consistent with previous findings(Reference Dehghan, Akhtar-Danesh and McMillan37–Reference Campbell, Gross and Martini39). Detailed US food sources for each carotenoid have been reported previously(Reference Kim, Madore and Chun40).
While some studies(Reference Aune, Keum and Giovannucci41) have reported that higher serum vitamin C levels are associated with reduced mortality, others(Reference Tian, Shao and Shen42) have found no significant association or have reported a U-shaped relationship, indicating an inconsistency. In our study, although the association between serum vitamin C and mortality was not significant in model 2 after adjusting for confounding factors, the subgroup analysis revealed that higher serum vitamin C levels were associated with a decrease in all-cause mortality and cancer mortality specifically among women. This disparity in findings between sexes may be a result of the greater overall mean of serum vitamin C among women participating in the NHANES cycles.
The results of this study indicated that although there were no clear significant differences between the highest and lowest serum potassium groups, there was a trend suggesting that higher serum potassium levels were associated with an increased risk of all-cause mortality. This finding was consistent with previous research(Reference Hughes-Austin, Rifkin and Beben43), which suggested that elevated serum potassium in CVD patients may increase the risk of cardiac arrhythmias, or that hyperkalaemia may occur in patients with impaired kidney function(Reference Hoppe, Muhlack and Koenig44). Additionally, elevated serum potassium may have contributed to inflammation and oxidative stress(Reference Udensi and Tchounwou45).
Higher serum total carotenoid concentrations were associated with reduced all-cause mortality and cancer mortality, consistent with the findings of Pu et al.(Reference Pu, Zhang and Wang46). This association remained significant across sexes, BMI categories and participant smoking status. Regarding individual carotenoids, higher serum concentrations of α-carotene, β-carotene, β-cryptoxanthin, lycopene and lutein and zeaxanthin were significantly associated with reduced all-cause mortality. This finding aligns with the results reported by Hu et al.(Reference Hu, Cai and Zhang47) among CKD patients, as well as with the findings of Zhang et al(Reference Zhang, Li and Zheng36). In the studies by Zhu et al.(Reference Zhu, Cheang and Tang34), who analysed hypertensive US adults from the NHANES III and NHANES 2001–2006, and by Lin et al.(Reference Lin, Liu and Li48), who focused on US adults with metabolic dysfunction-associated fatty liver disease from NHANES III, significant inverse associations were reported between serum α-carotene and lycopene and CVD mortality. However, in our study, no significant associations were found between serum α-carotene or lycopene and CVD mortality. These discrepancies could be attributed to differences in the study populations, the exclusion criteria applied and variations in the adjustment for confounding factors.
In the current study, α-carotene, β-carotene, β-cryptoxanthin, lycopene and lutein and zeaxanthin demonstrated a significantly inverse association with cancer mortality. These findings are consistent with previous research utilising NHANES III data(Reference Min and Min49). Serum β-carotene was significantly associated with reduced all-cause mortality, cancer mortality and CVD mortality(Reference Qiu, Chen and Geng50,Reference Ito, Suzuki and Yagyu51) . In the present study, higher levels of β-cryptoxanthin were significantly associated with reductions in all-cause mortality(Reference De Waart, Schouten and Stalenhoef35) and cancer mortality. The potential cancer-preventive effects of β-cryptoxanthin may be attributed to its ability to enhance DNA repair and provide antioxidant protection against cellular damage(Reference Lorenzo, Azqueta and Luna52). Serum lycopene exhibited an inverse association with all-cause and cancer mortality, which is consistent with previous research using NHANES data on US adults with metabolic syndrome(Reference Han, Meza and Soliman53), US adults with systemic lupus erythematosus(Reference Han and Han54) and Japanese individuals aged 39 years and older who participated in the annual Comprehensive Health Examination Program(Reference Ito, Suzuki and Suzuki55). The inverse association observed in this study between all-cause mortality and total carotenoids, α-carotene, β-carotene and lycopene is also in agreement with the results of Jayedi’s systematic review(Reference Jayedi, Rashidy-Pour and Parohan56).
Higher serum levels of lutein and zeaxanthin were significantly associated with reduced all-cause and cancer mortality, which is consistent with findings from previous studies(Reference Sato, Helzlsouer and Alberg57). While Goodman et al.(Reference Goodman, Schaffer and Omenn58) reported that these inverse relationships were more pronounced among women than men, in our study, significant associations were observed only among men, individuals who are obese and smokers. In our study, each of these groups had lower mean concentrations of serum lutein and zeaxanthin. Therefore, they may have been more likely to experience a reduced risk of all-cause and cancer mortality with increased intake. In comparison, groups with higher average intakes may have already surpassed a potential maximum concentration threshold for these benefits.
The stronger associations observed with longer follow-up periods may be attributed to an increase in the number of mortality events, improving statistical power and allowing for more robust findings. In shorter follow-up periods, the reduced number of deaths likely limited the ability to detect significant relationships. Additionally, single measurements of serum biomarkers reflect more short-term intake and are subject to regression dilution over time, which may have weakened associations. However, longer follow-up periods may also exacerbate the effects of regression dilution, as the baseline biomarker levels may become less reflective of an individual’s long-term exposure, potentially weakening the observed associations. This suggests that while longer follow-up periods can increase statistical power, they may also introduce greater potential for measurement variability and dilution effects, though further research is needed to confirm this possibility.
This study has several strengths. First, we used a large, nationally representative sample of the US adult population, allowing for the investigation of the relationship between serum concentrations of vitamin C, potassium, total and individual carotenoids and mortality across participants with varying lifestyle and socio-demographic characteristics. Second, our study included a large number of deaths and a long-term follow-up of 18·8 years. Third, we utilised serum concentrations of carotenoids and vitamin C, which are more objective biomarkers, to assess their relationship with mortality. However, this study has several limitations. First, in this analysis, only a single measurement of serum concentrations of vitamin C, potassium and carotenoids from both NHANES III and NHANES 2001–2006 was utilised, without repeated measurements over time. Second, there may be competing risks between CVD and cancer mortality that could influence the results. Third, despite our efforts to harmonise variables between the 1988–1994 and 2001–2006 datasets, there may be systematic errors associated with combining these two datasets. Fourth, this study utilised only one-day 24-h dietary recalls data for both NHANES III and NHANES 2001–2006 to maintain consistency, despite the availability of 2-day 24-h dietary recalls data in NHANES 2001–2006. Fifth, although FV are the major sources of carotenoids, vitamin C and potassium(Reference Kim, Madore and Chun40), these nutrients can also come from other dietary sources. Lastly, residual confounding factors may still exist in this analysis, even though we adjusted for a comprehensive set of relevant covariates available in the NHANES dataset. In particular, higher serum carotenoid concentrations may be correlated with other healthy behaviours, which could partially explain the observed associations despite multivariable adjustment.
Conclusion
In conclusion, this study highlights the significant associations between serum levels of key nutrients found in FV such as carotenoids and vitamin C with all-cause, cancer and cardiovascular mortality in a nationally representative sample of US adults. These findings underscore the potential importance of these biomarkers in understanding mortality risk and the need for further research to elucidate the underlying mechanisms and implications for public health.
Supplementary material
For supplementary material/s referred to in this article, please visit https://doi.org/10.1017/S000711452510531X
Acknowledgements
This research utilises data from the National Health and Nutrition Examination Survey (NHANES). We express our gratitude to all participants for providing their dietary information.
This research received no external funding.
The authors’ contributions are as follows: Conceptualization, K.K. and O.K.C.; Methodology, K.K. and S.A.; Formal analysis, K.K.; Writing—original draft, K.K.; Writing—review and editing, K.K., M.P.M., S.A., and O.K.C.; Supervision, O.K.C.
The authors declare no conflict of interest.


 Open access