

Today, over one billion adults are overweight with BMI between 25 and 30 kg/m2, and more than 300 million are obese, with BMI >30 kg/m2, worldwide( Reference Hill, Wyatt and Reed 1 ). Overweight and obesity are strongly associated with type 2 diabetes, hyperlipidaemia, atherosclerosis and CVD( Reference Ginsberg 2 , Reference van Hees, Saris and Dallinga-Thie 3 ). The increased availability of palatable food, i.e. foods rich in fat and sucrose, in Western society is hypothesised to play a significant role in this global increase of body weight and metabolic disease.
Recent data demonstrate that the gut microbiota may affect lipid metabolism and might therefore be important for the development of obesity and related diseases( Reference Kadooka, Sato and Imaizumi 4 , Reference Andrade and Borges 5 ). The microbiota can be viewed as a metabolic ‘organ’ exquisitely attuned to the host's physiology. One function of the microbiota is the ability to process otherwise indigestible components of the diet, such as plant polysaccharides, as well as taking part in nutrient acquisition and energy regulation( Reference Furtado 6 ). In recent years, it has been proposed that the composition of the gut microbiota differs between normal-weight, overweight and obese persons( Reference Bajzer and Seeley 7 ). Compositional changes of the microbiota have also been demonstrated to be associated with the development of diabetes( Reference Ley, Bäckhed and Turnbaugh 8 ), and for the regulation of fat storage via different gene expressions( Reference Bäckhed, Ding and Wang 9 ). In recent years, some studies have reported that lactobacilli and bifidobacteria may be important for body-weight regulation by acting as an anti-obesity factor( Reference Kadooka, Sato and Imaizumi 4 , Reference Andrade and Borges 5 , Reference Taranto, Medici and Perdigon 10 , Reference Luoto, Kalliomäki and Laitinen 11 ). Understanding changes in the microbiota, as well as their signalling pathways, provides an opportunity to identify new therapeutic targets for promoting health.
Thylakoids, isolated from the chloroplast membrane of green leaves, contain proteins, lipids and pigments (e.g. chlorophyll and carotenoids). They have been found to increase satiety, decrease hunger signals and promote weight loss in a number of studies, both in human subjects and in animals( Reference Köhnke, Lindbo and Larsson 12 – Reference Albertsson, Köhnke and Emek 15 ). The satiety-promoting effects induced by thylakoids were explained by their interaction with dietary lipids, prolonging the digestion of dietary fat( Reference Albertsson, Köhnke and Emek 15 ). Thylakoids have also been found to create a physical ‘barrier’ on the mucosal surface of the intestine in vitro, causing a decreased uptake of methyl-glucose and macronutrients over the intestinal wall( Reference Montelius, Gustafsson and Weström 16 ).
Since thylakoids interact with dietary products in the intestine, it is of interest to investigate whether thylakoids might affect the composition of microbiota that confers benefits upon host well-being and health in a prebiotic way of action. In the present study thylakoids from spinach leaves were given to rats for 10 d and the intestinal microbiota were investigated, mainly with respect to bacteria such as lactobacilli and bifidobacteria, as well as harmful bacteria such as Enterobacteriaceae and Bacteroides. The influence of thylakoids on food intake was recorded, and the effect on metabolism was investigated through an oral glucose tolerance test (OGTT). The long-term effects of thylakoid intake on insulin and glucose levels were also investigated.
Experimental methods
Animals and experimental procedures
The study was performed on rats (Rattus norvegicus) of the Sprague–Dawley strain (Mol: SPRD Han; Taconic M & B A/S), bred under specific pathogen-free conditions with a controlled environment (20 ± 1°C, 50 ± 10 % relative humidity, 12 h light–12 h dark cycle) and using an open cage system. After 7 d of acclimatisation, sixteen rats were kept individually and fed either a control diet (eight rats) or a thylakoid-enriched diet (eight rats) of 15 g to finish during the night for 10 d. Besides the experimental diet, all rats were given 25 g of standard rat chow, for free eating during the day. The experimental diet was composed of standard rat chow (R 36; Lantmännen) enriched with either only rapeseed oil (control diet) or a thylakoid–oil suspension (thylakoid diet). Thylakoid membranes were extracted and purified from fresh baby-spinach leaves as described before( Reference Emek, Szilagyi and Akerlund 14 , Reference Montelius, Gustafsson and Weström 16 ). The thylakoid diet was prepared by mixing 4 g thylakoid powder (corresponding to 132 mg chlorophyll), 5 g rapeseed oil and 10 g water by using an Ultraturax mixer. The amount of thylakoids supplemented was calculated by the addition of 6 mg chlorophyll per g of normal food intake (22 g food/rat per d). Both thylakoid and control diets were isoenergetic, and had the energy (E) distribution of 25E % carbohydrates, 60E % fat and 15E % proteins.
Normal rat chow was administered between 08.00 and 09.00 hours for free eating during the day. In the afternoon, between 16.00 and 18.00 hours, the remaining chow was removed and the consumption was recorded. The experimental diet of 15 g per rat was then administered, and in the next morning, any leftovers of the experimental diet were recorded. Body weight was measured every day during the 10-d experimental time. On the first and last days, faecal samples were collected under clean conditions in the morning and the consistency of the faecal samples appeared to be similar for both groups. An OGTT was performed on the last day; a 15 % glucose solution in a volume of 10 % of the body weight was given as a bolus dose by gastric tube feeding. Blood for analysing the glucose concentration was collected by puncturing the tail vein at time points 0, 15, 30, 45, 60, 90 and 120 min. The rat was then anaesthetised with isoflouran (Schering-Plogh a/s) and a laparotomy was performed. Tissue samples from the ileum, caecum and colon were collected, rinsed from loose materials with a cotton-compress and immediately placed in sterile tubes containing 3 ml freezing media and frozen at −80°C. Blood for analysing the insulin concentration was obtained by a cardiac puncture, before the rat was killed, into tubes prepared with EDTA and Aprotinin (Trasylol; Bayer AG), centrifuged at 3000 g (Multifuge 1 Sorvall and Heraeus, Kendro Laboratory Products International Sales) for 15 min at 4°C before the plasma was collected and immediately frozen at −80°C. The study was approved by the Lund University Ethical Review Committee for Animal Experiments and was conducted according to the European Community's regulations concerning the protection of experimental animals.
Analysis of blood glucose and plasma insulin
Glucose levels were directly determined in the vein blood by using a Bayer's BREEZE® blood glucose meter (Bayer, Diabetes Care). Insulin was analysed with a sandwich immunoassay technique using double monoclonal antibodies directed at different sites on an insulin molecule (Mercodia).
Analysis of faecal fat
The faecal samples were kept in closed glass tubes and left to dry at room temperature in a fume cupboard for 1 month. The dry material was then weighed, placed in a mortar and homogenised together with chloroform (AnalaR Normapur®; VWR International AB) for 5 min. The homogenised solution was transferred into a pre-weighed glass filter, and 100 ml of chloroform was slowly washed through the glass filter for 10 min. The glass filter, now containing the purified faecal components without fat, was dried overnight. The remaining material was weighed and the lost mass corresponds to the amount of fat that was present in the original faecal sample. The difference of fat content between day 0 and 10 was compared.
Analysis of bacterial counts
Conventional dilution procedures were used for the viable count of lactobacilli, bifidobacteria and Enterobactericeae in the mucosal samples from the ileum, caecum and colon, and in the faecal samples. Samples from appropriate dilutions were plated on Rogosa agar, modified Wilkins–Chalgren (MW) agar( Reference Osman, Adawi and Molin 17 , Reference Rada and Petr 18 ) and violet red bile glucose agar (Oxoid). The Rogosa and MW agars were incubated at 37°C for 72 h anaerobically and the glucose agar was incubated at 37°C for 24 h aerobically, before the colony-forming units per g of tissue or faeces were calculated.
16S rDNA sequencing
To confirm the results on the viable count of lactobacilli and bifidobacteria, 16S rDNA sequencing was performed from isolates picked from MW agar and Rogosa plates. In total, 169 isolates (four to six from each rat) from colon and ileum samples were randomly picked (fifty-two colon isolates from MW agar plates, fifty-three colon isolates and sixty-four ileum isolates from Rogosa plates). As a template for the PCR, crude cell extracts were used as described by Quednau et al.( Reference Quednau, Ahrné and Petersson 19 ). 16S rRNA genes were amplified by using the forward primer ENV1 and the reverse primer ENV2 (Table 1; Applied Biosystems). The PCR reaction mixture of total volume 25 μl contained 0·4 μm-ENV1, 0·2 μm-ENV2, 2·5 μl 10 × PCR reaction buffer (500 mm-Tris-HCl, 100 mm-KCl, 50 mm-(NH4)2SO4, 20 mm-MgCl2, pH 8·3), 0·2 μm-deoxyribonucleotide triphosphate, 2·5 units of FastStart Taq DNA polymerase (Roche Diagnostics) and 2 μl of template DNA. PCR was performed in an Eppendorf Mastercycler® 5333 using the following programme: 95°C for 3 min, 94°C for 3 min, thirty cycles of 94°C for 1 min, 50°C for 45 s and 72°C for 2 min, followed by an additional extension of 72°C for 7 min. PCRs containing only reagents without sample DNA were run in parallel as negative PCR controls. PCR products (2 μl) were verified on 1·5 % agarose gel, and the amplification products were placed in ninety-six-well plates for sequencing at MWG-Biotech. The generated sequences, with a read length of 500–526 bases, were compared with the GenBank database (National Center for Biotechnology Information). The sequence similarity was between 98 and 100 %.
Primers used in constructing standards of bacterial groups for quantitative PCR and for the amplification of 16S rRNA genes

F, forward; R, reverse.
DNA extraction of faeces and intestinal biopsies
Faecal and intestinal segments of ileum and colon were thawed and placed in an ultrasonic bath (Millipore) for 5 min, vortexed for 2 min and centrifuged at 12851 g (Eppendorf 5804R) for 10 min. The supernatant was discarded and 190 μl buffer G2 and 15 μl Proteinase K from the DNA Tissue Kit (Qiagen) were added to the intestinal samples. PBS (500 μl/ 50 mg) was added to the faecal samples before all samples were incubated at 56°C overnight in a shaking water bath. After centrifugation at 12851 g (Eppendorf 5804R) for 8 min, the solution was transferred to a Qiagen sample tube. Total DNA was extracted and eluted in 200 μl buffer using Biorobot EZ1 (Qiagen) according to the manufacturer's instructions.
Quantitative PCR analysis
Bacterial groups were estimated using separate quantitative PCR (qPCR) assays. Each assay reaction contained 10 μl QuantiTect®SYBR Green PCR Master Mix (Qiagen), 0·5 μm of each primer (Table 1), 2 μl of template DNA and RNase-free water to reach a final volume of 20 μl. Samples, standards and non-template controls were run as duplicates. Thermal cycling was carried out in Rotor-Gene Q (Qiagen) with a programme of 95°C for 15 min, followed by forty cycles with denaturation at 95°C for 15 s, annealing at 56–60°C for 30 s and elongation at 72°C for 30 s. The fluorescent products were detected at the last step of each cycle. Melting curve analysis was done to ensure specific amplification. Absolute abundance of 16S rRNA genes was calculated based on standard curves using Rotor-Gene Q series (Software 1.7; Qiagen). The detection limit was 102 copies per reaction for all assays. To construct standard curves, cloned products from Lactobacillus plantarum DSM9843, Bifidobacterium infantis DSM15159, Escherichia coli CCUG29300 and Bacteroides prevotella were used. One loop of the cell suspension (cloned products) was transferred to 10 ml of lysogeny broth medium with ampicillin and incubated overnight at 37°C. DNA extraction was performed by using QIAprep® (Miniprep kit; Qiagen). The concentration of DNA (ng/μl) was finally measured with Nanodrop ND-1000 (Saveen Werner AB), and used for copy number calculation. Tenfold dilution series of the DNA products were made in TE buffer (10 mm-Tris; 1 mm-EDTA; pH 8·0). The numbers of bacteria were expressed as the numbers of amplicon copies per g wet weight of faeces or tissue.
Terminal restriction fragment length polymorphism analysis
16S rRNA genes were amplified as described above with the exception that the forward primer ENV1 was fluorescently labelled with a fluorescent dye, FAM, at the 5′ end. Reactions were carried out in triplicate for each sample and a negative control was included in all PCR runs. PCR products were verified on 1·5 % agarose gel. PCR products of each sample were pooled and further purified by using the MinElute PCR purification Kit (Qiagen). DNA was finally eluted in 15 μl of washing buffer and DNA concentrations were measured with Nanodrop ND-1000 (Saveen Werner AB).
Terminal restriction fragment length polymorphism analysis
Aliquots (200 ng) of purified PCR products were digested at 37°C (Mastercycler® 5333; Eppendorf) with either the restriction endonuclease enzyme MspI for 5 h or AluI for 2 h (Fermentas). Inactivation was made by heating at 65°C for 20 min. After digestion, aliquots of the products were diluted four times with sterile water in a ninety-six-well plate. Samples were then sent to the DNA-lab (Skåne University Hospital, Malmö, Sweden) for terminal restriction fragment length polymorphism (T-RFLP) analysis in a capillary electrophoresis system. The data from the electrophoresis were analysed with GeneMapper® (version 4.0; Applied Biosystems) and the fragment sizes and peak areas were estimated using the Southern method (GeneMapper®). The size range was set from 30 to 600 bp. The peak amplitude threshold was set to fifty relative fluorescence units for samples and ten relative fluorescence units for the internal standard. The total peak area for each sample was calculated by summarising the area for all peaks in a sample. The individual relative peak area was expressed as percentage of the total area.
Calculations
The Shannon–Wiener index (H′) was calculated using relative peak area expressed as percentage of the total area for a sample by using the equation:
 $$\; H^{\prime}= - \sum pi\; {\rm ln}\; pi,$$
where pi is the relative area expressed as percentage and ln is the natural logarithm( Reference Magurran 25 ). Multivariate data analysis with principal component analysis (PCA) was performed in SIMCA-P+ (version 12.0.1; Umetrics) to reveal the possible differences in microbial population between the groups.
Statistics
Values are presented as means with their standard errors or as medians, ranges and 25th and 75th percentiles. The differences in glucose, insulin and counts of bacteria between the two experimental groups were assessed by a Mann–Whitney rank sum test using GraphPad Prism 4.0 (GraphPad Inc.). The difference in food intake, over the entire experimental period, was assessed by a two-way ANOVA analysis (GraphPad Prism 4.0). The incidences of different lactobacilli, bifidobacteria and other Gram-positive bacteria were evaluated by the Fisher exact test (Quick-Stat version 2.6). For all analyses, P ≤ 0·05 was considered significant.
Results
Food intake, body weight, faecal fat, blood glucose and plasma insulin
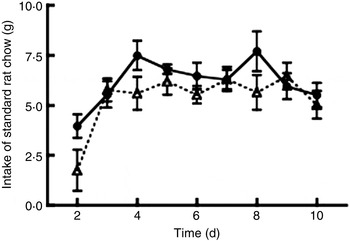
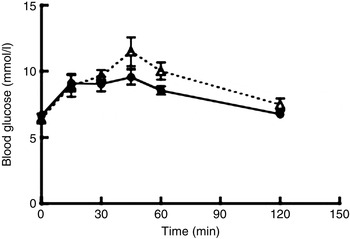
All rats finished the experimental diets during the night. The intake of standard rat chow, i.e. the free eating of standard chow after finishing 15 g of experimental diet, was significantly decreased in the thylakoid-fed rats compared with the control-fed rats (P = 0·003; Fig. 1). No difference in body weight between the groups was observed. The content of faecal fat was unchanged in either the thylakoid or the control group from day 0 to day 10. Plasma insulin concentration at 120 min after the OGTT was significantly lower (P = 0·008) for the thylakoid group compared with the control group (Fig. 2). No significant difference was found for blood glucose concentrations after the OGTT at any time point (Fig. 3).
Intake of standard rat chow during the 10 d experiment by animals fed a thylakoid-enriched diet (– –▵– –) or a control diet (––•––). Values are means, with standard errors represented by vertical bars. Intake was significantly reduced in the thylakoid-fed animals compared with control animals (P = 0·003).
Plasma concentration of insulin at 120 min after an oral glucose tolerance test in animals fed a thylakoid-enriched diet or a control diet for 10 d. Values are medians, with ranges represented by vertical bars, and 25th and 75th percentiles represented by the box. ** Median value was significantly lower than that of the control group (P = 0·0082).

Blood glucose levels at 0, 15, 30, 45, 60, 90 and 120 min after an oral glucose tolerance test in animals fed a thylakoid-enriched diet (– –▵– –) or a control diet (––•––) for 10 d. Values are means, with standard errors represented by vertical bars. Mean values of the control and thylakoid groups were not significantly different at any time.
Bacterial quantification and identification
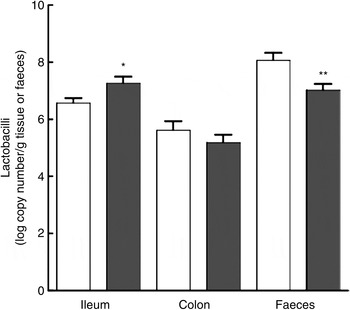
Lactobacilli were significantly increased in the ileal mucosa in the thylakoid group compared with the control group, as demonstrated both by viable count (P = 0·007; Fig. 4) and by qPCR (P = 0·032; Fig. 5). No difference was observed on the caecum or colonic mucosa. Moreover, a significant decrease of lactobacilli in the faecal samples of the thylakoid group was found with qPCR (P = 0·007; Fig. 5).
Viable count (colony-forming units (CFU)/g tissue) of lactobacilli on the mucosa of the ileum, caecum and colon and in the faeces of animals fed a thylakoid-enriched diet (■) or a control diet (□) for 10 d. Values are medians, with ranges represented by vertical bars, and 25th and 75th percentiles represented by the box. ** Median value was significantly higher compared with that of the control group (P = 0·007). No differences were seen in the caecum, colon and faeces.

Quantitative PCR analyses of lactobacilli on the ileum, colon mucosa and in the faeces (log number of amplicon copies/g wet weight) of animals fed a thylakoid-enriched diet (■) or a control diet (□) for 10 d. Values are means, with standard errors represented by vertical bars. * Mean value was significantly higher than that of the control group (P = 0·032). ** Mean value was significantly lower than that of the control group (P = 0·007). No difference was observed in the colon.
A significantly higher incidence of Lactobacillus reuteri (P = 0·03) and a lower incidence of Lactobacillus johnsonii (P = 0·003) were found on the ileal mucosa for the thylakoid group compared with the control group by 16S rDNA sequencing of isolates picked randomly from Rogosa agar plates (Table 2). In the colon mucosa, a significantly lower incidence of Lactobacillus johnsonii (P = 0·01) as well as a tendency for higher incidence of Lactobacillus reuteri (P = 0·09) were found for the thylakoid group compared with the control group (Table 2).
Incidence of different Lactobacillus spp. found by 16S rDNA sequencing of isolates picked randomly from Rogosa agar plates of ileal and colonic mucosal samples

Analyses of bifidobacteria, on the mucosa of the ileum and colon and in the faeces by qPCR, showed similar results for both groups (data not shown). In the thylakoid group, a significantly decreased viable count on MW agar (claimed to be selective for bifidobacteria) was found in the faeces (P = 0·0006), on the caecum (P = 0·010) and on the colon mucosa (P = 0·021), compared with the control group (Fig. 6). However, by 16S rDNA sequencing of isolates picked randomly from MW agar plates of both groups, it was shown that the bifidobacteria represented less than 25 % of these bacterial isolates. Due to insufficient selectivity of the traditional plating methods, the randomly picked bacteria from these plates were identified as Staphylococcus, Kocuria and Bacillus simplex (data not shown). Data from qPCR, sequencing and viable count indicate that bacteria that were decreased by thylakoids did not include bifidobacteria. Analyses of Enterobacteriaceae and Bacteroides resulted in no significant difference between the thylakoid and control groups.
Viable count (colony-forming units (CFU)/g tissue) of bacteria on modified Wikins–Chalgren (MW) media (claimed to be selective for bifidobacteria) on the mucosa of the ileum, caecum and colon and in the faeces of animals fed a thylakoid-enriched diet (■) or a control diet (□) for 10 d. Values are medians, with ranges represented by vertical bars, and 25th and 75th percentiles represented by the box. * Median value was significantly lower in the caecum (P = 0·0104) and colon (P = 0·0207) than that of the control group. *** Median value was significantly lower in the faeces (P = 0·0006) than that of the control group. No difference was observed in the ileum.

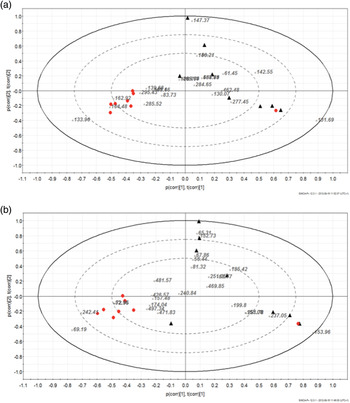
Analyses of the microbiota with T-RFLP and PCA on the ileal and colon mucosa with both MspI and AluI for DNA digestion did not show any difference between the thylakoid and control groups (data not shown). In the faecal sample, however, different microbial compositions were observed in the two groups with PCA, as well as a more homogeneous microbiota in the thylakoid group compared with the control group (Fig. 7(a) and (b)). No significant differences between the thylakoid and control groups were found for bacterial diversity after calculations by the Shannon–Wiener diversity index (data not shown).
Principal component analysis (PCA) of terminal restriction fragment length polymorphism (T-RFLP) data from (a) MspI and (b) AluI digestion of bacterial DNA of faecal samples in the control animal (▵) and thylakoid animal (•) groups. The microbiota in the faecal samples from the control and thylakoid animal groups are completely different from each other. (□), T-RFLP peaks (bacterial groups).
No significant differences between day 0 and day 10 were found in the faecal samples in either the thylakoid-fed or control-fed rats regarding Enterobacteriaceae and bifidobacteria.
Discussion
Addition of thylakoids to the diet for 10 d in the experimental rat model resulted in three main findings: the gut microbiota of the rat was modulated as lactobacilli were increased and supposedly harmful bacteria were reduced, the intake of food was decreased, and the insulin response after an OGTT was changed.
In the thylakoid group, an increased amount of ileal lactobacilli and a decreased amount of faecal lactobacilli were found, suggesting that thylakoids cause an increased ileal mucosal colonisation of lactobacilli. In fact, several studies have shown that specific strains of lactobacilli have the ability to colonise the intestinal mucosa in high numbers( Reference Servin and Coconnier 26 , Reference Johansson, Molin and Jeppsson 27 ). The identification of the lactobacilli by 16S rDNA sequencing showed that Lactobacillus reuteri was more pronounced in the ileal mucosa and, to a lesser extent, in colonic mucosa in the thylakoid group. Lactobacillus johnsonii was less pronounced in both ileal and colonic mucosa in the thylakoid group compared with the control group.
These novel findings demonstrate that small-intestinal mucosal microbiota can be affected by dietary supplementation, and specifically by the ingestion of thylakoid membranes. Recent studies have shown that Lactobacillus reuteri has health-promoting effects by restricting the growth of harmful bacteria( Reference Casas and Dobrogosz 28 – Reference Laughton, Devillard and Heinrichs 32 ). Therefore, it is of interest that thylakoids were found to decrease Gram-positive bacteria such as Staphylococcus spp., Kocuria and Bacillus simplex.
The mechanism behind the beneficial effect of thylakoids in relation to microbiota is not known and needs to be further studied. There are two possible explanations. One is that the thylakoids themselves influence the growth of the bacteria in the intestine directly at the molecular level. The other explanation is an indirect effect of thylakoids, whereby a reduction in appetite and food intake may affect bacterial composition in the intestine.
Lactobacilli have been regarded as anti-obesity factors( Reference Kadooka, Sato and Imaizumi 4 , Reference Andrade and Borges 5 , Reference Taranto, Medici and Perdigon 10 , Reference Luoto, Kalliomäki and Laitinen 11 ). Elimination of Gram-positive bacteria from the gut appears to be important for achieving energy balance, e.g. overweight children have an increased growth of Gram-positive bacteria such as Stapholycoccus aureus compared with normal-weight subjects( Reference Kalliomäki, Collado and Salminen 33 , Reference DiBaise, Zhang and Crowell 34 ). Moreover, the lactobacilli species Lactobacillus rhamnosus GG and Lactobacillus gasseri have been found to reduce adiposity and inflammation associated with obesity( Reference Kadooka, Sato and Imaizumi 4 , Reference Andrade and Borges 5 ).
The anti-obesity effect of thylakoids can now be described both as an effect on appetite and energy metabolism and from now onwards, in addition, as a potential modulator of the gut microbiota.
The second main finding of this study was that thylakoid supplementation to the diet for 10 d decreased the intake of standard rat chow. This supports earlier findings of a long-term study with mice given free access to thylakoid-incorporated mouse chow, which resulted in decreased food intake, body weight and percentage of body fat, compared with control-fed mice( Reference Köhnke, Lindqvist and Göransson 13 ). The present decreased intake of standard rat chow in the thylakoid group indicates an increased satiety after supplementation of thylakoids. It can be speculated that these results are due to the deviated microbiota, since several studies in both animals and human subjects have shown interactions between the microbiota and body weight( Reference Chang, Park and Jang 35 – Reference An, Park and Lee 37 ). Prebiotics, i.e. non-bacterial components that beneficially affect the host by stimulating growth and/or activity of the microbiota, have been found to affect food intake and several gut hormones regulating satiety and hunger( Reference Cani, Lecourt and Dewulf 38 – Reference Reimer and Russell 40 ). Since the supplementation of thylakoids has been found to give similar effects( Reference Köhnke, Lindbo and Larsson 12 – Reference Albertsson, Köhnke and Emek 15 , Reference Köhnke, Svensson and Piedra 41 ), they could be viewed as a prebiotic agent.
The third finding was a decreased insulin response after an OGTT at day 10 in the thylakoid group, while no difference in blood glucose levels was observed between the groups. Similar findings were reported in a short-term single-meal study in human subjects, where a reduced insulin response was found, although blood glucose levels were unchanged( Reference Köhnke, Lindbo and Larsson 12 ). The long-term effects of thylakoids decreasing insulin levels, presented here, have, however, never been shown before. A decreased passage of glucose during the experimental period of 10 d would theoretically result in a lower secretion of insulin, resulting in higher insulin sensitivity. It has previously been reported that thylakoids, in a dose-dependent way, decrease the in vitro uptake of methyl-glucose over the rat intestinal wall( Reference Montelius, Gustafsson and Weström 16 ). The reason for this decrease could be either an indirect cause of a steric hindrance formed by thylakoids binding to the mucosa of the intestine, or less likely, a direct cause of thylakoids binding to glucose molecules( Reference Montelius, Gustafsson and Weström 16 ). Also, the barrier of the intestine has been proposed to be important for preventing diabetes, where an increased permeability of the intestine might lead to insulin resistance( Reference de Kort, Keszthelyi and Masclee 42 ). The formation of an intestinal steric hindrance by thylakoids could thereby reinforce the intestinal wall. However, since the glucose uptake was the same in thylakoid-fed and control-fed animals, this explanation seems less likely.
Another explanation for the decreased insulin response could be the observed modulation of the microbiota. Recent studies have proposed that the microbiota modulate lipid and glucose homeostasis, by affecting the metabolism in the liver and adipose tissue( Reference Delzenne and Cani 43 ). Furthermore, the compositions of the microbiota have been found to affect the down- or up-regulation of gene expression, which may promote adiposity( Reference Bäckhed, Ding and Wang 9 ) or decrease insulin and blood glucose concentrations( Reference Kondo, Xiao and Satoh 44 ). Moreover, several strains of lactobacilli and bifidobacteria have been reported to have anti-diabetic effects, by preventing elevation of blood glucose and reducing insulin responses( Reference Kondo, Xiao and Satoh 44 – Reference Yadav, Jain and Sinha 47 ). The explanation for these effects, however, is mainly prevention of immune-mediated destruction of pancreatic β-cells. Thylakoids have, in a previous mouse experiment, been found to reduce insulin levels and adiposity( Reference Köhnke, Lindqvist and Göransson 13 ). This could hypothetically be a result of a changed microbiota, through interaction with the adipose tissue.
To conclude, the addition of thylakoids to the diet for 10 d affects the intestinal composition of the microbiota by increasing the ileal colonisation of lactobacilli. At the same time thylakoids were found to reduce food intake as well as insulin levels after an OGTT, without affecting glucose levels. The reduced insulin levels may be a consequence of the changed intestinal composition of the microbiota. More studies of the interaction of thylakoids with the microbiota, and the question whether thylakoids can be regarded as a prebiotic agent, remain to be investigated further.
Acknowledgements
The authors are grateful for the financial support from FORMAS, VINNOVA, the Carl Trygger Foundation, the Royal Physiographic Society of Lund, and the Swedish Medical Research Council, for the donation of spinach from SABA Fresh, and for the assistance rendered by Jie Xie in performing microbial analysis and by Linda Ahlkvist in performing the insulin analysis. Both C. M. and N. O. were equally responsible for planning the study, performing animal experiments and writing the paper. N. O. performed the microbial analysis. B. W. assisted in planning the study, in performing the experiments and in writing the paper. S. A. and G. M. assisted in performing the analyses. P.-Å. A. assisted in writing the paper. C. E.-A. assisted in planning the study and in writing the paper.
The authors have no conflict of interest.


 Open access