





Highlights
-
• Phonological and semantic similarities both sped up responses.
-
• Phonological similarity was dependent on language early in the time course.
-
• Semantic similarity facilitated processing similarly in L1 and L2.
-
• Cognate word frequency slowed responses late in time in L1 and L2.
-
• L2 proficiency sped responses but did not modulate cross-linguistic influence.
Quick and efficient word recognition is central to effective communication. For bi- and multilinguals, this requires recognizing an even greater number of words than for monolinguals. A plethora of evidence has established that the words a person knows are stored together in a single mental lexicon. Words are processed together, non-selectively, and the knowledge of another language can affect how words in just one are understood, even when it is not needed to complete the task. This cross-linguistic influence (hereafter, CLI) can help (e.g., speed) or hinder (e.g., slow) recognition depending on the requirements of the task. Here, CLI refers to the observable consequences of non-selective lexical activation during word recognition – that is, the influence of the non-target language on processing even when only the target language is required. Importantly, CLI is influenced by factors such as the degree of overlap across languages, the context in which it occurs, a bilingual’s proficiency, the language tested, and the point in time at which it is measured. While CLI has been observed in both visual and auditory word recognition, far more evidence comes from the visual domain, leaving several unanswered questions about how CLI affects spoken word processing.
The present study investigates patterns of CLI in spoken word recognition in a seemingly unlikely context. Specifically, unbalanced, different-script (i.e., Japanese–English) bilinguals living in a primarily Japanese-language environment are presented with unprimed words varying in degree of cross-linguistic overlap, and the time course of activation is examined. Individuals are tested in both L1 and L2 to make a direct comparison across languages and to determine whether CLI influences recognition in L1 as it typically does in L2.
1. Background
In bilingual processing, one of the most frequently examined word types when looking for CLI is cognates, or words that share form and meaning, such as restaurant and the Spanish restaurante. Bilinguals usually read cognates faster in sentences (Cop et al., Reference Cop, Dirix, van Assche and Drieghe2017; Duyck et al., Reference Duyck, van Assche, Drieghe and Hartsuiker2007; Libben & Titone, Reference Libben and Titone2009; Schwartz & Kroll, Reference Schwartz and Kroll2006), respond to them faster in lexical decision (Dijkstra et al., Reference Dijkstra, Grainger and van Heuven1999; Dijkstra et al., Reference Dijkstra, Miwa, Brummelhuis, Sappelli and Baayen2010; Lemhöfer & Dijkstra, Reference Lemhöfer and Dijkstra2004; Poort & Rodd, Reference Poort and Rodd2017), and speak them faster in picture and word naming (e.g., Costa et al., Reference Costa, Caramazza and Sebastian-Galles2000; Schwartz et al., Reference Schwartz, Kroll and Diaz2007) compared to non-cognate translation equivalents. The cognate effect is taken as evidence of the non-selectivity of the mental lexicon. If bilinguals are faster or more accurate at recognizing cognates compared to non-cognates, then knowledge of the other language is understood to contribute to the recognition process.
Importantly, however, these effects are not always symmetrical across languages. The cognate effect and other forms of CLI are more robust in L2 compared to L1 (Jared & Kroll, Reference Jared and Kroll2001; Jared & Szucs, Reference Jared and Szucs2002; Van Assche et al., Reference van Assche, Brysbaert, Duyck, Heredia and Cieślicka2019; Weber & Cutler, Reference Weber and Cutler2004), and the size of effects is often larger in the L1-L2 direction as well (Costa et al., Reference Costa, Caramazza and Sebastian-Galles2000; Gollan et al., Reference Gollan, Forster and Frost1997; Jiang, Reference Jiang2019; Poarch & Van Hell, Reference Poarch and van Hell2012). It is important to note that a major contributor to this so-called asymmetry may be that bilinguals tested are most often unbalanced (Van Hell & Tanner, Reference van Hell and Tanner2012). In other words, it is not the L1/L2 status itself, but the bilinguals’ higher proficiency in L1 that is responsible for this difference. While many earlier studies simply divided bilinguals into low- and high-proficient groups or simply compared monolinguals with bilinguals (e.g., Dimitropoulou et al., Reference Dimitropoulou, Duñabeitia and Carreiras2011; Weber & Cutler, Reference Weber and Cutler2004), more recent investigations have included proficiency as a continuous predictor variable (e.g., Bultena et al., Reference Bultena, Dijkstra and van Hell2014; Miwa et al., Reference Miwa, Dijkstra, Bolger and Baayen2014). Doing so may provide a clearer picture of CLI – including any present in L1 – than grouping participants into overly simple categories.
This does not mean that CLI does not occur in L1; assuming sufficient L2 proficiency, it can be observed in L1 as well (e.g., Kroll & Stewart, Reference Kroll and Stewart1994; Van Hell & Dijkstra, Reference van Hell and Dijkstra2002). Indeed, such effects have been observed in both visual (Costa et al., Reference Costa, Caramazza and Sebastian-Galles2000; Poarch & Van Hell, Reference Poarch and van Hell2012; van Hell & Dijkstra, Reference van Hell and Dijkstra2002; Van Wijnendaele & Brysbaert, Reference van Wijnendaele and Brysbaert2002) and auditory experiments (Dijkstra et al., Reference Dijkstra, Timmermans and Schriefers2000; Lagrou et al., Reference Lagrou, Hartsuiker and Duyck2011; Mishra & Singh, Reference Mishra and Singh2014, Reference Mishra and Singh2016). The L2 is typically examined alone, without regard to L1 performance, but the bilingual mental lexicon is a dynamic system. Instead of writing off such effects as context-specific or non-existent, Van Assche et al. (Reference van Assche, Brysbaert, Duyck, Heredia and Cieślicka2019) point out that researchers may in fact observe valid CLI in L1 if they conduct “careful and powerful” experiments.
An important factor in CLI is the degree of overlap between languages. Cognates that are more similar show evidence of greater co-activation, for example (Dijkstra et al., Reference Dijkstra, Grainger and van Heuven1999, Reference Dijkstra, Miwa, Brummelhuis, Sappelli and Baayen2010; Duyck et al., Reference Duyck, van Assche, Drieghe and Hartsuiker2007; Lemhöfer et al., Reference Lemhöfer, Dijkstra and Michel2004; Lemhöfer & Dijkstra, Reference Lemhöfer and Dijkstra2004; Van Assche et al., Reference van Assche, Duyck, Hartsuiker and Diependaele2009, Reference van Assche, Drieghe, Duyck, Welvaert and Hartsuiker2011). In contrast to earlier studies simply comparing cognates with homophones, Dijkstra et al. (Reference Dijkstra, Grainger and van Heuven1999) tested Dutch-English bilinguals in both lexical decision and progressive demasking tasks, systematically varying orthographic, phonological, and semantic similarities across items. They found different effects of phonological and semantic similarities across tasks, showing that CLI depends on the joint effects of these three factors. Further, cognate effects tend to be additive; three-language cognates, for instance, are processed even faster than those shared by just two, although the degree of facilitation can vary across tasks and lexical characteristics (Foryś-Nogala et al., Reference Foryś-Nogala, Silva, Ambroziak and Otwinowska-Kasztelanic2025; Lemhöfer et al., Reference Lemhöfer, Dijkstra and Michel2004; Otwinowska, Reference Otwinowska2024; Van Hell & Dijkstra, Reference van Hell and Dijkstra2002). While most evidence comes from relatively similar language pairs, these factors raise the question of how such effects may differ in languages that do not share orthographic script, such as Spanish and Korean or Japanese and English. In these languages, cognates are relatively dissimilar as they share only meaning and phonological form. Japanese and English, for example, differ across several typological dimensions relevant to lexical processing. English is largely isolating, with relatively fixed SVO word order and limited inflectional morphology, whereas Japanese is agglutinative, head-final (i.e., SOV), and employs extensive suffixation and overt topic marking. The two languages also differ substantially in phonological structure (e.g., syllable structure constraints, moraic timing in Japanese) and use entirely distinct writing systems (alphabetic vs. kana/kanji). As a result, Japanese–English cognates share no orthographic overlap and comparatively little phonological overlap relative to most same-script language pairs, providing a stringent test case for models that assume non-selective lexical activation.
Beyond structural overlap, the presence, magnitude, and direction of CLI can also differ depending on the point in time during processing at which it is measured, an idea which has been observed in both reading (Miwa et al., Reference Miwa, Dijkstra, Bolger and Baayen2014; Taylor & Mukai, Reference Taylor and Mukai2023) and listening (Marian et al., Reference Marian, Blumenfeld and Boukrina2008; Weber & Cutler, Reference Weber and Cutler2004). Cross-linguistic phonological similarity, for example, facilitated recognition early in time but slowed it later on in a visual study by Miwa et al. (Reference Miwa, Dijkstra, Bolger and Baayen2014), echoing findings from spoken word recognition (Marian et al., Reference Marian, Blumenfeld and Boukrina2008). An examination of not just the overall outcome but also the time course of processing is important to understand how activation occurs in the mind. Masked priming (Forster & Davis, Reference Forster and Davis1984) has been a popular method for examining the time course of single word reading, and interestingly, eye movements have more recently been employed for this purpose as well (Kuperman et al., Reference Kuperman, Schreuder, Bertram and Baayen2009; Miwa et al., Reference Miwa, Dijkstra, Bolger and Baayen2014; Taylor & Mukai, Reference Taylor and Mukai2023). With spoken words, examining the time course can be more challenging. Priming and the visual world paradigm have both been used to do so, but findings from these methods must be interpreted with caution (Forster, Reference Forster1998; Huettig et al., Reference Huettig, Rommers and Meyer2011; Zhang et al., Reference Zhang, Fairchild and Li2017). As both involve presentation of a non-target competitor or other information just before or during processing, more naturalistic data are needed to verify whether CLI is present even when competitors are not purposefully activated.
Context also plays an important role in how words are recognized. Words embedded in sentences (Binder & Rayner, Reference Binder and Rayner1998; Chambers & Cooke, Reference Chambers and Cooke2009; Duyck et al., Reference Duyck, van Assche, Drieghe and Hartsuiker2007; Lagrou et al., Reference Lagrou, Hartsuiker and Duyck2013) and texts (Cop et al., Reference Cop, Dirix, van Assche and Drieghe2017) are processed under the influence of semantic, syntactic, and discourse constraints, which shape lexical activation and further facilitate or inhibit recognition compared to isolated words. Global language context (Elston-Güttler et al., Reference Elston-Güttler, Gunter and Kotz2005), stimulus list composition (Brenders et al., Reference Brenders, Van Hell and Dijkstra2011), and the social environment in which an individual lives (e.g., Schwartz & Kroll, Reference Schwartz and Kroll2006) can all also modulate levels of non-target activation, often reducing, but importantly, not eliminating its effects. The present study examines CLI under minimal contextual constraint, using isolated spoken words without priming or sentence context.
2. The need for integrated models of bilingual word recognition
Taken together, the above findings have motivated formal models of word recognition. Overall, there is strong evidence that the mind stores knowledge of and processes different languages together, a concept deeply integrated into popular bilingual word recognition models such as BIMOLA (Grosjean, Reference Grosjean, de Groot and Kroll1997; Léwy & Grosjean, Reference Léwy, Grosjean and Grosjean2008), BLINCS (Shook & Marian, Reference Shook and Marian2013), BIA+ (Dijkstra & Van Heuven, Reference Dijkstra and van Heuven2002), and the more recent Multilink (Dijkstra et al., Reference Dijkstra, Wahl, Buytenhuijs, van Halem, Al-Jibouri, De Korte and Rekké2019). None of these models, however, explicitly predicts recognition in both reading and listening. This is despite considerable overlap in not only the type of information processed (Ferrand et al., Reference Ferrand, Méot, Spinelli, New, Pallier, Bonin, Dufau, Mathôt and Grainger2018; Müller et al., Reference Müller, ten Bosch and Ernestus2024; Tanenhaus et al., Reference Tanenhaus, Flanigan and Seidenberg1980) but also the brain areas used in understanding the two modalities (Chee et al., Reference Chee, O’Craven, Bergida, Rosen and Savoy1999).
The BIA+ has been widely used to understand visual word recognition and can also be readily applied to auditory processing. According to this account, non-target representations, including those from another language known to an individual, can become co-activated when they share information with a word being processed. Specifically, overlapping orthographic, phonological, and semantic representations lead to co-activation, and the more information is shared, the more becomes co-activated. While the model was developed on evidence from same-script languages (such as Dutch and English), it has successfully predicted visual word recognition with different-script languages (e.g., Miwa et al., Reference Miwa, Dijkstra, Bolger and Baayen2014; Taylor & Mukai, Reference Taylor and Mukai2023), a key population for psycholinguistic models (Mishra, Reference Mishra2019). See Figure 1 for a representation of this model for bilinguals in this study.
Visualization of the BIA+ Model for auditory word recognition. Note. Adapted for auditory recognition from Taylor and Mukai’s (Reference Taylor and Mukai2023) representation of the BIA+ model (Dijkstra & Van Heuven, Reference Dijkstra and van Heuven2002) for Japanese–English bilinguals.

Figure 1. Long description
The flowchart is organized into three vertical levels and two horizontal columns.
At the bottom center, an Auditory signal represented by a waveform points upward to the Sublexical phonology box. This box contains phonetic symbols in circles, such as forward slash r forward slash, forward slash o forward slash, and forward slash p forward slash. To its left is the Sublexical orthography box, containing Japanese katakana characters and English letters in circles. A double-headed horizontal arrow connects these two sublexical boxes.
The middle level contains Lexical orthography on the left and Lexical phonology on the right, connected by a double-headed horizontal arrow. The Lexical orthography box contains the Japanese word for program and the English word program. The Lexical phonology box contains the phonetic transcriptions forward slash puroguramu forward slash and forward slash p r o u g r ae m forward slash. Vertical double-headed arrows connect these lexical boxes to their respective sublexical boxes below.
At the top, Semantic information is on the left, containing various shaded circles. On the right is Language membership, containing circles labeled L 1 and L 2.
Complex interactions are shown via double-headed arrows:
- Lexical orthography points to Semantic information and Language membership.
- Lexical phonology points to Semantic information and Language membership.
- Semantic information and Language membership are also interconnected with the lexical layers through diagonal crossing arrows.
The BIA+ easily accounts for the discrepancies in CLI mentioned above. For example, in the case of unbalanced bilinguals, the BIA+ model’s temporal delay assumption supposes that the dominant or more frequently used language (i.e., L1) becomes activated more quickly than L2 due to a higher resting activation level. In other words, it takes less input to reach its activation threshold. This difference can explain the asymmetry observed in cross-linguistic effects between L1 and L2. Additive information leads to increased co-activation, resulting in greater CLI for more similar words or languages. Discrepancies in CLI at different processing stages can also be explained by sequential activation of representations in this model: orthographic information becomes activated first, followed by phonological and semantic representations. As a result, orthographic or phonological overlap may drive early co-activation, while semantic similarity may contribute to later effects. The model also includes separate recognition and task/decision subsystems, so although initial activation based on input is bottom-up, a bilingual can adjust their response based on task requirements, accounting for variations across tasks and contexts.
3. Cross-linguistic influence in spoken word recognition
Mirroring visual word recognition, the primary factors affecting spoken word processing are related to the target stimulus itself. Longer words and those with many phonological neighbors typically take longer to recognize (Goh et al., Reference Goh, Yap and Chee2020; Luce & Pisoni, Reference Luce and Pisoni1998; Ziegler et al., Reference Ziegler, Muneaux and Grainger2003), as do less frequent words (Goh et al., Reference Goh, Yap, Lau, Ng and Tan2016). As in reading, evidence for language non-selective activation is pervasive (Blumenfeld & Marian, Reference Blumenfeld and Marian2007; Lagrou et al., Reference Lagrou, Hartsuiker and Duyck2011; Marian et al., Reference Marian, Blumenfeld and Boukrina2008; Marian & Spivey, Reference Marian and Spivey2003; Weber & Cutler, Reference Weber and Cutler2004). While orthographic co-activation cannot directly occur at the earliest stages of auditory word recognition, parallel activation can occur via shared phonological or semantic information, or even as a result of activation spreading to the orthographic representations from phonological input (see, for example, Qu & Damian, Reference Qu and Damian2017; Türk & Domahs, Reference Türk and Domahs2022; Veivo et al., Reference Veivo, Järvikivi, Porretta and Hyönä2016).
Phonological overlap effects have been observed repeatedly in the auditory modality. For instance, using the visual world paradigm, Weber and Cutler (Reference Weber and Cutler2004) observed that Dutch-English bilinguals listening to English words looked longer at pictures whose Dutch names contained sounds similar to those in the English words they heard, indicating cross-linguistic phonological activation. This effect did not occur, however, when the task was conducted in Dutch (L1). By contrast, Spivey and Marian (Reference Spivey and Marian1999) found similar effects in the L1. Instructing Russian-English bilinguals in their L1 to pick up an item (e.g., Podnimi marku (“Pick up the stamp”)), they noticed that bilinguals looked more often to distractor pictures whose English (L2) name began with a similar sound (e.g., marker) than to unrelated distractors. With Hindi-English bilinguals, Mishra and Singh (Reference Mishra and Singh2014, Reference Mishra and Singh2016) observed similar phonological co-activation in both L1 and L2, with bilinguals looking more often towards phonological cohort members, that is, words that share initial phonemes with the target. These studies provide evidence that non-target phonological activation can affect listening.
In contrast to phonological overlap, the role of semantic information is less often investigated in spoken word recognition. Various semantic influences have been observed with monolinguals, however (e.g., Goh et al., Reference Goh, Yap, Lau, Ng and Tan2016; Wurm et al., Reference Wurm, Vakoch and Seaman2004), and again the effects vary by task (Goh et al., Reference Goh, Yap, Lau, Ng and Tan2016). Bilingual-specific semantic influences are not typically investigated with behavioral studies of listening, but an fMRI experiment by Chee et al. (Reference Chee, O’Craven, Bergida, Rosen and Savoy1999) observed similar brain areas active during semantic processing in both modalities. Therefore, it is very possible that semantic effects found in bilingual reading (Gollan et al., Reference Gollan, Forster and Frost1997; Kim & Davis, Reference Kim and Davis2003; Miwa et al., Reference Miwa, Dijkstra, Bolger and Baayen2014; Nakayama et al., Reference Nakayama, Sears, Hino and Lupker2012; Taylor & Mukai, Reference Taylor and Mukai2023) also affect listening beyond commonly examined word-level variables.
Unprimed L2 word reading studies by Dijkstra et al. (Reference Dijkstra, Miwa, Brummelhuis, Sappelli and Baayen2010) and Miwa et al. (Reference Miwa, Dijkstra, Bolger and Baayen2014) found that semantic similarity influenced recognition above and beyond phonological influences. Taylor and Mukai (Reference Taylor and Mukai2023) extended these findings to L1, finding similar effects in unbalanced Japanese–English (i.e., different-script) bilinguals in Japan, a context and population where CLI may be unexpected given the infrequent use of the L2 and relative distance between the languages. Whether such effects arise in listening, as they do in reading, for this population remains unclear. While the BIA+ suggests it is possible, most auditory studies focus primarily on phonological similarity, classifying meaning as a categorical variable (e.g., congruent vs. incongruent). Phonological and semantic overlap may be somewhat confounded in studies that do not model these two continuous variables separately. If, as the BIA+ model suggests, similar mechanisms underlie visual and auditory word processing, both types of overlap need to be examined separately in spoken word studies.
Echoing behavioral findings, ERP studies (e.g., Bobb et al., Reference Bobb, Von Holzen, Mayor, Mani and Carreiras2020) have, in fact, found L2 semantic influences in L1 word recognition, albeit with same-script bilinguals. It is possible that in the present unlikely context – unbalanced, different-script bilinguals living in an L1 environment and tested in the L1 without using priming or visual world cues, CLI could occur in listening just as it did in the reading study by Taylor and Mukai.
4. Objectives of the current study
The present study examines spoken word recognition in both L1 and L2 with Japanese–English bilinguals, without using priming or visual world methods. It extends Taylor and Mukai’s (Reference Taylor and Mukai2023) findings of bidirectional cross-linguistic effects in visual word recognition to the auditory domain, testing the applicability of the BIA+ with this population. To do so, it addresses the following four questions:
First, do phonological similarity, semantic similarity, and cognate frequency influence spoken word recognition in both languages? As BIA+ supposes that the same general mechanisms take place in reading and listening, the same non-target information (i.e., phonological representations, semantic representations) is expected to affect processing in this auditory study. Indeed, same-script language studies by Lagrou et al. (Reference Lagrou, Hartsuiker and Duyck2011) and Marian et al. (Reference Marian, Blumenfeld and Boukrina2008) found this to be the case. Lagrou et al. (Reference Lagrou, Hartsuiker and Duyck2015) and Garrido-Pozú (Reference Garrido-Pozú2024) even found effects in L1. However, Japanese and English share less overlap than the languages they studied, so co-activation may be weaker or delayed, especially if participants tested are L1-dominant and use the L2 only infrequently. The temporal delay of L2, combined with relatively few shared phonological representations, may limit cross-language activation, reaching the lower limit of non-selectivity. However, because spoken input directly activates phonological representations, CLI may still emerge as non-target phonological information becomes co-activated early on.
Second, if such effects occur, are their size and direction (i.e., if responses are facilitated or slowed) similar in each language? Taylor and Mukai (Reference Taylor and Mukai2023) found weaker effects in L1; this is expected to be the case in this auditory study as well. Taylor and Mukai also found that while semantic similarity and cognate frequency speeded responses in both languages, phonological similarity slowed recognition slightly in L2 but speeded it in L1. Cognate frequency effects, in contrast, did not differ across languages. Listeners, in contrast, may rely more on phonological information than do readers, for whom semantic representations can be directly activated from orthography according to BIA+. If this is true, phonological similarity may be more influential in the present study, or the direction and timing of effects may be different. In English auditory lexical decision tasks (ALDTs) with Spanish–English and English–Spanish bilinguals, for example, Garrido-Pozú (Reference Garrido-Pozú2024) found that phonological similarity speeded L2 responses but slowed them in L1; the same may be true for Japanese–English bilinguals.
Third, do these effects depend on L2 proficiency? Taylor and Mukai (Reference Taylor and Mukai2023) observed greater semantic similarity effects for less proficient readers, but no interaction of proficiency with phonological similarity or cognate frequency. In listening, less-balanced bilinguals may rely more on phonological overlap, consistent with Garrido-Pozú’s (Reference Garrido-Pozú2024) results for L2 with Spanish–English bilinguals.
Finally, does the timing of measurement affect observed patterns of CLI? The time course of auditory recognition is challenging to measure. Brand et al. (Reference Brand, Mulder, ten Bosch and Boves2021) suggest that response times measured from stimulus onset (hereafter, RTonset) reflect different parts of the activation process than those measured from offset (hereafter, RToffset). If a predictor behaves differently in RTonset and RToffset models, its influence likely changes over time. Indeed, stimulus duration, a strong predictor of response times (Ernestus & Cutler, Reference Ernestus and Cutler2015; Ferrand et al., Reference Ferrand, Méot, Spinelli, New, Pallier, Bonin, Dufau, Mathôt and Grainger2018; Tucker et al., Reference Tucker, Brenner, Danielson, Kelley, Nenadic and Sims2019), was found to speed RToffset but slow RTonset in their study. A three-way interaction with language (i.e., L1 versus L2) showed that L1 listeners especially benefitted from information heard during the stimulus itself. CLIs were not considered, however, so it is unclear how they might change over time. In Taylor and Mukai (Reference Taylor and Mukai2023), neither phonological nor semantic similarity was influential early in time, although effects arose later during processing. If this is true in listening, effects may be more pronounced in RToffset models. Still, as orthographic activation is not required for phonological co-activation in listening, phonological and semantic similarities may influence processing from early on. If so, they may be similarly influential in RTonset and RToffset models.
5. Method
5.1. Participants
Listeners (n = 39)Footnote 1 were recruited from two Japanese universities via word of mouth and by flyers distributed on campus. Data from one participant, whose dominant language was a third language, were excluded from analysis. All remaining participants were native speakers of Japanese who had studied English for at least 6 years and were either enrolled in university English courses or regularly used English for work or research. All were right-handed with normal hearing and normal or corrected-to-normal vision. Participant self-ratings of daily language use, language preferences, and English proficiency are presented in Appendix A.
5.2. Tasks
To directly compare languages, each participant completed four tasks: one ALDT in each English and Japanese, a cross-linguistic phonological similarity rating task, and a semantic similarity rating task. ALDTs were administered with the straightforward assumption that difficult-to-process words take longer to respond to. This combination of tasks allows for an extension of Taylor and Mukai (Reference Taylor and Mukai2023) to the auditory domain as well as observations from Garrido-Pozú (Reference Garrido-Pozú2024) to different-script bilinguals. Similarity rating tasks were conducted to derive participant-wise and item-specific continuous predictors of cross-linguistic overlap for use in the ALDT analyses.
5.3. Stimuli
5.3.1. English items
The English stimuli include the same 6–9-letter 250 primarily single-morpheme nouns tested by Taylor and Mukai (Reference Taylor and Mukai2023), originally from Miwa et al. (Reference Miwa, Dijkstra, Bolger and Baayen2014). As both examined word reading, the present study in part aims to replicate them in the auditory domain, in particular the former study which also tested the items’ Japanese katakana cognates, finding evidence for cross-linguistic activation in both Japanese and English. Therefore, the same items are tested here to provide as close a comparison as possible across modalities.
Originally generated using the English Lexicon Project Database (Balota et al., Reference Balota, Yap, Cortese, Hutchison, Kessler, Loftis, Neely, Nelson, Simpson and Treiman2007), the items have a HAL frequency (Hyperspace Analogue to Language frequency; Burgess & Livesay, Reference Burgess and Livesay1998), a co-occurrence-based corpus-derived frequency measure, above 2,000. Pseudoword generator Wuggy (Keuleers & Brysbaert, Reference Keuleers and Brysbaert2010) was used to find 250 English-like nonwords matched to the English targets in length, transition frequencies, and number of subsyllabic segments. During auditory stimuli generation, four pseudowords, including three near-homophones of legal words and one difficult pronunciation, were resampled.
5.3.2. Japanese items
Japanese cognates were compiled using an English-to-katakana converter (Bullock, Reference Bullock2022) as well as The Balanced Corpus of Contemporary Written Japanese word list (BCCWJ; Maekawa et al., Reference Maekawa, Yamazaki, Ogiso, Maruyama, Ogura, Kashino, Koiso, Yamaguchi, Tanaka and Den2014) and an online dictionary (Goo jisho, 2023). Selection criteria are detailed in Taylor and Mukai (Reference Taylor and Mukai2023). Katakana nonwords were compiled using these same tools, verifying that the items were not listed in the corpus. The full list of items is presented in Appendix B.
5.3.3. Auditory stimuli generation
Items were recorded in a sound-attenuated room using Audacity (version 3.2.0; sample rate: 44.1 kHz, 16 bit) paired to a Blue Yeti microphone. English items were spoken by a female L1 speaker of Standard Canadian English, which is familiar to participants, while Japanese items were spoken by a female L1 Japanese speaker using standard Japanese. Each aimed to speak as naturally as possible, reading nonwords as if they were real words, 3–5 times each. Recordings were pre-processed, and individual sound files were extracted by selecting the clearest utterance of each item, typically the penultimate pronunciation. Each file was normalized to 70 dB mean intensity using the Scale intensity function in Praat (version 6.3.09; Boersma & Weenink, Reference Boersma and Weenink2023). All auditory stimuli, analysis scripts, and anonymized data are available on the Open Science Framework (OSF): https://osf.io/g2fv4
5.4. Two-session design
To ensure that no memory of the cognates affected performance, the lexical decision tasks were conducted in two separate testing sessions on different days, and the presentation order was counterbalanced across participants. Sessions were conducted in a quiet, well-lit room, and participants were paid for each session.
5.4.1. Session 1
Thirty-nine participants completed a Japanese-language demographic and language background questionnaire largely based on the Language Experience and Proficiency Questionnaire (LEAP-Q; Marian et al., Reference Marian, Blumenfeld and Kaushanskaya2007). They then completed the LexTALE English vocabulary size test (Lemhöfer & Broersma, Reference Lemhöfer and Broersma2012) to estimate their English proficiency. Finally, they completed an ALDT in either English or Japanese (Experiment 1 or 2, respectively, detailed below). Session 1 lasted approximately 50 minutes.
5.4.2. Session 2
Thirty-three of the participants later returned for Session 2, completing the ALDT in the remaining language (Experiment 2 or Experiment 1), followed by cross-linguistic phonological similarity rating and finally cross-linguistic semantic similarity rating (Experiments 3 and 4, respectively), which were administered last to avoid influencing lexical decisions. This session lasted approximately 60 minutes.
5.5. Experiment Procedure
All experiments were conducted using PsychoPy (Version 6.3.09; Peirce et al., Reference Peirce, Hirst and MacAskill2022).
5.5.1. Experiment 1: Auditory lexical decision in English (L2)
Participants sat in front of a computer wearing Audio-Technica ATH-M50x studio headphones calibrated to 60 dB using a 1-kHz tone. Instructions displayed in Japanese explained they would hear many words, some of which were existing English words and some of which were not. Instructions were presented in Japanese to ensure full comprehension and to maintain participants’ typical daily language mode. They were instructed to decide as quickly and accurately as possible whether each item was a real English word. After a block of 10 practice trials, they responded to the 250 words and 250 nonwords, played in random order. In each trial, a 500 ms fixation cross was presented in the middle of the screen followed immediately by the auditory stimulus. If it was a real word, they pressed the right trigger button on a Logitech F310 gamepad. If it was a nonword, they pressed the left trigger button. If no response was recorded within 3500 ms, the trial ended, and the experiment continued. A 500 ms blank screen was presented between trials, for a total interstimulus interval of 1000 ms. Three breaks were included, and the task took approximately 20 minutes to complete.
5.5.2. Experiment 2: Auditory lexical decision in Japanese (L1)
This experiment was identical to Experiment 1 except that the target language was Japanese, not English.
5.5.3. Experiment 3: Cross-linguistic phonological similarity rating
The same individuals rated cross-linguistic phonological similarity for the 250 target word pairs. In each trial, participants heard an item from the English lexical decision task (e.g., diamond) immediately followed by its counterpart from Japanese lexical decision (e.g., ダイヤモンド), judging how similarly they were pronounced on a scale of 1–7 (where 1 corresponded to 異なる (“different”) and 7 corresponded to 完全に同じ (“identical”)). The scale appeared in white against a dark gray background, and participants used the computer keyboard to signal their decision. The presentation order for the 250 pairs was randomized. This task took approximately 15 minutes to complete.
5.5.4. Experiment 4: Cross-linguistic semantic similarity rating
Experiment 4 was identical to Experiment 3 except that participants rated similarity in meaning. Because typical participants in this context most often encounter English in written form, they are likely to have more elaborated semantic representations linked to written English forms than to spoken ones. To ensure full semantic access, the written words were therefore also presented. When the auditory stimuli were played, the two words appeared onscreen above the rating scale, with English on the left and Japanese on the right. If participants did not know the meaning of an item, they pressed the spacebar and the trial was skipped.
5.6. Variables
5.6.1. Dependent variables
ALDT response times are typically measured from stimulus onset on the straightforward presupposition that information starts becoming available as soon as the stimulus begins. However, RTonset is closely tied to stimulus duration, which positively correlates with response times (Ernestus & Cutler, Reference Ernestus and Cutler2015; Ferrand et al., Reference Ferrand, Méot, Spinelli, New, Pallier, Bonin, Dufau, Mathôt and Grainger2018; Tucker et al., Reference Tucker, Brenner, Danielson, Kelley, Nenadic and Sims2019). An alternative is to measure responses from stimulus offset (e.g., Taler et al., Reference Taler, Aaron, Steinmetz and Pisoni2010). Brand et al. (Reference Brand, Mulder, ten Bosch and Boves2021) suggest RToffset may better reflect the higher-level cognitive processes, such as semantic or decision-related mechanisms, which are assumed to come into play later in time. In the case of L2 listeners, who typically process words more slowly than L1 listeners, certain higher-level processes may not occur until stimulus offset, in which case effects would be more dramatic in models fitted to RToffset.
This study reports on models fitted to RTonset as well as to RToffset. Generalized linear mixed-effect models are used to factor in the positively skewed distribution of response times while maintaining ease of interpretation. Lo and Andrews (Reference Lo and Andrews2015) point out that Gamma and Inverse Gaussian distributions conceptually reflect response times as they mimic the waiting time that occurs before a response. They recommend using these distributions with an identity link function under the assumption that predictors directly affect response times (and not a function of RT) and also that factors affecting the same stage of processing interact, but those affecting separate stages do not.
5.6.2. Predictor variables
This study tests a variety of lexical, participant, and cross-linguistic variables (see Table 1). The following subsections describe how key theoretical constructs introduced earlier were operationalized as predictors in the mixed-effects models. The main predictors of interest, however, are L2 proficiency (i.e., LexTALE score) and the three cross-linguistic variables: phonological similarity, semantic similarity, and cognate word frequency.
Descriptive statistics for fixed effects tested in this study

Table 1. Long description
The table is organized into three columns: Type, Predictor, and Mean, S D (Range) or Levels.
Lexical predictors include:
* S U B T L W F (L 2 frequency): Mean 38.88, S D 72.13, range 0 to 487.
* B C C W J W F (L 1 frequency): Mean 834.99, S D 1622.50, range 0 to 16458.
* English Duration: Mean 666.88, S D 92.61, range 451 to 912 ms.
* Japanese Duration: Mean 864.49, S D 144.15, range 544 to 1295 ms.
* Language: Levels include English and Japanese.
* Phonological Rating: Mean 4.35, S D 1.73, range 1 to 7.
* Mean Phonological Rating: Mean 4.41, S D 0.86, range 1.17 to 5.87.
* Semantic Rating: Mean 5.87, S D 1.60, range 1 to 7.
* Mean Semantic Rating: Mean 5.88, S D 0.60, range 2.72 to 6.75.
Task predictors include:
* Trial: Mean 248.42, S D 143.95, range 1 to 500.
* Previous R T onset: Mean 1112.54, S D 349.21, range 0 to 3500.
* Previous R T offset: Mean 337.34, S D 355.56, range negative 1015.63 to 2905.75.
Participant predictors include:
* Age: Mean 20.05, S D 5.96, range 18 to 49.
* Sex: Levels include Female (n equals 29) and Male (n equals 9).
* Years of Education: Mean 12.88, S D 2.27, range 12 to 22.
* Lex T A L E: Mean 61.09, S D 12.17, range 42.50 to 96.25.
* Interval: Mean 17.12, S D 13.24, range 1 to 42.
* Counter Balanced Group: Levels include English-then-Japanese and Japanese-then-English.
Note. Listed are the raw values before standardization procedures were carried out. Word frequency was operationalized using Zipf-transformed values (log10 frequency per million +3). For the English task data, SUBTLWF is used as the TargetWF and BCCWJWF serves as NonTargetWF. For the Japanese task data, the opposite is true. Phonological and semantic rating measures were obtained in Experiments 3 and 4, respectively.
Duration. As stimulus duration (ms) is closely tied to response times (Ernestus & Cutler, Reference Ernestus and Cutler2015; Ferrand et al., Reference Ferrand, Méot, Spinelli, New, Pallier, Bonin, Dufau, Mathôt and Grainger2018; Tucker et al., Reference Tucker, Brenner, Danielson, Kelley, Nenadic and Sims2019), it is expected to speed them in the RToffset analysis and slow them in the RTonset models. As Japanese stimuli were, on average, longer than English stimuli due to structural differences between the languages, stimulus duration is included as a continuous predictor in all models. This ensures that other effects are estimated independently of language-specific differences in acoustic length.
Target word frequency. Commonly occurring words are typically recognized faster (Brysbaert & New, Reference Brysbaert and New2009; Tucker et al., Reference Tucker, Brenner, Danielson, Kelley, Nenadic and Sims2019). The English frequency measure is SUBTLWF from the SUBTLEXUS movie subtitle corpus (Brysbaert & New, Reference Brysbaert and New2009), which is a superior predictor of ALDT response times (Ernestus & Cutler, Reference Ernestus and Cutler2015; Tucker et al., Reference Tucker, Brenner, Danielson, Kelley, Nenadic and Sims2019) and is highly correlated with similar frequency measures (Tucker et al., Reference Tucker, Brenner, Danielson, Kelley, Nenadic and Sims2019) like the spoken subset of the balanced COCA corpus (Davies, Reference Davies2009). For Japanese results, BCCWJWF (Maekawa et al., Reference Maekawa, Yamazaki, Ogiso, Maruyama, Ogura, Kashino, Koiso, Yamaguchi, Tanaka and Den2014) is used. A delayed (i.e., RToffset-only) effect of word frequency – or a stronger effect in this analysis – might indicate a delay in lexical activation. However, some auditory evidence suggests this may arise early in time (Dahan et al., Reference Dahan, Magnuson and Tanenhaus2001; Dufour et al., Reference Dufour, Brunellière and Frauenfelder2013; Marslen-Wilson, Reference Marslen-Wilson1987).
Cognate word frequency. The frequency of a word’s cognate has been found to predict response times above and beyond that of the target word itself (Miwa et al., Reference Miwa, Dijkstra, Bolger and Baayen2014; Taylor & Mukai, Reference Taylor and Mukai2023). Therefore, NonTargetWF is included as a further cross-linguistic predictor indexing the frequency of a word’s translation equivalent in the other language. For English trials, NonTargetWF corresponded to the Japanese cognate’s frequency (BCCWJWF), and for Japanese trials, it is the English cognate’s frequency (SUBTLWF). Because corpus-based frequency measures are typically right-skewed (Zipfian) and are derived from different corpora (and thus are on different numeric scales), target and cognate word frequency were first transformed into Zipf values (log10 frequency per million +3) and then standardized prior to modeling.
Cross-linguistic phonological and semantic similarities. Two measures for each type of similarity are tested. First, as in previous studies (Allen & Conklin, Reference Allen and Conklin2013; Dijkstra et al., Reference Dijkstra, Miwa, Brummelhuis, Sappelli and Baayen2010; Garrido-Pozú, Reference Garrido-Pozú2024; Taylor & Mukai, Reference Taylor and Mukai2023), all participants’ ratings for each cognate pair were averaged (meanPhonologicalRating; meanSemanticRating). Second, as the same individuals who completed ALDTs also provided similarity ratings, individuals’ own ratings (PhonologicalRating; SemanticRating) are compared with the averaged measures to determine whether subjective judgments are a better predictor of participants’ own performance. Taylor and Mukai (Reference Taylor and Mukai2023) found individuals’ ratings to be a superior predictor for phonological but not semantic similarity. As the present study is an auditory investigation, it is possible that the pattern of influence is different as participants’ rate spoken, not written, stimuli.
Trial. Trial number (1–500) is expected to affect responses in that participants may respond more quickly as they adjust to the task or more slowly as they become fatigued.
Previous RT. Response times are subject to a variety of medium-term effects such as changes in the participant’s attention levels, fatigue, or response strategy (ten Bosch et al., Reference ten Bosch, Boves and Mulder2018). Local speed effects are thus considered so that cognitive processes can be clearly examined; the response time in the previous trial (i.e., prevRTonset in the RTonset analysis, and prevRToffset in the RToffset analysis) is expected to be a significant predictor (Balota et al., Reference Balota, Aschenbrenner and Yap2016; Perea & Carreiras, Reference Perea and Carreiras2003).
LexTALE score. As a measure of L2 English proficiency, participants’ scores on the LexTALE English vocabulary size test (Lemhöfer & Broersma, Reference Lemhöfer and Broersma2012) are tested. While it does not directly measure modality-specific listening ability, LexTALE provides a validated index of lexical knowledge and general proficiency.
Individual factors. An array of individual differences is known to affect mental processing and response times (Jensen, Reference Jensen2006). This study considers participant Age in years at the time of the first session; Sex; and YearsOfEducation, or the number of years in total they spent in formal education. None of these predictors is expected to reach statistical significance based on Taylor and Mukai (Reference Taylor and Mukai2023).
Interval and counterbalancedgroup. To ensure that no cognate memory affected performance in the second session, the number of days between testing sessions (Interval) and the order in which the languages were presented (i.e., CounterBalancedGroup) are tested. If any memory of the items does influence performance, either or both may be a significant predictor.
5.7. Data analysis
Data processing and analysis were conducted in R software for statistical computing, version 4.4.1 (R Core Team, 2024). Results from the ALDTs (Experiments 1 and 2) were combined into one data set for analysis with task language included as a predictor variable. Participants’ own subjective ratings of phonological and semantic similarity, as well as the group’s averages for each (Experiments 3 and 4), were added to the data set alongside basic lexical properties and participant characteristics.
The mental chronometry approach (Posner, Reference Posner1978) suggests raw (and not transformed) response times are the most appropriate dependent variable to use for a straightforward interpretation of results (Lo & Andrews, Reference Lo and Andrews2015). Transforming response times may not be beneficial and may even lead to a loss of power compared to the untransformed measure (Marmolejo-Ramos et al., Reference Marmolejo-Ramos, Cousineau, Benites and Maehara2014; Schramm & Rouder, Reference Schramm and Rouder2019). Therefore, generalized linear mixed-effect models (Baayen et al., Reference Baayen, Davidson and Bates2008; Baayen & Milin, Reference Baayen and Milin2010) were fitted to raw RTonset and RToffset using the packages lme4 (Bates et al., Reference Bates, Mächler, Bolker and Walker2015) and lmerTest (Kuznetsova et al., Reference Kuznetsova, Brockhoff and Christensen2017). In each analysis, the fitdistrplus package (Delignette-Muller & Dutang, Reference Delignette-Muller and Dutang2015) was used to determine the best distributions for the model fit. The Gamma distribution, recommended for RT data (Lo & Andrews, Reference Lo and Andrews2015), was found to be the best fit for each. Inverse and log link functions, commonly used with Gamma distributions (Thiele & Markussen, Reference Thiele and Markussen2012), were compared to determine the best fit and parameter interpretation.
Using a forward-fitting procedure, a maximal random effects structure was determined to find an optimal balance between Type I error and statistical power (Barr et al., Reference Barr, Levy, Scheepers and Tily2013; Matuschek et al., Reference Matuschek, Kliegl, Vasishth, Baayen and Bates2017). Fixed effects of key lexical, task, and participant predictors, standardized before analysis, were selected using backward elimination, starting with the most complex model and making use of AIC and a significance criterion of at least two standard errors (i.e., t values of 2.0 or more) following Kliegl et al. (Reference Kliegl, Masson and Richter2010) and Masson and Kliegl (Reference Masson and Kliegl2013). Two-way interactions between task Language and LexTALE (i.e., L2 proficiency) and all remaining predictors were checked, and by-participant random slopes were added as justified by improvements in model fit. Models were fit by maximum likelihood estimation (Laplace Approximation). The packages ggplot2 (Wickham, Reference Wickham2016) and effects (Fox, Reference Fox2003; Fox & Weisberg, Reference Fox and Weisberg2018) were used to visualize the fitted models, and DHARMa (Hartig, Reference Hartig2022) was used to check residuals and model fit.
5.8. Data preprocessing and descriptive statistics by task
5.8.1. Experiment 1: ALDT in English (L2)
Thirty-five participants completed lexical decision in English, resulting in a raw data set of 17,500 trials. Trials in which no button press was registered before the 3500 ms time out (4.4% of data) were eliminated, followed by conceptually improbable responses (i.e., those 300 ms from stimulus onset; 0.1% of data). Overall, errors were made 23.1% of the time (18.4% of word trials; 27.8% of nonword trials). To retain participants from a wide L2 proficiency range while ensuring task engagement, and given that L2 auditory lexical decision typically yields higher error rates than L1 tasks (Tremblay, Reference Tremblay2008), a minimum accuracy threshold of 60% was applied. In L2 auditory lexical decision, particularly with unbalanced bilinguals, performance can be more variable and may approach near-chance levels in some contexts (Fricke, Reference Fricke2022; Tremblay, Reference Tremblay2008). A stricter criterion would have disproportionately excluded lower proficiency listeners and restricted the variability central to the present research questions, as proficiency is modeled continuously in this study. This 60% threshold therefore functioned as a conservative lower-bound engagement criterion rather than a benchmark of task mastery, consistent with lexical access studies employing similar cutoffs (e.g., Fuhrmeister et al., Reference Fuhrmeister, Elbuy and Bürki2024; Tucker et al., Reference Tucker, Brenner, Danielson, Kelley, Nenadic and Sims2019). No participants were excluded from the English task under this criterion.
For these English data, average accuracy for each participant was then calculated for all items (63–96%; M = 80.4%) and for words only (63.9–99%; M = 85.0%). Average accuracy by item was calculated for all items (2.9–100%; M = 80.4%) as well as for words only (14.7–100%, M = 85.0%), then trials responded to incorrectly (3268 trials) and items responded to correctly less than 60% of the time (1111 further trials) were removed, followed by nonword trials, resulting in a set of 6428 data points.
5.8.2. Experiment 2: ALDT in Japanese (L1)
Thirty-six participants completed lexical decision in Japanese, for a total of 18,000 trials. Participants made errors 12.1% of the time (15.7% of words and 8.5% of nonwords). Again, by-participant average accuracy was calculated for all items (70.8–95.3%; M = 88.1%) and for words only (53.6–95.4%; M = 84.5%). Data from one participant, who responded correctly to words less than 60% of the time, were removed. For items, average accuracy was calculated for all items (0–100%; M = 88.1%) and for words only (0–100%; M = 84.4%). Then, incorrect responses (2103 trials) and items responded to correctly less than 60% of the time (465 further trials) were removed, followed by nonword trials, leaving 6766 data points from this task. Table 2 displays response time and participant accuracy by task for English and Japanese lexical decision.
English and Japanese auditory lexical decision response times and accuracy

Table 2. Long description
The table is organized into three columns: Task, Result type, and Mean, S D Range.
For the English L 2 A L D T task:
* R T onset in milliseconds: Mean equals 934.5, S D equals 218.9, with a range of 353.5 to 2295.6.
* R T offset in milliseconds: Mean equals 291.3, S D equals 209.6, with a range of 0.6 to 1769.1.
* Average accuracy by participant: Mean equals 80.4 percent, S D equals 7.2 percent, with a range of 63.0 to 95.5 percent.
For the Japanese L 1 A L D T task:
* R T onset in milliseconds: Mean equals 1025.0, S D equals 218.2, with a range of 465.0 to 2169.8.
* R T offset in milliseconds: Mean equals 226.0, S D equals 187.1, with a range of 0.0 to 1489.2.
* Average accuracy by participant: Mean equals 88.1 percent, S D equals 5.3 percent, with a range of 70.8 to 95.3 percent.
Note. This table reports data for target items after trimming procedures were carried out.
5.8.3. Experiment 3: Cross-linguistic phonological similarity rating
All participants who competed both experimental sessions (n = 33) provided their subjective cross-linguistic similarity ratings to the 250 word pairs. In the phonological similarity rating task, participants did not signal their rating before the timeout in 8.3% of trials, so valid responses (i.e., PhonologicalRating) were recorded for the remaining 91.7% of trials (7568 data points). An averaged rating measure (meanPhonologicalRating) was created by taking the group’s mean rating for each item pair, and the range and the overall mean rating were noted (1.2–5.9; M = 4.2). PhonologicalRating and meanPhonologicalRating demonstrated a moderate correlation (r = 0.54).
5.8.4. Experiment 4: Cross-linguistic semantic similarity rating
For the semantic similarity rating data, timeouts and trials in which the participant pressed the spacebar (signaling an unknown word in either language) had no responses recorded (15.3% of trials). Therefore, valid ratings were gathered for 84.7% of trials (6984 data points). As with phonological similarity, the group’s averaged rating for each item pair was calculated, and the range and mean were noted (2.7–6.8; M = 5.8). Similar to phonological ratings, individuals’ own semantic judgments demonstrated a moderate correlation with the group’s average (r = 0.40). Comparing semantic and phonological similarities, the individual ratings (i.e., PhonologicalRating and SemanticRating) were only weakly correlated (r = 0.21), as were the averaged measures (i.e., meanPhonologicalRating and meanSemanticRating; r = 0.26).
6. Results
Data from the four experiments were combined for analysis. Ratings from Experiments 3–4 were merged with the ALDT data to create cross-linguistic overlap predictors for analysis in the mixed-effects models. Results from the RTonset analysis are first reported below, followed by results for models fitted to RToffset.
6.1. Analysis
6.1.1. RTonset
Generalized linear mixed-effects models with a Gamma distribution and log link were fitted to raw response times measured from the onset of the auditory stimulus (RTonset). The random effects structure of the final model (conditional R2 = 0.33; marginal R2 = 0.24) includes random intercepts of item (SD = 0.04) and participant (SD = 0.03) as well as by-participant random slopes for TargetWF (SD = 0.02) and PreviousRTonset (SD = 0.02). Significant main effects and 2-way interactions are summarized in Table 3 and discussed below. The following variables did not reach statistical significance and are thus excluded from the final model: number of days between testing sessions (Interval; p = .65), participant Age (p = .75), YearsOfEducation (p = .48), Sex (p = .75), and whether they first completed the task in English or in Japanese (CounterBalancedGroup; p = .38).
Fixed effects in the final RTonset model

Table 3. Long description
The table contains six columns: Type, Variable, Estimate, S E, t value, and p value.
* The Intercept has an Estimate of 6.871, S E of 0.021, t value of 322.391, and p value less than .001.
* Task Type: Trial variable has an Estimate of 0.005, S E of 0.002, t value of 3.150, and p value of 0.002. Previous R T onset variable has an Estimate of 0.027, S E of 0.006, t value of 4.427, and p value less than .001.
* Participant Type: Lex TALE variable has an Estimate of negative 0.063, S E of 0.016, t value of negative 3.830, and p value less than .001.
* Lexical Type: Duration variable has an Estimate of 0.068, S E of 0.004, t value of 18.505, and p value less than .001. Target W F variable has an Estimate of negative 0.042, S E of 0.007, t value of negative 5.712, and p value less than .001. Phonological Rating variable has an Estimate of negative 0.013, S E of 0.003, t value of negative 4.151, and p value less than .001. Mean Semantic Rating variable has an Estimate of negative 0.011, S E of 0.005, t value of negative 2.220, and p value of 0.026.
* Lexical or Participant Type: Language Jpn colon Lex TALE interaction has an Estimate of 0.046, S E of 0.004, t value of 11.050, and p value less than .001.
* Lexical Type: Language Jpn colon Phonol Ratng interaction has an Estimate of 0.009, S E of 0.004, t value of 2.497, and p value of 0.013.
Unsurprisingly, stimulus length (Duration Footnote 2) and the response time (measured from onset) in the previous trial (PreviousRTonset) were both inhibitory effects. In other words, longer words took more time to respond to, and the more time a participant spent responding to one trial, the longer it took them to respond in the next, demonstrating local speed effects. The by-participant random slopes for PreviousRTonset indicate that while some individuals` responses were strongly affected by their response in the previous trial, others were less so. Responses also depended upon Language in that Japanese words were generally responded to more slowly, an unsurprising finding (recall that Japanese stimuli were nearly 200 ms longer, on average).
Trial was also a significant main effect, with responses slowing somewhat as the experiment progressed, perhaps due to accumulating fatigue. The frequency of the word (TargetWF), however, facilitated responses in that more commonly occurring items were responded to faster, an effect observed in both languages but especially pronounced in Japanese (L1). As evidenced by the by-participant random slopes, individuals differed in how sensitive they were to word frequency. Partial effects are visualized together in Figure 2.
Partial task and target effects in the RTonset final model. Note. Panel A shows the effect of stimulus Duration, while panels B and C, respectively, show the task effects of Trial and PreviousRTonset. TargetWF (panel D) is comprised of two different measures (SUBTWLF for English data, BCCWJWF for Japanese). Colored lines show differing effects by language. For this and subsequent figures, predictors are displayed on a standardized (z-score) scale. Shaded areas represent 95% confidence intervals around model predictions.

Figure 2. Long description
The figure consists of four panels arranged in a two by two grid. All panels share a y-axis labeled R T onset m s.
Panel A, top-left. The x-axis is Duration on a z-score scale from negative 2 to 3. A black line shows a strong linear increase in R T onset from approximately 850 m s at negative 2 to over 1200 m s at 3. A gray shaded area represents the 95 percent confidence interval.
Panel B, top-right. The x-axis is Trial from negative 2 to 2. A black line shows a very slight linear increase, remaining nearly flat around the 975 m s mark. A gray shaded area surrounds the line.
Panel C, bottom-left. The x-axis is Previous R T onset from negative 2 to 2. A black line shows a moderate linear increase from approximately 925 m s to 1050 m s. A gray shaded area surrounds the line.
Panel D, bottom-right. The x-axis is Target word frequency from negative 2 to 3. This panel features two lines. A yellow line for English shows a linear decrease from approximately 1040 m s to 910 m s. A blue line for Japanese shows a steeper linear decrease from approximately 1070 m s to 890 m s. Both lines are accompanied by shaded confidence intervals in their respective colors.
Turning to L2 proficiency, LexTALE was facilitatory in that higher proficiency led to faster responses. While the effect in Japanese was smaller than that in English, it importantly was observed in both languages. Interestingly, LexTALE and language demonstrated a crossover interaction. Whereas lower-proficient participants responded more quickly to Japanese items, the opposite is true for advanced listeners, who responded more slowly in Japanese than in English.
Where cross-linguistic effects are concerned, individuals’ own ratings of phonological similarity (PhonologicalRating) were a better predictor than the group’s averaged measure (meanPhonologicalRating; p = .03) as evidenced by lower AIC and p and t values. Phonological similarity was significant as both a main effect and an interaction with Language in the present analysis; it facilitated responses in both but was especially influential in the L2 (English).
Unlike phonological similarity, the group’s averaged measure (i.e., meanSemanticRating) was the superior predictor for semantic similarity. In fact, individuals’ own ratings (i.e., SemanticRating) did not come close to reaching statistical significance (p = .78). This contrasts with Taylor and Mukai (Reference Taylor and Mukai2023), in which the two were comparable. The effect here did not differ across languages. Cognate word frequency (NonTargetWF; p = .43), a further measure of CLI, did not significantly improve the model. Figure 3 provides a visual representation of the effects of LexTALE as well as phonological and semantic similarities.
Bilingual-specific effects in the RTonset final model. Note. Effects of L2 proficiency (i.e., LexTALE) and individuals’ phonological ratings (panels E and F) interacted with language (colored lines). Panel G shows the effect of the averaged semantic rating measure, which was the same across languages.

Figure 3. Long description
The multi-panel figure consists of three line graphs labeled E, F, and G. All graphs use R T onset in milliseconds on the y-axis.
Panel E at the top center plots R T onset against Lex T A L E scores ranging from negative 2 to 3. Two lines represent the languages. The English line, in yellow, shows a steep linear decrease from approximately 1125 milliseconds at negative 2 to 810 milliseconds at 3. The Japanese line, in blue, shows a shallower linear decrease from approximately 1030 milliseconds to 910 milliseconds. Both lines include shaded confidence intervals that overlap between Lex T A L E scores of 0 and 1.
Panel F at the bottom left plots R T onset against Phonological rating from negative 2 to 2. The English yellow line decreases linearly from approximately 1010 to 960 milliseconds. The Japanese blue line shows a very slight decrease, remaining nearly flat around 980 to 975 milliseconds. The confidence intervals for both languages overlap significantly across the entire range.
Panel G at the bottom right plots R T onset against Mean semantic rating from negative 5 to 1. A single black line represents the combined effect for both languages, showing a linear decrease from approximately 1040 milliseconds at negative 5 to 970 milliseconds at 1, surrounded by a grey shaded confidence interval.
6.1.2. RToffset
As in the RTonset analysis, generalized linear mixed-effects models with a Gamma distribution and log link function were fitted to responses measured from offset (RToffset). The final model (conditional R2 = 0.28; marginal R2 = 0.15) includes significant random effects of item (SD = 0.15) and participant (SD = 0.18) as well as by-participant random slopes for TargetWF (Zipf; SD = 0.03) and PreviousRToffset (SD = 0.07). Two-way interactions with Language and LexTALE were checked, and significant interactions and fixed effects (summarized in Table 4) were retained in the final model. Again, the following predictors did not benefit the model: days between sessions (Interval; p = .38), Age (p = .77), YearsOfEducation (p = .23), Sex (p = .80), and CounterBalancedGroup (p = .17).
Fixed effects in the final RToffset model

Table 4. Long description
The table contains six columns: Type, Variable, Estimate, S E, t value, and p value.
* (Intercept): Estimate 5.385, S E 0.053, t value 101.902, p value less than .001.
* Task - Trial: Estimate 0.022, S E 0.008, t value 2.936, p value 0.003.
* Task - Previous R T offset: Estimate 0.098, S E 0.022, t value 4.372, p value less than .001.
* Participant - Lex T A L E: Estimate negative 0.143, S E 0.051, t value negative 2.787, p value 0.005.
* Lexical - Language Japanese: Estimate 0.099, S E 0.026, t value 3.845, p value less than .001.
* Lexical - Duration: Estimate negative 0.258, S E 0.016, t value negative 16.283, p value less than .001.
* Lexical - Target W F: Estimate negative 0.127, S E 0.021, t value negative 6.012, p value less than .001.
* Lexical - non Target W F: Estimate 0.132, S E 0.018, t value 7.508, p value less than .001.
* Lexical - Phonological Rating: Estimate negative 0.028, S E 0.011, t value negative 2.676, p value 0.007.
* Lexical - mean Semantic Rating: Estimate negative 0.041, S E 0.016, t value negative 2.590, p value 0.010.
* Lexical/Particip - Language Jpn:Lex T A L E: Estimate 0.118, S E 0.015, t value 7.668, p value less than .001.
* Lexical/Task - Language Jpn:Prvs R T offset: Estimate 0.032, S E 0.017, t value 1.880, p value 0.060.
* Lexical - Language Jpn:Target W F: Estimate negative 0.097, S E 0.020, t value negative 4.780, p value less than .001.
Note. The marginally significant interaction of PreviousRToffset and language is retained in the final model as model comparisons indicate its inclusion improves the model fit.
As predicted, the final model includes significant main effects of the task and lexical variables Duration, PreviousRToffset (i.e., the response time to the previous trial, this time measured from the end of the auditory signal), Trial, TargetWF, and Language. First, longer Duration led to shorter RToffsets, which, as expected, contrasts with the RTonset analysis in which longer stimuli had longer RTs. In line with Brand et al. (Reference Brand, Mulder, ten Bosch and Boves2021), this finding indicates that with longer words, listeners can make use of information available during the stimulus itself to make a faster decision after offset. PreviousRToffset and Trial again slowed responses, in that longer responses to one trial meant longer responses to the next, and responses slowed as the task progressed. Participants demonstrated moderate variability in how sensitive they were to local speed effects as evidenced by the by-participant random slopes for PreviousRToffset, and its interaction with language showed it was slightly more influential in Japanese.
As a main effect, TargetWF speeded RToffset, and it was also significant in interaction with Language. While higher frequency led to faster responses in both languages, this was especially the case for the Japanese task, a finding which differs somewhat from the analyses by Brand et al. (Reference Brand, Mulder, ten Bosch and Boves2021) in which it was the L2 listeners who benefited more. This may be due, at least in part, to the comparatively large range of frequency values (0: 16458) for Japanese stimuli in this investigation. Partial main effects and interactions with Language are depicted in Figure 4.
Partial task and target effects in the Final RToffset model. Note. Effects of stimulus Duration and trial number (panels H and I, respectively) were again not dependent on language (gray lines), although Duration was facilitatory in this analysis (compare to Panel A in Figure 2). In contrast to the RTonset analysis, PreviousRToffset (panel J) varied by language, while target word frequency (Panel K) did not (compare to Panels C and D, respectively, in Figure 2).

Figure 4. Long description
The figure consists of four panels labeled H through K. All panels share a Y-axis representing R T offset in milliseconds.
* Panel H (Top-Left): The X-axis is Duration ranging from negative 2 to 4. A single black line shows a non-linear, downward facilitatory curve, starting near 400 milliseconds and ending near 100 milliseconds, with a gray confidence interval.
* Panel I (Top-Right): The X-axis is Trial ranging from negative 2 to 2. A single black line shows a very slight linear increase from approximately 230 to 250 milliseconds.
* Panel J (Bottom-Left): The X-axis is Previous R T offset ranging from negative 2.5 to 7.5. This panel includes a legend for language. A blue line for Japanese and a yellow line for English both show an upward trend. The lines diverge as Previous R T offset increases, with Japanese reaching a higher R T offset of approximately 650 milliseconds compared to English at approximately 450 milliseconds.
* Panel K (Bottom-Right): The X-axis is Target word frequency ranging from negative 2 to 2. A single black line shows a linear decrease from approximately 310 milliseconds to 170 milliseconds.
Turning to bilingual-specific predictors, LexTALE score was facilitatory in that higher scoring participants responded more quickly after offset in both languages. As with RTonset, lower proficiency was associated with faster RToffsets to L1 targets. While more advanced participants again responded faster in both languages, they demonstrated shorter RToffsets to L2 than L1 items. The frequency of a word’s cognate (i.e., nonTargetWF) was also a significant predictor above and beyond the frequency of the word itself in that higher cognate frequency was associated with slower response times. This effect was moderated by language, with a stronger inhibitory effect observed in English than in Japanese.
Cross-linguistic similarities were again significant predictors in this analysis. meanPhonologicalRating (p = .03), while a significant predictor, was not as strong a predictor as individuals’ own ratings, which is similar to Taylor and Mukai (Reference Taylor and Mukai2023). PhonologicalRating is therefore again included in the final model, but unlike in the RTonset analysis, its effect does not differ between languages. Individuals’ own SemanticRating again did not reach significance (p = .45), but the group’s averaged measure, meanSemanticRating, did. Initially, its effect depended on language in this analysis, but once by-participant random slopes were included in the model, the interaction was no longer significant. Significant proficiency-related and cross-linguistic effects in the RToffset analysis are illustrated in Figure 5.
Bilingual-specific effects in the Final RToffset model. Note. In contrast to the RTonset model, cognate word frequency (nonTargetWF; Panel M) is a significant inhibitory effect and interacts with language, slowing responses measured from offset. Phonological similarity (Panel N) does not depend on language, which differs from the RTonset results (compare with Panel F in Figure 3).

Figure 5. Long description
Panel L: The y-axis is R T offset in milliseconds from 100 to 300. The x-axis is Lex T A L E from negative 2 to 3. English shows a steep linear decrease from 300 to 150 milliseconds. Japanese shows a nearly flat, slightly negative slope starting around 260 milliseconds.
Panel M: The y-axis is R T offset from 150 to 400. The x-axis is Cognate word frequency from negative 2 to 3. English shows a sharp linear increase from 175 to 340 milliseconds. Japanese shows a more gradual linear increase from 230 to 280 milliseconds.
Panel N: The y-axis is R T offset from 200 to 280. The x-axis is Phonological rating from negative 2 to 2. A single black line representing both languages shows a linear decrease from approximately 255 to 225 milliseconds.
Panel O: The y-axis is R T offset from 200 to 320. The x-axis is Mean semantic rating from negative 4 to 0. A single black line shows a linear decrease from approximately 295 to 230 milliseconds.
All panels include shaded error bands representing confidence intervals.
7. General discussion
The intent of this study was to determine whether CLIs similarly affect L1 and L2 auditory lexical decisions, and whether any such effects change by L2 proficiency or by the point in the time course in which activation is measured. The BIA+ model assumes representations from both languages are co-activated during word recognition, such that knowledge of one language can influence processing even when only one is in use. In Japanese and English, which use completely different writing systems and have dissimilar phonological systems, co-activation can occur, but only directly through shared semantic or phonological information (which, in the case of the latter, is often less than for languages such as English and Dutch, on which the BIA+ model was based). As Japanese/English cognates share comparatively less information, and as there may be a large temporal delay of activation for L2 for unbalanced bilinguals living in the present L1 context (i.e., Japan), CLI may be precluded for these items, especially if non-target competitors are not purposefully activated through priming or related methods.
Despite this unlikely context, the present study provides evidence for CLI on spoken word recognition in both Japanese and English. Separate models fitted to RTonset and RToffset revealed that similar task, lexical, and bilingual-specific predictors affect spoken word recognition in the two languages. Further, while English proficiency modulated responses, the overall processes (including the presence of CLI) were similar for high- and low-proficient L2 listeners.
The first major aim of this investigation was to determine whether phonological similarity, semantic similarity, and cognate word frequency affect auditory lexical decisions as they do visual lexical decisions. Shared phonological and semantic information facilitated responses in both L1 and L2, regardless of whether they were measured from stimulus onset or offset. As in Taylor and Mukai (Reference Taylor and Mukai2023), individual phonological similarity ratings were more predictive of performance than group-averaged ratings, suggesting that subjective, item-level similarity judgments may better reflect cross-linguistic phonological activation patterns. By contrast, semantic similarity effects were better captured by the averaged ratings, indicating that meaning-based overlap exerted a consistent, facilitatory influence across participants.
Cognate word frequency (NonTargetWF) was notably also a significant predictor, as in the visual studies by Miwa et al. (Reference Miwa, Dijkstra, Bolger and Baayen2014) and Taylor and Mukai (Reference Taylor and Mukai2023). In those reading studies, the effect emerged early in processing, whereas in the present auditory study, the effect emerged only for responses measured from stimulus offset. This suggests that cognate frequency effects influence auditory word recognition later than visual word recognition, where such effects have been observed from the earliest stages of processing (e.g., first fixations). One possible explanation is that auditory input unfolds incrementally over time, delaying the point at which lexical competition between the target and cross-language competitors becomes fully engaged. In contrast, the full orthographic form is presented immediately during reading, allowing frequency-based competition to influence processing earlier.
The direction of cognate frequency effects also differed from the previous visual studies. While Miwa et al. (Reference Miwa, Dijkstra, Bolger and Baayen2014) observed facilitatory effects in L2, and Taylor and Mukai (Reference Taylor and Mukai2023) observed facilitation in both L1 and L2, the present auditory study observed later-arising inhibitory effects of cognate frequency in both languages, particularly in L2 English. Taken together, these findings suggest that while cross-linguistic activation is evident in both reading and listening, the timing and consequences of cognate frequency differ across modalities.
The second question was whether the direction and size of cross-linguistic effects were similar in the two languages. In contrast to the Taylor and Mukai (Reference Taylor and Mukai2023) study, in which phonological overlap slowed L2 but speeded L1 responses, the present auditory investigation found both semantic and phonological overlap speeded responses in both languages. Because spoken words directly activate phonological representations, it is possible that the relatively early activation of L1 candidates during L2 listening allows enough time for competition to be resolved before a response is made. In reading, by contrast, activation first proceeds via orthography, adding another temporal step. Quick activation of L1 phonological information in reading could mean L1 competitors reach higher activation levels, delaying recognition of L2 targets. In auditory processing, where phonological information is available immediately and unfolds over time, L1 competitors may both arise and be resolved rapidly, leading to the consistently facilitatory effects observed here.
The phonological similarity effect here was dependent on language for the RTonset analysis, in that while it was facilitatory in both languages, it especially speeded responses in L2, echoing findings from L2 English and Spanish (Garrido-Pozú, Reference Garrido-Pozú2024) and supporting the asymmetry predicted by Kroll and Stewart’s (Reference Kroll and Stewart1994) Revised Hierarchical Model. The effect did not differ by language after offset, revealing that this discrepancy is an earlier effect largely resolved during the course of the stimulus itself, which is unsurprising as, according to BIA+, phonological representations would become co-activated early enough to be largely resolved before higher-level processes take place, so any language-specific advantage (or disadvantage) would have been worked out by the time participants plan a response.
Notably, these results are in line with Taylor and Mukai (Reference Taylor and Mukai2023); in that study, language-dependent phonological similarity effects arose at late fixation and flattened out somewhat by response.
The effect of semantic similarity, by contrast, did not differ by language. It did, however, depend on language at RToffset, but only until by-participant random effects were included in the model. This suggests that shared semantic information becomes co-activated, helping auditory processing in a similar way in L1 and L2. For both similarity measures, the magnitude of effects is larger in the RToffset model (b = −0.0127 at onset and b = −0.0283 at offset for PhonologicalRating; b = −0.0112 at onset and b = −0.0412 at offset for meanSemanticRating), suggesting that while similarity effects emerge during the encoding stages of processing, they continue to build and exert a greater impact as recognition unfolds. Taken together, these results make sense from the perspective of the BIA+ in which co-activation is not precluded in either language direction in either visual or auditory word recognition.
The third goal was to check whether these effects depended on L2 proficiency. While participants with higher LexTALE scores were faster overall in both English and Japanese, the effect was especially pronounced for the highest proficiency listeners, who responded faster to L2 than to L1 targets, whereas the lowest proficiency participants demonstrated the opposite pattern. Within the framework of the BIA+ model, increased L2 experience likely raises the resting activation level of L2 lexical representations and strengthens cross-language connections, thus speeding lexical processing in both languages. Importantly, however, proficiency did not modulate the size of phonological or semantic similarity effects, suggesting that cross-linguistic co-activation operated similarly across the proficiency range of bilinguals tested here. This pattern mirrors previous findings in reading and listening, where proficiency influenced general processing speed but not the magnitude of cross-linguistic facilitation (Garrido-Pozú, Reference Garrido-Pozú2024; Miwa et al., Reference Miwa, Dijkstra, Bolger and Baayen2014; Taylor & Mukai, Reference Taylor and Mukai2023).
Although the present findings demonstrate CLI across a range of L2 proficiencies, the results may not generalize to all bilingual populations. Participants here were primarily L1-dominant, Japanese–English bilinguals residing in an L1 context. Highly balanced bilinguals, bilinguals immersed in an L2-dominant environment, or individuals with substantially earlier and more sustained L2 exposure may exhibit different patterns of co-activation or competition dynamics. In immersion contexts, for example, increased resting activation levels of L2 representations could reduce the asymmetries predicted by the Revised Hierarchical Model or alter the timing of cross-linguistic effects. Future research examining bilinguals across dominance profiles, language-use environments, and modality-specific proficiency measures (e.g., listening comprehension) would help elucidate the lower limits of these auditory cross-linguistic effects.
A final goal was to determine whether cross-linguistic effects differ over time, examining the time course of auditory processing to the extent possible without using priming, the visual world paradigm, or neuroimaging techniques. When RTonset and RToffset analyses are compared, the same effects overall affected processing in both analyses, showing it is possible, at least to some extent, to compare findings from studies that measured response times from stimulus onset (e.g., Ernestus & Cutler, Reference Ernestus and Cutler2015; Ferrand et al., Reference Ferrand, Méot, Spinelli, New, Pallier, Bonin, Dufau, Mathôt and Grainger2018; Tucker et al., Reference Tucker, Brenner, Danielson, Kelley, Nenadic and Sims2019) with findings from those measuring from offset (e.g., Munson et al., Reference Munson, Swenson and Manthei2005; Taler et al., Reference Taler, Aaron, Steinmetz and Pisoni2010).
A few key differences were observed in this study, however. First, the language dependence of phonological similarity at RTonset suggests phonological representations play a larger role early in the process, a finding which is consistent with the predictions of the BIA+ as well as the results of Taylor and Mukai (Reference Taylor and Mukai2023). Further, the marginally significant Language:PreviousRToffset interaction (p = .06) in the RToffset analysis suggests that participants’ later cognitive processes and response patterns may be affected by local speed effects more in Japanese than in English. This may be due in part to differences in post-lexical processes in this task; participants may have greater automaticity in decision making in the dominant L1, compared to the less-dominant L2 in which they might be more cautious before pressing a response button.
Importantly, these findings extend and build upon bidirectional cross-linguistic effects found in isolated word reading with different-script bilinguals (Degani et al., Reference Degani, Prior and Hajajra2018; Kim & Davis, Reference Kim and Davis2003; Miwa et al., Reference Miwa, Dijkstra, Bolger and Baayen2014; Peleg et al., Reference Peleg, Degani, Raziq and Taha2020; Taylor & Mukai, Reference Taylor and Mukai2023; Voga & Grainger, Reference Voga and Grainger2007; Zhou et al., Reference Zhou, Chen, Yang and Dunlap2010) as well as spoken word experiments in which priming was not used (e.g., Garrido-Pozú, Reference Garrido-Pozú2024; Wu et al., Reference Wu, Chen, van Heuven and Schiller2019), corroborating evidence from priming and visual world studies (e.g., Gollan et al., Reference Gollan, Forster and Frost1997; Mishra & Singh, Reference Mishra and Singh2014; Nakayama et al., Reference Nakayama, Sears, Hino and Lupker2012). This study provides strong support for both the predictions of the BIA+ model and its extendibility to the auditory modality. There are substantial differences between reading and listening. In reading, orthography is first activated, while in listening, the process begins directly from sublexical phonology; in reading, all information typically becomes available at once, while in listening, information unfolds serially over a period of time; if the font is held standard, words look the same from one instance to the next during reading, while a spoken signal can vary considerably from instance to instance. Despite these discrepancies, the present findings indicate that the same basic properties laid out by BIA+, including CLI, importantly, affect bilingual activation in the two modalities.
8. Conclusion
The present study provides evidence for non-selective activation during spoken word recognition, even in the seemingly unlikely case of unbalanced bilinguals of relatively different languages (i.e., Japanese and English) living in an L1 context, and even when priming or visual world methods are not used. This is the first behavioral study to directly compare L1 and L2 listening in this way, testing the exact same individuals and items (i.e., cognates), and comparing models fitted to RTonset and RToffset to compare the time course of bilingual-specific effects in each language directly. CLI was present for bilinguals regardless of their L2 proficiency. In particular, cross-linguistic phonological and semantic similarities facilitated processing, while later-arising cognate word frequency slowed processing in both languages. The current findings reflect those from the visual modality, suggesting bilingual non-selective activation – and aspects of its time course – overlap in several ways across word reading and listening.
Data availability statement
Stimuli, data, and analysis code for this study are openly available at: https://osf.io/g2fv4/.
Acknowledgements
This research was supported by a Pache Research Subsidy 1-A-2 for the 2024 academic year from Nanzan University to Jamie Taylor. The author is grateful to Remi Murao for helpful feedback on drafts of this article.
Competing interests
The author declares none.
Appendix A
Participant self-ratings of daily language use and English proficiency

Table A1. Long description
The table is organized into three main sections with columns for Mean, S D, and Range.
1. Proportion of current daily language exposure in percent:
* Japanese: Mean 71.92, S D 15.20, Range 40 to 100.
* English: Mean 25.61, S D 18.12, Range 0 to 80.
2. Proportion of time participants prefer to use each language in percent:
* Speaking Japanese: Mean 70.66, S D 22.31, Range 10 to 100.
* Speaking English: Mean 24.84, S D 18.87, Range 0 to 80.
* Reading Japanese: Mean 75.45, S D 24.00, Range 10 to 100.
* Reading English: Mean 20.89, S D 22.08, Range 0 to 80.
3. Self-rated English proficiency on a scale of 0 to 10:
* Speaking: Mean 4.01, S D 1.94, Range 2 to 8.
* Listening: Mean 4.89, S D 1.93, Range 2 to 9.
* Reading: Mean 5.29, S D 1.80, Range 2 to 9.
Note: Percentages do not always sum to 100% as a small number of participants reported limited knowledge or use of additional languages beyond Japanese or English. Participants overwhelmingly reported greater daily exposure to, and stronger preferences for using, Japanese. Because Japanese was the dominant language for these participants, and in line with related studies (e.g., Miwa et al., Reference Miwa, Dijkstra, Bolger and Baayen2014; Taylor & Mukai, Reference Taylor and Mukai2023), no separate L1 proficiency test was administered. Future work may benefit from including a formal L1 proficiency measure to complement these self-reported indices of language dominance.
Appendix B
Target words and pseudowords included in this study

Table B1. Long description
The table is divided into two primary sections.
1. Target Words: This section contains real English words and their katakana counterparts. Examples from the first few rows include ‘accent’ (アクセント), ‘account’ (アカウント), ‘advance’ (アドバンス), and ‘advantage’ (アドバンテージ). The list continues through various nouns and adjectives such as ‘business’ (ビジネス), ‘chocolate’ (チョコレート), ‘emergency’ (エマージェンシー), and ‘witness’ (ウィットネス).
2. Pseudowords: This section contains invented English-like strings and their katakana transliterations. Examples include ‘aurent’ (オーレント), ‘acceine’ (アクセアイイン), ‘adhalls’ (アドホールズ), and ‘agsantays’ (アグサンテーズ). Other examples include ‘flicket’ (フリケット), ‘moontail’ (ムーンテール), and ‘vicket’ (ビケット).
Each section is organized into four columns. Columns 1 and 3 list the English item, while columns 2 and 4 list the corresponding Japanese katakana item. The table serves as a linguistic stimulus set for cross-language study.
Note. Items tested in this study include 250 English items originally sampled by Miwa et al. (Reference Miwa, Dijkstra, Bolger and Baayen2014) and their Japanese katakana equivalents used by Taylor and Mukai (Reference Taylor and Mukai2023). The original stimuli were selected from the English Lexicon Project (Balota et al., Reference Balota, Yap, Cortese, Hutchison, Kessler, Loftis, Neely, Nelson, Simpson and Treiman2007) according to frequency and length criteria and further screened for concreteness and familiarity. Although a few items (e.g., complaint, courtesy, personnel) include more than one morpheme, they were retained for consistency with these established stimulus sets and to ensure comparability across studies. Full details on lexical characteristics (e.g., L1 and L2 frequency, length, concreteness/imageability, and phonological overlap measures such as Levenshtein distance) are reported in those studies.
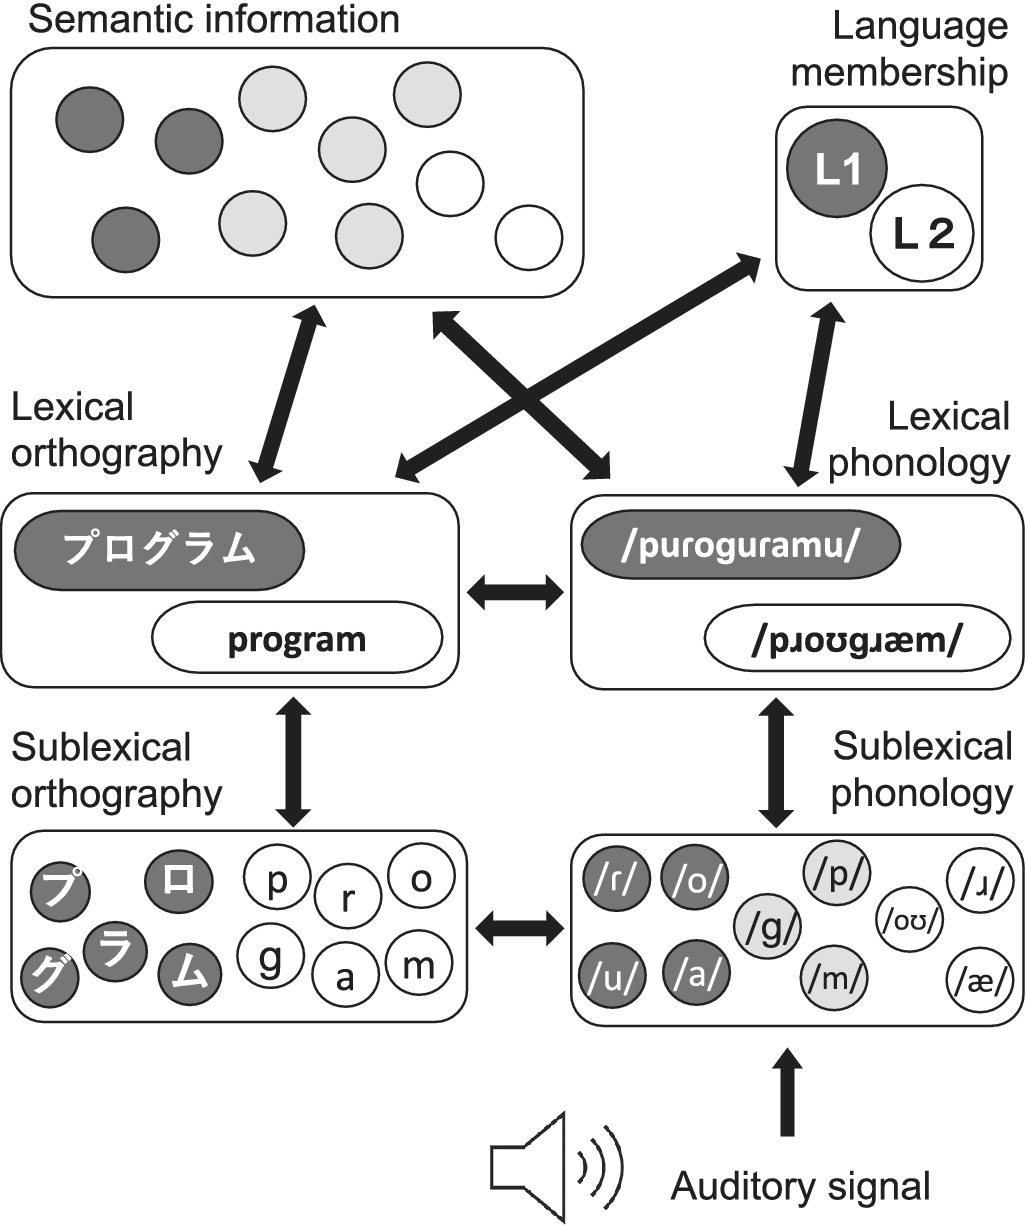

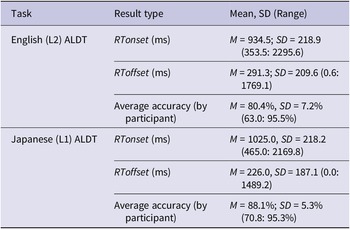
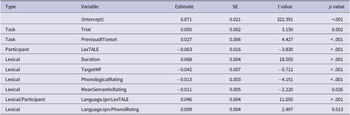


 Open access

