

Introduction
Central to an understanding of evolution in sea-ice characteristics in response to climate change is an understanding of sea-ice dynamics. This includes the accompanying implications for ocean-atmosphere heat and moisture exchange associated with the development of leads and polynyas, freshwater transport associated with changes in ice drift, and ice-drift response to relative changes in ice age, thickness and regional atmospheric circulation. An accurate representation of sea-ice drift and deformation is essential in modeling ocean-sea-ice-atmosphere interactions, nutrient and contaminant transport in ice-covered waters, and in ice hazard assessments relevant to shipping and transportation. Sea-ice concentration, from satellite remote sensing, and ice charts provide a qualitative interpretation of ice coverage on daily to fortnightly timescales. A complementary index that defines sea-ice dynamical regimes would provide valuable information as to how ice moves within a given ice regime. In this study we develop such an index based on scaling laws computed from single-particle dispersion statistics derived from ice buoy trajectories in the Beaufort Sea and central Arctic.
Previous studies have used Lagrangian dispersion statistics to quantify sea-ice drift and deformation in the context of turbulence and power law exponents (Reference MartinMartin and Thorndike, 1985; Reference Rampal, Weiss, Marsan, Lindsay and SternRampal and others, 2008, Reference Rampal, Weiss and Marsan2009; Reference LukovichLukovich and others 2011). Early studies by Reference MartinMartin and Thorndike (1985) illustrated the correspondence between absolute dispersion (described below, Eqn (1)) and deformation. Reference Rampal, Weiss, Marsan, Lindsay and SternRampal and others (2008, Reference Rampal, Weiss and Marsan2009) highlight, based on absolute dispersion statistics, integral timescales (described below, Eqn (3), 1.5 days in winter and 1.3 days in summer), and diffusivity values comparable to those of the upper ocean and characteristic of a turbulent diffusive regime. Departures from turbulent diffusion evident in intermittent velocity and acceleration fields are attributed to evolution in fracturing of the ice cover (Reference Rampal, Weiss and MarsanRampal and others, 2009).
Absolute dispersion, for a single particle or ice buoy, in an ensemble of buoys is defined as (Reference TaylorTaylor, 1921)
for xi , the zonal and meridional location of the ith particle/ buoy in the ensemble as a function of elapsed time, t. Angle brackets denote ensemble averaging. The absolute dispersion monitors organized structure and topological features in the flow field, including elliptic, hyperbolic and diffusive regimes, as is described further below. Temporal scaling laws can be determined from absolute dispersion as a function of elapsed time to the power α,
The value of a provides a characterization of flow dynamics: α = 1 corresponds to a diffusive regime characteristic of random motion; α > 1 to a super-diffusive regime including subcategories where α = 2 corresponds to a ballistic regime; α = 5/3 to an elliptic regime; α = 5/4 to a hyperbolic regime; and α < 1 to a sub-diffusive or ‘trapping’ regime (Majda and Kramer, 1999).
The scaling exponent α, and hence interpretation of dynamical regimes using this metric, is related to the Lagrangian integral timescale

is the correlation coefficientfor Lagrangian velocities and Vis the difference between the Lagrangian velocity and ensemble average. According to Taylor’s theorem (Reference TaylorTaylor, 1921) for short times, t≪T L absolute dispersion is governed by ballistic (α = 2) scaling while particles/buoys have memory of their initial velocities and are characterized by linear root-mean-square displacements. For long times, t ≫ T L absolute dispersion is governed by diffusive scaling as particles/buoys lose memory of their initial velocities and follow random walks. Since Lagrangian integral timescales are on the order of 1-2 days for both the perennial (Reference Rampal, Weiss and MarsanRampal and others, 2009) and seasonal (Reference LukovichLukovich and others, 2011) ice regimes, and sea-ice travel times in the central Arctic are on the order of several years (Reference Pfirman, Haxby, Colony and RigorPfirman and others, 2004), emphasis in our study is on the intermediate time regime during which anomalous diffusion, as captured by Eqn (2), occurs.
Central to this investigation is correspondence between the scaling exponent a and flow topology (Table 1). In particular, the super-diffusive regime (α>1) captures long-range correlations and absence of a well-defined Lagrangian integral timescale. Coherent structure in the flow field is depicted by ballistic scaling (α = 2). The flow field may have strain-dominated (hyperbolic) or vorticity-dominated (elliptic) regimes, as shown in previous studies of turbulence to yield scaling exponents (α = 5/4 and α = 5/3, respectively (Reference Elhmaïdi, Provenzale, Babiano and fromElhmaïdi and others, 1993)). A purely diffusive regime has α=1. The sub-diffusive regime and trapping (α<1) capture oscillatory behavior in the Lagrangian velocity field such that the integral timescale vanishes, whereas the diffusive regime indicates correlations over a finite range, a well-defined timescale and provides a signature of random walks.
Correspondence between flow regimes, scaling exponent α values and sea-ice characteristics
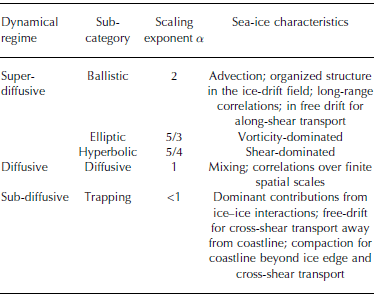
In the context of ice dynamics, super-diffusion captures long-range correlations and organized structure in the flow field unimpeded by diffusive energy losses such as through ice mechanics, with ballistic, elliptic and hyperbolic regimes providing signatures of advection, vorticity-dominated and shear-dominated flow respectively associated with coherent entities such as the Beaufort Gyre, mesoscale eddies and Transpolar Drift (TPD) stream. Diffusion captures mixing and independent random walks as in Brownian motion such as in the marginal ice zone; sub-diffusive behavior and trapping characterize dominant contributions from ice mechanics, ice-ice interactions and compaction that suppresses kinetic energy. As sea-ice motion is driven by a seasonally and regionally changing balance in ocean and atmosphere forces (which are vorticity-dominated) and ice-ice interaction that is dissipative and results in shear response to coastal and ice-pack boundaries, sea-ice drift can demonstrate all possible temporal scaling behaviours.
Information from the scaling laws can be used to map super-diffusive (ballistic, elliptic or hyperbolic), diffusive and sub-diffusive regimes associated with ice conditions for intermediate timescales (ranging from several days to years). Ice in free drift is encapsulated by: ballistic dispersion when ice buoys move in the direction of travel (i.e. anticyclonic circulation associated with the Beaufort Gyre and advection associated with the TPD stream); diffusive behavior and mixing near the ice edge and marginal ice zone where floes follow independent random walks; and sub-diffusive scaling for inertial oscillations (the magnitude of which was shown by Reference Gimbert, Marsan, Weiss and BarnierGimbert and others (2012) to correspond spatially with patterns in sea-ice concentrations and thickness) and cross-shear transport unimpeded by coastlines beyond the ice edge that result in ice-ice interactions. Compaction is characterized by sub-diffusive behavior: as buoys transition to a thicker, more heterogeneous ice cover; and for motion perpendicular to the direction of travel and cross-shear transport in the presence of a coastline or other barrier resulting in ice-ice interactions (i.e. perpendicular to the anticyclonic circulation of the Beaufort Gyre and TPD advection).
Previous studies of sea-ice deformation (ice motion gradients) have documented spatial scaling laws for sea-ice deformation magnitude ![]() , where Ḋ and ṡ refer to the divergence and shear rates, respectively, with a multi-fractal interpretation (Reference Marsan, Stern and LindsayMarsan and others, 2004; Reference Rampal, Weiss, Marsan, Lindsay and SternRampal and others 2008; Reference Hutchings, Heil and SteerHutchings and others, 2012). Mean deformation decreases with increasing distance, L, across the Arctic and all seasons, following a spatial scaling law
, where Ḋ and ṡ refer to the divergence and shear rates, respectively, with a multi-fractal interpretation (Reference Marsan, Stern and LindsayMarsan and others, 2004; Reference Rampal, Weiss, Marsan, Lindsay and SternRampal and others 2008; Reference Hutchings, Heil and SteerHutchings and others, 2012). Mean deformation decreases with increasing distance, L, across the Arctic and all seasons, following a spatial scaling law ![]() associated with a given length scale L, with values for the spatial scaling exponent H of 0.18 found in winter (Reference Marsan, Stern and LindsayMarsan and others, 2004), and ranging from 0.25 to 0.45 for summer (low concentration of multi-year ice (MYI)) and 0.2 for winter (high concentration of MYI) conditions (Reference Stern and LindsayStern and Lindsay, 2009). Reference HutchingsHutchings and others (2011) also show that for the relation
associated with a given length scale L, with values for the spatial scaling exponent H of 0.18 found in winter (Reference Marsan, Stern and LindsayMarsan and others, 2004), and ranging from 0.25 to 0.45 for summer (low concentration of multi-year ice (MYI)) and 0.2 for winter (high concentration of MYI) conditions (Reference Stern and LindsayStern and Lindsay, 2009). Reference HutchingsHutchings and others (2011) also show that for the relation ![]() , with γ the temporal scaling exponent, pack ice in winter displays divergence characteristics that fall between red (γ = 2) and white (γ = 1) noise behavior depending on the spatial scale over which deformation is measured. Sea-ice dispersion and deformation were shown in spatial and temporal scaling analyses of sea-ice drift in the Arctic by Reference Rampal, Weiss, Marsan, Lindsay and SternRampal and others (2008) and Reference Marsan, Weiss, Metaxian, Grangeon and HaapalaMarsan and others (2011) to be dependent both on temporal and spatial scales indicative of spatio-temporal coupling and characteristic of fracturing. In particular, Reference Rampal, Weiss, Marsan, Lindsay and SternRampal and others (2008) illustrated that for the deformation rate power law
, with γ the temporal scaling exponent, pack ice in winter displays divergence characteristics that fall between red (γ = 2) and white (γ = 1) noise behavior depending on the spatial scale over which deformation is measured. Sea-ice dispersion and deformation were shown in spatial and temporal scaling analyses of sea-ice drift in the Arctic by Reference Rampal, Weiss, Marsan, Lindsay and SternRampal and others (2008) and Reference Marsan, Weiss, Metaxian, Grangeon and HaapalaMarsan and others (2011) to be dependent both on temporal and spatial scales indicative of spatio-temporal coupling and characteristic of fracturing. In particular, Reference Rampal, Weiss, Marsan, Lindsay and SternRampal and others (2008) illustrated that for the deformation rate power law ![]() and
and ![]() with β the spatial scaling exponent, γ provides a signature of intermittency and β a signature of spatial heterogeneity, and moreover that dispersion increases as deformation decreases. Here it was also shown that for temporal scaling laws for the deformation rate determined from two-particle statistics (pair dispersion) the exponent depends also on spatial scales, highlighting the nature of spatio-temporal coupling in sea-ice motion gradients. In the present study, temporal scaling laws are used to identify distinct topological features in the ice-drift field such that sub-diffusive, diffusive and super-diffusive regimes provide a temporal and spatial signature of: oscillatory motion and regular orbits, a finite decorrelation time and mixing, and the absence of a Lagrangian timescale due to long-range correlations and organized structure in the flow field, respectively.
with β the spatial scaling exponent, γ provides a signature of intermittency and β a signature of spatial heterogeneity, and moreover that dispersion increases as deformation decreases. Here it was also shown that for temporal scaling laws for the deformation rate determined from two-particle statistics (pair dispersion) the exponent depends also on spatial scales, highlighting the nature of spatio-temporal coupling in sea-ice motion gradients. In the present study, temporal scaling laws are used to identify distinct topological features in the ice-drift field such that sub-diffusive, diffusive and super-diffusive regimes provide a temporal and spatial signature of: oscillatory motion and regular orbits, a finite decorrelation time and mixing, and the absence of a Lagrangian timescale due to long-range correlations and organized structure in the flow field, respectively.
In this study we thus address spatio-temporal coupling from the perspective of single-particle dispersion statistics to identify coherent ice-drift features characteristic of distinct dynamical regimes. Whereas previous studies (Reference Stern and LindsayStern and Lindsay, 2009) examined spatial scaling maps, in the present analysis we determine the spatial and temporal intervals over which scaling laws for absolute dispersion are defined to construct temporal scaling maps highlighting dynamical regimes associated with the scaling exponent a (i.e. super-diffusion (α>1), diffusion (α∼1) and sub-diffusion (α<1)). We address, in particular, two questions:
1. What are the scaling laws for perennial and seasonal ice zone regimes based on absolute dispersion statistics?
2. Are there regional differences in temporal scaling?
The results from this analysis will provide a framework for the characterization of pack ice based on sea-ice dynamical regimes as an alternative to ice type and concentration characterization, with implications for improved understanding of sea-ice drift and deformation in the Arctic relevant for ice hazard and environmental assessments.
Data and Methods
Ice buoy data used in the present analysis include high-frequency (10min interval) data from the Sea Ice Experiment: Dynamic Nature of the Arctic (SEDNA) field campaign (Reference Hutchings and HiblerHutchings and Hibler, 2008), and (3 hourly) data from the International Polar Year - Circumpolar Flaw Lead (IPY-CFL) study (Reference BarberBarber and others, 2010) with ice buoy deployments in the perennial and seasonal ice regimes, respectively. Daily averages are computed to allow for comparison between the two datasets. Two case studies are evaluated: the first includes comparison of temporal scaling laws and maps for seven buoys from the SEDNA and five buoys from the IPY-CFL campaigns, from 19 November 2007 to 22 May 2008, denoted as the IPY-CFL time frame; the second includes the duration of the SEDNA field campaign for 12 buoys from March 2007 to January 2009, denoted as the SEDNA time frame. A subset of buoys was selected for the IPY-CFL time frame that overlapped in duration with the SEDNA buoy data.
Single-particle dispersion is computed according to Eqn (1), both from 19 November 2007 to 22 May 2008 to encompass the IPY-CFL ice buoy data, and for the duration of the SEDNA campaign, from March 2007 to January 2009. In the present study, an index for sea-ice dynamical regimes is established through identification of temporal scaling laws for absolute dispersion from Eqn (2), A2∼tα ,and, in particular, the scaling exponent α derived from absolute zonal (A2 x ), meridional (A2 y) and total (A2 x + A2 y) dispersion statistics computed for all buoys as a function of elapsed time. Intervals associated with distinct scaling laws and dynamical regimes are determined from critical points, defined as points at which the first derivative in absolute dispersion vanishes (namely when the product of the forward and backward finite difference for dispersion is negative), for the zonal, meridional and total absolute dispersion. The scaling power, α, is determined from slopes in log-log plots of dispersion versus elapsed time, relative to the starting point, for these intervals. The ensemble values for the scaling power are then mapped along buoy tracks, as temporal scaling maps. From these we identify spatially-coherent dynamical regimes and thus provide a spatio-temporal interpretation of sea-ice drift in the Beaufort Sea and High Arctic. A 15 day filter was applied to the zonal, meridional and total absolute dispersion in order to smooth synoptic temporal variability. Consistency is found in scaling regimes (i.e. (sub-)diffusive, ballistic, elliptic or hyperbolic) over longer intervals that include sub-intervals defined by critical points such that robust sub-intervals exist between critical points.
Physical sea-ice characteristics are identified using the US National Oceanic and Atmospheric Administration (NOAA) National Ice Center/Naval Ice Center weekly ice charts (Reference Fetterer and FowlerFetterer and Fowler, 2009) for the High Arctic and Beaufort Sea (http://www.natice.noaa.gov/products/weekly_products.html ) and Canadian Ice Service ice charts (CIS, 2009) to ascertain seasonal and perennial ice zones (SIZs and PIZs) in the vicinity of the buoy trajectories. In the present analysis, seasonal and perennial ice zones refer to regions where FYI and MYI dominate (are the principal ice types), respectively, following Reference Kwok, Tsatsoulis and KwokKwok (1998). PIZs, as indicated in the figures, refer to regions where MYI exceeds 80% partial ice concentration, following Reference Stern and LindsayStern and Lindsay (2009). We identify seasonal and perennial ice zones from the ice charts, to investigate how spatial changes in dispersion relate to varying ice conditions, enabling determination as to how traditional sea-ice zones based on sea-ice type and concentration correspond to the sea-ice dynamical regimes in the Beaufort Sea and High Arctic.
Results
IPY-CFL time frame: 19 November 2007 to 22 May 2008
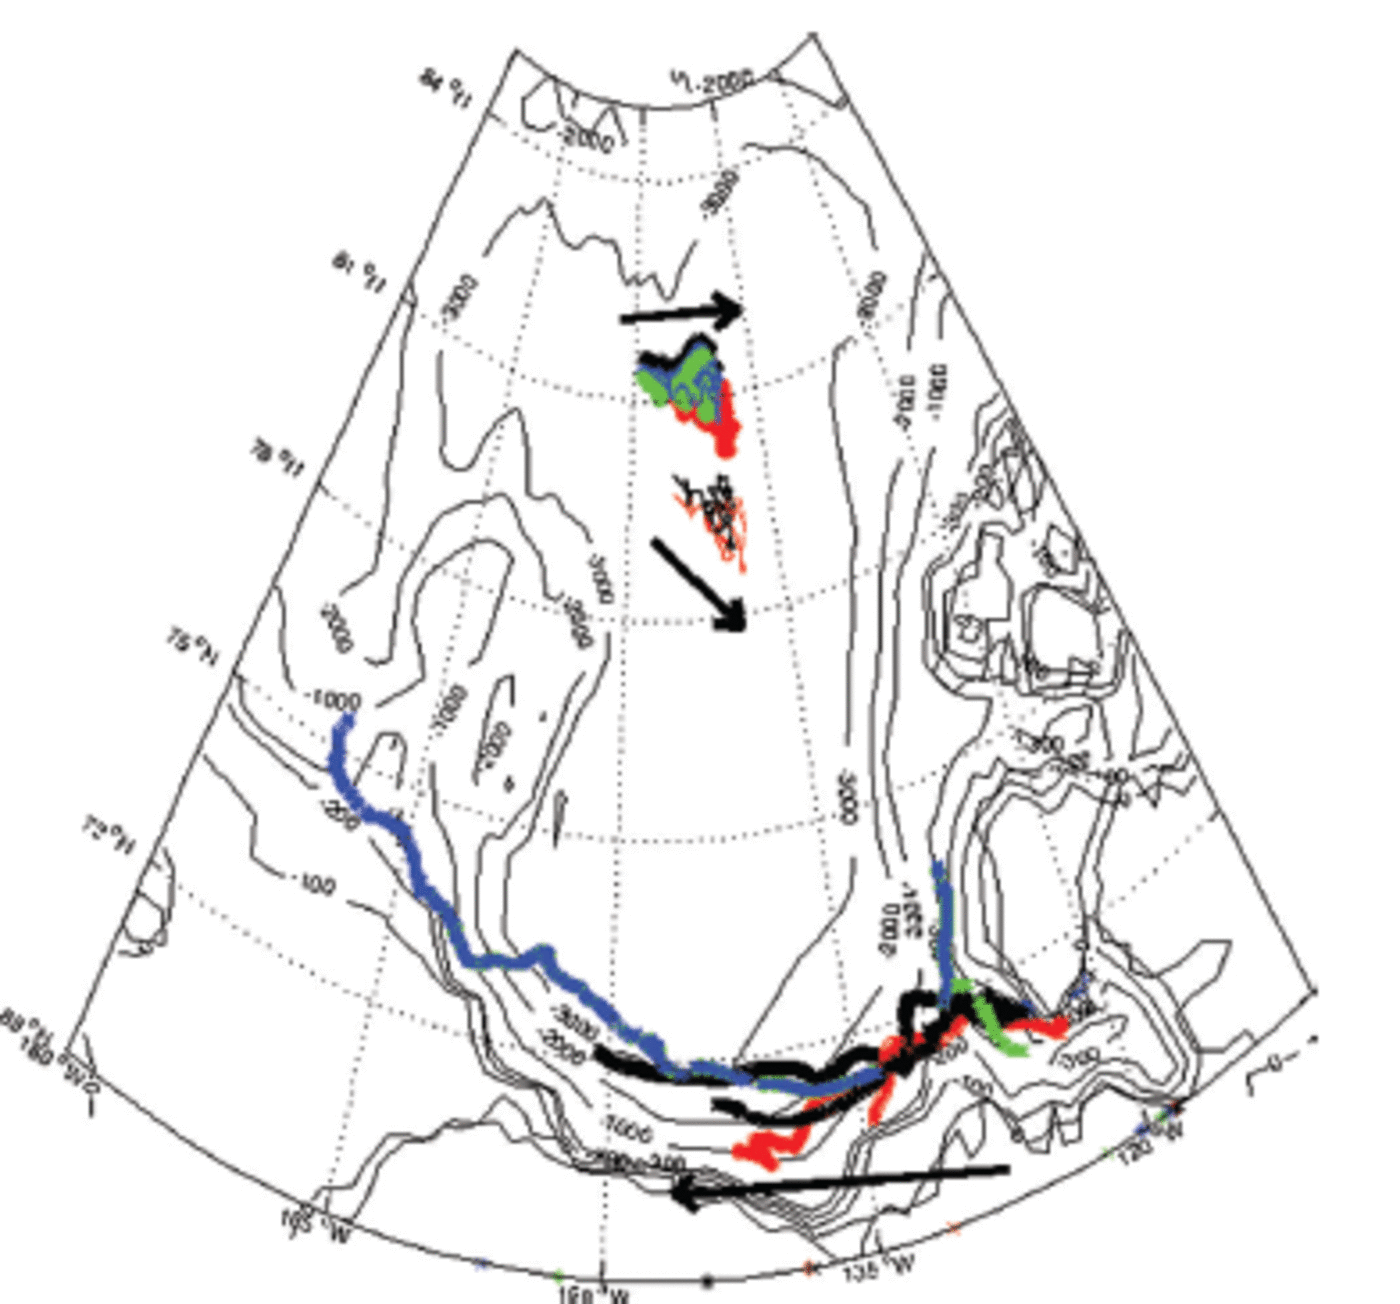
In this section we compare dispersion in the seasonal ice zone (SIZ) and perennial ice zone (PIZ) using data from the SEDNA and IPY-CFL campaigns. SEDNA ice buoy trajectories for the IPY-CFL time frame exhibit two distinct clusters located at the northeast segment of the Beaufort Gyre (Fig. 1) between 135°W and 144°W and (i) between 78°N and 80°N and (ii) between 80°N and 82°N. IPY-CFL buoys located in the SIZ in the southern Beaufort Sea exhibit westward advection at the southern segment of the Beaufort Gyre. During the IPY-CFL time frame, all SEDNA buoys move as a coherent entity in both the zonal and meridional directions throughout differing ice regimes, in contrast to the IPY-CFL buoys located in the seasonal ice zone in the southern Beaufort Sea (Fig. 1).
Seven SEDNA and five IPY-CFL ice buoy trajectories for IPY-CFL experiment duration, from 19 November 2007 to 22 May 2008. The upper two clusters depict SEDNA buoy trajectories, and the lower cluster IPY-CFL buoy trajectories. Black arrows depict mean buoy drift direction. Ocean bathymetry (NOAA National Geophysical Data Center (NGDC)) is shown for 100 m, 200 m, ..., 3000m depth contours.
Total absolute dispersion for all SEDNA buoys is initially governed by zonal dispersion in the PIZ until 10 December 2007 (day 20 relative to the 19 November 2007 start date) and increasingly by meridional dispersion due to the northward and southward migration of both buoy clusters within a region characterized by FYI and MYI (Fig. 2a). In the PIZ, total dispersion in the northern cluster at the periphery of the Beaufort Gyre is governed by zonal dispersion until mid-December, following which meridional dispersion dominates (Fig. 2b). In the southern cluster, total dispersion is governed primarily by meridional dispersion, with intervals of dominant zonal contributions as buoys encounter a more heterogeneous ice cover of FYI and MYI during their southward migration along the eastern segment of the Beaufort Gyre interior. Enhanced meridional and vanishing zonal dispersion near 3 May 2008 (day 140) reflects the meridional ‘branching’ of the buoy paths associated with the northern and southern clusters that eventually lead separately to the northward trajectory and the southern closed loop trajectories.
Zonal, meridional and total absolute dispersion for the northern and southern paths/clusters of the SEDNA buoy trajectories during the IPY-CFL time frame for (a) all SEDNA, (b) northern and southern SEDNA buoy clusters/paths, and (c) IPY-CFL buoys launched in the SIZ during the IPY-CFL time frame.

By contrast, total absolute dispersion in the SIZ in the southern Beaufort Sea for the IPY-CFL buoys is dominated by zonal dispersion for the duration of the experiment, with a gradual decrease in the slope as ice buoys encounter the FYI/MYI regime following December 2007 (day 20), and a decrease (increase) in zonal (meridional) dispersion as ice buoys encounter the MYI regime in early May (Fig. 2c).
Scaling maps of zonal, meridional and total absolute dispersion from 19 November 2007 to 22 May 2008 exhibit distinct dynamical regimes (Fig. 3). Total dispersion for the SEDNA buoys is governed by meridional dispersion and super-diffusive scaling, with ballistic scaling in the northern cluster, and scaling exponents characteristic of acceleration (α>2) in the southern cluster (Fig. 3b), highlighting the earlier onset of meridional dispersion as the buoys begin their trajectory along the eastern segment of the Beaufort Gyre within a regime consisting of both MYI and FYI. Sub-diffusive behaviour is observed near day 100 (late February 2008) at 80° N, 137° W. By contrast, temporal scaling maps for total dispersion of the IPY-CFL buoys in the seasonal ice zone are governed by zonal dispersion (Fig. 3a), with a scaling exponent on the order of α ∼ 1 . 2 indicative of a hyperbolic (α = 5/4) regime associated with anticyclonic circulation and shear at the southern periphery of the Beaufort Gyre. Of interest in the scaling maps for total absolute dispersion is the transition to a diffusive regime as the ice buoys encounter regions dominated by MYI.
Scaling maps for (a) zonal, (b) meridional and (c) total absolute dispersion depicting scaling exponent a from Eqn (2), with transitions defined according to absolute dispersion critical points, in addition to (d) elapsed time (days) for the duration of the IPY-CFL experiment.

More specifically, temporal scaling maps for zonal dispersion of the IPY-CFL buoys exhibit hyperbolic (α = 5/4 ∼ 1.2) behaviour until 22 January 2008 (day 64) in the SIZ and FYI/MYI regimes, and ballistic dispersion until 2 March 2008 (day 105), following which sub-diffusive behavior is observed as ice buoys encounter MYI. Meridional scaling maps capture accelerated dispersion (α>2) until 2 January 2008 (day 44), followed by sub-diffusive scaling until 20 March 2008 (day 123) for all ice regimes, and ballistic scaling until May 2008. Total dispersion is initially characterized by ballistic scaling (as would be expected in a state of free drift and in the absence of internal ice forces) and is governed predominantly by zonal dispersion with scaling exponents of a∼ 1.2 until 2 March 2008, following which, as for the case of zonal dispersion, sub-diffusive behavior characteristic of trapping occurs as buoys encounter MYI.
Drift of SEDNA buoys, March 2007 to January 2009
During the SEDNA field campaign, sea-ice drift is characterized by anticyclonic circulation associated with the Beaufort Gyre (Fig. 4). Buoys launched between 72°N and 75°N, in March 2007, travel northwards through summer and bifurcate near 80°N, 140°W in summer 2008 to follow one of two possible paths: (1) to higher latitudes, with some buoys reaching 84°N, or (2) a return in the Beaufort Gyre (anticyclonic circulation) to lower latitudes. We thus analyse absolute dispersion statistics for all SEDNA buoys, as well as for buoys comprising the southern (buoys 8 and 9) and northern (buoys 1–7, 10 and 11) paths separately (Fig. 5), hereinafter referred to as SP and NP, respectively.
Daily evolution in 12 ice buoy trajectories from SEDNA field campaign from March 2007 to January 2009, shown relative to the 24 March 2007 start date. Also depicted are the perennial ice zone (PIZ; MYI>80%) at the southern and western segments of the Beaufort Gyre traversed by the buoys from March to November 2007; ice edge at the periphery of the PIZ encountered by buoys in September 2007; perennial ice zone (PIZ < 80%) as buoys traverse a first-year ice intrusion from the west from December 2007 to March 2008; and a FYI/MYI regime encountered by buoys in northern and southern paths in summer 2008. Arrows in black depict the mean drift direction.

Ensemble-averaged zonal, meridional and total absolute dispersion and ice regimes, as background color, for duration of SEDNA experiment (March 2007 to January 2009) for (a) all and (b) north (solid lines) and south (dashed lines) ice buoy paths. The vertical dashed line (Fig. 5a) marks 1 year from the initiation of SEDNA.
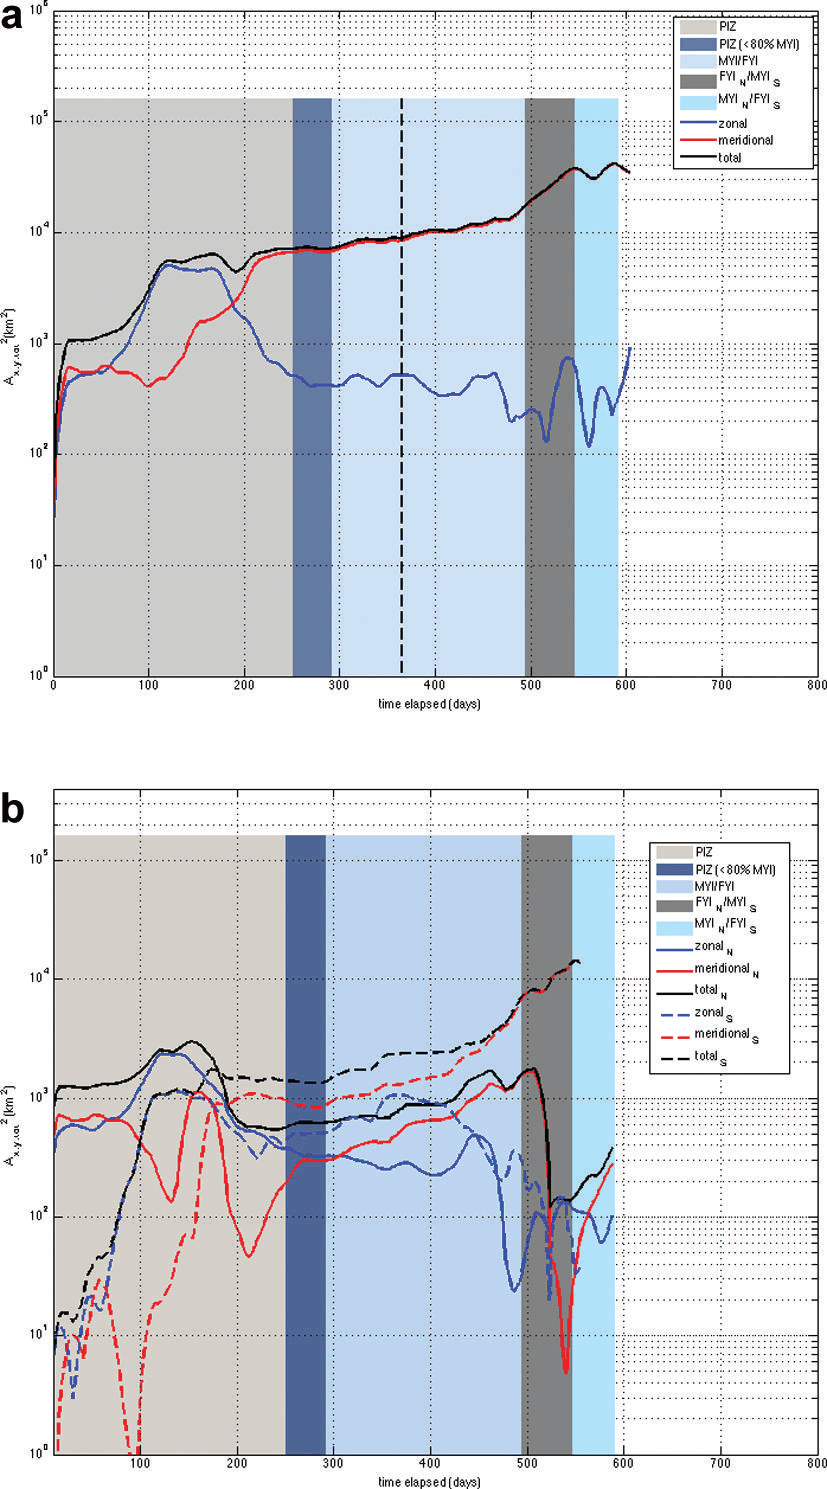
The SEDNA buoys were deployed in the PIZ. Zonal and meridional absolute dispersion statistics exhibit comparable behavior within the PIZ regime until late May (day 60) (Fig. 5a). Total absolute dispersion is governed by zonal dispersion from July to mid-September (days 100–180) and by meridional dispersion from early October 2007 onwards as MYI concentration reduces during summer and into fall. We consider the absolute dispersion of NP and SP buoys separately (Fig. 5b). Zonal and meridional absolute dispersion statistics for NP buoys in the PIZ, closer to the periphery of the Beaufort Gyre compared to SP buoys, demonstrate similar behavior until mid-June (day 90) (Fig. 5b). Total absolute dispersion is governed by zonal dispersion in July (days 100–130). The local minimum in meridional dispersion in mid-September (near day 130) depicts departures from the meridional ensemble mean, which we show later occurs when the ice buoys encounter the ice edge at the periphery of the ice pack in September 2007. The minimum at day 220 coincides with the NP ice buoy retreat to the interior of the MYI ice pack in November. Meridional dispersion dominates following mid-January 2008 (day 300) as the buoys encounter regions with less MYI.
For the SP buoys closer to the interior gyre, total dispersion is governed by zonal dispersion from early June to early September 2007 (days 70-160), and by meridional dispersion from 10 October 2007 (day 200) onwards which, in contrast to the NP buoys near the gyre periphery, follows the direction of travel. This feature combined with lower SP than NP dispersion suggests lower mobility within the gyre than at the gyre periphery, likely due to reduced ice-ice interaction and dynamic variability near the marginal ice zone and ice edge compared to the pack interior.
Inspection of NIC ice charts (NIC, 2009) shows that NP buoys at the periphery of the Beaufort Gyre encounter lower ((2/10)-(7/10)) ice concentration regimes of old ice in September 2007 (days 160-190) near 78° N, 160°W, associated with the ice edge (Fig. 4) during the 2007 minimum in sea-ice extent. Both the NP and SP buoys traverse a region characterized by perennial ice (MYI > 80%) along the southern and western segments of the Beaufort Gyre until late November (day 250). In late December (day 280) an intrusion of medium first-year and old (∼50%) ice moves into the Beaufort from the west, guiding the northern and southern paths along 140° W in May 2008. Both the NP and SP buoys subsequently experience a more heterogeneous ice cover consisting of medium and thick first-year and old ice near 81°N and 79° N, respectively, between 143° Wand 133° W until early August 2008 (day 494) (Fig. 4 and 5). NP buoys experience a lower ice-concentration regime consisting of thick first-year and old ice (<50%) until mid-September 2008, and regions dominated by old ice until December 2008. By contrast, the SP buoys experience a higher ice-concentration regime consisting primarily of old ice (>50%) associated with the tongue of MYI in the southern Beaufort Sea until mid-September, and a mixture of first-year and old ice for the duration of the experiment.
As outlined in the methodology, the scaling power is estimated for distinct dynamic regimes along the ensemble of buoy tracks and is plotted as temporal scaling maps of zonal, meridional and total absolute dispersion (Fig. 6). These maps highlight regional differences in the sea-ice state and dynamical regimes at the interior and edge of the Beaufort Gyre. Temporal scaling laws for total dispersion of all SEDNA buoys (i.e. absolute dispersion computed using an ensemble consisting of all buoys) show that the southwestern segment of the Beaufort Gyre is governed by zonal dispersion, while the northern segment of the gyre and the northern branch are captured by meridional dispersion (Fig. 5a and 6a).
Temporal scaling maps for zonal, meridional and total absolute dispersion (with scaling intervals defined according to absolute dispersion critical points) depicting scaling exponent a from Eqn (2), in addition to elapsed time (days), for duration of SEDNA experiment for (a) all SEDNA buoys, and (b) NP and SP buoys depicting the surrounding region and the interior of the Beaufort Gyre, respectively.

Total dispersion for the NP buoys at the Beaufort Gyre periphery (i.e. dispersion is computed only for buoys 1-7, and 11 at the edge of the gyre; Fig. 6b) captures sub-diffusive (a< 1) zonal and meridional dispersion until June in the PIZ regime at the southern periphery of the Beaufort Gyre; dominant zonal dispersion near the southwestern periphery of the Beaufort Gyre characterized by super-diffusive and, in particular, ballistic (α∼2) and hyperbolic (α∼1.2) scaling until early August; sub-diffusive behaviour at the western periphery of the gyre when the summertime ice edge is attained in September 2007 that continues as ice buoys retreat to the interior of the MYI pack until 20 November 2007; and a diffusive regime associated with zonal dispersion prior to the splitting of the northern segment of the Beaufort Gyre into a northern and southern path. There is enhanced meridional dispersion (α>2) at high latitudes within a region consisting of FYI and MYI. Diffusive behavior for zonal and meridional dispersion near 78° N, 160°W in September 2007 further suggests that any directionality is lost as the pack enters free drift conditions near the ice edge.
The total dispersion for the SP buoys near the interior Beaufort Gyre (i.e. dispersion computed for buoys 8 and 9 for the closed loop configuration; Fig. 6b) captures super-diffusion and, in particular, dominant ballistic and accelerated zonal dispersion along the southern filament of the gyre (α>2) until late July 2007 and sub-diffusive behavior until late August 2007; enhanced meridional dispersion (α>2) until mid-September near 78° N, 150°W; sub-diffusive behavior characteristic of trapping at the northern periphery of the interior Beaufort Gyre within a MYI regime until April 2008 at 79° N, 141° W; and dominant meridional dispersion with intervals of ballistic and diffusive scaling as buoys encounter a heterogeneous ice cover relative to the ice regime encountered at the northern branch of the NP buoys (Fig. 6a and b) while advected southwards along the eastern segment of the Beaufort Gyre until December 2008. Of interest is the emergence of sub-diffusive scaling in zonal and meridional dispersion in November 2007 near 79° N, 141°W as the ice regime transitions to less MYI within the interior Beaufort Gyre (Fig. 6b), in a manner consistent with the diffusive behaviour that emerges at the periphery of the ice pack as the buoys encounter the ice edge in September 2007 (Fig. 6a).
Discussion and Conclusions
We have investigated spatio-temporal characteristics of sea-ice drift and state through development of temporal scaling maps to quantify distinct dynamical regimes using single-particle statistics. Addressed in particular is temporal scaling-law behaviour in perennial and seasonal ice zones, and whether there are other regional differences in temporal scaling maps highlighting the influence of sea-ice state and morphology on dispersion.
Absolute dispersion results for the IPY-CFL time frame show that different scaling properties exist for different ice zones at the same time of year, and that higher concentrations of MYI and a thicker, more compact ice cover coincide with lower scale power. In particular, dispersion in the SIZ, dominated by FYI, at the southern periphery of the Beaufort Gyre is governed by zonal dispersion, with hyperbolic (α∼5/4) scaling characteristic of shear until March 2008, following which sub-diffusive behavior characteristic of trapping emerges as the IPY-CFL buoys encounter MYI. By contrast, NP and SP clusters near the northern segment of the Beaufort Gyre follow super-diffusive scaling during their transition to a lower MYI concentration regime. IPY-CFL dispersion results further suggest that dispersion within the SIZ may be approximated or modeled by along-shear transport whereas MYI acts as a barrier to transport (for FYI interspersed within MYI). Comparison of the IPY-CFL and SEDNA dispersion statistics in the SIZ and PIZ regimes at the southern periphery of the Beaufort Gyre (Fig. 2c and 5) further highlights differences in dynamical characteristics for varying ice regimes.Absolute dispersion results for the SEDNA time frame from March 2007 to January 2009 capture seasonal behavior in ice drift evident in ballistic scaling in NP and SP paths near 80° N, 144° W following May 2008 as buoys transition to FYI and a state of increasing free drift, in a manner consistent with previous studies showing seasonality in spatial scaling exponents (Stern and Lindsay, 2009). Zonal and meridional dispersion are also shown to dominate in the direction of travel (southern and western segments, respectively) near the interior gyre characterized by SP buoys in contrast to the periphery characterized by NP buoys in summer 2007. Dispersion is amplified in both the NP and SP paths following May 2008 with increasing free drift.
We hypothesize that temporal scaling is related to compactness and strength of the ice pack, evidenced in sub-diffusive behavior in winter and the aforementioned ballistic behavior in summer. Temporal scaling maps characterized by a < 1 near the (1) southern periphery of the gyre from March to June2007, (2) western periphery from September to November 2007 and (3) northern segment of the gyre in January 2008 suggest that sub-diffusion at the edge of the Beaufort Gyre provides a signature of dominant cross-shear transport in the (1) meridional direction near the PIZ/SIZ interface in the southern Beaufort Sea in spring 2007 and (2) zonal direction with the emergence of the ice edge along the western periphery of the gyre in September 2007. Sub-diffusion in meridional dispersion at the northern segment of the interior Beaufort Gyre depicts a transition to a different ice regime characterized by less MYI and a more heterogeneous ice cover.
Results from this investigation highlight regional differences in absolute dispersion statistics, scaling laws and temporal scaling maps for the surrounding region and the interior of the Beaufort Gyre, and within the PIZ and SIZ ice regimes. As noted in the Introduction, we can use information from this analysis to map diffusive, super- and sub-diffusive regimes and, in particular, regions of ice that are shearing (hyperbolic, α = 5/4), in free drift (ballistic, α ∼ 2 for along-shear, and sub-diffusive, α < 1 for cross-shear transport) and under compaction (sub-diffusive, α <1 for a coastline located beyond the ice edge), together with the magnitude of dispersion. Ice in free drift is characterized by ballistic (sub-diffusive) scaling when dispersion is parallel (perpendicular) to the direction of travel, as was observed in the western segment of the Beaufort Gyre near the ice edge in September 2007 during the transition from a more compact to a looser ice cover. One advantage of this approach is that it does not rely on groups of two or more buoys to characterize dispersion, which limits scale analysis to the spatial scales defined by buoy separation. Instead an ensemble of individual buoys is analysed to quantify distinct dynamical features in the flow field. Noteworthy also are robust dynamical features that exist irrespective of initial location and start date, as evidenced in the sub-diffusive regime located near 79° N, 141°W in January determined from dispersion statistics computed relative to the March 2007 (SEDNA) and November 2007 (IPY-CFL) start date. Avenues for further investigation include the incorporation of additional datasets to expand spatial and temporal coverage and thus determine spatial variability in seasonality in temporal scaling exponents; cross-wavelet coherence analysis to monitor connectivity in the sea-ice cover following Reference HutchingsHutchings and others (2011); and numerical experiments to improve understanding of dispersion near the ice edge in the context of along- and cross-shear transport under varying ice conditions.
Acknowledgements
Buoy data were funded by the Canadian International Polar Year program office, the Natural Sciences and Engineering Research Council of Canada, the Canada Foundation for Innovation and partner organizations through support to the IPY-CFL study, and the US National Science Foundation (NSF OPP 0612527) through support to SEDNA. Funding for this study was also provided by the Canadian Networks of Centres of Excellence (NCE) program, and Canada Research Chairs (CRC) grant (D.G. Barber). J.K. Hutchings was supported by the Office of Naval Research (ONR Award N00014-06-1-0728). The NOAA National Ice Center/Naval Ice Center and Canadian Ice Service provided regional sea-ice charts. Bathymetry data were provided by the NOAA National Geophysical Data Center. We are grateful to the Chief Editor Petra Heil and Scientific Editor Kenneth Golden, and to two anonymous reviewers who helped clarify the manuscript.


