


1 Introduction
The mean effect of turbulence is the primary question in turbulent flows, and mean quantities in wall-bounded turbulent flows have been studied for centuries. Yet even for canonical flows, e.g. turbulent channel, pipe and boundary layer flows, predictions of mean profiles continue to remain a challenge (Marusic et al.
Reference Marusic, McKeon, Monkewitz, Nagib, Smits and Sreenivasan2010b
; Smits & Marusic Reference Smits and Marusic2013). There have been numerous theoretical attempts to predict the mean velocity scaling (Wosnik, Castillo & George Reference Wosnik, Castillo and George2000; Monkewitz, Chauhan & Nagib Reference Monkewitz, Chauhan and Nagib2007; Jones, Nickels & Marusic Reference Jones, Nickels and Marusic2008; L’vov, Procaccia & Rudenko Reference L’vov, Procaccia and Rudenko2008; Nagib & Chauhan Reference Nagib and Chauhan2008; Klewicki Reference Klewicki2013; Luchini Reference Luchini2017), but much fewer on the Reynolds stresses (including turbulence intensities
 $\overline{u^{\prime }u^{\prime }}$
,
$\overline{u^{\prime }u^{\prime }}$
,
 $\overline{v^{\prime }v^{\prime }}$
and
$\overline{v^{\prime }v^{\prime }}$
and
 $\overline{w^{\prime }w^{\prime }}$
in streamwise
$\overline{w^{\prime }w^{\prime }}$
in streamwise
 $x$
, wall-normal
$x$
, wall-normal
 $y$
and spanwise
$y$
and spanwise
 $z$
directions, respectively). For the stresses, an important conceptual model is the wall-attached hypothesis by Townsend (Reference Townsend1976). It suggests quantitative descriptions for turbulent eddies (in a statistical sense) and leads to constant profiles for active motions (
$z$
directions, respectively). For the stresses, an important conceptual model is the wall-attached hypothesis by Townsend (Reference Townsend1976). It suggests quantitative descriptions for turbulent eddies (in a statistical sense) and leads to constant profiles for active motions (
 $-\overline{u^{\prime }v^{\prime }}$
,
$-\overline{u^{\prime }v^{\prime }}$
,
 $\overline{v^{\prime }v^{\prime }}$
) and log profiles for inactive motions (
$\overline{v^{\prime }v^{\prime }}$
) and log profiles for inactive motions (
 $\overline{u^{\prime }u^{\prime }}$
,
$\overline{u^{\prime }u^{\prime }}$
,
 $\overline{w^{\prime }w^{\prime }}$
) in the bulk flow (Davidson et al.
Reference Davidson, Kaneda, Moffatt and Sreenivasan2011), i.e.
$\overline{w^{\prime }w^{\prime }}$
) in the bulk flow (Davidson et al.
Reference Davidson, Kaneda, Moffatt and Sreenivasan2011), i.e.
 $$\begin{eqnarray}\displaystyle & -\overline{u^{\prime }v^{\prime }}^{+}=B_{12}, & \displaystyle\end{eqnarray}$$
 $$\begin{eqnarray}\displaystyle & \overline{v^{\prime }v^{\prime }}^{+}=B_{22}, & \displaystyle\end{eqnarray}$$
 $$\begin{eqnarray}\displaystyle & \overline{u^{\prime }u^{\prime }}^{+}=B_{11}-A_{11}\ln y, & \displaystyle\end{eqnarray}$$
 $$\begin{eqnarray}\displaystyle & \overline{w^{\prime }w^{\prime }}^{+}=B_{33}-A_{33}\ln y, & \displaystyle\end{eqnarray}$$
where
 $A_{11}$
,
$A_{11}$
,
 $A_{33}$
,
$A_{33}$
,
 $B_{11}$
,
$B_{11}$
,
 $B_{12}$
,
$B_{12}$
,
 $B_{22}$
and
$B_{22}$
and
 $B_{33}$
are all constants,
$B_{33}$
are all constants,
 $+$
denotes values in wall units, and
$+$
denotes values in wall units, and
 $y$
is the wall distance normalized by half-channel height or pipe radius
$y$
is the wall distance normalized by half-channel height or pipe radius
 $R$
. This hypothesis has received acute attention recently (Marusic & Kunkel Reference Marusic and Kunkel2003; Davidson & Krogstad Reference Davidson and Krogstad2009; Meneveau & Marusic Reference Meneveau and Marusic2013; Vassilicos et al.
Reference Vassilicos, Laval, Foucaut and Stanislas2015; Laval et al.
Reference Laval, Vassilicos, Foucaut and Stanislas2017), and has been tested and even further developed against more accurate measurements – both DNS and experiment (Morrison, McKeon & Smits Reference Morrison, McKeon, Jiang and Smits2004; Hultmark et al.
Reference Hultmark, Vallikivi, Bailey and Smits2012; Rosenberg et al.
Reference Rosenberg, Hultmark, Vallikivi, Bailey and Smits2013; Sillero, Jimenez & Moser Reference Sillero, Jimenez and Moser2013; Lee & Moser Reference Lee and Moser2015; Willert et al.
Reference Willert, Soria, Stanislas, Klinner, Amili, Eisfelder, Cuvier, Bellani, Fiorini and Talamelli2017).
$R$
. This hypothesis has received acute attention recently (Marusic & Kunkel Reference Marusic and Kunkel2003; Davidson & Krogstad Reference Davidson and Krogstad2009; Meneveau & Marusic Reference Meneveau and Marusic2013; Vassilicos et al.
Reference Vassilicos, Laval, Foucaut and Stanislas2015; Laval et al.
Reference Laval, Vassilicos, Foucaut and Stanislas2017), and has been tested and even further developed against more accurate measurements – both DNS and experiment (Morrison, McKeon & Smits Reference Morrison, McKeon, Jiang and Smits2004; Hultmark et al.
Reference Hultmark, Vallikivi, Bailey and Smits2012; Rosenberg et al.
Reference Rosenberg, Hultmark, Vallikivi, Bailey and Smits2013; Sillero, Jimenez & Moser Reference Sillero, Jimenez and Moser2013; Lee & Moser Reference Lee and Moser2015; Willert et al.
Reference Willert, Soria, Stanislas, Klinner, Amili, Eisfelder, Cuvier, Bellani, Fiorini and Talamelli2017).
Although Perry & Chong (Reference Perry and Chong1982) and Perry, Henbest & Chong (Reference Perry, Henbest and Chong1986) further developed a derivation of the
 $\overline{u^{\prime }u^{\prime }}$
log profile by invoking the
$\overline{u^{\prime }u^{\prime }}$
log profile by invoking the
 $k_{x}^{-1}$
spectrum, such a spectrum was found only at small Reynolds number (
$k_{x}^{-1}$
spectrum, such a spectrum was found only at small Reynolds number (
 $Re_{\unicode[STIX]{x1D70F}}\leqslant 3300$
) in Princeton/ONR Superpipe (Rosenberg et al.
Reference Rosenberg, Hultmark, Vallikivi, Bailey and Smits2013); in contrast, the log profile of
$Re_{\unicode[STIX]{x1D70F}}\leqslant 3300$
) in Princeton/ONR Superpipe (Rosenberg et al.
Reference Rosenberg, Hultmark, Vallikivi, Bailey and Smits2013); in contrast, the log profile of
 $\overline{u^{\prime }u^{\prime }}$
is observed only at high Reynolds number (
$\overline{u^{\prime }u^{\prime }}$
is observed only at high Reynolds number (
 $Re_{\unicode[STIX]{x1D70F}}\geqslant 20\,000$
) (Hultmark et al.
Reference Hultmark, Vallikivi, Bailey and Smits2012). Also, for channels, Lee & Moser (Reference Lee and Moser2015) found the
$Re_{\unicode[STIX]{x1D70F}}\geqslant 20\,000$
) (Hultmark et al.
Reference Hultmark, Vallikivi, Bailey and Smits2012). Also, for channels, Lee & Moser (Reference Lee and Moser2015) found the
 $k_{x}^{-1}$
spectrum in their simulation (
$k_{x}^{-1}$
spectrum in their simulation (
 $Re_{\unicode[STIX]{x1D70F}}\approx 5200$
), but no log profile of
$Re_{\unicode[STIX]{x1D70F}}\approx 5200$
), but no log profile of
 $\overline{u^{\prime }u^{\prime }}$
. Thus, building the log profile on the
$\overline{u^{\prime }u^{\prime }}$
. Thus, building the log profile on the
 $k_{x}^{-1}$
spectrum is not well founded (Hultmark Reference Hultmark2012); we have an alternative explanation for the log profile as discussed later. In addition to the log profile (restricted in a narrow flow domain), composite formulae for the entire
$k_{x}^{-1}$
spectrum is not well founded (Hultmark Reference Hultmark2012); we have an alternative explanation for the log profile as discussed later. In addition to the log profile (restricted in a narrow flow domain), composite formulae for the entire
 $\overline{u^{\prime }u^{\prime }}$
profile were proposed by Marusic & Kunkel (Reference Marusic and Kunkel2003) and Smits (Reference Smits, Deville, Le and Sagaut2010) utilizing the wall-attached eddy concept. Panton (Reference Panton2007) postulated a
$\overline{u^{\prime }u^{\prime }}$
profile were proposed by Marusic & Kunkel (Reference Marusic and Kunkel2003) and Smits (Reference Smits, Deville, Le and Sagaut2010) utilizing the wall-attached eddy concept. Panton (Reference Panton2007) postulated a
 $\overline{u^{\prime }u^{\prime }}$
model for the entire channel flow using the composite asymptotic expansions, and Alfredsson, Segalini & Orlu (Reference Alfredsson, Segalini and Orlu2011), Alfredsson, Orlu & Segalini (Reference Alfredsson, Orlu and Segalini2012) developed an inner–outer model for
$\overline{u^{\prime }u^{\prime }}$
model for the entire channel flow using the composite asymptotic expansions, and Alfredsson, Segalini & Orlu (Reference Alfredsson, Segalini and Orlu2011), Alfredsson, Orlu & Segalini (Reference Alfredsson, Orlu and Segalini2012) developed an inner–outer model for
 $\overline{u^{\prime }u^{\prime }}$
in a turbulent boundary layer (TBL) based on the mean velocity scaling. All the above-mentioned composite formulae involve many free parameters and are difficult to extend to other stress components or other flows (Smits Reference Smits, Deville, Le and Sagaut2010).
$\overline{u^{\prime }u^{\prime }}$
in a turbulent boundary layer (TBL) based on the mean velocity scaling. All the above-mentioned composite formulae involve many free parameters and are difficult to extend to other stress components or other flows (Smits Reference Smits, Deville, Le and Sagaut2010).
The
 $Re$
-scaling of
$Re$
-scaling of
 $\overline{u^{\prime }u^{\prime }}$
peaks (location and magnitude) is also controversial (Örlü & Alfredsson Reference Örlü and Alfredsson2013): for the inner peak, while the Princeton pipe shows an invariant magnitude for
$\overline{u^{\prime }u^{\prime }}$
peaks (location and magnitude) is also controversial (Örlü & Alfredsson Reference Örlü and Alfredsson2013): for the inner peak, while the Princeton pipe shows an invariant magnitude for
 $Re_{\unicode[STIX]{x1D70F}}$
above 3300 (Hultmark et al.
Reference Hultmark, Vallikivi, Bailey and Smits2012), recent pipe data in the CICLoPE facility (Willert et al.
Reference Willert, Soria, Stanislas, Klinner, Amili, Eisfelder, Cuvier, Bellani, Fiorini and Talamelli2017) show an increasing magnitude with increasing
$Re_{\unicode[STIX]{x1D70F}}$
above 3300 (Hultmark et al.
Reference Hultmark, Vallikivi, Bailey and Smits2012), recent pipe data in the CICLoPE facility (Willert et al.
Reference Willert, Soria, Stanislas, Klinner, Amili, Eisfelder, Cuvier, Bellani, Fiorini and Talamelli2017) show an increasing magnitude with increasing
 $Re$
up to
$Re$
up to
 $Re_{\unicode[STIX]{x1D70F}}\approx 40\,000$
. It is unclear whether this growth is solely due to a finite
$Re_{\unicode[STIX]{x1D70F}}\approx 40\,000$
. It is unclear whether this growth is solely due to a finite
 $Re$
effect, or it suggests that the viscous scaling is invalid for fluctuations (Degraaff & Eaton Reference Degraaff and Eaton2000; Buschmann, Indinger & Gadelhak Reference Buschmann, Indinger and Gadelhak2009) since the inner–outer interactions are very effective (Hutchins & Marusic Reference Hutchins and Marusic2007b
; Marusic, Mathis & Hutchins Reference Marusic, Mathis and Hutchins2010a
; McKeon Reference McKeon2017). For the outer peak, McKeon & Sharma (Reference McKeon and Sharma2010) and Moarref et al. (Reference Moarref, Sharma, Tropp and McKeon2013) developed a ‘critical layer’ framework to understand its
$Re$
effect, or it suggests that the viscous scaling is invalid for fluctuations (Degraaff & Eaton Reference Degraaff and Eaton2000; Buschmann, Indinger & Gadelhak Reference Buschmann, Indinger and Gadelhak2009) since the inner–outer interactions are very effective (Hutchins & Marusic Reference Hutchins and Marusic2007b
; Marusic, Mathis & Hutchins Reference Marusic, Mathis and Hutchins2010a
; McKeon Reference McKeon2017). For the outer peak, McKeon & Sharma (Reference McKeon and Sharma2010) and Moarref et al. (Reference Moarref, Sharma, Tropp and McKeon2013) developed a ‘critical layer’ framework to understand its
 $y$
-location scaling in pipes (argued to scale as
$y$
-location scaling in pipes (argued to scale as
 $Re_{\unicode[STIX]{x1D70F}}^{2/3}$
). Moreover, there are efforts devoted to identify the characteristic flow structures (Jimenez Reference Jimenez2012), e.g. the large scale motions (LSM) (Adrian Reference Adrian2007) and very large scale motions (VLSM) (Hutchins & Marusic Reference Hutchins and Marusic2007a
,Reference Hutchins and Marusic
b
), which are suggested to lead to the emergence of the outer peak (Hultmark et al.
Reference Hultmark, Vallikivi, Bailey and Smits2013; Vincenti et al.
Reference Vincenti, Klewicki, Morrill-Winter, White and Wosnik2013; Vallikivi, Ganapathisubramani & Smits Reference Vallikivi, Ganapathisubramani and Smits2015).
$Re_{\unicode[STIX]{x1D70F}}^{2/3}$
). Moreover, there are efforts devoted to identify the characteristic flow structures (Jimenez Reference Jimenez2012), e.g. the large scale motions (LSM) (Adrian Reference Adrian2007) and very large scale motions (VLSM) (Hutchins & Marusic Reference Hutchins and Marusic2007a
,Reference Hutchins and Marusic
b
), which are suggested to lead to the emergence of the outer peak (Hultmark et al.
Reference Hultmark, Vallikivi, Bailey and Smits2013; Vincenti et al.
Reference Vincenti, Klewicki, Morrill-Winter, White and Wosnik2013; Vallikivi, Ganapathisubramani & Smits Reference Vallikivi, Ganapathisubramani and Smits2015).
While considerable efforts have been devoted to studies of
 $\overline{u^{\prime }u^{\prime }}$
, much less attention has been given to other Reynolds stress components; the study of these components is essential to unveil how fluctuations in different directions are coupled. In She, Chen & Hussain (Reference She, Chen and Hussain2017) (hereafter cited as Part 1), we obtained a four-layer (consisting of viscous sublayer, buffer layer, bulk layer and core layer) formula for the Reynolds shear stress length
$\overline{u^{\prime }u^{\prime }}$
, much less attention has been given to other Reynolds stress components; the study of these components is essential to unveil how fluctuations in different directions are coupled. In She, Chen & Hussain (Reference She, Chen and Hussain2017) (hereafter cited as Part 1), we obtained a four-layer (consisting of viscous sublayer, buffer layer, bulk layer and core layer) formula for the Reynolds shear stress length
 $\ell _{12}$
(defined later) – and hence also the entire mean velocity profile (MVP) – by employing the dilation symmetry of the mean Navier–Stokes equation. Here, random dilations on the second-order balance equations for all the Reynolds stresses (shear stress
$\ell _{12}$
(defined later) – and hence also the entire mean velocity profile (MVP) – by employing the dilation symmetry of the mean Navier–Stokes equation. Here, random dilations on the second-order balance equations for all the Reynolds stresses (shear stress
 $-\overline{u^{\prime }v^{\prime }}$
, and normal stresses
$-\overline{u^{\prime }v^{\prime }}$
, and normal stresses
 $\overline{u^{\prime }u^{\prime }}$
,
$\overline{u^{\prime }u^{\prime }}$
,
 $\overline{v^{\prime }v^{\prime }}$
,
$\overline{v^{\prime }v^{\prime }}$
,
 $\overline{w^{\prime }w^{\prime }}$
) are analysed layer by layer. Similar four-layer formulae of the corresponding stress length functions
$\overline{w^{\prime }w^{\prime }}$
) are analysed layer by layer. Similar four-layer formulae of the corresponding stress length functions
 $\ell _{11}$
,
$\ell _{11}$
,
 $\ell _{22}$
,
$\ell _{22}$
,
 $\ell _{33}$
are obtained for turbulent channel and pipe flows (exactly parallel flows), leading to analytical descriptions of all three Reynolds normal stresses (or intensities) in the entire flow domain.
$\ell _{33}$
are obtained for turbulent channel and pipe flows (exactly parallel flows), leading to analytical descriptions of all three Reynolds normal stresses (or intensities) in the entire flow domain.
In particular, DNS data agree well with the four-layer formulae for
 $\ell _{12}$
and
$\ell _{12}$
and
 $\ell _{22}$
, while anomalous scaling modifications are needed for
$\ell _{22}$
, while anomalous scaling modifications are needed for
 $\ell _{11}$
and
$\ell _{11}$
and
 $\ell _{33}$
in the log layer. The resulting
$\ell _{33}$
in the log layer. The resulting
 $-\overline{u^{\prime }v^{\prime }}$
,
$-\overline{u^{\prime }v^{\prime }}$
,
 $\overline{u^{\prime }u^{\prime }}$
,
$\overline{u^{\prime }u^{\prime }}$
,
 $\overline{v^{\prime }v^{\prime }}$
and
$\overline{v^{\prime }v^{\prime }}$
and
 $\overline{w^{\prime }w^{\prime }}$
are all in good agreement with DNS as well as experimental data in the entire flow domain. Furthermore, the aforementioned
$\overline{w^{\prime }w^{\prime }}$
are all in good agreement with DNS as well as experimental data in the entire flow domain. Furthermore, the aforementioned
 $y$
-scaling as well as the
$y$
-scaling as well as the
 $Re$
-scaling of the peak values and locations of all the stress components are formulated in terms of the multilayer parameters (layer thicknesses and scaling exponents), enabling new predictions. For example, as we show below, the peak location of
$Re$
-scaling of the peak values and locations of all the stress components are formulated in terms of the multilayer parameters (layer thicknesses and scaling exponents), enabling new predictions. For example, as we show below, the peak location of
 $-\overline{u^{\prime }v^{\prime }}$
can be given as a function of the von Kármán constant
$-\overline{u^{\prime }v^{\prime }}$
can be given as a function of the von Kármán constant
 $\unicode[STIX]{x1D705}$
(note the recently reported
$\unicode[STIX]{x1D705}$
(note the recently reported
 $\unicode[STIX]{x1D705}=0.446\pm 0.008$
in CICLoPE experiments by Nagib et al. (Reference Nagib, Monkewitz, Mascotelli, Fiorini, Bellani, Zheng and Talamelli2017) – quite consistent with our
$\unicode[STIX]{x1D705}=0.446\pm 0.008$
in CICLoPE experiments by Nagib et al. (Reference Nagib, Monkewitz, Mascotelli, Fiorini, Bellani, Zheng and Talamelli2017) – quite consistent with our
 $\unicode[STIX]{x1D705}\approx 0.45$
in Part 1) and the buffer layer thickness
$\unicode[STIX]{x1D705}\approx 0.45$
in Part 1) and the buffer layer thickness
 $y_{buf}^{+}$
, and it has a scaling transition from
$y_{buf}^{+}$
, and it has a scaling transition from
 $Re_{\unicode[STIX]{x1D70F}}^{1/3}$
to
$Re_{\unicode[STIX]{x1D70F}}^{1/3}$
to
 $Re_{\unicode[STIX]{x1D70F}}^{1/2}$
at a critical
$Re_{\unicode[STIX]{x1D70F}}^{1/2}$
at a critical
 $Re_{\unicode[STIX]{x1D70F}}^{c}\approx 3000$
. The
$Re_{\unicode[STIX]{x1D70F}}^{c}\approx 3000$
. The
 $Re_{\unicode[STIX]{x1D70F}}^{1/2}$
scaling was also found in Sreenivasan (Reference Sreenivasan1988); however, the
$Re_{\unicode[STIX]{x1D70F}}^{1/2}$
scaling was also found in Sreenivasan (Reference Sreenivasan1988); however, the
 $Re_{\unicode[STIX]{x1D70F}}^{1/3}$
scaling for small
$Re_{\unicode[STIX]{x1D70F}}^{1/3}$
scaling for small
 $Re$
is new – agreeing well with DNS data. Furthermore, previously argued log profiles of inactive motions are obtained as local flow approximations, with a theoretical determination of its coefficients:
$Re$
is new – agreeing well with DNS data. Furthermore, previously argued log profiles of inactive motions are obtained as local flow approximations, with a theoretical determination of its coefficients:
 $A_{11}=1.25$
,
$A_{11}=1.25$
,
 $B_{11}=1.63$
, and
$B_{11}=1.63$
, and
 $A_{33}=0.41$
,
$A_{33}=0.41$
,
 $B_{33}=1.00$
; these values are very close to the empirical values of
$B_{33}=1.00$
; these values are very close to the empirical values of
 $A_{11}=1.25$
,
$A_{11}=1.25$
,
 $B_{11}=1.61$
by Hultmark et al. (Reference Hultmark, Vallikivi, Bailey and Smits2012), and of
$B_{11}=1.61$
by Hultmark et al. (Reference Hultmark, Vallikivi, Bailey and Smits2012), and of
 $A_{33}=0.387$
and
$A_{33}=0.387$
and
 $B_{33}=1.08$
by Lee & Moser (Reference Lee and Moser2015). Moreover, predictions of all Reynolds stress profiles at
$B_{33}=1.08$
by Lee & Moser (Reference Lee and Moser2015). Moreover, predictions of all Reynolds stress profiles at
 $Re$
one decade larger than current available data – i.e.
$Re$
one decade larger than current available data – i.e.
 $-\overline{u^{\prime }v^{\prime }}$
,
$-\overline{u^{\prime }v^{\prime }}$
,
 $\overline{v^{\prime }v^{\prime }}$
and
$\overline{v^{\prime }v^{\prime }}$
and
 $\overline{w^{\prime }w^{\prime }}$
at
$\overline{w^{\prime }w^{\prime }}$
at
 $Re_{\unicode[STIX]{x1D70F}}=50\,000$
, and
$Re_{\unicode[STIX]{x1D70F}}=50\,000$
, and
 $\overline{u^{\prime }u^{\prime }}$
at
$\overline{u^{\prime }u^{\prime }}$
at
 $Re_{\unicode[STIX]{x1D70F}}=10^{6}$
– are also presented in this paper, awaiting future measurements for validation. Note that the current work characterizes the physically sound multilayer structure for all the Reynolds stresses, smoothly varying in space, needing no spectral description, and thus involving far fewer parameters than the previous models.
$Re_{\unicode[STIX]{x1D70F}}=10^{6}$
– are also presented in this paper, awaiting future measurements for validation. Note that the current work characterizes the physically sound multilayer structure for all the Reynolds stresses, smoothly varying in space, needing no spectral description, and thus involving far fewer parameters than the previous models.
The paper is organized as follows. Section 2 presents the Lie-group analysis for the second-order balance equations of channel and pipe flows, which extends the analysis reported in Part 1. In §§ 3 and 4, we validate the four-layer predictions for
 $-\overline{u^{\prime }v^{\prime }}$
and
$-\overline{u^{\prime }v^{\prime }}$
and
 $\overline{v^{\prime }v^{\prime }}$
, respectively. Results of
$\overline{v^{\prime }v^{\prime }}$
, respectively. Results of
 $\overline{w^{\prime }w^{\prime }}$
with an additional anomalous scaling modification are presented in § 5. Section 6 discusses
$\overline{w^{\prime }w^{\prime }}$
with an additional anomalous scaling modification are presented in § 5. Section 6 discusses
 $\overline{u^{\prime }u^{\prime }}$
. Section 7 contains a summary with future perspectives.
$\overline{u^{\prime }u^{\prime }}$
. Section 7 contains a summary with future perspectives.
2 Random dilation for the balance equations
This section is devoted to a complete treatment of the mean momentum equation and the second-order balance equations for the four Reynolds stresses under a random dilation transformation. The goal is to discover dilation groups with enough parameters which leave balance equations invariant in different regions of
 $y$
, and then to define the multilayer structure for the length functions. The basic idea is that the length functions represent the spatial scales of (statistical) turbulent eddies, whose variations in each of the layers are assumed to be self-similar viz. satisfying dilation invariance. We further ask to what extent the dilation invariance of these lengths can be related to the symmetry of the balance equations, as the symmetry enables a general expression for dilation invariants. Then, noting that the power law is just a specific expression of dilation invariance, two more expressions (ansatze) are postulated in Part 1 – one describing the defect power law in the bulk flow region (i.e. dilation symmetry broken in the length but retained in its derivative), and the other describing a generalized invariance across two adjacent layers. These ansatze are also validated here, leading to composite formulae for the length functions and quantitative descriptions of Reynolds stresses in the entire flow domain.
$y$
, and then to define the multilayer structure for the length functions. The basic idea is that the length functions represent the spatial scales of (statistical) turbulent eddies, whose variations in each of the layers are assumed to be self-similar viz. satisfying dilation invariance. We further ask to what extent the dilation invariance of these lengths can be related to the symmetry of the balance equations, as the symmetry enables a general expression for dilation invariants. Then, noting that the power law is just a specific expression of dilation invariance, two more expressions (ansatze) are postulated in Part 1 – one describing the defect power law in the bulk flow region (i.e. dilation symmetry broken in the length but retained in its derivative), and the other describing a generalized invariance across two adjacent layers. These ansatze are also validated here, leading to composite formulae for the length functions and quantitative descriptions of Reynolds stresses in the entire flow domain.
Taking channel flow for example, the ensemble-averaged mean momentum and Reynolds stress equations are
 $$\begin{eqnarray}\displaystyle & \displaystyle \frac{\unicode[STIX]{x2202}^{2}U^{+}}{\unicode[STIX]{x2202}y^{+2}}-\frac{\unicode[STIX]{x2202}\overline{u^{\prime }v^{\prime }}^{+}}{\unicode[STIX]{x2202}y^{+}}=-\frac{1}{Re_{\unicode[STIX]{x1D70F}}}, & \displaystyle\end{eqnarray}$$
 $$\begin{eqnarray}\displaystyle & \displaystyle -\overline{u^{\prime }v^{\prime }}^{+}\frac{\unicode[STIX]{x2202}U^{+}}{\unicode[STIX]{x2202}y^{+}}-\overline{u^{\prime }\frac{\unicode[STIX]{x2202}p^{\prime }}{\unicode[STIX]{x2202}x}}^{+}-\frac{\unicode[STIX]{x2202}}{\unicode[STIX]{x2202}y^{+}}\left(\frac{1}{2}\overline{u^{\prime }u^{\prime }v^{\prime }}^{+}\right)-\overline{|\unicode[STIX]{x1D735}u^{\prime }|^{+}}^{2}+\frac{\unicode[STIX]{x2202}^{2}}{\unicode[STIX]{x2202}y^{+2}}\left(\frac{1}{2}\overline{{u^{\prime }}^{2}}^{+}\right)=0,\quad & \displaystyle\end{eqnarray}$$
 $$\begin{eqnarray}\displaystyle & \displaystyle -\overline{v^{\prime }\frac{\unicode[STIX]{x2202}p^{\prime }}{\unicode[STIX]{x2202}y}}^{+}-\frac{\unicode[STIX]{x2202}}{\unicode[STIX]{x2202}y^{+}}\left(\frac{1}{2}\overline{v^{\prime }v^{\prime }v^{\prime }}^{+}\right)-\overline{|\unicode[STIX]{x1D735}v^{\prime }|^{+}}^{2}+\frac{\unicode[STIX]{x2202}^{2}}{\unicode[STIX]{x2202}y^{+2}}\left(\frac{1}{2}\overline{{v^{\prime }}^{2}}^{+}\right)=0, & \displaystyle\end{eqnarray}$$
 $$\begin{eqnarray}\displaystyle & \displaystyle -\overline{w^{\prime }\frac{\unicode[STIX]{x2202}p^{\prime }}{\unicode[STIX]{x2202}z}}^{+}-\frac{\unicode[STIX]{x2202}}{\unicode[STIX]{x2202}y^{+}}\left(\frac{1}{2}\overline{w^{\prime }w^{\prime }v^{\prime }}^{+}\right)-\overline{|\unicode[STIX]{x1D735}w^{\prime }|^{+}}^{2}+\frac{\unicode[STIX]{x2202}^{2}}{\unicode[STIX]{x2202}y^{+2}}\left(\frac{1}{2}\overline{{w^{\prime }}^{2}}^{+}\right)=0, & \displaystyle\end{eqnarray}$$
 $$\begin{eqnarray}\displaystyle & & \displaystyle -\frac{1}{2}\overline{v^{\prime }v^{\prime }}^{+}\frac{\unicode[STIX]{x2202}U^{+}}{\unicode[STIX]{x2202}y^{+}}-\frac{1}{2}\overline{u^{\prime }\frac{\unicode[STIX]{x2202}p^{\prime }}{\unicode[STIX]{x2202}y}}^{+}-\frac{1}{2}\overline{v^{\prime }\frac{\unicode[STIX]{x2202}p^{\prime }}{\unicode[STIX]{x2202}x}}^{+}-\frac{\unicode[STIX]{x2202}}{\unicode[STIX]{x2202}y^{+}}\left(\frac{1}{2}\overline{u^{\prime }v^{\prime }v^{\prime }}^{+}\right)\nonumber\\ \displaystyle & & \displaystyle \quad -\,\overline{|\unicode[STIX]{x1D735}u^{\prime }\boldsymbol{\cdot }\unicode[STIX]{x1D735}v^{\prime }|^{+}}+\frac{\unicode[STIX]{x2202}^{2}}{\unicode[STIX]{x2202}y^{+2}}\left(\frac{1}{2}\overline{u^{\prime }v^{\prime }}^{+}\right)=0.\end{eqnarray}$$
Here,
 $Re_{\unicode[STIX]{x1D70F}}\equiv u_{\unicode[STIX]{x1D70F}}\unicode[STIX]{x1D6FF}/\unicode[STIX]{x1D708}$
is the friction Reynolds number (
$Re_{\unicode[STIX]{x1D70F}}\equiv u_{\unicode[STIX]{x1D70F}}\unicode[STIX]{x1D6FF}/\unicode[STIX]{x1D708}$
is the friction Reynolds number (
 $u_{\unicode[STIX]{x1D70F}}$
is the friction velocity and
$u_{\unicode[STIX]{x1D70F}}$
is the friction velocity and
 $\unicode[STIX]{x1D6FF}$
is the pipe radius or half-channel height), the overbar indicates space (
$\unicode[STIX]{x1D6FF}$
is the pipe radius or half-channel height), the overbar indicates space (
 $x$
and
$x$
and
 $z$
) and time (
$z$
) and time (
 $t$
) average, and superscript
$t$
) average, and superscript
 $^{\prime }$
indicates fluctuation.
$^{\prime }$
indicates fluctuation.
In Part 1, a multilayer structure for stress length
 $\ell _{12}$
(see below) is proposed to accurately quantify the mean velocity profile (MVP), which involves three layer thicknesses measured from DNS data of MVP as
$\ell _{12}$
(see below) is proposed to accurately quantify the mean velocity profile (MVP), which involves three layer thicknesses measured from DNS data of MVP as
 $y_{sub}^{+}=9.7$
(for the sublayer),
$y_{sub}^{+}=9.7$
(for the sublayer),
 $y_{buf}^{+}=41$
(for the buffer layer) and
$y_{buf}^{+}=41$
(for the buffer layer) and
 $r_{core}=0.27$
(for the central core layer normalized with
$r_{core}=0.27$
(for the central core layer normalized with
 $\unicode[STIX]{x1D6FF}$
for channels and pipes). In Part 1, we also showed that they quantify the transitions of balances between different mechanisms (captured in the turbulent kinetic energy equation) in different layers, and symmetry analysis of budget equations in different layers are performed here. Figure 1(a) shows the wall-normal variation of various terms in (2.1b
) for
$\unicode[STIX]{x1D6FF}$
for channels and pipes). In Part 1, we also showed that they quantify the transitions of balances between different mechanisms (captured in the turbulent kinetic energy equation) in different layers, and symmetry analysis of budget equations in different layers are performed here. Figure 1(a) shows the wall-normal variation of various terms in (2.1b
) for
 $\overline{u^{\prime }u^{\prime }}$
, where the dominant balancing mechanism changes as
$\overline{u^{\prime }u^{\prime }}$
, where the dominant balancing mechanism changes as
 $y^{+}$
increases. In particular, there is a shift from a diffusion–dissipation balance close to the wall to a production–dissipation balance for
$y^{+}$
increases. In particular, there is a shift from a diffusion–dissipation balance close to the wall to a production–dissipation balance for
 $y^{+}\gtrsim y_{sub}^{+}$
. Further away from the wall, the pressure–strain term becomes more important and takes over dissipation at
$y^{+}\gtrsim y_{sub}^{+}$
. Further away from the wall, the pressure–strain term becomes more important and takes over dissipation at
 $y^{+}\approx y_{buf}^{+}$
, representing significant redistribution of the kinetic energy from the streamwise to the normal and spanwise directions. For
$y^{+}\approx y_{buf}^{+}$
, representing significant redistribution of the kinetic energy from the streamwise to the normal and spanwise directions. For
 $y^{+}\gtrsim y_{buf}^{+}$
, the net production (subtracting the mean shear production by the pressure–strain term) then balances the dissipation, where turbulent transport is negligible. However, near the centre
$y^{+}\gtrsim y_{buf}^{+}$
, the net production (subtracting the mean shear production by the pressure–strain term) then balances the dissipation, where turbulent transport is negligible. However, near the centre
 $r\lesssim r_{core}$
(
$r\lesssim r_{core}$
(
 $r=1-y$
being the distance from the centreline normalized by the half-channel height), turbulent transport takes over production to balance dissipation and pressure–strain – which defines a core layer. Such shifts in the balancing mechanism give rise to the aforementioned four-layer structure. (Note that the current four layers are different from those defined by Wei et al. (Reference Wei, Fife, Klewicki and Mcmurtry2005) and Klewicki et al. (Reference Klewicki, Chin, Blackburn, Ooi and Marusic2012) from the balance of the mean momentum equation). Here, the multilayer structure is also visible by the compensated plot (divided by
$r=1-y$
being the distance from the centreline normalized by the half-channel height), turbulent transport takes over production to balance dissipation and pressure–strain – which defines a core layer. Such shifts in the balancing mechanism give rise to the aforementioned four-layer structure. (Note that the current four layers are different from those defined by Wei et al. (Reference Wei, Fife, Klewicki and Mcmurtry2005) and Klewicki et al. (Reference Klewicki, Chin, Blackburn, Ooi and Marusic2012) from the balance of the mean momentum equation). Here, the multilayer structure is also visible by the compensated plot (divided by
 $1-r^{4}$
) of the lengths (Part 1), as shown in figure 1(b). Below, we present a detailed symmetry analysis for all balance equations like we did for the mean momentum equation in Part 1, so as to develop an analytical framework enabling quantification of the Reynolds stress distributions.
$1-r^{4}$
) of the lengths (Part 1), as shown in figure 1(b). Below, we present a detailed symmetry analysis for all balance equations like we did for the mean momentum equation in Part 1, so as to develop an analytical framework enabling quantification of the Reynolds stress distributions.
(a) Budget of
 $\overline{u^{\prime }u^{\prime }}$
(2.1b
). (b) Compensated plot of
$\overline{u^{\prime }u^{\prime }}$
(2.1b
). (b) Compensated plot of
 $\ell _{11}$
,
$\ell _{11}$
,
 $\ell _{12}$
,
$\ell _{12}$
,
 $\ell _{22}$
and
$\ell _{22}$
and
 $\ell _{33}$
(normalized by the half-channel height) divided by
$\ell _{33}$
(normalized by the half-channel height) divided by
 $1-r^{4}$
(Part 1). Note that the bulk layer (between
$1-r^{4}$
(Part 1). Note that the bulk layer (between
 $y_{buf}^{+}$
and
$y_{buf}^{+}$
and
 $r_{core}$
) has nearly constant values. Thicknesses of viscous sublayer (
$r_{core}$
) has nearly constant values. Thicknesses of viscous sublayer (
 $y_{sub}^{+}=9.7$
), buffer layer (
$y_{sub}^{+}=9.7$
), buffer layer (
 $y_{buf}^{+}=41$
) and core layer (
$y_{buf}^{+}=41$
) and core layer (
 $r_{core}=0.27$
) shown by dashed lines. Data from DNS channel flow at
$r_{core}=0.27$
) shown by dashed lines. Data from DNS channel flow at
 $Re_{\unicode[STIX]{x1D70F}}=940$
(Hoyas & Jimenez Reference Hoyas and Jimenez2006).
$Re_{\unicode[STIX]{x1D70F}}=940$
(Hoyas & Jimenez Reference Hoyas and Jimenez2006).

Note a common difficulty in the classical Lie-group analysis: namely, the lack of free group parameters to predict (or explain) scaling laws. In order to circumvent this difficulty, physical considerations are typically invoked to add to the parameters. This has been practiced in the derivation of the Blasius solution for the laminar boundary layer (Cantwell Reference Cantwell2002) and similarity solutions for sink-flow boundary layer (Chen & Hussain Reference Chen and Hussain2017), where an inhomogeneous dilation is introduced under the boundary layer approximation. Below, to enlarge the group parameter space, a three-step symmetry analysis is developed: first, we carry out a statistical symmetry analysis by employing random dilations. Second, we define a locally valid dilation group by neglecting unimportant terms in the balance equations. Third, we postulate the existence of a set of key similarity variables (hence order function) whose invariants are locally constants (hence having power laws), or satisfy simple invariant ansatze. The lengths introduced in (2.3a,b ) are such similarity variables. Note that their power laws can be validated by empirical data via an a priori test (i.e. without symmetry analysis), as shown in figure 1(b); the symmetry analysis below establishes the connections between the local power laws and the balance mechanisms represented by the budget equations. The specified length functions then lead to the Reynolds stress distributions.
Specifically, the random dilation transformation is introduced as follows:
 $$\begin{eqnarray}x_{i}^{\ast }=q_{i}x_{i},\quad U^{\ast }=\unicode[STIX]{x1D706}_{U}U,\quad Re_{\unicode[STIX]{x1D70F}}^{\ast }=\unicode[STIX]{x1D706}_{R}Re_{\unicode[STIX]{x1D70F}},\quad u_{i}^{\prime \ast }=\unicode[STIX]{x1D706}_{i}u_{i}^{\prime },\quad p^{\prime \ast }=\unicode[STIX]{x1D706}_{p}p^{\prime },\end{eqnarray}$$
where superscript
 $\ast$
indicates transformed variables (all variables are normalized by wall units and the superscript
$\ast$
indicates transformed variables (all variables are normalized by wall units and the superscript
 $+$
is omitted);
$+$
is omitted);
 $q_{i}$
,
$q_{i}$
,
 $\unicode[STIX]{x1D706}_{U}$
and
$\unicode[STIX]{x1D706}_{U}$
and
 $\unicode[STIX]{x1D706}_{R}$
are non-random, while
$\unicode[STIX]{x1D706}_{R}$
are non-random, while
 $\unicode[STIX]{x1D706}_{i}$
and
$\unicode[STIX]{x1D706}_{i}$
and
 $\unicode[STIX]{x1D706}_{p}$
are random variables with zero mean. Note that (2.2) is reasonable since turbulent fluctuations are random. The dilation correlation coefficients of
$\unicode[STIX]{x1D706}_{p}$
are random variables with zero mean. Note that (2.2) is reasonable since turbulent fluctuations are random. The dilation correlation coefficients of
 $\{\unicode[STIX]{x1D706}_{i}\}$
such as
$\{\unicode[STIX]{x1D706}_{i}\}$
such as
 $\overline{\unicode[STIX]{x1D706}_{i}...\unicode[STIX]{x1D706}_{k}}$
– which are independent of correlations between velocities and pressure – provide extra group parameters enabling the study of the dilation symmetry of the (infinite) hierarchy of high-order correlation equations (Oberlack Reference Oberlack2001; Marati et al.
Reference Marati, Davoudi, Casciola and Eckhardt2006; Oberlack & Rosteck Reference Oberlack and Rosteck2010; Frewer & Khujadze Reference Frewer and Khujadze2016). For example, for the second-order correlations,
$\overline{\unicode[STIX]{x1D706}_{i}...\unicode[STIX]{x1D706}_{k}}$
– which are independent of correlations between velocities and pressure – provide extra group parameters enabling the study of the dilation symmetry of the (infinite) hierarchy of high-order correlation equations (Oberlack Reference Oberlack2001; Marati et al.
Reference Marati, Davoudi, Casciola and Eckhardt2006; Oberlack & Rosteck Reference Oberlack and Rosteck2010; Frewer & Khujadze Reference Frewer and Khujadze2016). For example, for the second-order correlations,
 $\overline{\unicode[STIX]{x1D706}_{1}\unicode[STIX]{x1D706}_{2}}$
differs from
$\overline{\unicode[STIX]{x1D706}_{1}\unicode[STIX]{x1D706}_{2}}$
differs from
 $\overline{\unicode[STIX]{x1D706}_{1}\unicode[STIX]{x1D706}_{1}}$
and
$\overline{\unicode[STIX]{x1D706}_{1}\unicode[STIX]{x1D706}_{1}}$
and
 $\overline{\unicode[STIX]{x1D706}_{2}\unicode[STIX]{x1D706}_{2}}$
; note that in situations when
$\overline{\unicode[STIX]{x1D706}_{2}\unicode[STIX]{x1D706}_{2}}$
; note that in situations when
 $\overline{\unicode[STIX]{x1D706}_{1}\unicode[STIX]{x1D706}_{1}}$
and
$\overline{\unicode[STIX]{x1D706}_{1}\unicode[STIX]{x1D706}_{1}}$
and
 $\overline{\unicode[STIX]{x1D706}_{2}\unicode[STIX]{x1D706}_{2}}$
are equal (see later),
$\overline{\unicode[STIX]{x1D706}_{2}\unicode[STIX]{x1D706}_{2}}$
are equal (see later),
 $\overline{\unicode[STIX]{x1D706}_{1}\unicode[STIX]{x1D706}_{2}}$
can still be different. This allows different dilations on the Reynolds normal and shear stresses, as shown later.
$\overline{\unicode[STIX]{x1D706}_{1}\unicode[STIX]{x1D706}_{2}}$
can still be different. This allows different dilations on the Reynolds normal and shear stresses, as shown later.
In this paper, four lengths are defined by the mean shear
 $S^{+}=\unicode[STIX]{x2202}U^{+}/\unicode[STIX]{x2202}y^{+}$
and the Reynolds stresses
$S^{+}=\unicode[STIX]{x2202}U^{+}/\unicode[STIX]{x2202}y^{+}$
and the Reynolds stresses
 $W_{ij}^{+}=|\overline{u_{i}^{\prime }u_{j}^{\prime }}|^{+}$
(where
$W_{ij}^{+}=|\overline{u_{i}^{\prime }u_{j}^{\prime }}|^{+}$
(where
 $||$
denotes the absolute value, particularly for
$||$
denotes the absolute value, particularly for
 $\overline{u_{1}^{\prime }u_{2}^{\prime }}$
or
$\overline{u_{1}^{\prime }u_{2}^{\prime }}$
or
 $\overline{u^{\prime }v^{\prime }}$
since it is negative in shear flows):
$\overline{u^{\prime }v^{\prime }}$
since it is negative in shear flows):
 $$\begin{eqnarray}\ell _{12}^{+}={W_{12}^{+}}^{1/2}/S^{+},\quad \ell _{ii}^{+}={W_{ii}^{+}}^{1/2}/S^{+},\end{eqnarray}$$
 $$\begin{eqnarray}W_{12}^{+}=(\ell _{12}^{+}S^{+})^{2},\quad W_{ii}^{+}=(\ell _{ii}^{+}S^{+})^{2},\end{eqnarray}$$
where
 $i=1,2,3$
(no summation for indices unless otherwise stated). Under the dilations (2.2), the stresses and the lengths are dilated as
$i=1,2,3$
(no summation for indices unless otherwise stated). Under the dilations (2.2), the stresses and the lengths are dilated as
 $$\begin{eqnarray}W_{ij}^{+\ast }=\overline{\unicode[STIX]{x1D706}_{i}\unicode[STIX]{x1D706}_{j}}W_{ij}^{+},\quad \ell _{ij}^{+\ast }=\left(\sqrt{\overline{\unicode[STIX]{x1D706}_{i}\unicode[STIX]{x1D706}_{j}}}q_{2}/\unicode[STIX]{x1D706}_{U}\right)\ell _{ij}^{+}.\end{eqnarray}$$
Note that these lengths, forming a family of multiple components, characterize different sets of eddies contributing to anisotropic transport of the Reynolds stress tensor. They are considered here as similarity variables satisfying three dilation invariant ansatze, similar to
 $\ell _{12}$
in Part 1. The local dilation invariance actually indicates that turbulent eddies are self-similar; namely, within each layer, eddies’ characteristic scales at different
$\ell _{12}$
in Part 1. The local dilation invariance actually indicates that turbulent eddies are self-similar; namely, within each layer, eddies’ characteristic scales at different
 $y$
-locations are related by a simple power law. The previous linear
$y$
-locations are related by a simple power law. The previous linear
 $y$
-scaling of the wall-attached eddy size in the log layer (Alamo et al.
Reference Alamo, Jimenez, Zandonade and Moser2006; Jimenez Reference Jimenez2012) is only one of the layers, and the linear scaling can be derived by the dilation symmetry analysis as below. Across different layers, eddies’ scales obey a generalized power law, following the third ansatz postulated in Part 1, so that we establish a multilayer similarity of the eddies across the entire flow domain.
$y$
-scaling of the wall-attached eddy size in the log layer (Alamo et al.
Reference Alamo, Jimenez, Zandonade and Moser2006; Jimenez Reference Jimenez2012) is only one of the layers, and the linear scaling can be derived by the dilation symmetry analysis as below. Across different layers, eddies’ scales obey a generalized power law, following the third ansatz postulated in Part 1, so that we establish a multilayer similarity of the eddies across the entire flow domain.
Below, we apply (2.2) to (2.1a–e ) to obtain concrete expressions for the lengths in (2.3e,f ). Particularly, the linear scaling in the log layer is obtained by equating the dilation coefficients of all terms in (2.1). In the viscous sublayer, and bulk and core layers, we remove some unimportant terms so as to reduce the symmetry constraints, and hence to increase the freedom of new scaling. In the buffer layer, two large terms (i.e. dissipation and diffusion) are of opposite sign and hence combined so as to capture the higher-order term in (2.1b ). This way, different directional dilations are obtained in the viscous sublayer, and buffer, bulk and core layers, where the balance mechanism in each layer is different. The local power-law exponents for all the lengths can be determined using expansion or other theoretical arguments as in Part 1, and a generalized Lie-group ansatz (i.e. the third ansatz in Part 1) connects power laws of adjacent layers together, so as to yield the four-layer composite profile for each length in the entire flow domain.
2.1 Homogeneous dilations in the log layer
Substituting (2.2) into (2.1a
)–(2.1e
) and requiring the same proportional coefficients for all the terms in the equations (needed to obtain invariant transformed equations) yield the following relations for the correlations of random dilation variables
 $\{\unicode[STIX]{x1D706}_{i}\}$
:
$\{\unicode[STIX]{x1D706}_{i}\}$
:
 $$\begin{eqnarray}\displaystyle & \unicode[STIX]{x1D706}_{U}/q_{2}^{2}=\overline{\unicode[STIX]{x1D706}_{1}\unicode[STIX]{x1D706}_{2}}/q_{2}=1/\unicode[STIX]{x1D706}_{R}, & \displaystyle\end{eqnarray}$$
 $$\begin{eqnarray}\displaystyle & \overline{\unicode[STIX]{x1D706}_{1}\unicode[STIX]{x1D706}_{2}}\unicode[STIX]{x1D706}_{U}/q_{2}=\overline{\unicode[STIX]{x1D706}_{1}\unicode[STIX]{x1D706}_{p}}/q_{1}=\overline{\unicode[STIX]{x1D706}_{1}\unicode[STIX]{x1D706}_{1}\unicode[STIX]{x1D706}_{2}}/q_{2}=\overline{\unicode[STIX]{x1D706}_{1}\unicode[STIX]{x1D706}_{1}}/q_{1}^{2}=\overline{\unicode[STIX]{x1D706}_{1}\unicode[STIX]{x1D706}_{1}}/q_{2}^{2}=\overline{\unicode[STIX]{x1D706}_{1}\unicode[STIX]{x1D706}_{1}}/q_{3}^{2}, & \displaystyle\end{eqnarray}$$
 $$\begin{eqnarray}\displaystyle & \overline{\unicode[STIX]{x1D706}_{2}\unicode[STIX]{x1D706}_{p}}/q_{2}=\overline{\unicode[STIX]{x1D706}_{2}\unicode[STIX]{x1D706}_{2}\unicode[STIX]{x1D706}_{2}}/q_{2}=\overline{\unicode[STIX]{x1D706}_{2}\unicode[STIX]{x1D706}_{2}}/q_{1}^{2}=\overline{\unicode[STIX]{x1D706}_{2}\unicode[STIX]{x1D706}_{2}}/q_{2}^{2}=\overline{\unicode[STIX]{x1D706}_{2}\unicode[STIX]{x1D706}_{2}}/q_{3}^{2}, & \displaystyle\end{eqnarray}$$
 $$\begin{eqnarray}\displaystyle & \overline{\unicode[STIX]{x1D706}_{3}\unicode[STIX]{x1D706}_{p}}/q_{3}=\overline{\unicode[STIX]{x1D706}_{3}\unicode[STIX]{x1D706}_{3}\unicode[STIX]{x1D706}_{2}}/q_{2}=\overline{\unicode[STIX]{x1D706}_{3}\unicode[STIX]{x1D706}_{3}}/q_{1}^{2}=\overline{\unicode[STIX]{x1D706}_{3}\unicode[STIX]{x1D706}_{3}}/q_{2}^{2}=\overline{\unicode[STIX]{x1D706}_{3}\unicode[STIX]{x1D706}_{3}}/q_{3}^{2}, & \displaystyle\end{eqnarray}$$
 $$\begin{eqnarray}\displaystyle & \overline{\unicode[STIX]{x1D706}_{2}\unicode[STIX]{x1D706}_{2}}\unicode[STIX]{x1D706}_{U}/q_{2}=\overline{\unicode[STIX]{x1D706}_{1}\unicode[STIX]{x1D706}_{p}}/q_{2}=\overline{\unicode[STIX]{x1D706}_{2}\unicode[STIX]{x1D706}_{p}}/q_{1}=\overline{\unicode[STIX]{x1D706}_{1}\unicode[STIX]{x1D706}_{2}\unicode[STIX]{x1D706}_{2}}/q_{2}=\overline{\unicode[STIX]{x1D706}_{1}\unicode[STIX]{x1D706}_{2}}/q_{1}^{2}=\overline{\unicode[STIX]{x1D706}_{1}\unicode[STIX]{x1D706}_{2}}/q_{2}^{2}=\overline{\unicode[STIX]{x1D706}_{1}\unicode[STIX]{x1D706}_{2}}/q_{3}^{2}.\qquad & \displaystyle\end{eqnarray}$$
 $q_{1}=q_{2}=q_{3}=q$
, and also
$q_{1}=q_{2}=q_{3}=q$
, and also  $$\begin{eqnarray}\unicode[STIX]{x1D706}_{U}=1/q,\quad \unicode[STIX]{x1D706}_{R}=q^{3},\end{eqnarray}$$
 $$\begin{eqnarray}\overline{\unicode[STIX]{x1D706}_{1}\unicode[STIX]{x1D706}_{1}}=\overline{\unicode[STIX]{x1D706}_{2}\unicode[STIX]{x1D706}_{2}}=\overline{\unicode[STIX]{x1D706}_{1}\unicode[STIX]{x1D706}_{2}}=1/q^{2},\end{eqnarray}$$
 $$\begin{eqnarray}\overline{\unicode[STIX]{x1D706}_{1}\unicode[STIX]{x1D706}_{p}}=\overline{\unicode[STIX]{x1D706}_{2}\unicode[STIX]{x1D706}_{p}}=\overline{\unicode[STIX]{x1D706}_{1}\unicode[STIX]{x1D706}_{2}\unicode[STIX]{x1D706}_{2}}=\overline{\unicode[STIX]{x1D706}_{1}\unicode[STIX]{x1D706}_{1}\unicode[STIX]{x1D706}_{2}}=\overline{\unicode[STIX]{x1D706}_{2}\unicode[STIX]{x1D706}_{2}\unicode[STIX]{x1D706}_{2}}=1/q^{3}.\end{eqnarray}$$
Accordingly, the Reynolds stresses
 $W_{ij}^{+}$
are dilated by a factor of
$W_{ij}^{+}$
are dilated by a factor of
 $\overline{\unicode[STIX]{x1D706}_{i}\unicode[STIX]{x1D706}_{j}}=1/q^{2}$
(for
$\overline{\unicode[STIX]{x1D706}_{i}\unicode[STIX]{x1D706}_{j}}=1/q^{2}$
(for
 $i,j,=1,2$
), and the mean shear
$i,j,=1,2$
), and the mean shear
 $S$
by a factor of
$S$
by a factor of
 $\unicode[STIX]{x1D706}_{U}/q=1/q^{2}$
, so that the length functions, according to definitions in (2.3a,b
), are dilated as
$\unicode[STIX]{x1D706}_{U}/q=1/q^{2}$
, so that the length functions, according to definitions in (2.3a,b
), are dilated as
 $$\begin{eqnarray}\ell _{ij}^{+\ast }=\sqrt{\overline{\unicode[STIX]{x1D706}_{i}\unicode[STIX]{x1D706}_{j}}}/(\unicode[STIX]{x1D706}_{U}/q)\ell _{ij}^{+}=q\ell _{ij}^{+}.\end{eqnarray}$$
In this case, the dilation invariants consisting of
 $y^{+}$
and
$y^{+}$
and
 $\ell _{ij}^{+}$
are
$\ell _{ij}^{+}$
are
 $$\begin{eqnarray}I_{ij}^{log}=\ell _{ij}^{+}/y^{+}.\end{eqnarray}$$
Following Part 1, we assume constant dilation invariants (i.e.
 $I_{ij}=\text{const.}$
) to obtain possible (or candidate) solutions of the balance equations, i.e.
$I_{ij}=\text{const.}$
) to obtain possible (or candidate) solutions of the balance equations, i.e.
 $$\begin{eqnarray}\ell _{ij}^{+}=I_{ij}^{log}y^{+},\quad I_{ij}^{log}=\text{const.}\end{eqnarray}$$
This is the standard (canonical) case where no direction is preferred, and all the lengths
 $\ell _{ij}$
scale as the wall distance (
$\ell _{ij}$
scale as the wall distance (
 $y$
) – also a simple consequence of dimensional analysis.
$y$
) – also a simple consequence of dimensional analysis.
In particular, the well-known
 $W_{12}^{+}\approx 1$
gives rise to
$W_{12}^{+}\approx 1$
gives rise to
 $S^{+}\approx 1/(I_{12}^{log}y^{+})$
and hence the mean velocity
$S^{+}\approx 1/(I_{12}^{log}y^{+})$
and hence the mean velocity
 $U^{+}\approx (1/I_{12}^{log})\log y^{+}+B$
; this shows that the Kármán constant is just one of our dilation invariants:
$U^{+}\approx (1/I_{12}^{log})\log y^{+}+B$
; this shows that the Kármán constant is just one of our dilation invariants:
 $I_{12}^{log}$
. Note that the dilation invariance of
$I_{12}^{log}$
. Note that the dilation invariance of
 $W_{12}^{+}$
actually is broken since
$W_{12}^{+}$
actually is broken since
 $W_{12}^{+}\approx 1$
against
$W_{12}^{+}\approx 1$
against
 $W_{12}^{+\ast }=W_{12}^{+}/q^{2}$
(unless
$W_{12}^{+\ast }=W_{12}^{+}/q^{2}$
(unless
 $q=1$
, which would indicate no dilation), but the length function
$q=1$
, which would indicate no dilation), but the length function
 $\ell _{12}$
still holds its dilation invariance:
$\ell _{12}$
still holds its dilation invariance:
 $\ell _{12}^{+\ast }=q\ell _{12}^{+}$
(this is why
$\ell _{12}^{+\ast }=q\ell _{12}^{+}$
(this is why
 $\ell _{ij}$
, not
$\ell _{ij}$
, not
 $W_{ij}$
, is chosen as the similarity variable). This is also found in other layers that we study below.
$W_{ij}$
, is chosen as the similarity variable). This is also found in other layers that we study below.
More interestingly, from (2.8) and (2.3c,d
),
 $W_{ii}^{+}=W_{12}^{+}(I_{ii}^{log}/I_{12}^{log})^{2}$
, indicating that all the Reynolds normal stresses are constants in the log layer (since
$W_{ii}^{+}=W_{12}^{+}(I_{ii}^{log}/I_{12}^{log})^{2}$
, indicating that all the Reynolds normal stresses are constants in the log layer (since
 $W_{12}^{+}\approx 1$
). These constants are parts of the so-called ‘inertial-range’ description, widely used in engineering models (Wilcox Reference Wilcox2006). The present analysis shows that they arise from a dilation symmetry homogeneous in all directions (when all terms in the balance equations are under the same dilation). Note that the constancy of
$W_{12}^{+}\approx 1$
). These constants are parts of the so-called ‘inertial-range’ description, widely used in engineering models (Wilcox Reference Wilcox2006). The present analysis shows that they arise from a dilation symmetry homogeneous in all directions (when all terms in the balance equations are under the same dilation). Note that the constancy of
 $W_{11}^{+}$
and
$W_{11}^{+}$
and
 $W_{33}^{+}$
are against Townsend’s log law of inactive motions in (1.3) and (1.4), where more discussions on this issue will be presented later.
$W_{33}^{+}$
are against Townsend’s log law of inactive motions in (1.3) and (1.4), where more discussions on this issue will be presented later.
Also note that the above analysis shows that dilations of
 $W_{11}$
,
$W_{11}$
,
 $W_{22}$
and
$W_{22}$
and
 $W_{12}$
are linked, because of the production and pressure–strain terms in the corresponding equations. In contrast, dilation on
$W_{12}$
are linked, because of the production and pressure–strain terms in the corresponding equations. In contrast, dilation on
 $W_{33}$
seems to be independent of those on
$W_{33}$
seems to be independent of those on
 $W_{11}$
or
$W_{11}$
or
 $W_{22}$
(hence is free), since no term in the spanwise kinetic energy equation is coupled with other equations. Here, invoking the isotropic turbulence assumption,
$W_{22}$
(hence is free), since no term in the spanwise kinetic energy equation is coupled with other equations. Here, invoking the isotropic turbulence assumption,
 $\ell _{33}$
satisfies the same dilation as
$\ell _{33}$
satisfies the same dilation as
 $\ell _{11}$
or
$\ell _{11}$
or
 $\ell _{22}$
; this argument also applies to the core layer. However, near the wall, the isotropic condition is invalid, and dilations on these lengths should be different. In fact, the homogeneous dilation symmetry is partially broken near the wall since some terms in the balance equations are unimportant. We explore such possibilities below. The analysis will first treat
$\ell _{22}$
; this argument also applies to the core layer. However, near the wall, the isotropic condition is invalid, and dilations on these lengths should be different. In fact, the homogeneous dilation symmetry is partially broken near the wall since some terms in the balance equations are unimportant. We explore such possibilities below. The analysis will first treat
 $\ell _{ij}$
(for
$\ell _{ij}$
(for
 $i,j=1,2$
) and then focus on
$i,j=1,2$
) and then focus on
 $\ell _{33}$
.
$\ell _{33}$
.
2.2 Directional dilations in the viscous sublayer
Near the wall, compared to
 $\unicode[STIX]{x2202}_{y}^{2}$
, the
$\unicode[STIX]{x2202}_{y}^{2}$
, the
 $\unicode[STIX]{x2202}_{x}^{2}$
and
$\unicode[STIX]{x2202}_{x}^{2}$
and
 $\unicode[STIX]{x2202}_{z}^{2}$
terms can be ignored (i.e. the boundary layer approximation). This enables us to drop the
$\unicode[STIX]{x2202}_{z}^{2}$
terms can be ignored (i.e. the boundary layer approximation). This enables us to drop the
 $\overline{\unicode[STIX]{x1D706}_{i}\unicode[STIX]{x1D706}_{j}}/q_{1}^{2}$
and
$\overline{\unicode[STIX]{x1D706}_{i}\unicode[STIX]{x1D706}_{j}}/q_{1}^{2}$
and
 $\overline{\unicode[STIX]{x1D706}_{i}\unicode[STIX]{x1D706}_{j}}/q_{3}^{2}$
terms in (2.4), and hence all
$\overline{\unicode[STIX]{x1D706}_{i}\unicode[STIX]{x1D706}_{j}}/q_{3}^{2}$
terms in (2.4), and hence all
 $q_{i}$
are not needed to be equal. In this case, let us choose
$q_{i}$
are not needed to be equal. In this case, let us choose
 $\unicode[STIX]{x1D706}_{U}$
and
$\unicode[STIX]{x1D706}_{U}$
and
 $q_{2}$
as two independent dilation parameters, then all the other dilation parameters are determined from the remnant of (2.4):
$q_{2}$
as two independent dilation parameters, then all the other dilation parameters are determined from the remnant of (2.4):
 $$\begin{eqnarray}\displaystyle \unicode[STIX]{x1D706}_{R}=q_{2}^{2}/\unicode[STIX]{x1D706}_{U},\quad \overline{\unicode[STIX]{x1D706}_{1}\unicode[STIX]{x1D706}_{2}}=\unicode[STIX]{x1D706}_{U}/q_{2},\quad \overline{\unicode[STIX]{x1D706}_{1}\unicode[STIX]{x1D706}_{1}}=\unicode[STIX]{x1D706}_{U}^{2},\quad \overline{\unicode[STIX]{x1D706}_{2}\unicode[STIX]{x1D706}_{2}}=1/q_{2}^{2},\quad q_{1}=1/\unicode[STIX]{x1D706}_{U}. & & \displaystyle\end{eqnarray}$$
 $$\begin{eqnarray}\overline{\unicode[STIX]{x1D706}_{1}\unicode[STIX]{x1D706}_{p}}=\overline{\unicode[STIX]{x1D706}_{1}\unicode[STIX]{x1D706}_{2}\unicode[STIX]{x1D706}_{2}}=\unicode[STIX]{x1D706}_{U}/q_{2}^{2},\quad \overline{\unicode[STIX]{x1D706}_{2}\unicode[STIX]{x1D706}_{p}}=\overline{\unicode[STIX]{x1D706}_{2}\unicode[STIX]{x1D706}_{2}\unicode[STIX]{x1D706}_{2}}=1/q_{2}^{3},\quad \overline{\unicode[STIX]{x1D706}_{1}\unicode[STIX]{x1D706}_{1}\unicode[STIX]{x1D706}_{2}}=\unicode[STIX]{x1D706}_{U}^{2}/q_{2}.\end{eqnarray}$$
 $$\begin{eqnarray}\ell _{11}^{+\ast }=q_{2}\ell _{11}^{+},\quad \ell _{12}^{+\ast }=\sqrt{q_{2}/\unicode[STIX]{x1D706}_{U}}\ell _{12}^{+},\quad \ell _{22}^{+\ast }=(1/\unicode[STIX]{x1D706}_{U})\ell _{22}^{+}.\end{eqnarray}$$
Since
 $\ell _{12}^{+\ast }=q_{2}^{3/2}\ell _{12}^{+}$
was obtained in the viscous sublayer due to the scaling
$\ell _{12}^{+\ast }=q_{2}^{3/2}\ell _{12}^{+}$
was obtained in the viscous sublayer due to the scaling
 $\ell _{12}^{+}\propto \,y^{+3/2}$
(Part 1), we thus have
$\ell _{12}^{+}\propto \,y^{+3/2}$
(Part 1), we thus have
 $\unicode[STIX]{x1D706}_{U}=q_{2}^{-2}$
from the second equation of (2.10), and hence
$\unicode[STIX]{x1D706}_{U}=q_{2}^{-2}$
from the second equation of (2.10), and hence
 $\ell _{22}^{+\ast }=q_{2}^{2}\ell _{22}^{+}$
. Then, the corresponding dilation invariants are
$\ell _{22}^{+\ast }=q_{2}^{2}\ell _{22}^{+}$
. Then, the corresponding dilation invariants are
 $$\begin{eqnarray}I_{11}^{sub}=\ell _{11}^{+}/y^{+},\quad I_{12}^{sub}=\ell _{12}^{+}/y^{+3/2},\quad I_{22}^{sub}=\ell _{22}^{+}/y^{+2}.\end{eqnarray}$$
Following the first invariant ansatz (i.e. assuming constant invariants) in Part 1, local power laws in the viscous sublayer are obtained as
 $$\begin{eqnarray}\ell _{11}^{+}=I_{11}^{sub}y^{+},\quad \ell _{12}^{+}=I_{12}^{sub}y^{+3/2},\quad \ell _{22}^{+}=I_{22}^{sub}y^{+2}.\end{eqnarray}$$
This shows that by random dilation of approximate balance equations, we can obtain different power laws for the length functions, in contrast to the uniform linear scaling (2.8) for all the lengths in log layer.
2.3 Directional dilations in the buffer layer
The dominant balancing mechanisms in the buffer layer are different from those in the viscous sublayer. While (2.1a
), (2.1c
) and (2.1d
) remain the same as in the viscous sublayer (i.e. ignoring
 $\unicode[STIX]{x2202}_{x}^{2}$
and
$\unicode[STIX]{x2202}_{x}^{2}$
and
 $\unicode[STIX]{x2202}_{z}^{2}$
in dissipations), both (2.1e
) and (2.1b
) are different. For the Reynolds shear stress equation (2.1e
), diffusion and dissipation are very small (Pope Reference Pope2000), and hence ignored. For the streamwise stress equation (2.1b
), a special consideration is given below.
$\unicode[STIX]{x2202}_{z}^{2}$
in dissipations), both (2.1e
) and (2.1b
) are different. For the Reynolds shear stress equation (2.1e
), diffusion and dissipation are very small (Pope Reference Pope2000), and hence ignored. For the streamwise stress equation (2.1b
), a special consideration is given below.
Recall that in Part 1, we defined an eddy shear length
 $\ell _{\unicode[STIX]{x1D708}}^{+}$
:
$\ell _{\unicode[STIX]{x1D708}}^{+}$
:
 $$\begin{eqnarray}\ell _{\unicode[STIX]{x1D708}}^{+}=(W_{12}^{+}/S^{+})^{3/4}/\unicode[STIX]{x1D716}_{\unicode[STIX]{x1D708}}^{1/4},\end{eqnarray}$$
where
 $\unicode[STIX]{x1D716}_{\unicode[STIX]{x1D708}}=(\overline{|\unicode[STIX]{x1D735}u^{\prime }|^{+}}^{2}-\unicode[STIX]{x2202}^{2}\overline{u^{\prime }u^{\prime }}/\unicode[STIX]{x2202}y^{+2})$
is the net viscous effect (a sum of viscous diffusion and dissipation) and
$\unicode[STIX]{x1D716}_{\unicode[STIX]{x1D708}}=(\overline{|\unicode[STIX]{x1D735}u^{\prime }|^{+}}^{2}-\unicode[STIX]{x2202}^{2}\overline{u^{\prime }u^{\prime }}/\unicode[STIX]{x2202}y^{+2})$
is the net viscous effect (a sum of viscous diffusion and dissipation) and
 $\unicode[STIX]{x1D708}_{T}^{+}=W_{12}^{+}/S^{+}$
is the eddy viscosity. In the viscous sublayer,
$\unicode[STIX]{x1D708}_{T}^{+}=W_{12}^{+}/S^{+}$
is the eddy viscosity. In the viscous sublayer,
 $W_{12}^{+}/S^{+}\propto y^{+3}$
and
$W_{12}^{+}/S^{+}\propto y^{+3}$
and
 $\unicode[STIX]{x1D716}_{\unicode[STIX]{x1D708}}\propto y^{+}$
(since the leading order expansions of
$\unicode[STIX]{x1D716}_{\unicode[STIX]{x1D708}}\propto y^{+}$
(since the leading order expansions of
 $\overline{|\unicode[STIX]{x1D735}u^{\prime }|^{+}}^{2}$
and
$\overline{|\unicode[STIX]{x1D735}u^{\prime }|^{+}}^{2}$
and
 $\unicode[STIX]{x2202}^{2}(\overline{u^{\prime }u^{\prime }})/\unicode[STIX]{x2202}y^{+2}$
– which are non-zero values – exactly balance each other (see figure 1
a), leaving the first expansion term as a order of
$\unicode[STIX]{x2202}^{2}(\overline{u^{\prime }u^{\prime }})/\unicode[STIX]{x2202}y^{+2}$
– which are non-zero values – exactly balance each other (see figure 1
a), leaving the first expansion term as a order of
 $y^{+}$
). Thus, the expansion for the eddy shear length is
$y^{+}$
). Thus, the expansion for the eddy shear length is
 $\ell _{\unicode[STIX]{x1D708}}^{+}\approx c_{\unicode[STIX]{x1D708}}y^{+2}+h.o.t.$
(where
$\ell _{\unicode[STIX]{x1D708}}^{+}\approx c_{\unicode[STIX]{x1D708}}y^{+2}+h.o.t.$
(where
 $h.o.t.$
denotes higher-order terms.) Here, using the same buffer layer approximation
$h.o.t.$
denotes higher-order terms.) Here, using the same buffer layer approximation
 $\ell _{\unicode[STIX]{x1D708}}^{+}\approx c_{\unicode[STIX]{x1D708}}y^{+2}$
as in Part 1, the net viscous effect is approximated as
$\ell _{\unicode[STIX]{x1D708}}^{+}\approx c_{\unicode[STIX]{x1D708}}y^{+2}$
as in Part 1, the net viscous effect is approximated as
 $$\begin{eqnarray}\unicode[STIX]{x1D716}_{\unicode[STIX]{x1D708}}=\frac{W_{12}^{+3}}{S^{+3}\ell _{\unicode[STIX]{x1D708}}^{+4}}=\frac{W_{12}^{+3}}{S^{+3}(c_{\unicode[STIX]{x1D708}}y^{+2}+h.o.t.)^{4}}\approx \frac{W_{12}^{+3}}{S^{+3}(c_{\unicode[STIX]{x1D708}}y^{+2})^{4}}.\end{eqnarray}$$
Substituting (2.14) into (2.1b ) yields
 $$\begin{eqnarray}0\approx S^{+}W_{12}^{+}-\overline{u^{\prime }\unicode[STIX]{x2202}_{x}p^{\prime }}^{+}-\unicode[STIX]{x2202}_{y^{+}}\left(\frac{1}{2}\overline{u^{\prime }u^{\prime }v^{\prime }}^{+}\right)-\frac{W_{12}^{+3}}{S^{+3}(c_{\unicode[STIX]{x1D708}}y^{+2})^{4}},\end{eqnarray}$$
which will replace (2.1b ) to be the approximate streamwise stress equation for the dilation analysis (explained later).
Applying (2.2) to the newly obtained approximated equations yields the following constraints on the correlations of dilation parameters:
 $$\begin{eqnarray}\unicode[STIX]{x1D706}_{R}=q_{2}^{2}/\unicode[STIX]{x1D706}_{U},\quad \overline{\unicode[STIX]{x1D706}_{1}\unicode[STIX]{x1D706}_{2}}=\unicode[STIX]{x1D706}_{U}/q_{2},\quad \unicode[STIX]{x1D706}_{U}=1/q_{2}^{3},\quad q_{1}=q_{2}^{2}\overline{\unicode[STIX]{x1D706}_{2}\unicode[STIX]{x1D706}_{2}}/\unicode[STIX]{x1D706}_{U}.\end{eqnarray}$$
 $$\begin{eqnarray}\overline{\unicode[STIX]{x1D706}_{1}\unicode[STIX]{x1D706}_{p}}=\overline{\unicode[STIX]{x1D706}_{1}\unicode[STIX]{x1D706}_{2}\unicode[STIX]{x1D706}_{2}}=\unicode[STIX]{x1D706}_{U}\overline{\unicode[STIX]{x1D706}_{2}\unicode[STIX]{x1D706}_{2}},\quad \overline{\unicode[STIX]{x1D706}_{2}\unicode[STIX]{x1D706}_{p}}=\overline{\unicode[STIX]{x1D706}_{2}\unicode[STIX]{x1D706}_{2}\unicode[STIX]{x1D706}_{2}}=q_{2}(\overline{\unicode[STIX]{x1D706}_{2}\unicode[STIX]{x1D706}_{2}})^{2},\quad \overline{\unicode[STIX]{x1D706}_{1}\unicode[STIX]{x1D706}_{1}\unicode[STIX]{x1D706}_{2}}=\unicode[STIX]{x1D706}_{U}^{2}/q_{2}.\end{eqnarray}$$
 $$\begin{eqnarray}\ell _{11}^{+\ast }=q_{11}\ell _{11}^{+},\quad \ell _{12}^{+\ast }=q_{2}^{2}\ell _{12}^{+},\quad \ell _{22}^{+\ast }=q_{22}\ell _{22}^{+},\end{eqnarray}$$
where
 $q_{11}=q_{2}\sqrt{\overline{\unicode[STIX]{x1D706}_{1}\unicode[STIX]{x1D706}_{1}}}/\unicode[STIX]{x1D706}_{U}$
and
$q_{11}=q_{2}\sqrt{\overline{\unicode[STIX]{x1D706}_{1}\unicode[STIX]{x1D706}_{1}}}/\unicode[STIX]{x1D706}_{U}$
and
 $q_{22}=q_{2}\sqrt{\overline{\unicode[STIX]{x1D706}_{2}\unicode[STIX]{x1D706}_{2}}}/\unicode[STIX]{x1D706}_{U}$
are two free parameters, since
$q_{22}=q_{2}\sqrt{\overline{\unicode[STIX]{x1D706}_{2}\unicode[STIX]{x1D706}_{2}}}/\unicode[STIX]{x1D706}_{U}$
are two free parameters, since
 $\overline{\unicode[STIX]{x1D706}_{1}\unicode[STIX]{x1D706}_{1}}$
and
$\overline{\unicode[STIX]{x1D706}_{1}\unicode[STIX]{x1D706}_{1}}$
and
 $\overline{\unicode[STIX]{x1D706}_{2}\unicode[STIX]{x1D706}_{2}}$
are free.
$\overline{\unicode[STIX]{x1D706}_{2}\unicode[STIX]{x1D706}_{2}}$
are free.
Under the constant dilation ansatz, equation (2.17) further leads to
 $$\begin{eqnarray}\ell _{11}^{+}=I_{11}^{buf}y^{+\unicode[STIX]{x1D6FD}_{11}},\quad \ell _{12}^{+}=I_{12}^{buf}y^{+2},\quad \ell _{22}^{+}=I_{22}^{buf}y^{+\unicode[STIX]{x1D6FD}_{22}},\end{eqnarray}$$
where
 $q_{11}=q_{2}^{\unicode[STIX]{x1D6FD}_{11}}$
and
$q_{11}=q_{2}^{\unicode[STIX]{x1D6FD}_{11}}$
and
 $q_{22}=q_{2}^{\unicode[STIX]{x1D6FD}_{22}}$
are substituted in. Note that
$q_{22}=q_{2}^{\unicode[STIX]{x1D6FD}_{22}}$
are substituted in. Note that
 $\ell _{12}^{+}=I_{12}^{buf}y^{+2}$
in the second equation of (2.18) has been obtained in Part 1. Further arguments are invoked to determine the values of
$\ell _{12}^{+}=I_{12}^{buf}y^{+2}$
in the second equation of (2.18) has been obtained in Part 1. Further arguments are invoked to determine the values of
 $\unicode[STIX]{x1D6FD}_{11}$
and
$\unicode[STIX]{x1D6FD}_{11}$
and
 $\unicode[STIX]{x1D6FD}_{22}$
. Consider the following ratios:
$\unicode[STIX]{x1D6FD}_{22}$
. Consider the following ratios:
 $$\begin{eqnarray}\ell _{11}^{+}/\ell _{12}^{+}=(I_{11}^{buf}/I_{12}^{buf})y^{+(\unicode[STIX]{x1D6FD}_{11}-2)},\quad \ell _{22}^{+}/\ell _{12}^{+}=(I_{22}^{buf}/I_{12}^{buf})y^{+(\unicode[STIX]{x1D6FD}_{22}-2)}.\end{eqnarray}$$
From (2.12),
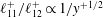 $\ell _{11}^{+}/\ell _{12}^{+}\propto 1/y^{+1/2}$
and
$\ell _{11}^{+}/\ell _{12}^{+}\propto 1/y^{+1/2}$
and
 $\ell _{22}^{+}/\ell _{12}^{+}\propto y^{+1/2}$
in the viscous sublayer. We assume that the two ratios representing the geometrical feature (e.g. a two-dimensional shape in the
$\ell _{22}^{+}/\ell _{12}^{+}\propto y^{+1/2}$
in the viscous sublayer. We assume that the two ratios representing the geometrical feature (e.g. a two-dimensional shape in the
 $x{-}y$
plane) of near-wall eddies remain invariant from the sublayer to the buffer layer – so that
$x{-}y$
plane) of near-wall eddies remain invariant from the sublayer to the buffer layer – so that
 $\unicode[STIX]{x1D6FD}_{11}=3/2$
and
$\unicode[STIX]{x1D6FD}_{11}=3/2$
and
 $\unicode[STIX]{x1D6FD}_{22}=5/2$
in (2.19). The mechanism for these invariant scalings is not clear yet, and is to be studied in future.
$\unicode[STIX]{x1D6FD}_{22}=5/2$
in (2.19). The mechanism for these invariant scalings is not clear yet, and is to be studied in future.
Note that the free parameter
 $q_{11}$
originates from the approximation (2.15). Without this approximation, repeating the same analysis would yield
$q_{11}$
originates from the approximation (2.15). Without this approximation, repeating the same analysis would yield
 $\overline{\unicode[STIX]{x1D706}_{1}\unicode[STIX]{x1D706}_{1}}=\unicode[STIX]{x1D706}_{U}^{2}$
,
$\overline{\unicode[STIX]{x1D706}_{1}\unicode[STIX]{x1D706}_{1}}=\unicode[STIX]{x1D706}_{U}^{2}$
,
 $q_{11}=q_{2}$
, and hence
$q_{11}=q_{2}$
, and hence
 $\ell _{11}^{+}\propto y^{+}$
– the same scaling as in the viscous sublayer (2.12). However, this contradicts the plot in figure 1(b), where
$\ell _{11}^{+}\propto y^{+}$
– the same scaling as in the viscous sublayer (2.12). However, this contradicts the plot in figure 1(b), where
 $\ell _{11}^{+}$
shows a distinct scaling transition from the viscous sublayer to the buffer layer. Thus, the approximation (2.14) (hence (2.15)) is necessary.
$\ell _{11}^{+}$
shows a distinct scaling transition from the viscous sublayer to the buffer layer. Thus, the approximation (2.14) (hence (2.15)) is necessary.
2.4 Homogeneous dilations in the core layer
Similar to Part 1, we change the independent variable from the wall distance
 $y^{+}$
to the distance from the centreline
$y^{+}$
to the distance from the centreline
 $r=1-y^{+}/Re_{\unicode[STIX]{x1D70F}}$
, with the corresponding outer scales in the other two directions, namely,
$r=1-y^{+}/Re_{\unicode[STIX]{x1D70F}}$
, with the corresponding outer scales in the other two directions, namely,
 $\tilde{x}=x^{+}/Re_{\unicode[STIX]{x1D70F}}$
and
$\tilde{x}=x^{+}/Re_{\unicode[STIX]{x1D70F}}$
and
 $\tilde{z}=z^{+}/Re_{\unicode[STIX]{x1D70F}}$
. Also, we introduce a velocity defect
$\tilde{z}=z^{+}/Re_{\unicode[STIX]{x1D70F}}$
. Also, we introduce a velocity defect
 $U_{d}^{+}=U_{c}^{+}-U^{+}$
(subscript
$U_{d}^{+}=U_{c}^{+}-U^{+}$
(subscript
 $c$
indicates centreline value) to replace the mean velocity in the balance equations, so that the centreline condition
$c$
indicates centreline value) to replace the mean velocity in the balance equations, so that the centreline condition
 $U_{d}^{+}=0$
– in analogy to
$U_{d}^{+}=0$
– in analogy to
 $U^{+}=0$
at the wall – remains unchanged under dilation. Note that if one applies (2.2) (also changing
$U^{+}=0$
at the wall – remains unchanged under dilation. Note that if one applies (2.2) (also changing
 $U^{+}$
to
$U^{+}$
to
 $U_{d}^{+}$
,
$U_{d}^{+}$
,
 $x^{+}$
to
$x^{+}$
to
 $\tilde{x}$
,
$\tilde{x}$
,
 $y^{+}$
to
$y^{+}$
to
 $r$
and
$r$
and
 $z^{+}$
to
$z^{+}$
to
 $\tilde{z}$
) to the balance equations scaled in outer units, one would obtain uniform dilations
$\tilde{z}$
) to the balance equations scaled in outer units, one would obtain uniform dilations
 $\overline{\unicode[STIX]{x1D706}_{1}\unicode[STIX]{x1D706}_{2}}=\overline{\unicode[STIX]{x1D706}_{i}\unicode[STIX]{x1D706}_{i}}=q_{i}$
and hence the same power law for all the lengths. However, this contradicts the centre asymptotes:
$\overline{\unicode[STIX]{x1D706}_{1}\unicode[STIX]{x1D706}_{2}}=\overline{\unicode[STIX]{x1D706}_{i}\unicode[STIX]{x1D706}_{i}}=q_{i}$
and hence the same power law for all the lengths. However, this contradicts the centre asymptotes:
 $$\begin{eqnarray}\ell _{12}\propto 1/\sqrt{r};\quad \ell _{ii}\propto 1/r\end{eqnarray}$$
(
 $i=1,2,3$
), explained as follows. In the limit
$i=1,2,3$
), explained as follows. In the limit
 $r\rightarrow 0$
, using Taylor expansion,
$r\rightarrow 0$
, using Taylor expansion,
 $U_{d}^{+}\sim r^{2}$
(due to the mirror symmetry
$U_{d}^{+}\sim r^{2}$
(due to the mirror symmetry
 $\unicode[STIX]{x2202}_{r}U^{+}=0$
at
$\unicode[STIX]{x2202}_{r}U^{+}=0$
at
 $r=0$
), and
$r=0$
), and
 $W_{12}^{+}\approx r$
, thus
$W_{12}^{+}\approx r$
, thus
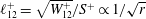 $\ell _{12}^{+}=\sqrt{W_{12}^{+}}/S^{+}\propto 1/\sqrt{r}$
; on the other hand, the well-known fact
$\ell _{12}^{+}=\sqrt{W_{12}^{+}}/S^{+}\propto 1/\sqrt{r}$
; on the other hand, the well-known fact
 $\overline{u_{i}^{\prime }u_{i}^{\prime }}\rightarrow C_{i}>0$
leads to
$\overline{u_{i}^{\prime }u_{i}^{\prime }}\rightarrow C_{i}>0$
leads to
 $\ell _{ii}^{+}=\sqrt{W_{ii}^{+}}/S^{+}\propto 1/r$
near the centre. Hence, we obtain (2.20), where
$\ell _{ii}^{+}=\sqrt{W_{ii}^{+}}/S^{+}\propto 1/r$
near the centre. Hence, we obtain (2.20), where
 $\ell _{ij}=\ell _{ij}^{+}/Re_{\unicode[STIX]{x1D70F}}$
.
$\ell _{ij}=\ell _{ij}^{+}/Re_{\unicode[STIX]{x1D70F}}$
.
To obtain (2.20) from symmetry analysis, additional physical considerations are needed. As we know, when
 $r\rightarrow 0$
, mean shear
$r\rightarrow 0$
, mean shear
 $S^{+}$
is much smaller than
$S^{+}$
is much smaller than
 $W_{12}^{+}$
and hence can be ignored in the mean momentum equation; meanwhile, for the stress equations, production and viscous diffusion terms approach zero and can be ignored also, whilst turbulent transport, pressure–strain and dissipation are the dominant terms. Note that for
$W_{12}^{+}$
and hence can be ignored in the mean momentum equation; meanwhile, for the stress equations, production and viscous diffusion terms approach zero and can be ignored also, whilst turbulent transport, pressure–strain and dissipation are the dominant terms. Note that for
 $W_{12}^{+}$
, dissipation is much smaller than pressure–strain and turbulent transport (Pope Reference Pope2000) hence also ignored. Thus, approximate balance equations for the core layer are obtained as
$W_{12}^{+}$
, dissipation is much smaller than pressure–strain and turbulent transport (Pope Reference Pope2000) hence also ignored. Thus, approximate balance equations for the core layer are obtained as
 $$\begin{eqnarray}\displaystyle & \displaystyle \frac{\unicode[STIX]{x2202}W_{12}^{+}}{\unicode[STIX]{x2202}r}+1\approx 0, & \displaystyle\end{eqnarray}$$
 $$\begin{eqnarray}\displaystyle & \displaystyle 0\approx -\overline{u^{\prime }\frac{\unicode[STIX]{x2202}p^{\prime }}{\unicode[STIX]{x2202}\tilde{x}}}^{+}+\frac{\unicode[STIX]{x2202}}{\unicode[STIX]{x2202}r}\left(\frac{1}{2}\overline{u^{\prime }u^{\prime }v^{\prime }}^{+}\right)-\frac{1}{Re_{\unicode[STIX]{x1D70F}}}\overline{|\unicode[STIX]{x1D735}u^{\prime }|^{+}}^{2}, & \displaystyle\end{eqnarray}$$
 $$\begin{eqnarray}\displaystyle & \displaystyle 0\approx -\overline{v^{\prime }\frac{\unicode[STIX]{x2202}p^{\prime }}{\unicode[STIX]{x2202}r}}^{+}+\frac{\unicode[STIX]{x2202}}{\unicode[STIX]{x2202}r}\left(\frac{1}{2}\overline{v^{\prime }v^{\prime }v^{\prime }}^{+}\right)-\frac{1}{Re_{\unicode[STIX]{x1D70F}}}\overline{|\unicode[STIX]{x1D735}v^{\prime }|^{+}}^{2}, & \displaystyle\end{eqnarray}$$
 $$\begin{eqnarray}\displaystyle & \displaystyle 0\approx -\overline{w^{\prime }\frac{\unicode[STIX]{x2202}p^{\prime }}{\unicode[STIX]{x2202}\tilde{z}}}^{+}+\frac{\unicode[STIX]{x2202}}{\unicode[STIX]{x2202}r}\left(\frac{1}{2}\overline{w^{\prime }w^{\prime }v^{\prime }}^{+}\right)-\frac{1}{Re_{\unicode[STIX]{x1D70F}}}\overline{|\unicode[STIX]{x1D735}w^{\prime }|^{+}}^{2}, & \displaystyle\end{eqnarray}$$
 $$\begin{eqnarray}\displaystyle & \displaystyle 0\approx \frac{1}{2}\overline{u^{\prime }\frac{\unicode[STIX]{x2202}p^{\prime }}{\unicode[STIX]{x2202}r}}^{+}-\frac{1}{2}\overline{v^{\prime }\frac{\unicode[STIX]{x2202}p^{\prime }}{\unicode[STIX]{x2202}\tilde{x}}}^{+}+\frac{\unicode[STIX]{x2202}}{\unicode[STIX]{x2202}r}\left(\frac{1}{2}\overline{u^{\prime }v^{\prime }v^{\prime }}^{+}\right). & \displaystyle\end{eqnarray}$$
 $$\begin{eqnarray}\displaystyle q_{1}=q_{2}=q_{3}=q=\overline{\unicode[STIX]{x1D706}_{1}\unicode[STIX]{x1D706}_{2}}, & & \displaystyle\end{eqnarray}$$
 $$\begin{eqnarray}\displaystyle \overline{\unicode[STIX]{x1D706}_{1}\unicode[STIX]{x1D706}_{p}}=\overline{\unicode[STIX]{x1D706}_{2}\unicode[STIX]{x1D706}_{p}}=\overline{\unicode[STIX]{x1D706}_{1}\unicode[STIX]{x1D706}_{2}\unicode[STIX]{x1D706}_{2}},\quad \overline{\unicode[STIX]{x1D706}_{i}\unicode[STIX]{x1D706}_{p}}=\overline{\unicode[STIX]{x1D706}_{i}\unicode[STIX]{x1D706}_{i}\unicode[STIX]{x1D706}_{2}}=\overline{\unicode[STIX]{x1D706}_{i}\unicode[STIX]{x1D706}_{i}}/(q\unicode[STIX]{x1D706}_{R}). & & \displaystyle\end{eqnarray}$$
 $$\begin{eqnarray}\ell _{12}^{\ast }=(\sqrt{q^{3}}/\unicode[STIX]{x1D706}_{U})\ell _{12},\quad \ell _{ii}^{\ast }=\left(q\sqrt{\overline{\unicode[STIX]{x1D706}_{i}\unicode[STIX]{x1D706}_{i}}}/\unicode[STIX]{x1D706}_{U}\right)\ell _{ii}.\end{eqnarray}$$
Now, we show that the result (2.23) is consistent with the expansion solution (2.20) in the core layer. Note that as
 $r\rightarrow 0$
,
$r\rightarrow 0$
,
 $U_{d}^{+}\sim r^{2}$
, thus
$U_{d}^{+}\sim r^{2}$
, thus
 $\unicode[STIX]{x1D706}_{U}=q^{2}$
. Moreover,
$\unicode[STIX]{x1D706}_{U}=q^{2}$
. Moreover,
 $\overline{u_{i}^{\prime }u_{i}^{\prime }}\rightarrow C_{i}>0$
, which gives
$\overline{u_{i}^{\prime }u_{i}^{\prime }}\rightarrow C_{i}>0$
, which gives
 $\overline{\unicode[STIX]{x1D706}_{i}\unicode[STIX]{x1D706}_{i}}=1$
. Further, with
$\overline{\unicode[STIX]{x1D706}_{i}\unicode[STIX]{x1D706}_{i}}=1$
. Further, with
 $\overline{\unicode[STIX]{x1D706}_{1}\unicode[STIX]{x1D706}_{2}}=q$
in (2.22a
) (consistent with
$\overline{\unicode[STIX]{x1D706}_{1}\unicode[STIX]{x1D706}_{2}}=q$
in (2.22a
) (consistent with
 $W_{12}^{+}\sim r$
), equation (2.23) leads to
$W_{12}^{+}\sim r$
), equation (2.23) leads to
 $\ell _{12}^{\ast }=(1/\sqrt{q})\ell _{12}$
,
$\ell _{12}^{\ast }=(1/\sqrt{q})\ell _{12}$
,
 $\ell _{ii}^{\ast }=(1/q)\ell _{ii}$
, and hence
$\ell _{ii}^{\ast }=(1/q)\ell _{ii}$
, and hence
 $\ell _{12}\sim r^{-1/2}$
,
$\ell _{12}\sim r^{-1/2}$
,
 $\ell _{ii}\sim r^{-1}$
. Therefore, we have the following power laws for the core layer (
$\ell _{ii}\sim r^{-1}$
. Therefore, we have the following power laws for the core layer (
 $i=1,2,3$
):
$i=1,2,3$
):
 $$\begin{eqnarray}\ell _{12}=I_{12}^{core}/\sqrt{r},\quad \ell _{ii}=I_{ii}^{core}/r.\end{eqnarray}$$
2.5 Homogeneous dilations in the bulk layer
Unlike in the core layer, productions in the bulk are the dominant terms in the stress equations and hence cannot be ignored. Thus, by including
 $\overline{u^{\prime }v^{\prime }}^{+}\unicode[STIX]{x2202}_{r}U^{+}$
in (2.21b
) and
$\overline{u^{\prime }v^{\prime }}^{+}\unicode[STIX]{x2202}_{r}U^{+}$
in (2.21b
) and
 $\overline{v^{\prime }v^{\prime }}^{+}\unicode[STIX]{x2202}_{r}U^{+}$
in (2.21e
), and applying (2.2) to the new balance equations, one obtains
$\overline{v^{\prime }v^{\prime }}^{+}\unicode[STIX]{x2202}_{r}U^{+}$
in (2.21e
), and applying (2.2) to the new balance equations, one obtains
 $$\begin{eqnarray}\displaystyle q_{1}=q_{2}=q_{3}=q=\overline{\unicode[STIX]{x1D706}_{1}\unicode[STIX]{x1D706}_{2}}=\overline{\unicode[STIX]{x1D706}_{1}\unicode[STIX]{x1D706}_{1}}=\overline{\unicode[STIX]{x1D706}_{2}\unicode[STIX]{x1D706}_{2}},\quad \unicode[STIX]{x1D706}_{R}=1/(q\unicode[STIX]{x1D706}_{U}), & & \displaystyle\end{eqnarray}$$
 $$\begin{eqnarray}\overline{\unicode[STIX]{x1D706}_{1}\unicode[STIX]{x1D706}_{p}}=\overline{\unicode[STIX]{x1D706}_{2}\unicode[STIX]{x1D706}_{p}}=\overline{\unicode[STIX]{x1D706}_{2}\unicode[STIX]{x1D706}_{2}\unicode[STIX]{x1D706}_{2}}=\overline{\unicode[STIX]{x1D706}_{1}\unicode[STIX]{x1D706}_{1}\unicode[STIX]{x1D706}_{2}}=q\unicode[STIX]{x1D706}_{U}.\end{eqnarray}$$
 $$\begin{eqnarray}\ell _{ij}^{\ast }=(q^{3/2}/\unicode[STIX]{x1D706}_{U})\ell _{ij}\end{eqnarray}$$
for
 $i,j=1,2$
. Note that dilation on
$i,j=1,2$
. Note that dilation on
 $\ell _{33}$
is the same as
$\ell _{33}$
is the same as
 $\ell _{ij}$
in (2.26) under the isotropic turbulence assumption.
$\ell _{ij}$
in (2.26) under the isotropic turbulence assumption.
Denote
 $\unicode[STIX]{x1D706}_{U}=q^{3/2-\unicode[STIX]{x1D6FC}}$
so that lengths obey the following dilations in the bulk flow:
$\unicode[STIX]{x1D706}_{U}=q^{3/2-\unicode[STIX]{x1D6FC}}$
so that lengths obey the following dilations in the bulk flow:
 $$\begin{eqnarray}r^{\ast }=\text{e}^{\unicode[STIX]{x1D700}}r,\quad \ell _{ij}^{\ast }=\text{e}^{\unicode[STIX]{x1D6FC}\unicode[STIX]{x1D700}}\ell _{ij}.\end{eqnarray}$$
Now, following the second ansatz in Part 1, the differential invariants of the lengths are assumed to be constants in the bulk layer, leading to
 $$\begin{eqnarray}(\text{d}/\text{d}r)\ell _{ij}=I_{ij}r^{\unicode[STIX]{x1D6FC}-1},\end{eqnarray}$$
(where
 $I_{ij}$
are constants). After integration with respect to
$I_{ij}$
are constants). After integration with respect to
 $r$
, equation (2.28) leads to
$r$
, equation (2.28) leads to
 $$\begin{eqnarray}\ell _{ij}=b_{ij}-\frac{I_{ij}r^{\unicode[STIX]{x1D6FC}}}{\unicode[STIX]{x1D6FC}}.\end{eqnarray}$$
Furthermore, in the limit
 $r\rightarrow 1$
(to the wall), all lengths go to zero, then we readily obtain (for
$r\rightarrow 1$
(to the wall), all lengths go to zero, then we readily obtain (for
 $i=1,2,3$
)
$i=1,2,3$
)
 $$\begin{eqnarray}\ell _{12}=I_{12}^{\prime }(1-r^{\unicode[STIX]{x1D6FC}});\quad \ell _{ii}=I_{ii}^{\prime }(1-r^{\unicode[STIX]{x1D6FC}}).\end{eqnarray}$$
Note that all the lengths in (2.30) asymptotes to the linear
 $y$
scaling (since
$y$
scaling (since
 $1-r^{\unicode[STIX]{x1D6FC}}=1-(1-y)^{\unicode[STIX]{x1D6FC}}\rightarrow \unicode[STIX]{x1D6FC}y$
), hence matching the linear scaling (2.8) in the log layer. Also, as explained in Part 1 and Chen, Hussain & She (Reference Chen, Hussain and She2016b
),
$1-r^{\unicode[STIX]{x1D6FC}}=1-(1-y)^{\unicode[STIX]{x1D6FC}}\rightarrow \unicode[STIX]{x1D6FC}y$
), hence matching the linear scaling (2.8) in the log layer. Also, as explained in Part 1 and Chen, Hussain & She (Reference Chen, Hussain and She2016b
),
 $\unicode[STIX]{x1D6FC}=4$
for channels and 5 for pipes.
$\unicode[STIX]{x1D6FC}=4$
for channels and 5 for pipes.
2.6 A summary of canonical dilation structure
A summary of the canonical scaling in the four layers of turbulent channels. Note that the log layer is contained in the bulk layer since
 $1-r^{4}\propto y$
as
$1-r^{4}\propto y$
as
 $r=1-y\rightarrow 1$
(towards the wall). For pipe flows, the scalings are the same as for channels except for
$r=1-y\rightarrow 1$
(towards the wall). For pipe flows, the scalings are the same as for channels except for
 $\ell _{ij}\propto 1-r^{5}$
in the bulk layer of pipes.
$\ell _{ij}\propto 1-r^{5}$
in the bulk layer of pipes.

The above scalings obtained in each layer for
 $\ell _{12}$
,
$\ell _{12}$
,
 $\ell _{11}$
and
$\ell _{11}$
and
 $\ell _{22}$
are summarized in table 1. Then, following exactly the same matching procedure in Part 1 (using the third ansatz and the multiplicative rule; see appendix A), we readily obtain the following multilayer formula of lengths for channels:
$\ell _{22}$
are summarized in table 1. Then, following exactly the same matching procedure in Part 1 (using the third ansatz and the multiplicative rule; see appendix A), we readily obtain the following multilayer formula of lengths for channels:
 $$\begin{eqnarray}\displaystyle & \displaystyle \ell _{12}^{+}=c_{12}y^{+3/2}\left(\!1+\left(\frac{y^{+}}{y_{sub}^{+}}\right)^{4}\right)^{1/8}\left(\!1+\left(\frac{y^{+}}{y_{buf}^{+}}\right)^{4}\right)^{-1/4}\frac{1-r^{4}}{4(1-r)}\,\left(\!1+\left(\frac{r_{core}}{r}\right)^{2}\right)^{1/4},\qquad & \displaystyle\end{eqnarray}$$
 $$\begin{eqnarray}\displaystyle & \displaystyle \ell _{11}^{+}=c_{11}y^{+}\left(\!1+\left(\frac{y^{+}}{y_{sub}^{+}}\right)^{4}\right)^{1/8}\left(\!1+\left(\frac{y^{+}}{y_{buf}^{+}}\right)^{4}\right)^{-1/8}\frac{1-r^{4}}{4(1-r)}\left(\!1+\left(\frac{r_{core}}{r}\right)^{2}\right)^{1/2},\qquad & \displaystyle\end{eqnarray}$$
 $$\begin{eqnarray}\displaystyle & \displaystyle \ell _{22}^{+}=c_{22}y^{+2}\!\left(\!1+\left(\frac{y^{+}}{y_{sub}^{+}}\right)^{4}\right)^{1/8}\!\left(\!1+\left(\frac{y^{+}}{y_{buf}^{+}}\right)^{4}\right)^{-3/8}\frac{1-r^{4}}{4(1-r)}\left(\!1+\left(\frac{r_{core}}{r}\right)^{2}\right)^{1/2}. & \displaystyle\end{eqnarray}$$
Note that (2.31) has been obtained in Part 1, and the lengths in the above equations (2.31)–(2.33) are the same for both channels and pipes – except for the bulk factor being
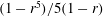 $(1-r^{5})/5(1-r)$
in pipes. Here,
$(1-r^{5})/5(1-r)$
in pipes. Here,
 $c_{ij}$
(
$c_{ij}$
(
 $i,j=1,2$
) are the global proportionality coefficients (represented by Kármán-like constants
$i,j=1,2$
) are the global proportionality coefficients (represented by Kármán-like constants
 $\unicode[STIX]{x1D705}_{ij}$
defined later), which may have a moderate
$\unicode[STIX]{x1D705}_{ij}$
defined later), which may have a moderate
 $Re$
dependence, and are responsible for the finite
$Re$
dependence, and are responsible for the finite
 $Re$
-scaling for the peak magnitude of Reynolds stresses (see detailed analysis below).
$Re$
-scaling for the peak magnitude of Reynolds stresses (see detailed analysis below).
The above equations therefore lead to
 $$\begin{eqnarray}\displaystyle & \displaystyle \unicode[STIX]{x1D6FC}_{11}=\frac{\ell _{11}^{+}}{\ell _{12}^{+}}=\frac{\sqrt{W_{11}^{+}}}{\sqrt{W_{12}^{+}}}=c_{1}\left(1+\left(\frac{y_{buf}^{+}}{y^{+}}\right)^{4}\right)^{1/8}\left(1+\left(\frac{r_{core}}{r}\right)^{2}\right)^{1/4}, & \displaystyle\end{eqnarray}$$
 $$\begin{eqnarray}\displaystyle & \displaystyle \unicode[STIX]{x1D6FC}_{22}=\frac{\ell _{22}^{+}}{\ell _{12}^{+}}=\frac{\sqrt{W_{22}^{+}}}{\sqrt{W_{12}^{+}}}=c_{2}\left(1+\left(\frac{y_{buf}^{+}}{y^{+}}\right)^{4}\right)^{-1/8}\left(1+\left(\frac{r_{core}}{r}\right)^{2}\right)^{1/4}, & \displaystyle\end{eqnarray}$$
where
 $c_{1}=c_{11}/(c_{12}y_{buf}^{+1/2})$
and
$c_{1}=c_{11}/(c_{12}y_{buf}^{+1/2})$
and
 $c_{2}=c_{22}y_{buf}^{+1/2}/c_{12}$
. Note that
$c_{2}=c_{22}y_{buf}^{+1/2}/c_{12}$
. Note that
 $\unicode[STIX]{x1D6FC}_{11}$
and
$\unicode[STIX]{x1D6FC}_{11}$
and
 $\unicode[STIX]{x1D6FC}_{22}$
have been introduced and studied for compressible turbulent boundary layers (Morkovin Reference Morkovin and Favre1962; Bradshaw Reference Bradshaw1977; Zhang et al.
Reference Zhang, Bi, Hussain, Li and She2012). The two ratios can be interpreted to describe the relative sizes of turbulent eddies associated with different fluctuation components, which have simple scaling properties as follows. In the near-wall region, equation (2.34) yields
$\unicode[STIX]{x1D6FC}_{22}$
have been introduced and studied for compressible turbulent boundary layers (Morkovin Reference Morkovin and Favre1962; Bradshaw Reference Bradshaw1977; Zhang et al.
Reference Zhang, Bi, Hussain, Li and She2012). The two ratios can be interpreted to describe the relative sizes of turbulent eddies associated with different fluctuation components, which have simple scaling properties as follows. In the near-wall region, equation (2.34) yields
 $\unicode[STIX]{x1D6FC}_{11}\propto 1/\sqrt{y^{+}}$
as
$\unicode[STIX]{x1D6FC}_{11}\propto 1/\sqrt{y^{+}}$
as
 $y^{+}\rightarrow 0$
, because
$y^{+}\rightarrow 0$
, because
 $W_{11}^{+}\propto y^{+2}$
and
$W_{11}^{+}\propto y^{+2}$
and
 $W_{12}^{+}\propto y^{+3}$
. In the core layer,
$W_{12}^{+}\propto y^{+3}$
. In the core layer,
 $W_{12}^{+}\approx r$
and
$W_{12}^{+}\approx r$
and
 $W_{11}^{+}=\text{const.}$
, hence
$W_{11}^{+}=\text{const.}$
, hence
 $\unicode[STIX]{x1D6FC}_{11}\propto 1/\sqrt{r}$
. In the overlap region, i.e.
$\unicode[STIX]{x1D6FC}_{11}\propto 1/\sqrt{r}$
. In the overlap region, i.e.
 $y^{+}\gg 1$
and
$y^{+}\gg 1$
and
 $r\rightarrow 1$
, fluctuations are nearly isotropic; hence
$r\rightarrow 1$
, fluctuations are nearly isotropic; hence
 $\unicode[STIX]{x1D6FC}_{11}\approx \text{const.}$
(an anomalous scaling modification will be introduced for the emergence of outer peak of
$\unicode[STIX]{x1D6FC}_{11}\approx \text{const.}$
(an anomalous scaling modification will be introduced for the emergence of outer peak of
 $\overline{u^{\prime }u^{\prime }}$
, as explained later). Similarly, for
$\overline{u^{\prime }u^{\prime }}$
, as explained later). Similarly, for
 $\unicode[STIX]{x1D6FC}_{22}$
, equation (2.35) yields
$\unicode[STIX]{x1D6FC}_{22}$
, equation (2.35) yields
 $\unicode[STIX]{x1D6FC}_{22}\propto \sqrt{y^{+}}$
as
$\unicode[STIX]{x1D6FC}_{22}\propto \sqrt{y^{+}}$
as
 $y^{+}\rightarrow 0$
, due to
$y^{+}\rightarrow 0$
, due to
 $v^{\prime }\propto y^{2}$
; the overlap region and core layer scaling of
$v^{\prime }\propto y^{2}$
; the overlap region and core layer scaling of
 $\unicode[STIX]{x1D6FC}_{22}$
are the same as
$\unicode[STIX]{x1D6FC}_{22}$
are the same as
 $\unicode[STIX]{x1D6FC}_{11}$
. Also note that the exponent 2 of the core layer factor
$\unicode[STIX]{x1D6FC}_{11}$
. Also note that the exponent 2 of the core layer factor
 $(r_{core}/r)^{2}$
in (2.34) and (2.35) leads to a parabolic profile for each Reynolds normal stress, i.e.
$(r_{core}/r)^{2}$
in (2.34) and (2.35) leads to a parabolic profile for each Reynolds normal stress, i.e.
 $W_{ii}^{+}-W_{iic}^{+}\propto r^{2}$
, hence satisfying mirror symmetry at the centreline.
$W_{ii}^{+}-W_{iic}^{+}\propto r^{2}$
, hence satisfying mirror symmetry at the centreline.
The above analysis of
 $\unicode[STIX]{x1D6FC}_{11}$
and
$\unicode[STIX]{x1D6FC}_{11}$
and
 $\unicode[STIX]{x1D6FC}_{22}$
also applies to
$\unicode[STIX]{x1D6FC}_{22}$
also applies to
 $\unicode[STIX]{x1D6FC}_{33}$
(
$\unicode[STIX]{x1D6FC}_{33}$
(
 $\equiv \sqrt{W_{33}^{+}/W_{12}^{+}}$
). As
$\equiv \sqrt{W_{33}^{+}/W_{12}^{+}}$
). As
 $W_{33}^{+}\propto y^{+2}$
and
$W_{33}^{+}\propto y^{+2}$
and
 $W_{12}^{+}\propto y^{+3}$
when
$W_{12}^{+}\propto y^{+3}$
when
 $y^{+}\rightarrow 0$
, one has
$y^{+}\rightarrow 0$
, one has
 $\unicode[STIX]{x1D6FC}_{33}\propto 1/\sqrt{y^{+}}$
. Near the centre,
$\unicode[STIX]{x1D6FC}_{33}\propto 1/\sqrt{y^{+}}$
. Near the centre,
 $\unicode[STIX]{x1D6FC}_{33}\propto 1/\sqrt{r}$
due to a non-zero value of
$\unicode[STIX]{x1D6FC}_{33}\propto 1/\sqrt{r}$
due to a non-zero value of
 $W_{33}^{+}$
at
$W_{33}^{+}$
at
 $r=0$
. In the overlap region, the isotropic turbulence assumption implies the same scaling for all quantities, and hence a constant
$r=0$
. In the overlap region, the isotropic turbulence assumption implies the same scaling for all quantities, and hence a constant
 $\unicode[STIX]{x1D6FC}_{33}$
(an anomalous scaling modification will be introduced later). Since all the scalings in these three layers are the same as those of
$\unicode[STIX]{x1D6FC}_{33}$
(an anomalous scaling modification will be introduced later). Since all the scalings in these three layers are the same as those of
 $\unicode[STIX]{x1D6FC}_{11}$
, we expect that
$\unicode[STIX]{x1D6FC}_{11}$
, we expect that
 $\unicode[STIX]{x1D6FC}_{33}$
takes the same functional form as
$\unicode[STIX]{x1D6FC}_{33}$
takes the same functional form as
 $\unicode[STIX]{x1D6FC}_{11}$
in (2.34). However, there is a significant difference between
$\unicode[STIX]{x1D6FC}_{11}$
in (2.34). However, there is a significant difference between
 $W_{11}^{+}$
and
$W_{11}^{+}$
and
 $W_{33}^{+}$
in their balance mechanisms: the (net) production–dissipation balance of
$W_{33}^{+}$
in their balance mechanisms: the (net) production–dissipation balance of
 $W_{11}^{+}$
occurs until above the buffer layer thickness (hence the overlap region) – in contrast to the pressure–strain–dissipation balance of
$W_{11}^{+}$
occurs until above the buffer layer thickness (hence the overlap region) – in contrast to the pressure–strain–dissipation balance of
 $W_{33}^{+}$
just above the sublayer thickness. Because of this difference, the scaling transition to the overlap region occurs earlier at
$W_{33}^{+}$
just above the sublayer thickness. Because of this difference, the scaling transition to the overlap region occurs earlier at
 $y_{sub}^{+}$
for
$y_{sub}^{+}$
for
 $\unicode[STIX]{x1D6FC}_{33}$
, in contrast to at
$\unicode[STIX]{x1D6FC}_{33}$
, in contrast to at
 $y_{buf}^{+}$
for
$y_{buf}^{+}$
for
 $\unicode[STIX]{x1D6FC}_{11}$
. Thus, the expression for
$\unicode[STIX]{x1D6FC}_{11}$
. Thus, the expression for
 $\unicode[STIX]{x1D6FC}_{33}$
is
$\unicode[STIX]{x1D6FC}_{33}$
is
 $$\begin{eqnarray}\unicode[STIX]{x1D6FC}_{33}=\frac{\ell _{33}^{+}}{\ell _{12}^{+}}=\frac{\sqrt{W_{33}^{+}}}{\sqrt{W_{12}^{+}}}=c_{3}\left(1+\left(\frac{y_{sub}^{+}}{y^{+}}\right)^{4}\right)^{1/8}\left(1+\left(\frac{r_{core}}{r}\right)^{2}\right)^{1/4}.\end{eqnarray}$$
Multiplying
 $\unicode[STIX]{x1D6FC}_{33}$
with
$\unicode[STIX]{x1D6FC}_{33}$
with
 $\ell _{12}^{+}$
yields
$\ell _{12}^{+}$
yields
 $$\begin{eqnarray}\ell _{33}^{+}=c_{33}y^{+}\left(1+\left(\frac{y^{+}}{y_{sub}^{+}}\right)^{4}\right)^{1/4}\left(1+\left(\frac{y^{+}}{y_{buf}^{+}}\right)^{4}\right)^{-1/4}\frac{1-r^{4}}{4(1-r)}\left(1+\left(\frac{r_{core}}{r}\right)^{2}\right)^{1/2},\end{eqnarray}$$
where
 $c_{33}=c_{3}c_{12}y_{sub}^{+1/2}$
. The local scaling of (2.37) is also summarized in table 1. Figure 1(b) shows the compensated plot for all lengths divided by
$c_{33}=c_{3}c_{12}y_{sub}^{+1/2}$
. The local scaling of (2.37) is also summarized in table 1. Figure 1(b) shows the compensated plot for all lengths divided by
 $1-r^{4}$
, where a typical four-layer structure is clearly visible.
$1-r^{4}$
, where a typical four-layer structure is clearly visible.
In the sections below, we will compare above formulae with data. It turns out that two normal fluctuation-related components, i.e.
 $W_{12}^{+}$
and
$W_{12}^{+}$
and
 $W_{22}^{+}$
(related to active motions), follow exactly the canonical four-layer description. The two other components
$W_{22}^{+}$
(related to active motions), follow exactly the canonical four-layer description. The two other components
 $W_{11}^{+}$
and
$W_{11}^{+}$
and
 $W_{33}^{+}$
(related to inactive motions) show notable departures from the four-layer descriptions (which lead to constant
$W_{33}^{+}$
(related to inactive motions) show notable departures from the four-layer descriptions (which lead to constant
 $W_{11}^{+}$
and
$W_{11}^{+}$
and
 $W_{33}^{+}$
in the bulk), but are readily improved by the aforementioned, slight modifications of the scalings in the log layer.
$W_{33}^{+}$
in the bulk), but are readily improved by the aforementioned, slight modifications of the scalings in the log layer.
3 Reynolds shear stress
 $W_{12}^{+}$

Integrating the mean momentum equation with respect to the wall distance
 $$\begin{eqnarray}S^{+}+W_{12}^{+}=1-y^{+}/Re_{\unicode[STIX]{x1D70F}}=r,\end{eqnarray}$$
and solving it yields a quadratic expression for the Reynolds shear stress
 $W_{12}^{+}$
:
$W_{12}^{+}$
:
 $$\begin{eqnarray}W_{12}^{+}=r-S^{+}=r\left[1-2/\left(1+\sqrt{1+4r\ell _{12}^{+2}}\right)\right],\end{eqnarray}$$
where
 $\ell _{12}^{+}$
is given in (2.31). According to Part 1, the parameter
$\ell _{12}^{+}$
is given in (2.31). According to Part 1, the parameter
 $c_{12}$
in (2.31) is
$c_{12}$
in (2.31) is
 $$\begin{eqnarray}c_{12}=\ell _{0}/(y_{sub}^{+3/2}Z_{core}),\quad \ell _{0}=\unicode[STIX]{x1D705}y_{sub}^{+2}/y_{buf}^{+},\quad Z_{core}=(1+r_{core}^{2})^{1/4},\end{eqnarray}$$
where
 $y_{sub}^{+}=9.7$
,
$y_{sub}^{+}=9.7$
,
 $\unicode[STIX]{x1D705}=0.45$
,
$\unicode[STIX]{x1D705}=0.45$
,
 $y_{buf}^{+}=41$
and
$y_{buf}^{+}=41$
and
 $r_{core}=0.27$
. Thus, equation (3.3) gives
$r_{core}=0.27$
. Thus, equation (3.3) gives
 $\ell _{0}\approx 1.03$
,
$\ell _{0}\approx 1.03$
,
 $Z_{core}\approx 1.02$
and
$Z_{core}\approx 1.02$
and
 $c_{12}\approx 0.033$
. Figure 2 shows that the corresponding
$c_{12}\approx 0.033$
. Figure 2 shows that the corresponding
 $W_{12}^{+}$
profiles compare well with data, with the departure bounded within
$W_{12}^{+}$
profiles compare well with data, with the departure bounded within
 $\pm 0.01$
. Note that Part 1 found
$\pm 0.01$
. Note that Part 1 found
 $y_{buf}^{+}$
and
$y_{buf}^{+}$
and
 $r_{core}$
weakly dependent on
$r_{core}$
weakly dependent on
 $Re$
for the description of MVP; however, they are not sensitive to
$Re$
for the description of MVP; however, they are not sensitive to
 $Re$
for the description of
$Re$
for the description of
 $W_{12}^{+}$
and hence are kept constants through this paper. Below, we discuss two interesting issues: namely, the location of maximum production, and the scaling of the
$W_{12}^{+}$
and hence are kept constants through this paper. Below, we discuss two interesting issues: namely, the location of maximum production, and the scaling of the
 $W_{12}^{+}$
peak value and its location.
$W_{12}^{+}$
peak value and its location.
Reynolds shear stress profiles by (3.2) (solid lines) compared with DNS data (symbols) for channel flows in coordinates
 $y^{+}$
(a) and
$y^{+}$
(a) and
 $y^{+}/Re_{\unicode[STIX]{x1D70F}}$
(b). The departure between data and our theory (i.e.
$y^{+}/Re_{\unicode[STIX]{x1D70F}}$
(b). The departure between data and our theory (i.e.
 $W_{12}^{+Theory}-W_{12}^{+DNS}$
) is shown in (c,d), which is bounded within
$W_{12}^{+Theory}-W_{12}^{+DNS}$
) is shown in (c,d), which is bounded within
 $\pm 0.01$
. DNS channel data from Iwamoto, Suzuki & Kasagi (Reference Iwamoto, Suzuki and Kasagi2002) for
$\pm 0.01$
. DNS channel data from Iwamoto, Suzuki & Kasagi (Reference Iwamoto, Suzuki and Kasagi2002) for
 $Re_{\unicode[STIX]{x1D70F}}=300,650$
, Hoyas & Jimenez (Reference Hoyas and Jimenez2006) for
$Re_{\unicode[STIX]{x1D70F}}=300,650$
, Hoyas & Jimenez (Reference Hoyas and Jimenez2006) for
 $Re_{\unicode[STIX]{x1D70F}}=940,2000$
; Lee & Moser (Reference Lee and Moser2015) at
$Re_{\unicode[STIX]{x1D70F}}=940,2000$
; Lee & Moser (Reference Lee and Moser2015) at
 $Re_{\unicode[STIX]{x1D70F}}=5200$
. Also included are the prediction of
$Re_{\unicode[STIX]{x1D70F}}=5200$
. Also included are the prediction of
 $W_{12}^{+}$
for
$W_{12}^{+}$
for
 $Re_{\unicode[STIX]{x1D70F}}=50\,000$
, awaiting future verification.
$Re_{\unicode[STIX]{x1D70F}}=50\,000$
, awaiting future verification.

3.1 Location of maximum production
Near the wall, the mean momentum equation (3.1) leads to
 $S^{+}+W_{12}^{+}\approx 1$
. Thus, the production
$S^{+}+W_{12}^{+}\approx 1$
. Thus, the production
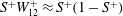 $S^{+}W_{12}^{+}\approx S^{+}(1-S^{+})$
has its maximum value of
$S^{+}W_{12}^{+}\approx S^{+}(1-S^{+})$
has its maximum value of
 $1/4$
, located at the
$1/4$
, located at the
 $y_{max}^{+}$
where
$y_{max}^{+}$
where
 $S^{+}=W_{12}^{+}=1/2$
. Then
$S^{+}=W_{12}^{+}=1/2$
. Then
 $\ell _{12}^{+}=\sqrt{W_{12}^{+}}/S^{+}=\sqrt{2}$
at
$\ell _{12}^{+}=\sqrt{W_{12}^{+}}/S^{+}=\sqrt{2}$
at
 $y_{max}^{+}$
.
$y_{max}^{+}$
.
On the other hand, as the wall is approached, i.e.
 $y^{+}\rightarrow 0$
, equation (2.31) asymptotes to its sublayer expression:
$y^{+}\rightarrow 0$
, equation (2.31) asymptotes to its sublayer expression:
 $$\begin{eqnarray}\ell _{12}^{+}=\ell _{0}(y^{+}/y_{sub}^{+})^{3/2}\approx (y^{+}/y_{sub}^{+})^{3/2}.\end{eqnarray}$$
Then, letting
 $\ell _{12}^{+}=\sqrt{2}$
in (3.4), one has
$\ell _{12}^{+}=\sqrt{2}$
in (3.4), one has
 $$\begin{eqnarray}y_{max}^{+}=\sqrt[3]{2}y_{sub}^{+}\approx 12.2,\end{eqnarray}$$
which is very close to the documented value of approximately 12 (Kim, Moin & Moser Reference Kim, Moin and Moser1987; Pope Reference Pope2000). The result
 $y_{max}^{+}\approx 12.2$
can be inverted to measure the sublayer thickness
$y_{max}^{+}\approx 12.2$
can be inverted to measure the sublayer thickness
 $y_{sub}^{+}\approx 9.7$
.
$y_{sub}^{+}\approx 9.7$
.
Note that
 $W_{12}^{+}$
predicted by (3.4) also agrees with data in most of the flow domain (not shown here) – except for the buffer layer. This is because: (1) for the outer region, equation (3.4) yields
$W_{12}^{+}$
predicted by (3.4) also agrees with data in most of the flow domain (not shown here) – except for the buffer layer. This is because: (1) for the outer region, equation (3.4) yields
 $\ell _{12}^{+}\gg 1$
, which leads to
$\ell _{12}^{+}\gg 1$
, which leads to
 $W_{12}^{+}\approx r$
– a good approximation in the entire outer flow; (2) for the inner region, equation (3.4) gives an accurate description of
$W_{12}^{+}\approx r$
– a good approximation in the entire outer flow; (2) for the inner region, equation (3.4) gives an accurate description of
 $W_{12}^{+}$
in the viscous sublayer. However, for the buffer layer, the simple sublayer formula (3.4) is insufficient and needs to be extended to predict how
$W_{12}^{+}$
in the viscous sublayer. However, for the buffer layer, the simple sublayer formula (3.4) is insufficient and needs to be extended to predict how
 $W_{12}^{+}$
approaches its peak value, addressed below.
$W_{12}^{+}$
approaches its peak value, addressed below.
3.2 Scaling for the peak of Reynolds shear stress
To determine the peak of
 $W_{12}$
, equation (3.2) is approximated to
$W_{12}$
, equation (3.2) is approximated to
 $W_{12}^{+}\approx r-\sqrt{r}/\ell _{12}^{+}$
(since
$W_{12}^{+}\approx r-\sqrt{r}/\ell _{12}^{+}$
(since
 $\ell _{12}^{+}\gg 1$
as
$\ell _{12}^{+}\gg 1$
as
 $y^{+}\gg y_{sub}^{+}$
). Further, with
$y^{+}\gg y_{sub}^{+}$
). Further, with
 $r=1-y^{+}/Re_{\unicode[STIX]{x1D70F}}$
, we have:
$r=1-y^{+}/Re_{\unicode[STIX]{x1D70F}}$
, we have:
 $$\begin{eqnarray}W_{12}^{+}\approx 1-y^{+}/Re_{\unicode[STIX]{x1D70F}}-1/\ell _{12}^{+}\end{eqnarray}$$
(the
 $1/Re_{\unicode[STIX]{x1D70F}}$
term in
$1/Re_{\unicode[STIX]{x1D70F}}$
term in
 $\sqrt{r}$
is small and ignored). Letting
$\sqrt{r}$
is small and ignored). Letting
 $\unicode[STIX]{x2202}_{y^{+}}W_{12}^{+}=0$
using (3.6), one has the following relation at the peak location (i.e.
$\unicode[STIX]{x2202}_{y^{+}}W_{12}^{+}=0$
using (3.6), one has the following relation at the peak location (i.e.
 $y_{12p}^{+}$
) of
$y_{12p}^{+}$
) of
 $W_{12}^{+}$
:
$W_{12}^{+}$
:
 $$\begin{eqnarray}Re_{\unicode[STIX]{x1D70F}}^{-1}=\dot{\ell }_{12}^{+}/\ell _{12}^{+2}.\end{eqnarray}$$
Here, the superscript dot indicates derivative with respect to
 $y^{+}$
.
$y^{+}$
.
By substituting the stress length (2.31) into (3.7) we can solve for
 $y_{12p}^{+}$
, which is located in the buffer layer for small
$y_{12p}^{+}$
, which is located in the buffer layer for small
 $Re$
, but in the log layer for large
$Re$
, but in the log layer for large
 $Re$
. Since
$Re$
. Since
 $\ell _{12}^{+}$
from (2.31) has the following two simple asymptotes:
$\ell _{12}^{+}$
from (2.31) has the following two simple asymptotes:
 $$\begin{eqnarray}\displaystyle & \ell _{12}^{+}\approx (\unicode[STIX]{x1D705}/y_{buf}^{+})y^{+2},\quad \text{for }y_{sub}^{+}\ll y_{12p}^{+}\lesssim y_{buf}^{+}, & \displaystyle\end{eqnarray}$$
 $$\begin{eqnarray}\displaystyle & \ell _{12}^{+}\approx \unicode[STIX]{x1D705}y^{+},\quad \text{for }y_{buf}^{+}\ll y_{12p}^{+}\ll Re_{\unicode[STIX]{x1D70F}}, & \displaystyle\end{eqnarray}$$
 $y_{12p}^{+}$
– obtained by substituting (3.8) into (3.7) – has the following two scalings:
$y_{12p}^{+}$
– obtained by substituting (3.8) into (3.7) – has the following two scalings:  $$\begin{eqnarray}\displaystyle & y_{12p}^{+}=Re_{\unicode[STIX]{x1D70F}}^{1/3}(2y_{buf}^{+}/\unicode[STIX]{x1D705})^{1/3}\approx 5.7Re_{\unicode[STIX]{x1D70F}}^{1/3}, & \displaystyle\end{eqnarray}$$
 $$\begin{eqnarray}\displaystyle & y_{12p}^{+}=Re_{\unicode[STIX]{x1D70F}}^{1/2}/\sqrt{\unicode[STIX]{x1D705}}\approx 1.5Re_{\unicode[STIX]{x1D70F}}^{1/2}. & \displaystyle\end{eqnarray}$$
 $Re_{\unicode[STIX]{x1D70F}}^{1/2}$
scaling has been found before (Sreenivasan Reference Sreenivasan1988; Sreenivasan & Sahay Reference Sreenivasan, Sahay and Panton1997; Klewicki et al.
Reference Klewicki, Chin, Blackburn, Ooi and Marusic2012; Lee & Moser Reference Lee and Moser2015), but the
$Re_{\unicode[STIX]{x1D70F}}^{1/2}$
scaling has been found before (Sreenivasan Reference Sreenivasan1988; Sreenivasan & Sahay Reference Sreenivasan, Sahay and Panton1997; Klewicki et al.
Reference Klewicki, Chin, Blackburn, Ooi and Marusic2012; Lee & Moser Reference Lee and Moser2015), but the
 $Re_{\unicode[STIX]{x1D70F}}^{1/3}$
scaling for small
$Re_{\unicode[STIX]{x1D70F}}^{1/3}$
scaling for small
 $Re$
is new. The latter
$Re$
is new. The latter
 $Re_{\unicode[STIX]{x1D70F}}^{1/3}$
scaling is very close to the
$Re_{\unicode[STIX]{x1D70F}}^{1/3}$
scaling is very close to the
 $Re_{\unicode[STIX]{x1D70F}}^{0.372}$
scaling found by Ahn, Lee & Sung (Reference Ahn, Lee and Sung2017) from DNS channel and pipe data. Figure 3(a) shows that these two scalings are in good agreement with data. Note that the scaling transition from
$Re_{\unicode[STIX]{x1D70F}}^{0.372}$
scaling found by Ahn, Lee & Sung (Reference Ahn, Lee and Sung2017) from DNS channel and pipe data. Figure 3(a) shows that these two scalings are in good agreement with data. Note that the scaling transition from
 $Re_{\unicode[STIX]{x1D70F}}^{1/3}$
to
$Re_{\unicode[STIX]{x1D70F}}^{1/3}$
to
 $Re_{\unicode[STIX]{x1D70F}}^{1/2}$
– which occurs around
$Re_{\unicode[STIX]{x1D70F}}^{1/2}$
– which occurs around
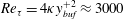 $Re_{\unicode[STIX]{x1D70F}}=4\unicode[STIX]{x1D705}y_{buf}^{+2}\approx 3000$
obtained by equalling (3.9a
) with (3.9b
) – is not sharp.
$Re_{\unicode[STIX]{x1D70F}}=4\unicode[STIX]{x1D705}y_{buf}^{+2}\approx 3000$
obtained by equalling (3.9a
) with (3.9b
) – is not sharp.
Scaling for the peak of Reynolds shear stress: (a) location; (b) magnitude defect. Solid lines denote (3.9a
) and (3.10a
) for low
 $Re$
, and dashed lines denote (3.9b
) and (3.10b
) for high
$Re$
, and dashed lines denote (3.9b
) and (3.10b
) for high
 $Re$
. Symbols are DNS data: squares from Iwamoto et al. (Reference Iwamoto, Suzuki and Kasagi2002) for
$Re$
. Symbols are DNS data: squares from Iwamoto et al. (Reference Iwamoto, Suzuki and Kasagi2002) for
 $Re_{\unicode[STIX]{x1D70F}}=300,400$
and 650 (channel); circles from Hoyas & Jimenez (Reference Hoyas and Jimenez2006) for
$Re_{\unicode[STIX]{x1D70F}}=300,400$
and 650 (channel); circles from Hoyas & Jimenez (Reference Hoyas and Jimenez2006) for
 $Re_{\unicode[STIX]{x1D70F}}=940$
and 2000 (channel); stars from Wu & Moin (Reference Wu and Moin2008) for
$Re_{\unicode[STIX]{x1D70F}}=940$
and 2000 (channel); stars from Wu & Moin (Reference Wu and Moin2008) for
 $Re_{\unicode[STIX]{x1D70F}}=1142$
(pipe); cross from Ahn et al. (Reference Ahn, Lee, Lee, Kang and Sung2015) for
$Re_{\unicode[STIX]{x1D70F}}=1142$
(pipe); cross from Ahn et al. (Reference Ahn, Lee, Lee, Kang and Sung2015) for
 $Re_{\unicode[STIX]{x1D70F}}=3008$
(pipe); and diamonds from Lee & Moser (Reference Lee and Moser2015) for
$Re_{\unicode[STIX]{x1D70F}}=3008$
(pipe); and diamonds from Lee & Moser (Reference Lee and Moser2015) for
 $Re_{\unicode[STIX]{x1D70F}}=550$
, 1000 and 5200 (channel).
$Re_{\unicode[STIX]{x1D70F}}=550$
, 1000 and 5200 (channel).

Also, the small departure of the peak value of
 $W_{12}^{+}$
from unity shows a scaling transition (figure 3
b), explained as follows. Substituting (3.8) and (3.9) back into (3.6) yields the departure:
$W_{12}^{+}$
from unity shows a scaling transition (figure 3
b), explained as follows. Substituting (3.8) and (3.9) back into (3.6) yields the departure:
 $$\begin{eqnarray}\displaystyle & 1-W_{12p}^{+}=3(y_{buf}^{+}/4\unicode[STIX]{x1D705})^{1/3}Re_{\unicode[STIX]{x1D70F}}^{-2/3}\approx 8.5Re_{\unicode[STIX]{x1D70F}}^{-2/3}, & \displaystyle\end{eqnarray}$$
 $$\begin{eqnarray}\displaystyle & 1-W_{12p}^{+}=(2/\sqrt{\unicode[STIX]{x1D705}})Re_{\unicode[STIX]{x1D70F}}^{-1/2}\approx 3.0Re_{\unicode[STIX]{x1D70F}}^{-1/2}. & \displaystyle\end{eqnarray}$$
 $Re$
-dependence of
$Re$
-dependence of
 $B_{12}$
in (1.1) since
$B_{12}$
in (1.1) since
 $B_{12}=W_{12p}^{+}$
(the plateau of
$B_{12}=W_{12p}^{+}$
(the plateau of
 $W_{12}^{+}$
in the log layer is well represented by its peak value).
$W_{12}^{+}$
in the log layer is well represented by its peak value).4 Wall-normal Reynolds stress
$W_{22}^{+}$

The wall-normal Reynolds stress
 $W_{22}$
(or the wall-normal fluctuation intensity) is related to the Reynolds shear stress
$W_{22}$
(or the wall-normal fluctuation intensity) is related to the Reynolds shear stress
 $W_{12}$
by
$W_{12}$
by
 $$\begin{eqnarray}W_{22}^{+}=W_{12}^{+}\ell _{22}^{+2}/\ell _{12}^{+2},\end{eqnarray}$$
which can then be obtained by the formulae developed in the above sections (i.e. (3.2), (2.31) and (2.33)). A direct test of the theoretical
 $\ell _{22}^{+}$
at two
$\ell _{22}^{+}$
at two
 $Re$
values (
$Re$
values (
 $Re_{\unicode[STIX]{x1D70F}}=940$
and 5200) is shown in figure 4, where the agreement is very good. Note that the parameter
$Re_{\unicode[STIX]{x1D70F}}=940$
and 5200) is shown in figure 4, where the agreement is very good. Note that the parameter
 $c_{22}$
(or equivalently
$c_{22}$
(or equivalently
 $\unicode[STIX]{x1D705}_{22}$
introduced below) is easily measured by the peak value of
$\unicode[STIX]{x1D705}_{22}$
introduced below) is easily measured by the peak value of
 $W_{22}^{+}$
from DNS data. Similarly, the core layer thickness
$W_{22}^{+}$
from DNS data. Similarly, the core layer thickness
 $r_{core}$
of
$r_{core}$
of
 $\ell _{22}^{+}$
in (2.33) – now denoted as
$\ell _{22}^{+}$
in (2.33) – now denoted as
 $r_{22core}$
– is measured to be 0.3 from the centreline value of
$r_{22core}$
– is measured to be 0.3 from the centreline value of
 $W_{22}^{+}$
, which is
$W_{22}^{+}$
, which is
 $10\,\%$
larger than
$10\,\%$
larger than
 $r_{core}=0.27$
for
$r_{core}=0.27$
for
 $\ell _{12}^{+}$
(explained later). With these two new parameters, the resulting
$\ell _{12}^{+}$
(explained later). With these two new parameters, the resulting
 $W_{22}^{+}$
profiles agree well with data (figure 5).
$W_{22}^{+}$
profiles agree well with data (figure 5).
Validation of (2.33) against DNS data for
 $\ell _{22}^{+}$
as a function of
$\ell _{22}^{+}$
as a function of
 $y^{+}$
(a) and
$y^{+}$
(a) and
 $y^{+}/Re_{\unicode[STIX]{x1D70F}}$
(b) with
$y^{+}/Re_{\unicode[STIX]{x1D70F}}$
(b) with
 $y_{sub}^{+}=9.7$
,
$y_{sub}^{+}=9.7$
,
 $y_{buf}^{+}=41$
(the same as for
$y_{buf}^{+}=41$
(the same as for
 $\ell _{12}^{+}$
),
$\ell _{12}^{+}$
),
 $\unicode[STIX]{x1D705}_{22}=0.52$
and
$\unicode[STIX]{x1D705}_{22}=0.52$
and
 $r_{22core}=0.3$
. Inset of (a) shows the compensated plot of
$r_{22core}=0.3$
. Inset of (a) shows the compensated plot of
 $\ell _{22}^{Theory}/\ell _{22}^{DNS}$
using (2.33) and DNS data, which are close to the unity in almost the entire flow region.
$\ell _{22}^{Theory}/\ell _{22}^{DNS}$
using (2.33) and DNS data, which are close to the unity in almost the entire flow region.

4.1 Measurement of
$\unicode[STIX]{x1D705}_{22}$

Let us consider the scaling of the peak value of
 $W_{22}^{+}$
for asymptotically large
$W_{22}^{+}$
for asymptotically large
 $Re$
. Let
$Re$
. Let
 $c_{22}=c_{22}^{\prime }/\sqrt{1+r_{22core}^{2}}$
in (2.33) so that
$c_{22}=c_{22}^{\prime }/\sqrt{1+r_{22core}^{2}}$
in (2.33) so that
 $\ell _{22}^{+}\approx c_{22}^{\prime }y^{+2}$
for
$\ell _{22}^{+}\approx c_{22}^{\prime }y^{+2}$
for
 $y^{+}\rightarrow 0$
. On the other hand, for
$y^{+}\rightarrow 0$
. On the other hand, for
 $y^{+}\gg y_{buf}^{+}$
, we obtain the linear scalings:
$y^{+}\gg y_{buf}^{+}$
, we obtain the linear scalings:
 $\ell _{12}^{+}\approx \unicode[STIX]{x1D705}y^{+}$
and
$\ell _{12}^{+}\approx \unicode[STIX]{x1D705}y^{+}$
and
 $\ell _{22}^{+}\approx \unicode[STIX]{x1D705}_{22}y^{+}$
, where
$\ell _{22}^{+}\approx \unicode[STIX]{x1D705}_{22}y^{+}$
, where
 $\unicode[STIX]{x1D705}_{22}=c_{22}^{\prime }y_{buf}^{+3/2}/y_{sub}^{+1/2}$
. Accordingly,
$\unicode[STIX]{x1D705}_{22}=c_{22}^{\prime }y_{buf}^{+3/2}/y_{sub}^{+1/2}$
. Accordingly,
 $W_{22}^{+}\approx W_{12}^{+}(\unicode[STIX]{x1D705}_{22}/\unicode[STIX]{x1D705})^{2}$
. Thus, its peak value is
$W_{22}^{+}\approx W_{12}^{+}(\unicode[STIX]{x1D705}_{22}/\unicode[STIX]{x1D705})^{2}$
. Thus, its peak value is
 $$\begin{eqnarray}W_{22p}^{+}\approx W_{12p}^{+}\unicode[STIX]{x1D705}_{22}^{2}/\unicode[STIX]{x1D705}^{2}.\end{eqnarray}$$
Therefore,
 $$\begin{eqnarray}\unicode[STIX]{x1D705}_{22}\approx \unicode[STIX]{x1D705}\sqrt{W_{22p}^{+}/W_{12p}^{+}}.\end{eqnarray}$$
This yields a method to measure the new constant
 $\unicode[STIX]{x1D705}_{22}$
. For
$\unicode[STIX]{x1D705}_{22}$
. For
 $Re_{\unicode[STIX]{x1D70F}}=5200$
, with
$Re_{\unicode[STIX]{x1D70F}}=5200$
, with
 $\unicode[STIX]{x1D705}=0.45$
, we predict
$\unicode[STIX]{x1D705}=0.45$
, we predict
 $W_{12p}^{+}\approx 0.96$
from (3.10b
). Then, with the measured
$W_{12p}^{+}\approx 0.96$
from (3.10b
). Then, with the measured
 $W_{22p}^{+}\approx 1.29$
from data at
$W_{22p}^{+}\approx 1.29$
from data at
 $Re_{\unicode[STIX]{x1D70F}}=5200$
(Lee & Moser Reference Lee and Moser2015), we obtain
$Re_{\unicode[STIX]{x1D70F}}=5200$
(Lee & Moser Reference Lee and Moser2015), we obtain
 $\unicode[STIX]{x1D705}_{22}\approx 0.52\approx 1.16\unicode[STIX]{x1D705}$
.
$\unicode[STIX]{x1D705}_{22}\approx 0.52\approx 1.16\unicode[STIX]{x1D705}$
.
Wall-normal Reynolds stress profiles by (4.1) compared with data. Also included are predictions at
 $Re_{\unicode[STIX]{x1D70F}}=50\,000$
. The departure between data and our theory (i.e.
$Re_{\unicode[STIX]{x1D70F}}=50\,000$
. The departure between data and our theory (i.e.
 $W_{22}^{+Theory}-W_{22}^{+DNS}$
) is shown in (c,d), which is bounded within
$W_{22}^{+Theory}-W_{22}^{+DNS}$
) is shown in (c,d), which is bounded within
 $\pm 0.1$
. For legend, see figure 2.
$\pm 0.1$
. For legend, see figure 2.

Note that according to
 $W_{22}^{+}\approx W_{12}^{+}(\unicode[STIX]{x1D705}_{22}/\unicode[STIX]{x1D705})^{2}$
,
$W_{22}^{+}\approx W_{12}^{+}(\unicode[STIX]{x1D705}_{22}/\unicode[STIX]{x1D705})^{2}$
,
 $W_{22}^{+}$
should reach its peak at the same location as the peak of
$W_{22}^{+}$
should reach its peak at the same location as the peak of
 $W_{12}^{+}$
for large
$W_{12}^{+}$
for large
 $Re$
; i.e.
$Re$
; i.e.
 $y_{22p}^{+}=\sqrt{Re_{\unicode[STIX]{x1D70F}}/\unicode[STIX]{x1D705}}$
. However,
$y_{22p}^{+}=\sqrt{Re_{\unicode[STIX]{x1D70F}}/\unicode[STIX]{x1D705}}$
. However,
 $Re$
for the current data is not high enough to show such a scaling, and higher-
$Re$
for the current data is not high enough to show such a scaling, and higher-
 $Re$
data are needed to test it.
$Re$
data are needed to test it.
4.2 Measurement of
$r_{22core}$

Near the centreline (as
 $r\rightarrow 0$
),
$r\rightarrow 0$
),
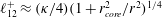 $\ell _{12}^{+}\approx (\unicode[STIX]{x1D705}/4)(1+r_{core}^{2}/r^{2})^{1/4}$
from (2.31), and
$\ell _{12}^{+}\approx (\unicode[STIX]{x1D705}/4)(1+r_{core}^{2}/r^{2})^{1/4}$
from (2.31), and
 $\ell _{22}^{+}\approx (\unicode[STIX]{x1D705}_{22}/4)(1+r_{22core}^{2}/r^{2})^{1/2}$
from (2.33). Further, with
$\ell _{22}^{+}\approx (\unicode[STIX]{x1D705}_{22}/4)(1+r_{22core}^{2}/r^{2})^{1/2}$
from (2.33). Further, with
 $W_{12}^{+}\approx r$
, the centreline value is given as
$W_{12}^{+}\approx r$
, the centreline value is given as
 $$\begin{eqnarray}W_{22c}^{+}=W_{12}^{+}(\ell _{22}^{+}/\ell _{12}^{+})^{2}\approx \unicode[STIX]{x1D705}_{22}^{2}r_{22core}^{2}/(\unicode[STIX]{x1D705}^{2}r_{core}),\end{eqnarray}$$
which leads to
 $$\begin{eqnarray}r_{22core}\approx (W_{22c}^{+}r_{core})^{1/2}(\unicode[STIX]{x1D705}/\unicode[STIX]{x1D705}_{22}).\end{eqnarray}$$
Thus, with
 $r_{core}=0.27$
,
$r_{core}=0.27$
,
 $\unicode[STIX]{x1D705}=0.45$
, as well as
$\unicode[STIX]{x1D705}=0.45$
, as well as
 $\unicode[STIX]{x1D705}_{22}\approx 0.52$
and
$\unicode[STIX]{x1D705}_{22}\approx 0.52$
and
 $W_{22c}^{+}\approx 0.47$
from DNS data (Lee & Moser Reference Lee and Moser2015), we have
$W_{22c}^{+}\approx 0.47$
from DNS data (Lee & Moser Reference Lee and Moser2015), we have
 $r_{22core}\approx 0.3$
. This also results in
$r_{22core}\approx 0.3$
. This also results in
 $\unicode[STIX]{x1D705}_{22}\approx 0.78W_{22c}^{+1/2}$
. Note that if one imposes
$\unicode[STIX]{x1D705}_{22}\approx 0.78W_{22c}^{+1/2}$
. Note that if one imposes
 $r_{22core}=r_{core}=0.27$
, the resulting
$r_{22core}=r_{core}=0.27$
, the resulting
 $W_{22c}^{+}$
from (4.4) would underpredict the data by 20 % at
$W_{22c}^{+}$
from (4.4) would underpredict the data by 20 % at
 $Re_{\unicode[STIX]{x1D70F}}=5200$
. For the smallest
$Re_{\unicode[STIX]{x1D70F}}=5200$
. For the smallest
 $Re_{\unicode[STIX]{x1D70F}}$
(
$Re_{\unicode[STIX]{x1D70F}}$
(
 $=300$
), DNS data shows
$=300$
), DNS data shows
 $W_{22c}^{+}\approx 0.39$
(Iwamoto et al.
Reference Iwamoto, Suzuki and Kasagi2002), so that (4.5) leads to
$W_{22c}^{+}\approx 0.39$
(Iwamoto et al.
Reference Iwamoto, Suzuki and Kasagi2002), so that (4.5) leads to
 $r_{22core}\approx 0.28$
. Therefore,
$r_{22core}\approx 0.28$
. Therefore,
 $r_{22core}$
varies mildly with increasing
$r_{22core}$
varies mildly with increasing
 $Re_{\unicode[STIX]{x1D70F}}$
(for a moderate
$Re_{\unicode[STIX]{x1D70F}}$
(for a moderate
 $Re_{\unicode[STIX]{x1D70F}}$
range).
$Re_{\unicode[STIX]{x1D70F}}$
range).
Substituting
 $\unicode[STIX]{x1D705}_{22}\approx 0.52$
and
$\unicode[STIX]{x1D705}_{22}\approx 0.52$
and
 $r_{22core}\approx 0.3$
into (2.33), where
$r_{22core}\approx 0.3$
into (2.33), where
 $c_{22}=\unicode[STIX]{x1D705}_{22}y_{sub}^{+1/2}/[y_{buf}^{+3}(1+r_{22core}^{2})]^{1/2}$
, the resulting
$c_{22}=\unicode[STIX]{x1D705}_{22}y_{sub}^{+1/2}/[y_{buf}^{+3}(1+r_{22core}^{2})]^{1/2}$
, the resulting
 $W_{22}^{+}$
profiles from (4.1) are shown in figure 5. The agreement is quite good, with the departure bounded within
$W_{22}^{+}$
profiles from (4.1) are shown in figure 5. The agreement is quite good, with the departure bounded within
 $\pm 0.1$
. Note that for the smallest
$\pm 0.1$
. Note that for the smallest
 $Re_{\unicode[STIX]{x1D70F}}(=300)$
, there is a slight overestimation of the peak magnitude. This small departure can be easily rectified by
$Re_{\unicode[STIX]{x1D70F}}(=300)$
, there is a slight overestimation of the peak magnitude. This small departure can be easily rectified by
 $\unicode[STIX]{x1D705}_{22}\approx 0.50$
at
$\unicode[STIX]{x1D705}_{22}\approx 0.50$
at
 $Re_{\unicode[STIX]{x1D70F}}=300$
; hence
$Re_{\unicode[STIX]{x1D70F}}=300$
; hence
 $\unicode[STIX]{x1D705}_{22}$
slightly changes for moderate
$\unicode[STIX]{x1D705}_{22}$
slightly changes for moderate
 $Re$
.
$Re$
.
5 Spanwise Reynolds stress
$W_{33}^{+}$

The spanwise Reynolds stress
 $W_{33}$
is related to the Reynolds shear stress
$W_{33}$
is related to the Reynolds shear stress
 $W_{12}$
by
$W_{12}$
by
 $$\begin{eqnarray}W_{33}^{+}=W_{12}^{+}\ell _{33}^{+2}/\ell _{12}^{+2}.\end{eqnarray}$$
In (2.37), all the layer thicknesses of
 $\ell _{33}$
are the same as those of
$\ell _{33}$
are the same as those of
 $\ell _{12}$
; then
$\ell _{12}$
; then
 $c_{33}$
is the only free parameter. Again, let
$c_{33}$
is the only free parameter. Again, let
 $c_{33}=c_{33}^{\prime }/\sqrt{1+r_{core}^{2}}$
so that
$c_{33}=c_{33}^{\prime }/\sqrt{1+r_{core}^{2}}$
so that
 $\ell _{33}^{+}\approx c_{33}^{\prime }y^{+}$
as
$\ell _{33}^{+}\approx c_{33}^{\prime }y^{+}$
as
 $y^{+}\rightarrow 0$
(or
$y^{+}\rightarrow 0$
(or
 $r\rightarrow 1$
), and
$r\rightarrow 1$
), and
 $c_{33}^{\prime }=\unicode[STIX]{x1D705}_{33}y_{sub}^{+}/y_{buf}^{+}$
so that
$c_{33}^{\prime }=\unicode[STIX]{x1D705}_{33}y_{sub}^{+}/y_{buf}^{+}$
so that
 $\ell _{33}^{+}\approx \unicode[STIX]{x1D705}_{33}y^{+}$
as
$\ell _{33}^{+}\approx \unicode[STIX]{x1D705}_{33}y^{+}$
as
 $y^{+}\gg y_{buf}^{+}$
. Comparison of
$y^{+}\gg y_{buf}^{+}$
. Comparison of
 $\ell _{33}^{+}$
in (2.37) with data at two values of
$\ell _{33}^{+}$
in (2.37) with data at two values of
 $Re$
(
$Re$
(
 $Re_{\unicode[STIX]{x1D70F}}=940$
and 5200) is shown in figure 6(a), which shows good agreement with data in the near-wall and core regions, but reveals notable differences in the bulk layer. The reason is analysed below.
$Re_{\unicode[STIX]{x1D70F}}=940$
and 5200) is shown in figure 6(a), which shows good agreement with data in the near-wall and core regions, but reveals notable differences in the bulk layer. The reason is analysed below.
Canonical four-layer
 $\ell _{33}$
of (2.37) compared with data: (a) compensated plot of
$\ell _{33}$
of (2.37) compared with data: (a) compensated plot of
 $\ell _{33}$
divided by
$\ell _{33}$
divided by
 $1-r^{4}$
; (b) compensated plot of
$1-r^{4}$
; (b) compensated plot of
 $\ell _{33}$
divided by
$\ell _{33}$
divided by
 $\ell _{12}$
showing an anomalous scaling in the bulk flow region. As explained in the text, the anomalous scaling exponent 0.07 results from (5.5). Symbols denote DNS channel data at
$\ell _{12}$
showing an anomalous scaling in the bulk flow region. As explained in the text, the anomalous scaling exponent 0.07 results from (5.5). Symbols denote DNS channel data at
 $Re_{\unicode[STIX]{x1D70F}}=940$
(Hoyas & Jimenez Reference Hoyas and Jimenez2006) and
$Re_{\unicode[STIX]{x1D70F}}=940$
(Hoyas & Jimenez Reference Hoyas and Jimenez2006) and
 $Re_{\unicode[STIX]{x1D70F}}=5200$
(Lee & Moser Reference Lee and Moser2015).
$Re_{\unicode[STIX]{x1D70F}}=5200$
(Lee & Moser Reference Lee and Moser2015).

5.1 Anomalous scaling and invariant peak location
Note that the deviation in figure 6(a) occurs in the log layer where
 $\ell _{33}^{+}\approx \unicode[STIX]{x1D705}_{33}y^{+}$
. However, as shown by the ratio
$\ell _{33}^{+}\approx \unicode[STIX]{x1D705}_{33}y^{+}$
. However, as shown by the ratio
 $\unicode[STIX]{x1D6FC}_{33}=\ell _{33}^{+}/\ell _{12}^{+}$
(see figure 6
b), the linear scaling of
$\unicode[STIX]{x1D6FC}_{33}=\ell _{33}^{+}/\ell _{12}^{+}$
(see figure 6
b), the linear scaling of
 $\ell _{33}^{+}$
is invalid since
$\ell _{33}^{+}$
is invalid since
 $\unicode[STIX]{x1D6FC}_{33}\propto 1/y^{+0.07}$
– otherwise
$\unicode[STIX]{x1D6FC}_{33}\propto 1/y^{+0.07}$
– otherwise
 $\unicode[STIX]{x1D6FC}_{33}$
would be a constant equalling
$\unicode[STIX]{x1D6FC}_{33}$
would be a constant equalling
 $\unicode[STIX]{x1D705}_{33}/\unicode[STIX]{x1D705}$
. This deviation thus suggests an anomalous scaling modification of
$\unicode[STIX]{x1D705}_{33}/\unicode[STIX]{x1D705}$
. This deviation thus suggests an anomalous scaling modification of
 $\ell _{33}$
– via a change of
$\ell _{33}$
– via a change of
 $(1+(y^{+}/y_{buf}^{+})^{4})^{-1/4}$
in (2.37) to
$(1+(y^{+}/y_{buf}^{+})^{4})^{-1/4}$
in (2.37) to
 $(1+(y^{+}/y_{buf}^{+})^{4})^{-(1+\unicode[STIX]{x1D6FE})/4}$
– so that
$(1+(y^{+}/y_{buf}^{+})^{4})^{-(1+\unicode[STIX]{x1D6FE})/4}$
– so that
 $\ell _{33}^{+}\propto y^{+(1-\unicode[STIX]{x1D6FE})}$
, and hence
$\ell _{33}^{+}\propto y^{+(1-\unicode[STIX]{x1D6FE})}$
, and hence
 $\unicode[STIX]{x1D6FC}_{33}\propto 1/y^{+\unicode[STIX]{x1D6FE}}$
in the log layer (
$\unicode[STIX]{x1D6FC}_{33}\propto 1/y^{+\unicode[STIX]{x1D6FE}}$
in the log layer (
 $y^{+}\gg y_{buf}^{+}$
). In other words,
$y^{+}\gg y_{buf}^{+}$
). In other words,
 $\ell _{33}$
is modified to
$\ell _{33}$
is modified to
 $$\begin{eqnarray}\ell _{33}^{\prime }=c_{33}y^{+}\left(1+\left(\frac{y^{+}}{y_{sub}^{+}}\right)^{4}\right)^{1/4}\left(1+\left(\frac{y^{+}}{y_{buf}^{+}}\right)^{4}\right)^{-(1+\unicode[STIX]{x1D6FE})/4}\frac{1-r^{4}}{4(1-r)}\left(1+\left(\frac{r_{core}}{r}\right)^{2}\right)^{1/2},\end{eqnarray}$$
and hence
 $$\begin{eqnarray}W_{33}^{+}=W_{12}^{+}\ell _{33}^{\prime 2}/\ell _{12}^{+2}.\end{eqnarray}$$
Here,
 $\unicode[STIX]{x1D6FE}$
is the so-called anomalous scaling exponent, and its value 0.07 – shown in figure 6(b) – can be theoretically determined by the peak location of
$\unicode[STIX]{x1D6FE}$
is the so-called anomalous scaling exponent, and its value 0.07 – shown in figure 6(b) – can be theoretically determined by the peak location of
 $W_{33}^{+}$
. Note that if
$W_{33}^{+}$
. Note that if
 $\unicode[STIX]{x1D6FE}=0$
(i.e. no anomalous scaling),
$\unicode[STIX]{x1D6FE}=0$
(i.e. no anomalous scaling),
 $W_{33}^{+}\approx W_{12}^{+}(\unicode[STIX]{x1D705}_{33}/\unicode[STIX]{x1D705})^{2}$
in the log layer, and thus the peak location of
$W_{33}^{+}\approx W_{12}^{+}(\unicode[STIX]{x1D705}_{33}/\unicode[STIX]{x1D705})^{2}$
in the log layer, and thus the peak location of
 $W_{33}^{+}$
(i.e.
$W_{33}^{+}$
(i.e.
 $y_{33p}^{+}$
) should follow that of
$y_{33p}^{+}$
) should follow that of
 $W_{12}^{+}$
(i.e.
$W_{12}^{+}$
(i.e.
 $y_{12p}^{+}$
) – both
$y_{12p}^{+}$
) – both
 $y_{33p}^{+}$
and
$y_{33p}^{+}$
and
 $y_{12p}^{+}$
increasing rapidly with increasing
$y_{12p}^{+}$
increasing rapidly with increasing
 $Re$
. However, a careful examination of DNS data (from
$Re$
. However, a careful examination of DNS data (from
 $Re_{\unicode[STIX]{x1D70F}}=650$
to
$Re_{\unicode[STIX]{x1D70F}}=650$
to
 $5200$
) shows that
$5200$
) shows that
 $y_{33p}^{+}$
remains almost constant, i.e.
$y_{33p}^{+}$
remains almost constant, i.e.
 $y_{33p}^{+}\approx 46$
, in sharp contrast to increasing
$y_{33p}^{+}\approx 46$
, in sharp contrast to increasing
 $y_{12p}^{+}$
in figure 3. This constancy of
$y_{12p}^{+}$
in figure 3. This constancy of
 $y_{33p}^{+}$
is actually due to the existence of the anomalous scaling
$y_{33p}^{+}$
is actually due to the existence of the anomalous scaling
 $\unicode[STIX]{x1D6FE}\neq 0$
, and enables the determination of
$\unicode[STIX]{x1D6FE}\neq 0$
, and enables the determination of
 $\unicode[STIX]{x1D6FE}\approx 0.07$
, as below.
$\unicode[STIX]{x1D6FE}\approx 0.07$
, as below.
In fact, for
 $y^{+}\simeq y_{buf}^{+}$
where
$y^{+}\simeq y_{buf}^{+}$
where
 $y_{33p}^{+}$
is located, we have
$y_{33p}^{+}$
is located, we have
 $\ell _{12}^{+}\approx (\unicode[STIX]{x1D705}y^{+2}/y_{buf}^{+})[1+(y^{+}/y_{buf}^{+})^{4}]^{-1/4}$
from (2.31), and hence an approximation of
$\ell _{12}^{+}\approx (\unicode[STIX]{x1D705}y^{+2}/y_{buf}^{+})[1+(y^{+}/y_{buf}^{+})^{4}]^{-1/4}$
from (2.31), and hence an approximation of
 $W_{12}^{+}$
is obtained from (3.6), i.e.
$W_{12}^{+}$
is obtained from (3.6), i.e.
 $W_{12}^{+}\approx 1-y^{+}/Re_{\unicode[STIX]{x1D70F}}-y_{buf}^{+}/(\unicode[STIX]{x1D705}y^{+2})$
(note that the
$W_{12}^{+}\approx 1-y^{+}/Re_{\unicode[STIX]{x1D70F}}-y_{buf}^{+}/(\unicode[STIX]{x1D705}y^{+2})$
(note that the
 $(y^{+}/y_{buf}^{+})^{4}$
term is very small for
$(y^{+}/y_{buf}^{+})^{4}$
term is very small for
 $W_{12}^{+}$
and hence ignored). Similarly,
$W_{12}^{+}$
and hence ignored). Similarly,
 $\ell _{33}^{\prime }\approx (\unicode[STIX]{x1D705}_{33}y^{+2}/y_{buf}^{+})[1+(y^{+}/y_{buf}^{+})^{4}]^{-(1+\unicode[STIX]{x1D6FE})/4}$
from (5.2), and thus we have
$\ell _{33}^{\prime }\approx (\unicode[STIX]{x1D705}_{33}y^{+2}/y_{buf}^{+})[1+(y^{+}/y_{buf}^{+})^{4}]^{-(1+\unicode[STIX]{x1D6FE})/4}$
from (5.2), and thus we have
 $$\begin{eqnarray}W_{33}^{+}=W_{12}^{+}(\ell _{33}^{\prime }/\ell _{12}^{+})^{2}\approx (\unicode[STIX]{x1D705}_{33}/\unicode[STIX]{x1D705})^{2}\left(1-\frac{y^{+}}{Re_{\unicode[STIX]{x1D70F}}}-\frac{y_{buf}^{+}}{\unicode[STIX]{x1D705}y^{+2}}\right)\left(1+\left(\frac{y^{+}}{y_{buf}^{+}}\right)^{4}\right)^{-\unicode[STIX]{x1D6FE}/2}.\end{eqnarray}$$
Then, solving
 $\unicode[STIX]{x2202}_{y^{+}}W_{33}^{+}=0$
at
$\unicode[STIX]{x2202}_{y^{+}}W_{33}^{+}=0$
at
 $y_{33p}^{+}$
using (5.4) yields the following result:
$y_{33p}^{+}$
using (5.4) yields the following result:
 $$\begin{eqnarray}\unicode[STIX]{x1D6FE}=\frac{[2y_{buf}^{+}/(\unicode[STIX]{x1D705}y_{33p}^{+3})-1/Re_{\unicode[STIX]{x1D70F}}](y_{buf}^{+4}+y_{33p}^{+4})}{2y_{33p}^{+3}[1-y_{33p}^{+}/Re_{\unicode[STIX]{x1D70F}}-y_{buf}^{+}/(\unicode[STIX]{x1D705}y_{33p}^{+2})]}\approx 0.05\unicode[STIX]{x1D70E}^{-2}(1+\unicode[STIX]{x1D70E}^{-4}),\end{eqnarray}$$
where
 $\unicode[STIX]{x1D70E}=y_{33p}^{+}/y_{buf}^{+}$
, and
$\unicode[STIX]{x1D70E}=y_{33p}^{+}/y_{buf}^{+}$
, and
 $y_{buf}^{+}=41$
and
$y_{buf}^{+}=41$
and
 $\unicode[STIX]{x1D705}=0.45$
are substituted in (and the
$\unicode[STIX]{x1D705}=0.45$
are substituted in (and the
 $1/Re_{\unicode[STIX]{x1D70F}}$
term is small and ignored). As explained before, if
$1/Re_{\unicode[STIX]{x1D70F}}$
term is small and ignored). As explained before, if
 $y_{33p}^{+}$
follows the scaling of
$y_{33p}^{+}$
follows the scaling of
 $y_{12p}^{+}$
, then
$y_{12p}^{+}$
, then
 $\unicode[STIX]{x1D70E}=\sqrt{Re_{\unicode[STIX]{x1D70F}}/\unicode[STIX]{x1D705}}/y_{buf}^{+}$
, and (5.5) leads to
$\unicode[STIX]{x1D70E}=\sqrt{Re_{\unicode[STIX]{x1D70F}}/\unicode[STIX]{x1D705}}/y_{buf}^{+}$
, and (5.5) leads to
 $\unicode[STIX]{x1D6FE}\approx 0.05\unicode[STIX]{x1D705}^{2}y_{buf}^{+2}/Re_{\unicode[STIX]{x1D70F}}\rightarrow 0$
(e.g.
$\unicode[STIX]{x1D6FE}\approx 0.05\unicode[STIX]{x1D705}^{2}y_{buf}^{+2}/Re_{\unicode[STIX]{x1D70F}}\rightarrow 0$
(e.g.
 $\unicode[STIX]{x1D6FE}\approx 0.003$
at
$\unicode[STIX]{x1D6FE}\approx 0.003$
at
 $Re_{\unicode[STIX]{x1D70F}}=5200$
), hence indicating no anomalous scaling. In contrast, DNS data show an invariant peak location
$Re_{\unicode[STIX]{x1D70F}}=5200$
), hence indicating no anomalous scaling. In contrast, DNS data show an invariant peak location
 $y_{33p}^{+}\approx 46$
, then
$y_{33p}^{+}\approx 46$
, then
 $\unicode[STIX]{x1D70E}\approx 1.12$
, and (5.5) yields a constant
$\unicode[STIX]{x1D70E}\approx 1.12$
, and (5.5) yields a constant
 $\unicode[STIX]{x1D6FE}\approx 0.07$
– the value shown in figure 6(b). In order words, the invariant peak location leads to the existence of the anomalous scaling. It would be intriguing to test if
$\unicode[STIX]{x1D6FE}\approx 0.07$
– the value shown in figure 6(b). In order words, the invariant peak location leads to the existence of the anomalous scaling. It would be intriguing to test if
 $\unicode[STIX]{x1D6FE}=0.07$
remains invariant at higher
$\unicode[STIX]{x1D6FE}=0.07$
remains invariant at higher
 $Re$
values.
$Re$
values.
Now, the only unknown parameter in (5.2) is
 $c_{33}$
, which is
$c_{33}$
, which is
 $c_{33}=y_{sub}^{+}\unicode[STIX]{x1D705}_{33}/(\sqrt{1+r_{core}^{2}}y_{buf}^{+})$
. Below,
$c_{33}=y_{sub}^{+}\unicode[STIX]{x1D705}_{33}/(\sqrt{1+r_{core}^{2}}y_{buf}^{+})$
. Below,
 $\unicode[STIX]{x1D705}_{33}$
is determined, hence yielding
$\unicode[STIX]{x1D705}_{33}$
is determined, hence yielding
 $c_{33}$
.
$c_{33}$
.
5.2 Scaling of
$\unicode[STIX]{x1D705}_{33}$
and of the
$W_{33}^{+}$
peak value


(a) Peak value
 $W_{33p}^{+}$
of DNS data compared with prediction by (5.10) (line) showing good agreement. Symbols are the same as in figure 3. (b) Diagnostic function
$W_{33p}^{+}$
of DNS data compared with prediction by (5.10) (line) showing good agreement. Symbols are the same as in figure 3. (b) Diagnostic function
 $\unicode[STIX]{x1D6E4}_{33}=-y\text{d}W_{33}^{+}/\text{d}y$
showing an approximate plateau
$\unicode[STIX]{x1D6E4}_{33}=-y\text{d}W_{33}^{+}/\text{d}y$
showing an approximate plateau
 $\unicode[STIX]{x1D6E4}_{33}=0.41\pm 0.04$
for
$\unicode[STIX]{x1D6E4}_{33}=0.41\pm 0.04$
for
 $0.02\leqslant y\leqslant 0.14$
. Symbols are DNS data at
$0.02\leqslant y\leqslant 0.14$
. Symbols are DNS data at
 $Re_{\unicode[STIX]{x1D70F}}=5200$
(Lee & Moser Reference Lee and Moser2015). Solid line indicates (5.12), whose minimum value
$Re_{\unicode[STIX]{x1D70F}}=5200$
(Lee & Moser Reference Lee and Moser2015). Solid line indicates (5.12), whose minimum value
 $\unicode[STIX]{x1D6E4}_{33min}\approx 0.41$
obtained in (5.15) – dashed line – represents well the plateau value.
$\unicode[STIX]{x1D6E4}_{33min}\approx 0.41$
obtained in (5.15) – dashed line – represents well the plateau value.

Note that for
 $y^{+}\gg y_{buf}^{+}$
,
$y^{+}\gg y_{buf}^{+}$
,
 $W_{12}^{+}\approx r$
, then (5.3) leads to a simple expression for the outer profile of
$W_{12}^{+}\approx r$
, then (5.3) leads to a simple expression for the outer profile of
 $W_{33}^{+}$
:
$W_{33}^{+}$
:
 $$\begin{eqnarray}W_{33Outer}^{+}\approx r\ell _{33}^{\prime 2}/\ell _{12}^{+2}\approx \left(\frac{\unicode[STIX]{x1D705}_{33}}{\unicode[STIX]{x1D705}}\right)^{2}\left(\frac{y_{buf}^{+}}{y^{+}}\right)^{2\unicode[STIX]{x1D6FE}}\left(\frac{r^{2}+r_{core}^{2}}{1+r_{core}^{2}}\right)^{1/2}.\end{eqnarray}$$
According to Townsend’s
 $Re$
-similarity hypothesis (Townsend Reference Townsend1976) (namely, mean properties in the outer flow region are self-similar, independent of viscous effects, and hence
$Re$
-similarity hypothesis (Townsend Reference Townsend1976) (namely, mean properties in the outer flow region are self-similar, independent of viscous effects, and hence
 $Re$
), one should expect that
$Re$
), one should expect that
 $W_{33Outer}^{+}$
depends only on
$W_{33Outer}^{+}$
depends only on
 $r$
, with no dependence on
$r$
, with no dependence on
 $Re$
. Then, requiring a zero exponent of
$Re$
. Then, requiring a zero exponent of
 $Re_{\unicode[STIX]{x1D70F}}$
for
$Re_{\unicode[STIX]{x1D70F}}$
for
 $W_{33Outer}^{+}$
in (5.6), we readily obtain
$W_{33Outer}^{+}$
in (5.6), we readily obtain
 $\unicode[STIX]{x1D705}_{33}\propto Re_{\unicode[STIX]{x1D70F}}^{\unicode[STIX]{x1D6FE}}$
.
$\unicode[STIX]{x1D705}_{33}\propto Re_{\unicode[STIX]{x1D70F}}^{\unicode[STIX]{x1D6FE}}$
.
We denote
 $\unicode[STIX]{x1D705}_{33}=\unicode[STIX]{x1D705}_{33}^{\prime }Re_{\unicode[STIX]{x1D70F}}^{\unicode[STIX]{x1D6FE}}$
, where
$\unicode[STIX]{x1D705}_{33}=\unicode[STIX]{x1D705}_{33}^{\prime }Re_{\unicode[STIX]{x1D70F}}^{\unicode[STIX]{x1D6FE}}$
, where
 $\unicode[STIX]{x1D705}_{33}^{\prime }$
is a
$\unicode[STIX]{x1D705}_{33}^{\prime }$
is a
 $Re$
-independent constant, which can be measured by
$Re$
-independent constant, which can be measured by
 $W_{33}^{+}$
at the centreline. Letting
$W_{33}^{+}$
at the centreline. Letting
 $r=0$
, equation (5.6) becomes
$r=0$
, equation (5.6) becomes
 $$\begin{eqnarray}W_{33c}^{+}\approx (\unicode[STIX]{x1D705}_{33}^{\prime }/\unicode[STIX]{x1D705})^{2}y_{buf}^{+2\unicode[STIX]{x1D6FE}}r_{core}/\sqrt{1+r_{core}^{2}}.\end{eqnarray}$$
Therefore,
 $$\begin{eqnarray}\unicode[STIX]{x1D705}_{33}^{\prime }=\unicode[STIX]{x1D705}W_{33c}^{+1/2}(1+r_{core}^{2})^{1/4}/(y_{buf}^{+\unicode[STIX]{x1D6FE}}r_{core}^{1/2}).\end{eqnarray}$$
Using
 $\unicode[STIX]{x1D705}=0.45$
,
$\unicode[STIX]{x1D705}=0.45$
,
 $y_{buf}^{+}=41$
,
$y_{buf}^{+}=41$
,
 $r_{core}=0.27$
,
$r_{core}=0.27$
,
 $\unicode[STIX]{x1D6FE}=0.07$
and the centreline value
$\unicode[STIX]{x1D6FE}=0.07$
and the centreline value
 $W_{33c}^{+}\approx 0.4$
by current DNS data (Hoyas & Jimenez Reference Hoyas and Jimenez2006; Lee & Moser Reference Lee and Moser2015), we thus have
$W_{33c}^{+}\approx 0.4$
by current DNS data (Hoyas & Jimenez Reference Hoyas and Jimenez2006; Lee & Moser Reference Lee and Moser2015), we thus have
 $\unicode[STIX]{x1D705}_{33}^{\prime }\approx 0.43$
, and hence
$\unicode[STIX]{x1D705}_{33}^{\prime }\approx 0.43$
, and hence
 $$\begin{eqnarray}\unicode[STIX]{x1D705}_{33}=\unicode[STIX]{x1D705}_{33}^{\prime }Re_{\unicode[STIX]{x1D70F}}^{\unicode[STIX]{x1D6FE}}\approx 0.43Re_{\unicode[STIX]{x1D70F}}^{0.07}.\end{eqnarray}$$
Furthermore, substituting
 $\unicode[STIX]{x1D705}=0.45$
,
$\unicode[STIX]{x1D705}=0.45$
,
 $y_{buf}^{+}=41$
,
$y_{buf}^{+}=41$
,
 $\unicode[STIX]{x1D6FE}=0.07$
,
$\unicode[STIX]{x1D6FE}=0.07$
,
 $y^{+}=y_{33p}^{+}=\unicode[STIX]{x1D70E}y_{buf}^{+}$
(with
$y^{+}=y_{33p}^{+}=\unicode[STIX]{x1D70E}y_{buf}^{+}$
(with
 $\unicode[STIX]{x1D70E}=1.12$
) and (5.9) into (5.4), one readily obtains the peak value of
$\unicode[STIX]{x1D70E}=1.12$
) and (5.9) into (5.4), one readily obtains the peak value of
 $W_{33}^{+}$
as
$W_{33}^{+}$
as
 $$\begin{eqnarray}\displaystyle W_{33p}^{+} & = & \displaystyle (\unicode[STIX]{x1D705}_{33}^{\prime }/\unicode[STIX]{x1D705})^{2}Re_{\unicode[STIX]{x1D70F}}^{2\unicode[STIX]{x1D6FE}}(1+\unicode[STIX]{x1D70E}^{4})^{-\unicode[STIX]{x1D6FE}/2}[1-41\unicode[STIX]{x1D70E}/Re_{\unicode[STIX]{x1D70F}}-1/(41\unicode[STIX]{x1D705}\unicode[STIX]{x1D70E}^{2})]\nonumber\\ \displaystyle & {\approx} & \displaystyle 0.84Re_{\unicode[STIX]{x1D70F}}^{0.14}(1-48/Re_{\unicode[STIX]{x1D70F}}).\end{eqnarray}$$
To emphasize, in (5.10),
 $\unicode[STIX]{x1D705}_{33}^{\prime }$
only affects the magnitude of
$\unicode[STIX]{x1D705}_{33}^{\prime }$
only affects the magnitude of
 $W_{33p}^{+}$
, while the
$W_{33p}^{+}$
, while the
 $Re_{\unicode[STIX]{x1D70F}}$
scaling of
$Re_{\unicode[STIX]{x1D70F}}$
scaling of
 $W_{33p}^{+}$
is due to the anomalous scaling exponent
$W_{33p}^{+}$
is due to the anomalous scaling exponent
 $\unicode[STIX]{x1D6FE}$
. Figure 7(a) shows that (5.10) agrees well with the data. Note that the downward curve in the figure 7(a) is due to the
$\unicode[STIX]{x1D6FE}$
. Figure 7(a) shows that (5.10) agrees well with the data. Note that the downward curve in the figure 7(a) is due to the
 $48/Re_{\unicode[STIX]{x1D70F}}$
term in (5.10), which becomes negligible at large
$48/Re_{\unicode[STIX]{x1D70F}}$
term in (5.10), which becomes negligible at large
 $Re$
, when
$Re$
, when
 $W_{33p}^{+}\approx 0.84Re_{\unicode[STIX]{x1D70F}}^{0.14}$
. Thus, although the peak location
$W_{33p}^{+}\approx 0.84Re_{\unicode[STIX]{x1D70F}}^{0.14}$
. Thus, although the peak location
 $y_{33p}^{+}$
is invariant, the peak value
$y_{33p}^{+}$
is invariant, the peak value
 $W_{33p}^{+}$
increases with increasing
$W_{33p}^{+}$
increases with increasing
 $Re$
.
$Re$
.
5.3 Townsend’s log profile for
$W_{33}^{+}$

Note that the outer profile (5.6) has a power-law asymptote towards the wall, i.e.
 $$\begin{eqnarray}W_{33}^{+}\approx y_{buf}^{+2\unicode[STIX]{x1D6FE}}(\unicode[STIX]{x1D705}_{33}^{\prime }/\unicode[STIX]{x1D705})^{2}/y^{2\unicode[STIX]{x1D6FE}},\quad y=1-r.\end{eqnarray}$$
This power law is conceptually different from the Townsend’s log law (Townsend Reference Townsend1976) in (1.4). Reminiscent of the debate on the mean velocity scaling (Barenblatt Reference Barenblatt1993), a new debate between the power law and log law on the
 $W_{33}^{+}$
scaling may arise. However, as both (5.11) and (1.4) represent data in limited but different flow domains, such a debate is really not meaningful and may not be resolved due to their unspecified
$W_{33}^{+}$
scaling may arise. However, as both (5.11) and (1.4) represent data in limited but different flow domains, such a debate is really not meaningful and may not be resolved due to their unspecified
 $y$
-ranges. Here, since we already have a global expression (5.6) which extends (5.11) to the centreline and describes
$y$
-ranges. Here, since we already have a global expression (5.6) which extends (5.11) to the centreline and describes
 $W_{33}^{+}$
for the entire outer flow domain, it is more interesting to see if the present formalism (5.6) can yield the log law with its two coefficients quantitatively determined.
$W_{33}^{+}$
for the entire outer flow domain, it is more interesting to see if the present formalism (5.6) can yield the log law with its two coefficients quantitatively determined.
This is achieved via the diagnostic function of the log profile,
 $\unicode[STIX]{x1D6E4}_{33}=-yd_{y}W_{33}^{+}$
, which is calculated using (5.6) as
$\unicode[STIX]{x1D6E4}_{33}=-yd_{y}W_{33}^{+}$
, which is calculated using (5.6) as
 $$\begin{eqnarray}\unicode[STIX]{x1D6E4}_{33}=\frac{y_{buf}^{+2\unicode[STIX]{x1D6FE}}(\unicode[STIX]{x1D705}_{33}^{\prime }/\unicode[STIX]{x1D705})^{2}}{\sqrt{1+r_{core}^{2}}}\left(\frac{2\unicode[STIX]{x1D6FE}\sqrt{(1-y)^{2}+r_{core}^{2}}}{y^{2\unicode[STIX]{x1D6FE}}}+\frac{(1-y)y^{1-2\unicode[STIX]{x1D6FE}}}{\sqrt{(1-y)^{2}+r_{core}^{2}}}\right).\end{eqnarray}$$
Note that as
 $y\ll 1$
in the log region, equation (5.12) is further approximated to
$y\ll 1$
in the log region, equation (5.12) is further approximated to
 $$\begin{eqnarray}\unicode[STIX]{x1D6E4}_{33}\approx \frac{y_{buf}^{+2\unicode[STIX]{x1D6FE}}(\unicode[STIX]{x1D705}_{33}^{\prime }/\unicode[STIX]{x1D705})^{2}}{\sqrt{1+r_{core}^{2}}}y^{-2\unicode[STIX]{x1D6FE}}\left(2\unicode[STIX]{x1D6FE}\sqrt{1+r_{core}^{2}}+\frac{y}{\sqrt{1+r_{core}^{2}}}\right).\end{eqnarray}$$
Solving
 $\text{d}\unicode[STIX]{x1D6E4}_{33}/\text{d}y=0$
using (5.13), we get the
$\text{d}\unicode[STIX]{x1D6E4}_{33}/\text{d}y=0$
using (5.13), we get the
 $y$
-location of the minimum
$y$
-location of the minimum
 $\unicode[STIX]{x1D6E4}_{33}$
, i.e.
$\unicode[STIX]{x1D6E4}_{33}$
, i.e.
 $$\begin{eqnarray}y_{33min}\approx (1+r_{core}^{2})(2\unicode[STIX]{x1D6FE})^{2}\approx 0.021,\end{eqnarray}$$
and the corresponding minimum value
 $\unicode[STIX]{x1D6E4}_{33min}$
is
$\unicode[STIX]{x1D6E4}_{33min}$
is
 $$\begin{eqnarray}\unicode[STIX]{x1D6E4}_{33min}\approx 2\unicode[STIX]{x1D6FE}\left(1+2\unicode[STIX]{x1D6FE}\right)y_{buf}^{+2\unicode[STIX]{x1D6FE}}(\unicode[STIX]{x1D705}_{33}^{\prime }/\unicode[STIX]{x1D705})^{2}(1-y_{33min})y_{33min}^{-2\unicode[STIX]{x1D6FE}}\approx 0.412.\end{eqnarray}$$
This calculation shows that physical quantities such as
 $y_{buf}^{+}$
,
$y_{buf}^{+}$
,
 $\unicode[STIX]{x1D705}_{33}^{\prime }$
,
$\unicode[STIX]{x1D705}_{33}^{\prime }$
,
 $\unicode[STIX]{x1D705}$
,
$\unicode[STIX]{x1D705}$
,
 $\unicode[STIX]{x1D6FE}$
and
$\unicode[STIX]{x1D6FE}$
and
 $r_{core}$
contribute to the slope of the log law. It is interesting to observe that both
$r_{core}$
contribute to the slope of the log law. It is interesting to observe that both
 $y_{33min}$
and
$y_{33min}$
and
 $\unicode[STIX]{x1D6E4}_{33min}$
(i.e. log-law slope) are independent of
$\unicode[STIX]{x1D6E4}_{33min}$
(i.e. log-law slope) are independent of
 $Re$
. Note that this
$Re$
. Note that this
 $Re$
-independent value is meaningful only in the log layer because of (5.6), which requires that
$Re$
-independent value is meaningful only in the log layer because of (5.6), which requires that
 $y_{33min}^{+}>y_{buf}^{+}(=41)$
. This implies that only for
$y_{33min}^{+}>y_{buf}^{+}(=41)$
. This implies that only for
 $Re_{\unicode[STIX]{x1D70F}}>y_{buf}^{+}/y_{33min}\approx 2000$
does the log-law behaviour of
$Re_{\unicode[STIX]{x1D70F}}>y_{buf}^{+}/y_{33min}\approx 2000$
does the log-law behaviour of
 $W_{33}^{+}$
become notable, as the data confirm (see figure 8
b). Figure 7(b) shows that data agree well with our analytic expressions (5.12), (5.14) and (5.15); in particular, a plateau
$W_{33}^{+}$
become notable, as the data confirm (see figure 8
b). Figure 7(b) shows that data agree well with our analytic expressions (5.12), (5.14) and (5.15); in particular, a plateau
 $\unicode[STIX]{x1D6E4}_{33}=0.41\pm 0.04$
appears in figure 7(b) in the range
$\unicode[STIX]{x1D6E4}_{33}=0.41\pm 0.04$
appears in figure 7(b) in the range
 $0.018\leqslant y\leqslant 0.14$
, very close to our prediction of
$0.018\leqslant y\leqslant 0.14$
, very close to our prediction of
 $\unicode[STIX]{x1D6E4}_{33min}=0.412$
. Then, it is demonstrated that (5.6) indeed implies an (locally approximate) log law with its slope
$\unicode[STIX]{x1D6E4}_{33min}=0.412$
. Then, it is demonstrated that (5.6) indeed implies an (locally approximate) log law with its slope
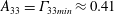 $A_{33}=\unicode[STIX]{x1D6E4}_{33min}\approx 0.41$
.
$A_{33}=\unicode[STIX]{x1D6E4}_{33min}\approx 0.41$
.
Validation of (5.3) – solid lines – for spanwise Reynolds stress profiles compared with data. Also included is the prediction of
 $W_{33}^{+}$
at
$W_{33}^{+}$
at
 $Re_{\unicode[STIX]{x1D70F}}=50\,000$
. Note the log profile (1.4) – dotted line in (b) – agreeing well with data and with (5.3); its slope
$Re_{\unicode[STIX]{x1D70F}}=50\,000$
. Note the log profile (1.4) – dotted line in (b) – agreeing well with data and with (5.3); its slope
 $A_{33}\approx 0.41$
and the additive constant
$A_{33}\approx 0.41$
and the additive constant
 $B_{33}\approx 1.00$
are theoretically determined in (5.16). The departure between data and our theory (i.e.
$B_{33}\approx 1.00$
are theoretically determined in (5.16). The departure between data and our theory (i.e.
 $W_{33}^{+Theory}-W_{33}^{+DNS}$
) is shown in (c,d), which is bounded within
$W_{33}^{+Theory}-W_{33}^{+DNS}$
) is shown in (c,d), which is bounded within
 $\pm 0.15$
. For legend, see figure 2.
$\pm 0.15$
. For legend, see figure 2.

Furthermore, the additive constant
 $B_{33}$
can also be estimated by matching (5.6) with (1.4) at the position
$B_{33}$
can also be estimated by matching (5.6) with (1.4) at the position
 $y=y_{33min}$
. That is, substituting
$y=y_{33min}$
. That is, substituting
 $y=y_{33\unicode[STIX]{x1D6E4}}=0.021$
into (5.6) yields
$y=y_{33\unicode[STIX]{x1D6E4}}=0.021$
into (5.6) yields
 $W_{33\unicode[STIX]{x1D6E4}}^{+}\approx 2.58$
, and hence the additive constant
$W_{33\unicode[STIX]{x1D6E4}}^{+}\approx 2.58$
, and hence the additive constant
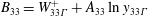 $B_{33}=W_{33\unicode[STIX]{x1D6E4}}^{+}+A_{33}\ln y_{33\unicode[STIX]{x1D6E4}}$
. Therefore, equation (5.6) theoretically leads to
$B_{33}=W_{33\unicode[STIX]{x1D6E4}}^{+}+A_{33}\ln y_{33\unicode[STIX]{x1D6E4}}$
. Therefore, equation (5.6) theoretically leads to
 $$\begin{eqnarray}A_{33}=\unicode[STIX]{x1D6E4}_{33min}\approx 0.41,\quad B_{33}=W_{33\unicode[STIX]{x1D6E4}}^{+}+A_{33}\ln y_{33\unicode[STIX]{x1D6E4}}\approx 1.00,\end{eqnarray}$$
which are very close to the empirical fitting values
 $A_{33}=0.387$
and
$A_{33}=0.387$
and
 $B_{33}\approx 1.08$
by Lee & Moser (Reference Lee and Moser2015). Thus, from (5.6) we obtain a (approximate) log law, hence presenting an alternative derivation of Townsend’s log law.
$B_{33}\approx 1.08$
by Lee & Moser (Reference Lee and Moser2015). Thus, from (5.6) we obtain a (approximate) log law, hence presenting an alternative derivation of Townsend’s log law.
Figure 8 shows the resulting
 $W_{33}^{+}$
profiles by (5.2) – using (5.9) – and (5.3), in good agreement with data. The departure is bounded within
$W_{33}^{+}$
profiles by (5.2) – using (5.9) – and (5.3), in good agreement with data. The departure is bounded within
 $\pm 0.15$
. To emphasize, for all the predictions in figures 7 and 8, quite surprisingly, only two new parameters are introduced for
$\pm 0.15$
. To emphasize, for all the predictions in figures 7 and 8, quite surprisingly, only two new parameters are introduced for
 $\ell _{33}$
, i.e.
$\ell _{33}$
, i.e.
 $\unicode[STIX]{x1D6FE}=0.07$
in (5.5) (or the peak location
$\unicode[STIX]{x1D6FE}=0.07$
in (5.5) (or the peak location
 $y_{33p}^{+}\approx 46$
) and
$y_{33p}^{+}\approx 46$
) and
 $\unicode[STIX]{x1D705}_{33}^{\prime }=0.43$
in (5.8), both fixed for all
$\unicode[STIX]{x1D705}_{33}^{\prime }=0.43$
in (5.8), both fixed for all
 $Re$
. To our knowledge, this is the first time an analytical
$Re$
. To our knowledge, this is the first time an analytical
 $W_{33}^{+}$
profile for the entire flow domain has been obtained. Moreover, the log profile (1.4) with its slope and additive constant determined in (5.16) is also plotted in figure 8(b), which agrees not only with DNS data, but also with (5.3). A prediction at
$W_{33}^{+}$
profile for the entire flow domain has been obtained. Moreover, the log profile (1.4) with its slope and additive constant determined in (5.16) is also plotted in figure 8(b), which agrees not only with DNS data, but also with (5.3). A prediction at
 $Re_{\unicode[STIX]{x1D70F}}=50\,000$
is included in the figure, awaiting future measurements for validation.
$Re_{\unicode[STIX]{x1D70F}}=50\,000$
is included in the figure, awaiting future measurements for validation.
6 Streamwise Reynolds stress
$W_{11}$

The canonical formula for
 $\ell _{11}^{+}$
in (2.32) and hence
$\ell _{11}^{+}$
in (2.32) and hence
 $W_{11}^{+}$
:
$W_{11}^{+}$
:
 $$\begin{eqnarray}W_{11}^{+}=W_{12}^{+}\ell _{11}^{+2}/\ell _{12}^{+2}\end{eqnarray}$$
are compared with data in figure 9. While the inner peak is characterized well,
 $W_{11}^{+}$
is underestimated in the bulk (particularly for high
$W_{11}^{+}$
is underestimated in the bulk (particularly for high
 $Re$
) where an modification is needed. Below we separately discuss the inner and outer regions.
$Re$
) where an modification is needed. Below we separately discuss the inner and outer regions.


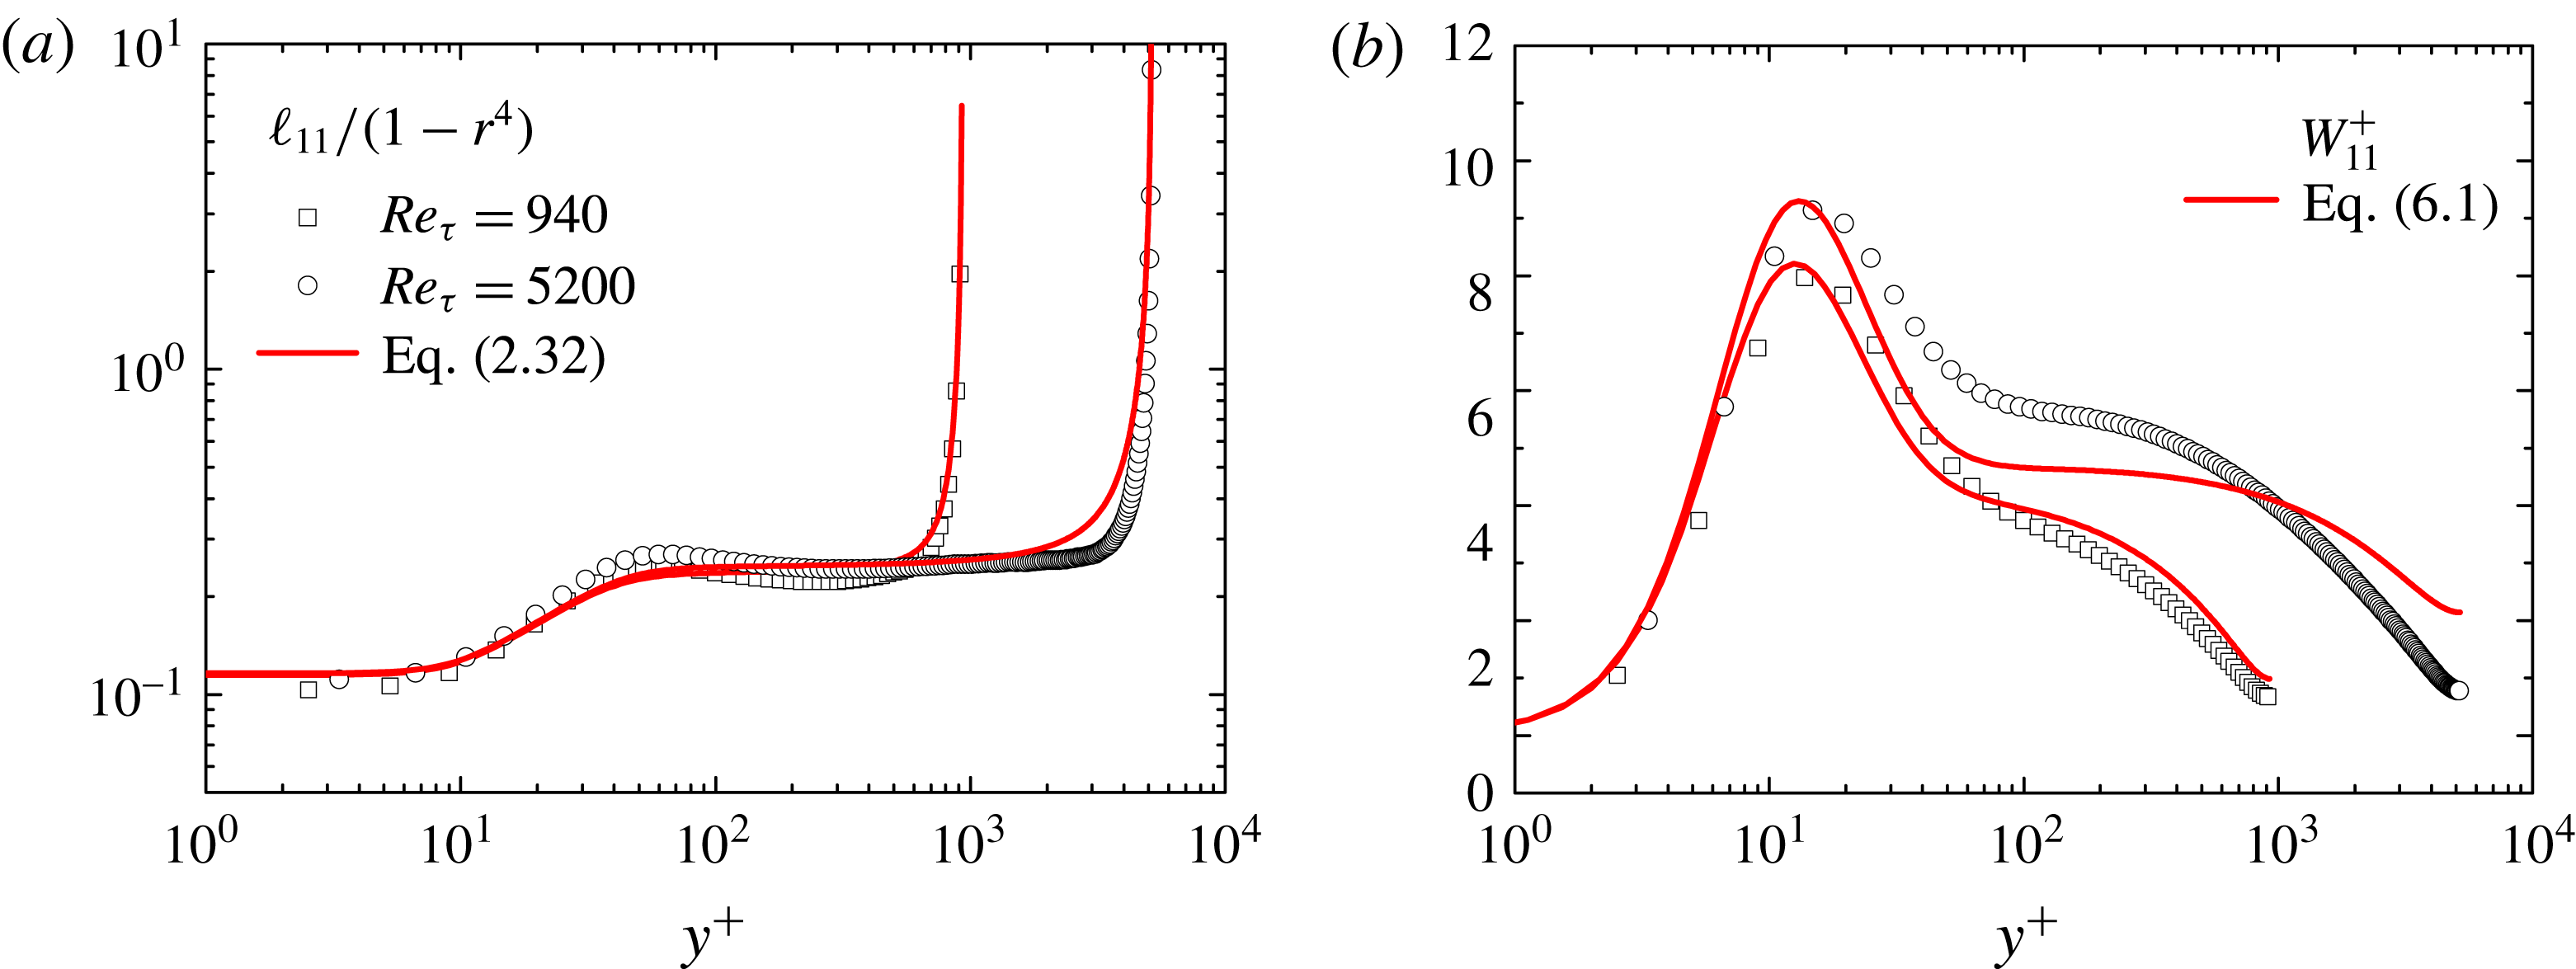
6.1 Inner profile of
$W_{11}^{+}$

As in the preceding sections, we let
 $c_{11}=c_{11}^{\prime }/\sqrt{1+r_{core}^{2}}$
in (2.32) so that
$c_{11}=c_{11}^{\prime }/\sqrt{1+r_{core}^{2}}$
in (2.32) so that
 $\ell _{11}^{+}\approx c_{11}^{\prime }y^{+}$
as
$\ell _{11}^{+}\approx c_{11}^{\prime }y^{+}$
as
 $y^{+}\rightarrow 0$
, and let
$y^{+}\rightarrow 0$
, and let
 $c_{11}^{\prime }=\unicode[STIX]{x1D705}_{11}\sqrt{y_{sub}^{+}/y_{buf}^{+}}$
so that
$c_{11}^{\prime }=\unicode[STIX]{x1D705}_{11}\sqrt{y_{sub}^{+}/y_{buf}^{+}}$
so that
 $\ell _{11}^{+}\approx \unicode[STIX]{x1D705}_{11}y^{+}$
as
$\ell _{11}^{+}\approx \unicode[STIX]{x1D705}_{11}y^{+}$
as
 $y^{+}\gg y_{buf}^{+}$
. Since (3.4) shows that
$y^{+}\gg y_{buf}^{+}$
. Since (3.4) shows that
 $\ell _{12}^{+}\approx (y^{+}/y_{sub}^{+})^{3/2}$
, we have
$\ell _{12}^{+}\approx (y^{+}/y_{sub}^{+})^{3/2}$
, we have
 $W_{12}^{+}\approx 1-2/[1+\sqrt{1+4(y^{+}/y_{sub}^{+})^{3}}]$
(where
$W_{12}^{+}\approx 1-2/[1+\sqrt{1+4(y^{+}/y_{sub}^{+})^{3}}]$
(where
 $y^{+}/Re_{\unicode[STIX]{x1D70F}}$
is small and ignored). Thus,
$y^{+}/Re_{\unicode[STIX]{x1D70F}}$
is small and ignored). Thus,
 $W_{11}^{+}$
for the inner flow region is approximated as
$W_{11}^{+}$
for the inner flow region is approximated as
 $$\begin{eqnarray}\displaystyle W_{11Inner}^{+}=W_{12}^{+}\ell _{11}^{+2}/\ell _{12}^{+2}\approx \frac{22.3\unicode[STIX]{x1D705}_{11}^{2}}{y^{\ast }}\left[1-\frac{2}{1+\sqrt{1+4(y^{\ast })^{3}}}\right], & & \displaystyle\end{eqnarray}$$
where
 $y_{sub}^{+3}/y_{buf}^{+}\approx 22.3$
and
$y_{sub}^{+3}/y_{buf}^{+}\approx 22.3$
and
 $y^{\ast }\equiv y^{+}/y_{sub}^{+}=y^{+}/9.7$
have been substituted into (6.2). Solving
$y^{\ast }\equiv y^{+}/y_{sub}^{+}=y^{+}/9.7$
have been substituted into (6.2). Solving
 $\text{d}W_{11}^{+}/\text{d}y^{\ast }=0$
using (6.2), the inner peak location
$\text{d}W_{11}^{+}/\text{d}y^{\ast }=0$
using (6.2), the inner peak location
 $y_{c}^{\ast }$
is then obtained:
$y_{c}^{\ast }$
is then obtained:
 $$\begin{eqnarray}\displaystyle y_{c}^{\ast }\approx \sqrt[3]{2}, & & \displaystyle\end{eqnarray}$$
and hence
 $y_{11pi}^{+}=\sqrt[3]{2}y_{sub}^{+}$
(scaled in viscous units). This estimation of
$y_{11pi}^{+}=\sqrt[3]{2}y_{sub}^{+}$
(scaled in viscous units). This estimation of
 $y_{11pi}^{+}$
, coinciding with the location of maximum production in (3.5), is independent of
$y_{11pi}^{+}$
, coinciding with the location of maximum production in (3.5), is independent of
 $\unicode[STIX]{x1D705}_{11}$
and close to the value
$\unicode[STIX]{x1D705}_{11}$
and close to the value
 $y^{+}\approx 14$
observed from data (Pope Reference Pope2000; Lee & Moser Reference Lee and Moser2015).
$y^{+}\approx 14$
observed from data (Pope Reference Pope2000; Lee & Moser Reference Lee and Moser2015).
Moreover, the inner peak value is found to be determined by
 $\unicode[STIX]{x1D705}_{11}$
by substituting (6.3) into (6.2), i.e.
$\unicode[STIX]{x1D705}_{11}$
by substituting (6.3) into (6.2), i.e.
 $$\begin{eqnarray}\displaystyle W_{11pi}^{+}\approx 8.8\unicode[STIX]{x1D705}_{11}^{2},\quad \text{or}\quad \unicode[STIX]{x1D705}_{11}=\sqrt{W_{11pi}^{+}/8.8}. & & \displaystyle\end{eqnarray}$$
Thus,
 $\unicode[STIX]{x1D705}_{11}$
can be obtained from the measured inner peak value of
$\unicode[STIX]{x1D705}_{11}$
can be obtained from the measured inner peak value of
 $W_{11pi}^{+}$
. Figure 10(a) shows the measured
$W_{11pi}^{+}$
. Figure 10(a) shows the measured
 $\unicode[STIX]{x1D705}_{11}$
based on the DNS data and the Princeton pipe data (Hultmark et al.
Reference Hultmark, Vallikivi, Bailey and Smits2012). It seems that
$\unicode[STIX]{x1D705}_{11}$
based on the DNS data and the Princeton pipe data (Hultmark et al.
Reference Hultmark, Vallikivi, Bailey and Smits2012). It seems that
 $\unicode[STIX]{x1D705}_{11}$
saturates to a constant value around 1.02 (due to
$\unicode[STIX]{x1D705}_{11}$
saturates to a constant value around 1.02 (due to
 $W_{11pi}^{+}\approx 9.2$
) for
$W_{11pi}^{+}\approx 9.2$
) for
 $Re_{\unicode[STIX]{x1D70F}}\gtrsim 5000$
of the Princeton pipe. However, if
$Re_{\unicode[STIX]{x1D70F}}\gtrsim 5000$
of the Princeton pipe. However, if
 $W_{11pi}^{+}$
continues to grow with increasing
$W_{11pi}^{+}$
continues to grow with increasing
 $Re$
, as that observed in TBL (Degraaff & Eaton Reference Degraaff and Eaton2000; Metzger et al.
Reference Metzger, Klewicki, Bradshaw and Sadr2001; Hutchins et al.
Reference Hutchins, Nickels, Marusic and Chong2009; Sillero et al.
Reference Sillero, Jimenez and Moser2013), so also will
$Re$
, as that observed in TBL (Degraaff & Eaton Reference Degraaff and Eaton2000; Metzger et al.
Reference Metzger, Klewicki, Bradshaw and Sadr2001; Hutchins et al.
Reference Hutchins, Nickels, Marusic and Chong2009; Sillero et al.
Reference Sillero, Jimenez and Moser2013), so also will
 $\unicode[STIX]{x1D705}_{11}$
– according to (6.4). Issues related to this saturation are further discussed below.
$\unicode[STIX]{x1D705}_{11}$
– according to (6.4). Issues related to this saturation are further discussed below.
Note that current channel flow DNS data show a logarithmic growth of
 $W_{11pi}^{+}$
as
$W_{11pi}^{+}$
as
 $Re_{\unicode[STIX]{x1D70F}}$
increases (Lozano-Duran & Jimenez Reference Lozano-Duran and Jimenez2014; Lee & Moser Reference Lee and Moser2015), which was also observed in TBL (Klewicki & Falco Reference Klewicki and Falco1990; Degraaff & Eaton Reference Degraaff and Eaton2000; Metzger et al.
Reference Metzger, Klewicki, Bradshaw and Sadr2001; Hutchins et al.
Reference Hutchins, Nickels, Marusic and Chong2009; Sillero et al.
Reference Sillero, Jimenez and Moser2013; Marusic et al.
Reference Marusic, Chauhan, Kulandaivelu and Hutchins2015). Using the empirical formula
$Re_{\unicode[STIX]{x1D70F}}$
increases (Lozano-Duran & Jimenez Reference Lozano-Duran and Jimenez2014; Lee & Moser Reference Lee and Moser2015), which was also observed in TBL (Klewicki & Falco Reference Klewicki and Falco1990; Degraaff & Eaton Reference Degraaff and Eaton2000; Metzger et al.
Reference Metzger, Klewicki, Bradshaw and Sadr2001; Hutchins et al.
Reference Hutchins, Nickels, Marusic and Chong2009; Sillero et al.
Reference Sillero, Jimenez and Moser2013; Marusic et al.
Reference Marusic, Chauhan, Kulandaivelu and Hutchins2015). Using the empirical formula
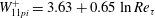 $W_{11pi}^{+}=3.63+0.65\ln Re_{\unicode[STIX]{x1D70F}}$
by Lozano-Duran & Jimenez (Reference Lozano-Duran and Jimenez2014) or
$W_{11pi}^{+}=3.63+0.65\ln Re_{\unicode[STIX]{x1D70F}}$
by Lozano-Duran & Jimenez (Reference Lozano-Duran and Jimenez2014) or
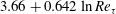 $3.66+0.642\ln Re_{\unicode[STIX]{x1D70F}}$
by Lee & Moser (Reference Lee and Moser2015), the resultant
$3.66+0.642\ln Re_{\unicode[STIX]{x1D70F}}$
by Lee & Moser (Reference Lee and Moser2015), the resultant
 $\unicode[STIX]{x1D705}_{11}$
from (6.4) is indicated by the solid line in figure 10(a), agreeing well with data at moderate
$\unicode[STIX]{x1D705}_{11}$
from (6.4) is indicated by the solid line in figure 10(a), agreeing well with data at moderate
 $Re$
. However, for
$Re$
. However, for
 $Re_{\unicode[STIX]{x1D70F}}>5000$
, Princeton pipe data (Hultmark et al.
Reference Hultmark, Vallikivi, Bailey and Smits2012) shows an invariant inner peak
$Re_{\unicode[STIX]{x1D70F}}>5000$
, Princeton pipe data (Hultmark et al.
Reference Hultmark, Vallikivi, Bailey and Smits2012) shows an invariant inner peak
 $W_{11pi}^{+}\approx 9.2$
, and hence the saturated
$W_{11pi}^{+}\approx 9.2$
, and hence the saturated
 $\unicode[STIX]{x1D705}_{11}\approx 1.02$
. This saturation is in contrast to Willert et al. (Reference Willert, Soria, Stanislas, Klinner, Amili, Eisfelder, Cuvier, Bellani, Fiorini and Talamelli2017), where they report that the inner peak
$\unicode[STIX]{x1D705}_{11}\approx 1.02$
. This saturation is in contrast to Willert et al. (Reference Willert, Soria, Stanislas, Klinner, Amili, Eisfelder, Cuvier, Bellani, Fiorini and Talamelli2017), where they report that the inner peak
 $W_{11pi}^{+}$
keeps increasing in their
$W_{11pi}^{+}$
keeps increasing in their
 $Re$
range for
$Re$
range for
 $Re_{\unicode[STIX]{x1D70F}}$
from 5000 to 40 000, and
$Re_{\unicode[STIX]{x1D70F}}$
from 5000 to 40 000, and
 $W_{11pi}^{+}\approx 9.8$
at
$W_{11pi}^{+}\approx 9.8$
at
 $Re_{\unicode[STIX]{x1D70F}}=40\,000$
. The growth of the inner peak at finite
$Re_{\unicode[STIX]{x1D70F}}=40\,000$
. The growth of the inner peak at finite
 $Re_{\unicode[STIX]{x1D70F}}$
(up to 20 000) is attributed to the inner–outer interaction; see Marusic, Baars & Hutchins (Reference Marusic, Baars and Hutchins2017) for more details.
$Re_{\unicode[STIX]{x1D70F}}$
(up to 20 000) is attributed to the inner–outer interaction; see Marusic, Baars & Hutchins (Reference Marusic, Baars and Hutchins2017) for more details.
(a) Measurement of
 $\unicode[STIX]{x1D705}_{11}$
by the inner peak value
$\unicode[STIX]{x1D705}_{11}$
by the inner peak value
 $W_{11pi}^{+}$
using (6.4). Dashed line denotes
$W_{11pi}^{+}$
using (6.4). Dashed line denotes
 $\unicode[STIX]{x1D705}_{11}=1.02$
resulting from
$\unicode[STIX]{x1D705}_{11}=1.02$
resulting from
 $W_{11pi}^{+}=9.2$
for Princeton pipe; solid line results from the empirical observation
$W_{11pi}^{+}=9.2$
for Princeton pipe; solid line results from the empirical observation
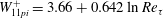 $W_{11pi}^{+}=3.66+0.642\ln Re_{\unicode[STIX]{x1D70F}}$
(Lee & Moser Reference Lee and Moser2015). Data: hexagon – Princeton pipe (Hultmark et al.
Reference Hultmark, Vallikivi, Bailey and Smits2012); other symbols are the same as in figure 3 for DNS data. (b) Predictions of outer peak location
$W_{11pi}^{+}=3.66+0.642\ln Re_{\unicode[STIX]{x1D70F}}$
(Lee & Moser Reference Lee and Moser2015). Data: hexagon – Princeton pipe (Hultmark et al.
Reference Hultmark, Vallikivi, Bailey and Smits2012); other symbols are the same as in figure 3 for DNS data. (b) Predictions of outer peak location
 $y_{11po}^{+}$
(left axis) using (6.13a
) – dashed line – and of peak value
$y_{11po}^{+}$
(left axis) using (6.13a
) – dashed line – and of peak value
 $W_{11po}^{+}$
(right axis) using (6.13b
) – solid line; circles are Princeton pipe data and triangles are CICLoPE data; open –
$W_{11po}^{+}$
(right axis) using (6.13b
) – solid line; circles are Princeton pipe data and triangles are CICLoPE data; open –
 $y_{11po}^{+}$
, solid –
$y_{11po}^{+}$
, solid –
 $W_{11po}^{+}$
.
$W_{11po}^{+}$
.

Here, to match Princeton pipe data (Hultmark et al.
Reference Hultmark, Vallikivi, Bailey and Smits2012),
 $\unicode[STIX]{x1D705}_{11}=1.02$
is adopted for
$\unicode[STIX]{x1D705}_{11}=1.02$
is adopted for
 $Re_{\unicode[STIX]{x1D70F}}>5000$
. As shown in figure 11(a), the inner profile given by (6.2) agrees well with high-
$Re_{\unicode[STIX]{x1D70F}}>5000$
. As shown in figure 11(a), the inner profile given by (6.2) agrees well with high-
 $Re$
pipe data, where
$Re$
pipe data, where
 $\unicode[STIX]{x1D705}_{11}=1.02$
is the only new parameter. Moreover, figure 11(b) shows the similar comparison for the CICLoPE data, where
$\unicode[STIX]{x1D705}_{11}=1.02$
is the only new parameter. Moreover, figure 11(b) shows the similar comparison for the CICLoPE data, where
 $\unicode[STIX]{x1D705}_{11}=1.04$
is adopted for the current
$\unicode[STIX]{x1D705}_{11}=1.04$
is adopted for the current
 $Re$
values (the inner profiles for
$Re$
values (the inner profiles for
 $Re_{\unicode[STIX]{x1D70F}}$
above 20 000 are not shown because of data uncertainty on the peak value). Note that in figure 11(b),
$Re_{\unicode[STIX]{x1D70F}}$
above 20 000 are not shown because of data uncertainty on the peak value). Note that in figure 11(b),
 $y^{\ast }=y^{+}/12$
(instead of
$y^{\ast }=y^{+}/12$
(instead of
 $y^{\ast }=y^{+}/9.7$
) is redefined in (6.2) – to match a larger
$y^{\ast }=y^{+}/9.7$
) is redefined in (6.2) – to match a larger
 $y_{11pi}^{+}\approx 15{-}16$
of the CICLoPE data. One can check that the inner peak is still located at (6.3), and hence the invariance of (6.4); but the new definition of
$y_{11pi}^{+}\approx 15{-}16$
of the CICLoPE data. One can check that the inner peak is still located at (6.3), and hence the invariance of (6.4); but the new definition of
 $y^{\ast }$
now leads to
$y^{\ast }$
now leads to
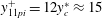 $y_{11pi}^{+}=12y_{c}^{\ast }\approx 15$
, hence matching the CICLoPE data. A slight difference between Princeton pipe and CICLoPE data is also found in the outer flow region, which is addressed below.
$y_{11pi}^{+}=12y_{c}^{\ast }\approx 15$
, hence matching the CICLoPE data. A slight difference between Princeton pipe and CICLoPE data is also found in the outer flow region, which is addressed below.
6.2 Outer profile with the mesolayer modification
Note that according to the canonical four-layer descriptions (2.32) and (2.31),
 $W_{11}^{+}$
should exhibit a constant plateau in the log layer, namely
$W_{11}^{+}$
should exhibit a constant plateau in the log layer, namely
 $$\begin{eqnarray}W_{11}^{+}(r)=W_{12}^{+}(\ell _{11}^{+}/\ell _{12}^{+})^{2}\approx \unicode[STIX]{x1D705}_{11}^{2}/\unicode[STIX]{x1D705}^{2}.\end{eqnarray}$$
However, this contrasts the recently observed outer peak (Hultmark et al.
Reference Hultmark, Vallikivi, Bailey and Smits2012; Willert et al.
Reference Willert, Soria, Stanislas, Klinner, Amili, Eisfelder, Cuvier, Bellani, Fiorini and Talamelli2017). To characterize this peak, a mesolayer model was introduced by us (Chen et al.
Reference Chen, Wei, Hussain and She2015) based on an anomalous scaling consideration, which further leads to a notable improvement of the
 $k-\unicode[STIX]{x1D714}$
model (Wilcox Reference Wilcox2006) in predicting the entire
$k-\unicode[STIX]{x1D714}$
model (Wilcox Reference Wilcox2006) in predicting the entire
 $W_{11}^{+}$
profile (Chen, Hussain & She Reference Chen, Hussain and She2016a
). Note that the mesolayer concept has been proposed before (Afzal Reference Afzal1982; Wosnik et al.
Reference Wosnik, Castillo and George2000; Hultmark Reference Hultmark2012), and we define it as the region above the buffer layer and ending at the peak location of the Reynolds shear stress (i.e.
$W_{11}^{+}$
profile (Chen, Hussain & She Reference Chen, Hussain and She2016a
). Note that the mesolayer concept has been proposed before (Afzal Reference Afzal1982; Wosnik et al.
Reference Wosnik, Castillo and George2000; Hultmark Reference Hultmark2012), and we define it as the region above the buffer layer and ending at the peak location of the Reynolds shear stress (i.e.
 $y_{12p}^{+}$
in (3.9)).
$y_{12p}^{+}$
in (3.9)).
Inner profile by (6.2) – dash-dotted line – and the outer profile by (6.9) – solid line – compared with high
 $Re$
data in (a) Princeton pipe (Hultmark et al.
Reference Hultmark, Vallikivi, Bailey and Smits2012) and (b) CICLoPE (Willert et al.
Reference Willert, Soria, Stanislas, Klinner, Amili, Eisfelder, Cuvier, Bellani, Fiorini and Talamelli2017). Note that
$Re$
data in (a) Princeton pipe (Hultmark et al.
Reference Hultmark, Vallikivi, Bailey and Smits2012) and (b) CICLoPE (Willert et al.
Reference Willert, Soria, Stanislas, Klinner, Amili, Eisfelder, Cuvier, Bellani, Fiorini and Talamelli2017). Note that
 $y^{\ast }$
in (6.2), and
$y^{\ast }$
in (6.2), and
 $c$
and
$c$
and
 $\unicode[STIX]{x1D6FE}_{m}$
in (6.9) are slightly different between Princeton and CICLoPE datasets. Also included in (a) are log profiles of (1.3) – dashed lines – with
$\unicode[STIX]{x1D6FE}_{m}$
in (6.9) are slightly different between Princeton and CICLoPE datasets. Also included in (a) are log profiles of (1.3) – dashed lines – with
 $A_{11}=1.25$
and
$A_{11}=1.25$
and
 $B_{11}=1.63$
theoretically determined in (6.17).
$B_{11}=1.63$
theoretically determined in (6.17).
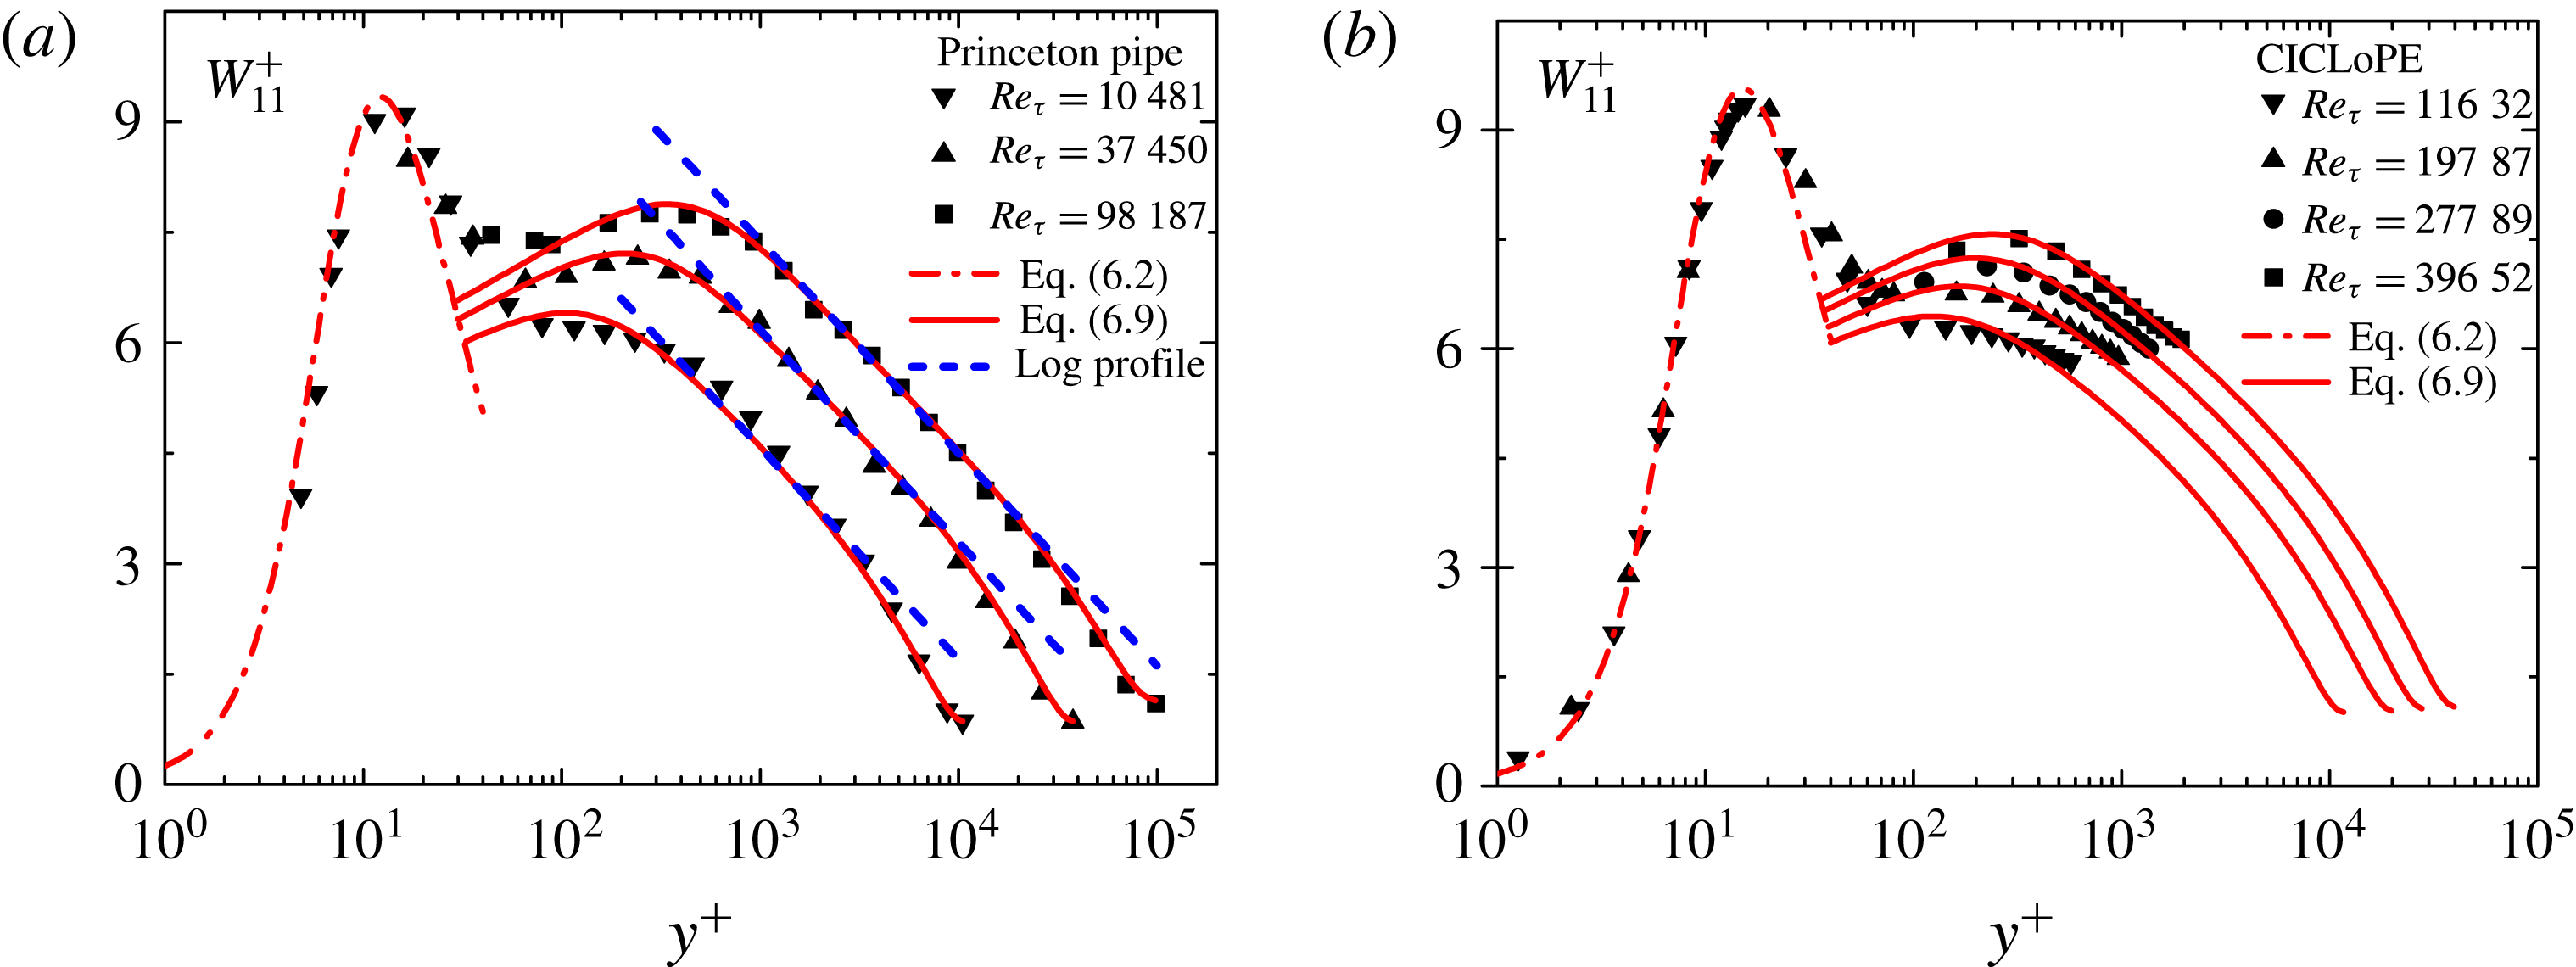
Our definition of mesolayer yields an phenomenological explanation of the critical
 $Re$
(i.e.
$Re$
(i.e.
 $Re_{\unicode[STIX]{x1D70F}}^{c}\approx 10^{4}$
) above which the outer peak emerges. Note that
$Re_{\unicode[STIX]{x1D70F}}^{c}\approx 10^{4}$
) above which the outer peak emerges. Note that
 $y_{12p}^{+}$
was defined as the location of the ‘critical layer’ by Sreenivasan (Reference Sreenivasan1988), and as the demarcation of the inner–outer region by Klewicki et al. (Reference Klewicki, Chin, Blackburn, Ooi and Marusic2012). Accordingly, we consider
$y_{12p}^{+}$
was defined as the location of the ‘critical layer’ by Sreenivasan (Reference Sreenivasan1988), and as the demarcation of the inner–outer region by Klewicki et al. (Reference Klewicki, Chin, Blackburn, Ooi and Marusic2012). Accordingly, we consider
 $y_{12p}^{+}$
(
$y_{12p}^{+}$
(
 $=\sqrt{Re_{\unicode[STIX]{x1D70F}}/\unicode[STIX]{x1D705}}$
) as a typical height of near-wall coherent structures (or wall-attached eddies). As
$=\sqrt{Re_{\unicode[STIX]{x1D70F}}/\unicode[STIX]{x1D705}}$
) as a typical height of near-wall coherent structures (or wall-attached eddies). As
 $Re$
increases,
$Re$
increases,
 $y_{12p}^{+}$
will increase, indicating that such attached eddies move away from wall and finally enter the quasi-balance region (balance between production and dissipation of total kinetic energy) – the near-wall boundary is
$y_{12p}^{+}$
will increase, indicating that such attached eddies move away from wall and finally enter the quasi-balance region (balance between production and dissipation of total kinetic energy) – the near-wall boundary is
 $y_{Q}^{+}\approx 150$
according to DNS data (Del Alamo & Jimenez Reference Del Alamo and Jimenez2006). Hence,
$y_{Q}^{+}\approx 150$
according to DNS data (Del Alamo & Jimenez Reference Del Alamo and Jimenez2006). Hence,
 $y_{12p}^{+}=y_{Q}^{+}$
yields a critical
$y_{12p}^{+}=y_{Q}^{+}$
yields a critical
 $Re_{\unicode[STIX]{x1D70F}}=\unicode[STIX]{x1D705}y_{Q}^{+2}\approx 10\,100$
. For small
$Re_{\unicode[STIX]{x1D70F}}=\unicode[STIX]{x1D705}y_{Q}^{+2}\approx 10\,100$
. For small
 $Re$
, these eddies are outside the quasi-balance zone; until
$Re$
, these eddies are outside the quasi-balance zone; until
 $Re_{\unicode[STIX]{x1D70F}}>10\,100$
, they fully enter the quasi-balance zone, which may suppress local dissipation and result in the outer peak of
$Re_{\unicode[STIX]{x1D70F}}>10\,100$
, they fully enter the quasi-balance zone, which may suppress local dissipation and result in the outer peak of
 $W_{11}^{+}$
– in analogy to the coherent vortex filaments introducing scaling anomaly in the cascade of isotropic turbulence (She & Leveque Reference She and Leveque1994). It is still a speculation, which may be complementary to the effect of LSM or VLSM (Hultmark et al.
Reference Hultmark, Vallikivi, Bailey and Smits2013; Vincenti et al.
Reference Vincenti, Klewicki, Morrill-Winter, White and Wosnik2013; Vallikivi et al.
Reference Vallikivi, Ganapathisubramani and Smits2015). Also, the non-equilibrium feature of dissipation (Vassilicos Reference Vassilicos2015) in the region of the outer peak is an interesting issue to pursue, as the non-local energy flux from the near-wall production peak may be important. A study of the two-point statistics (such as the velocity structure function) would provide evidence of the complex interplay between the non-local spatial and spectral energy fluxes, which requires more studies involving both the Reynolds stress equations and the spectral transfer equations.
$W_{11}^{+}$
– in analogy to the coherent vortex filaments introducing scaling anomaly in the cascade of isotropic turbulence (She & Leveque Reference She and Leveque1994). It is still a speculation, which may be complementary to the effect of LSM or VLSM (Hultmark et al.
Reference Hultmark, Vallikivi, Bailey and Smits2013; Vincenti et al.
Reference Vincenti, Klewicki, Morrill-Winter, White and Wosnik2013; Vallikivi et al.
Reference Vallikivi, Ganapathisubramani and Smits2015). Also, the non-equilibrium feature of dissipation (Vassilicos Reference Vassilicos2015) in the region of the outer peak is an interesting issue to pursue, as the non-local energy flux from the near-wall production peak may be important. A study of the two-point statistics (such as the velocity structure function) would provide evidence of the complex interplay between the non-local spatial and spectral energy fluxes, which requires more studies involving both the Reynolds stress equations and the spectral transfer equations.
Based on the mesolayer concept, Chen et al. (Reference Chen, Wei, Hussain and She2015) postulate an anomalous scaling model for the ratio between
 $\ell _{11}$
and
$\ell _{11}$
and
 $\ell _{12}$
, i.e.
$\ell _{12}$
, i.e.
 $$\begin{eqnarray}\unicode[STIX]{x1D703}_{meso}=c(y^{+})^{\unicode[STIX]{x1D6FE}_{b}}[1+(y^{+}/y_{meso}^{+})^{2}]^{(\unicode[STIX]{x1D6FE}_{m}-\unicode[STIX]{x1D6FE}_{b})/2},\end{eqnarray}$$
where
 $y_{meso}^{+}=y_{12p}^{+}=\sqrt{Re_{\unicode[STIX]{x1D70F}}/\unicode[STIX]{x1D705}}$
. It readily leads to the outer profile of
$y_{meso}^{+}=y_{12p}^{+}=\sqrt{Re_{\unicode[STIX]{x1D70F}}/\unicode[STIX]{x1D705}}$
. It readily leads to the outer profile of
 $W_{11}^{+}$
:
$W_{11}^{+}$
:
 $$\begin{eqnarray}\displaystyle W_{11meso}^{+}=W_{12}^{+}\unicode[STIX]{x1D703}_{meso}^{2}=c^{2}r(y^{+})^{2\unicode[STIX]{x1D6FE}_{b}}[1+(y^{+}/y_{meso}^{+})^{2}]^{\unicode[STIX]{x1D6FE}_{m}-\unicode[STIX]{x1D6FE}_{b}}. & & \displaystyle\end{eqnarray}$$
Compared to models for the outer
 $W_{11}^{+}$
profile by Vassilicos et al. (Reference Vassilicos, Laval, Foucaut and Stanislas2015) and Laval et al. (Reference Laval, Vassilicos, Foucaut and Stanislas2017) (with eight parameters), equation (6.7) agrees equally well with data using much fewer parameters (only three). These three are: (1) the scaling exponent
$W_{11}^{+}$
profile by Vassilicos et al. (Reference Vassilicos, Laval, Foucaut and Stanislas2015) and Laval et al. (Reference Laval, Vassilicos, Foucaut and Stanislas2017) (with eight parameters), equation (6.7) agrees equally well with data using much fewer parameters (only three). These three are: (1) the scaling exponent
 $\unicode[STIX]{x1D6FE}_{b}=0.05$
quantifying the growth of
$\unicode[STIX]{x1D6FE}_{b}=0.05$
quantifying the growth of
 $W_{11}^{+}$
before reaching its outer peak; (2) the second exponent
$W_{11}^{+}$
before reaching its outer peak; (2) the second exponent
 $\unicode[STIX]{x1D6FE}_{m}=-0.09$
quantifying the decay of
$\unicode[STIX]{x1D6FE}_{m}=-0.09$
quantifying the decay of
 $W_{11}^{+}$
after its outer peak; and (3) the global proportionality coefficient
$W_{11}^{+}$
after its outer peak; and (3) the global proportionality coefficient
 $c$
determining the magnitude of outer profile. The two exponents are believed to be related to intermittent cascade dynamics in the bulk developed (more isotropic) turbulence. Presently, they are measured from experimental data (Chen et al.
Reference Chen, Wei, Hussain and She2015), which seem to be invariant with
$c$
determining the magnitude of outer profile. The two exponents are believed to be related to intermittent cascade dynamics in the bulk developed (more isotropic) turbulence. Presently, they are measured from experimental data (Chen et al.
Reference Chen, Wei, Hussain and She2015), which seem to be invariant with
 $Re$
– to be further elucidated in the future.
$Re$
– to be further elucidated in the future.
On the other hand, the value of
 $c$
for each
$c$
for each
 $Re$
is determined by the following procedure. Note that (6.7) implies
$Re$
is determined by the following procedure. Note that (6.7) implies
 $W_{11c}^{+}=0$
at the centreline
$W_{11c}^{+}=0$
at the centreline
 $r=0$
, due to a lack of the centre core layer factor in (6.6), which can be readily rectified by incorporating the core layer asymptote
$r=0$
, due to a lack of the centre core layer factor in (6.6), which can be readily rectified by incorporating the core layer asymptote
 $\ell _{11}/\ell _{12}\propto (1+(r_{core}/r)^{2})^{1/4}$
as
$\ell _{11}/\ell _{12}\propto (1+(r_{core}/r)^{2})^{1/4}$
as
 $r\rightarrow 0$
from (2.34). This yields
$r\rightarrow 0$
from (2.34). This yields
 $$\begin{eqnarray}\unicode[STIX]{x1D703}_{outer}=c(y^{+})^{\unicode[STIX]{x1D6FE}_{b}}\left(1+\left(\frac{y^{+}}{y_{meso}^{+}}\right)^{2}\right)^{(\unicode[STIX]{x1D6FE}_{m}-\unicode[STIX]{x1D6FE}_{b})/2}\frac{(1+(r_{core}/r)^{2})^{1/4}}{(1+r_{core}^{2})^{1/4}},\end{eqnarray}$$
where the factor
 $(1+r_{core}^{2})^{1/4}$
guarantees that
$(1+r_{core}^{2})^{1/4}$
guarantees that
 $\unicode[STIX]{x1D703}_{outer}\rightarrow \unicode[STIX]{x1D703}_{meso}$
as
$\unicode[STIX]{x1D703}_{outer}\rightarrow \unicode[STIX]{x1D703}_{meso}$
as
 $r\rightarrow 1$
. Therefore, the expression for the entire outer profile of
$r\rightarrow 1$
. Therefore, the expression for the entire outer profile of
 $W_{11}^{+}$
is
$W_{11}^{+}$
is
 $$\begin{eqnarray}\displaystyle W_{11Outer}^{+}=W_{12}^{+}\unicode[STIX]{x1D703}_{outer}^{2}=c^{2}(y^{+})^{2\unicode[STIX]{x1D6FE}_{b}}\left(1+\left(\frac{y^{+}}{y_{meso}^{+}}\right)^{2}\right)^{\unicode[STIX]{x1D6FE}_{m}-\unicode[STIX]{x1D6FE}_{b}}\frac{\sqrt{r^{2}+r_{core}^{2}}}{\sqrt{1+r_{core}^{2}}}. & & \displaystyle\end{eqnarray}$$
One can check as
 $r\rightarrow 1$
,
$r\rightarrow 1$
,
 $W_{11Outer}^{+}\rightarrow W_{11meso}^{+}$
(hence (6.9)
$W_{11Outer}^{+}\rightarrow W_{11meso}^{+}$
(hence (6.9)
 $\rightarrow$
(6.7)). Moreover, at
$\rightarrow$
(6.7)). Moreover, at
 $r=0$
(i.e.
$r=0$
(i.e.
 $y^{+}=Re_{\unicode[STIX]{x1D70F}}$
), we obtain a non-zero centreline value of
$y^{+}=Re_{\unicode[STIX]{x1D70F}}$
), we obtain a non-zero centreline value of
 $W_{11}^{+}$
from (6.9):
$W_{11}^{+}$
from (6.9):
 $$\begin{eqnarray}\displaystyle W_{11c}^{+}=c^{2}Re_{\unicode[STIX]{x1D70F}}^{2\unicode[STIX]{x1D6FE}_{m}}y_{12p}^{+2(\unicode[STIX]{x1D6FE}_{b}-\unicode[STIX]{x1D6FE}_{m})}\frac{r_{core}}{\sqrt{1+r_{core}^{2}}}. & & \displaystyle\end{eqnarray}$$
Now, similar to (5.6), we invoke Townsends’
 $Re$
-similarity hypothesis, namely,
$Re$
-similarity hypothesis, namely,
 $W_{c11}^{+}$
is expected to be independent of
$W_{c11}^{+}$
is expected to be independent of
 $Re$
, which yields
$Re$
, which yields
 $c\propto Re_{\unicode[STIX]{x1D70F}}^{-(\unicode[STIX]{x1D6FE}_{b}+\unicode[STIX]{x1D6FE}_{m})/2}$
. Denote
$c\propto Re_{\unicode[STIX]{x1D70F}}^{-(\unicode[STIX]{x1D6FE}_{b}+\unicode[STIX]{x1D6FE}_{m})/2}$
. Denote
 $c=c^{\prime }Re_{\unicode[STIX]{x1D70F}}^{-(\unicode[STIX]{x1D6FE}_{b}+\unicode[STIX]{x1D6FE}_{m})/2}$
and substitute this
$c=c^{\prime }Re_{\unicode[STIX]{x1D70F}}^{-(\unicode[STIX]{x1D6FE}_{b}+\unicode[STIX]{x1D6FE}_{m})/2}$
and substitute this
 $c$
and
$c$
and
 $y_{12p}^{+}$
into (6.10), yielding
$y_{12p}^{+}$
into (6.10), yielding
 $$\begin{eqnarray}\displaystyle c^{\prime }=W_{c11}^{+1/2}(1+r_{core}^{2})^{1/4}\unicode[STIX]{x1D705}^{\unicode[STIX]{x1D6FE}_{b}-\unicode[STIX]{x1D6FE}_{m}}/\sqrt{r_{core}}. & & \displaystyle\end{eqnarray}$$
Using
 $r_{core}=0.27$
,
$r_{core}=0.27$
,
 $\unicode[STIX]{x1D705}=0.45$
, and the centreline measurement
$\unicode[STIX]{x1D705}=0.45$
, and the centreline measurement
 $W_{11c}^{+}\approx 0.86$
from the EXP pipe at
$W_{11c}^{+}\approx 0.86$
from the EXP pipe at
 $Re_{\unicode[STIX]{x1D70F}}=10\,481$
(Hultmark et al.
Reference Hultmark, Vallikivi, Bailey and Smits2012), we obtain
$Re_{\unicode[STIX]{x1D70F}}=10\,481$
(Hultmark et al.
Reference Hultmark, Vallikivi, Bailey and Smits2012), we obtain
 $c^{\prime }\approx 1.72$
, which yields
$c^{\prime }\approx 1.72$
, which yields
 $$\begin{eqnarray}c=c^{\prime }Re_{\unicode[STIX]{x1D70F}}^{-(\unicode[STIX]{x1D6FE}_{b}+\unicode[STIX]{x1D6FE}_{m})/2}\approx 1.72Re_{\unicode[STIX]{x1D70F}}^{0.02}.\end{eqnarray}$$
Figure 11(a) shows that (6.9) agrees well with the high-
 $Re$
data of the Princeton pipe. Recall the model of Vassilicos et al. (Reference Vassilicos, Laval, Foucaut and Stanislas2015) and Laval et al. (Reference Laval, Vassilicos, Foucaut and Stanislas2017) for the outer profile of
$Re$
data of the Princeton pipe. Recall the model of Vassilicos et al. (Reference Vassilicos, Laval, Foucaut and Stanislas2015) and Laval et al. (Reference Laval, Vassilicos, Foucaut and Stanislas2017) for the outer profile of
 $W_{11}^{+}$
; it is built on a match of two piecewise functions which are obtained by the integration of a (presumed) four-layer power-law spectrum (including a
$W_{11}^{+}$
; it is built on a match of two piecewise functions which are obtained by the integration of a (presumed) four-layer power-law spectrum (including a
 $k_{x}^{-1}$
spectrum corresponding to the logarithmic profile by Townsend). However, it is difficult for such a spectral model to locate precisely the log region (particularly for small
$k_{x}^{-1}$
spectrum corresponding to the logarithmic profile by Townsend). However, it is difficult for such a spectral model to locate precisely the log region (particularly for small
 $Re$
). In contrast, equation (6.9) describes the simple multilayer structure, needing no spectral description, and involving far fewer parameters. Figure 11 shows that (6.9) characterizes well both the smooth variation of the data across the outer peak and the gradual deviation of the data from the logarithmic distribution near the centreline, which were not described yet in Laval et al. (Reference Laval, Vassilicos, Foucaut and Stanislas2017).
$Re$
). In contrast, equation (6.9) describes the simple multilayer structure, needing no spectral description, and involving far fewer parameters. Figure 11 shows that (6.9) characterizes well both the smooth variation of the data across the outer peak and the gradual deviation of the data from the logarithmic distribution near the centreline, which were not described yet in Laval et al. (Reference Laval, Vassilicos, Foucaut and Stanislas2017).
The comparison between (6.9) and the revised CICLoPE data is shown in figure 11(b). Note that only a small part of
 $W_{11}^{+}$
is measured in the outer flow region of CICLoPE, which differs from the Princeton pipe data slightly. In particular, beyond the outer peak,
$W_{11}^{+}$
is measured in the outer flow region of CICLoPE, which differs from the Princeton pipe data slightly. In particular, beyond the outer peak,
 $W_{11}^{+}$
declines more slowly in CICLoPE, hence suggesting a larger
$W_{11}^{+}$
declines more slowly in CICLoPE, hence suggesting a larger
 $\unicode[STIX]{x1D6FE}_{m}=-0.07$
(compared to
$\unicode[STIX]{x1D6FE}_{m}=-0.07$
(compared to
 $-0.09$
) for the four profiles shown in figure 11(b). Moreover, for
$-0.09$
) for the four profiles shown in figure 11(b). Moreover, for
 $Re_{\unicode[STIX]{x1D70F}}=27\,789$
and 39 652, the outer peak value of CICLoPE is slightly larger than the Princeton pipe at similar values of
$Re_{\unicode[STIX]{x1D70F}}=27\,789$
and 39 652, the outer peak value of CICLoPE is slightly larger than the Princeton pipe at similar values of
 $Re_{\unicode[STIX]{x1D70F}}$
, thus implying a larger magnitude parameter
$Re_{\unicode[STIX]{x1D70F}}$
, thus implying a larger magnitude parameter
 $c$
for these two profiles (i.e.
$c$
for these two profiles (i.e.
 $c=1.75Re_{\unicode[STIX]{x1D70F}}^{0.02}$
). Except for these two changes, all the other parameters in (6.9) stay the same as for the Princeton pipe, and the resulting profiles agree closely with the CICLoPE data. As a reminder, according to the Princeton data in figure 11(a),
$c=1.75Re_{\unicode[STIX]{x1D70F}}^{0.02}$
). Except for these two changes, all the other parameters in (6.9) stay the same as for the Princeton pipe, and the resulting profiles agree closely with the CICLoPE data. As a reminder, according to the Princeton data in figure 11(a),
 $\unicode[STIX]{x1D6FE}_{m}=-0.09$
and
$\unicode[STIX]{x1D6FE}_{m}=-0.09$
and
 $c=1.72Re_{\unicode[STIX]{x1D70F}}^{0.02}$
match well with data at even higher
$c=1.72Re_{\unicode[STIX]{x1D70F}}^{0.02}$
match well with data at even higher
 $Re$
(i.e.
$Re$
(i.e.
 $Re_{\unicode[STIX]{x1D70F}}=37\,450$
and 98 187). It is thus unknown whether the small changes of
$Re_{\unicode[STIX]{x1D70F}}=37\,450$
and 98 187). It is thus unknown whether the small changes of
 $c$
and
$c$
and
 $\unicode[STIX]{x1D6FE}_{m}$
are physically necessary, or simply due to data uncertainty (an issue that has been emphasized for CICLoPE by Willert et al. (Reference Willert, Soria, Stanislas, Klinner, Amili, Eisfelder, Cuvier, Bellani, Fiorini and Talamelli2017)).
$\unicode[STIX]{x1D6FE}_{m}$
are physically necessary, or simply due to data uncertainty (an issue that has been emphasized for CICLoPE by Willert et al. (Reference Willert, Soria, Stanislas, Klinner, Amili, Eisfelder, Cuvier, Bellani, Fiorini and Talamelli2017)).
6.3 Scaling of the
$W_{11}^{+}$
outer peak

Now, using the three parameters (
 $\unicode[STIX]{x1D6FE}_{b}=0.05$
,
$\unicode[STIX]{x1D6FE}_{b}=0.05$
,
 $\unicode[STIX]{x1D6FE}_{m}=-0.09$
and
$\unicode[STIX]{x1D6FE}_{m}=-0.09$
and
 $c^{\prime }=1.72$
), let us predict the
$c^{\prime }=1.72$
), let us predict the
 $Re$
-scaling of the outer peak value
$Re$
-scaling of the outer peak value
 $W_{11po}^{+}$
and its
$W_{11po}^{+}$
and its
 $y$
-location
$y$
-location
 $y_{11po}^{+}$
. Solving
$y_{11po}^{+}$
. Solving
 $\unicode[STIX]{x2202}_{y^{+}}W_{11}^{+}=0$
using (6.9), which actually is
$\unicode[STIX]{x2202}_{y^{+}}W_{11}^{+}=0$
using (6.9), which actually is
 $\unicode[STIX]{x2202}_{y^{+}}\unicode[STIX]{x1D703}_{meso}\approx 0$
since
$\unicode[STIX]{x2202}_{y^{+}}\unicode[STIX]{x1D703}_{meso}\approx 0$
since
 $r\approx 1$
, one has the outer peak location:
$r\approx 1$
, one has the outer peak location:
 $$\begin{eqnarray}y_{11po}^{+}=\sqrt{-\unicode[STIX]{x1D6FE}_{b}/\unicode[STIX]{x1D6FE}_{m}}y_{meso}^{+}\approx 1.1Re_{\unicode[STIX]{x1D70F}}^{1/2}.\end{eqnarray}$$
Moreover, substituting (6.13a
),
 $y_{meso}^{+}=\sqrt{Re_{\unicode[STIX]{x1D70F}}/\unicode[STIX]{x1D705}}$
and (6.12) into (6.7) yields the outer peak value:
$y_{meso}^{+}=\sqrt{Re_{\unicode[STIX]{x1D70F}}/\unicode[STIX]{x1D705}}$
and (6.12) into (6.7) yields the outer peak value:
 $$\begin{eqnarray}W_{11po}^{+}={c^{\prime }}^{2}(-\unicode[STIX]{x1D6FE}_{b}/\unicode[STIX]{x1D6FE}_{m})^{\unicode[STIX]{x1D6FE}_{b}}(1-\unicode[STIX]{x1D6FE}_{b}/\unicode[STIX]{x1D6FE}_{m})^{\unicode[STIX]{x1D6FE}_{m}-\unicode[STIX]{x1D6FE}_{b}}Re_{\unicode[STIX]{x1D70F}}^{-\unicode[STIX]{x1D6FE}_{m}}\approx 2.8Re_{\unicode[STIX]{x1D70F}}^{0.09}.\end{eqnarray}$$
Predictions by (6.13a
) and (6.13b
) compared with data are shown in figure 10(b). The agreement is quite good, though the triangles (CICLoPE data) at the two largest
 $Re$
are a little higher than the circles (Princeton pipe data) – due to the aforementioned larger
$Re$
are a little higher than the circles (Princeton pipe data) – due to the aforementioned larger
 $\unicode[STIX]{x1D6FE}_{m}$
and
$\unicode[STIX]{x1D6FE}_{m}$
and
 $c$
for CICLoPE.
$c$
for CICLoPE.
To emphasize,
 $y_{11po}^{+}\propto Re_{\unicode[STIX]{x1D70F}}^{1/2}$
in (6.13a
) is obtained by the scaling of
$y_{11po}^{+}\propto Re_{\unicode[STIX]{x1D70F}}^{1/2}$
in (6.13a
) is obtained by the scaling of
 $y_{meso}^{+}$
, and this scaling is independent of the values of
$y_{meso}^{+}$
, and this scaling is independent of the values of
 $c^{\prime }$
,
$c^{\prime }$
,
 $\unicode[STIX]{x1D6FE}_{b}$
and
$\unicode[STIX]{x1D6FE}_{b}$
and
 $\unicode[STIX]{x1D6FE}_{m}$
. This is self-consistent with the preceding suggested scenario that
$\unicode[STIX]{x1D6FE}_{m}$
. This is self-consistent with the preceding suggested scenario that
 $y_{meso}^{+}$
(i.e. typical height of near-wall coherent structures) entering the quasi-balance zone causes the anomalous dissipation, and hence the outer peak. This
$y_{meso}^{+}$
(i.e. typical height of near-wall coherent structures) entering the quasi-balance zone causes the anomalous dissipation, and hence the outer peak. This
 $Re_{\unicode[STIX]{x1D70F}}^{1/2}$
scaling is also different from the
$Re_{\unicode[STIX]{x1D70F}}^{1/2}$
scaling is also different from the
 $Re_{\unicode[STIX]{x1D70F}}^{2/3}$
scaling by McKeon & Sharma (Reference McKeon and Sharma2010), where they argue that the outer peak corresponds to a specific mode whose propagation velocity equals the local mean velocity at the position where
$Re_{\unicode[STIX]{x1D70F}}^{2/3}$
scaling by McKeon & Sharma (Reference McKeon and Sharma2010), where they argue that the outer peak corresponds to a specific mode whose propagation velocity equals the local mean velocity at the position where
 $U^{+}=2U_{c}^{+}/3$
. Currently, both scalings agree with data (within data uncertainty) in the present
$U^{+}=2U_{c}^{+}/3$
. Currently, both scalings agree with data (within data uncertainty) in the present
 $Re$
range, while further higher-
$Re$
range, while further higher-
 $Re$
data are needed to indicate the preferred of the two scalings (note that
$Re$
data are needed to indicate the preferred of the two scalings (note that
 $Re_{\unicode[STIX]{x1D70F}}^{1/2}$
scaling is better for TBL data of Mathis, Hutchins & Marusic (Reference Mathis, Hutchins and Marusic2009)).
$Re_{\unicode[STIX]{x1D70F}}^{1/2}$
scaling is better for TBL data of Mathis, Hutchins & Marusic (Reference Mathis, Hutchins and Marusic2009)).
According to (6.13b
), the outer peak will exceed the inner peak – taking the aforementioned constant value 9.2 – at
 $Re_{\unicode[STIX]{x1D70F}}=(9.2/2.8)^{1/0.09}\approx 5.5\times 10^{5}$
. (However, if the inner peak continues to increase, this
$Re_{\unicode[STIX]{x1D70F}}=(9.2/2.8)^{1/0.09}\approx 5.5\times 10^{5}$
. (However, if the inner peak continues to increase, this
 $Re_{\unicode[STIX]{x1D70F}}$
will be larger.) Prediction of this specific
$Re_{\unicode[STIX]{x1D70F}}$
will be larger.) Prediction of this specific
 $Re_{\unicode[STIX]{x1D70F}}$
, approximately six times larger than the maximum
$Re_{\unicode[STIX]{x1D70F}}$
, approximately six times larger than the maximum
 $Re_{\unicode[STIX]{x1D70F}}=98\,187$
in the Princeton pipe data (Hultmark et al.
Reference Hultmark, Vallikivi, Bailey and Smits2012), awaits verification when data become available.
$Re_{\unicode[STIX]{x1D70F}}=98\,187$
in the Princeton pipe data (Hultmark et al.
Reference Hultmark, Vallikivi, Bailey and Smits2012), awaits verification when data become available.
6.4 Townsend’s log profile for
$W_{11}^{+}$

Another important issue concerns the theoretical explanation of the recently observed logarithmic distribution (Hultmark et al.
Reference Hultmark, Vallikivi, Bailey and Smits2012), i.e.
 $W_{11}^{+}=-1.25\ln y+1.61$
. As introduced before, previous theories of the log profile build on the
$W_{11}^{+}=-1.25\ln y+1.61$
. As introduced before, previous theories of the log profile build on the
 $k_{x}^{-1}$
spectrum (Townsend Reference Townsend1976; Perry et al.
Reference Perry, Henbest and Chong1986), which is, however, not fully supported by experimental pipe data (Rosenberg et al.
Reference Rosenberg, Hultmark, Vallikivi, Bailey and Smits2013). Alternatively, Hultmark (Reference Hultmark2012) suggested investigating the diagnostic function
$k_{x}^{-1}$
spectrum (Townsend Reference Townsend1976; Perry et al.
Reference Perry, Henbest and Chong1986), which is, however, not fully supported by experimental pipe data (Rosenberg et al.
Reference Rosenberg, Hultmark, Vallikivi, Bailey and Smits2013). Alternatively, Hultmark (Reference Hultmark2012) suggested investigating the diagnostic function
 $\unicode[STIX]{x1D6E4}_{11}=-yd_{y}W_{11}^{+}$
to check the log profile. Here, similar to (5.12), we can calculate
$\unicode[STIX]{x1D6E4}_{11}=-yd_{y}W_{11}^{+}$
to check the log profile. Here, similar to (5.12), we can calculate
 $\unicode[STIX]{x1D6E4}_{11}$
from (6.9), and hence theoretically estimate the values of the log-law slope
$\unicode[STIX]{x1D6E4}_{11}$
from (6.9), and hence theoretically estimate the values of the log-law slope
 $A_{11}$
and the additive constant
$A_{11}$
and the additive constant
 $B_{11}$
, presented below.
$B_{11}$
, presented below.
Since the log profile region is beyond the outer peak (
 $y^{+}\gg y_{meso}^{+}$
and
$y^{+}\gg y_{meso}^{+}$
and
 $r\approx 1$
), equation (6.9) is approximated as
$r\approx 1$
), equation (6.9) is approximated as
 $$\begin{eqnarray}W_{11}^{+}={c^{\prime }}^{2}\unicode[STIX]{x1D705}^{\unicode[STIX]{x1D6FE}_{m}-\unicode[STIX]{x1D6FE}_{b}}ry^{2\unicode[STIX]{x1D6FE}_{m}},\end{eqnarray}$$
from which we have
 $$\begin{eqnarray}\unicode[STIX]{x1D6E4}_{11}={c^{\prime }}^{2}\unicode[STIX]{x1D705}^{\unicode[STIX]{x1D6FE}_{m}-\unicode[STIX]{x1D6FE}_{b}}y^{2\unicode[STIX]{x1D6FE}_{m}}[1-(1+2\unicode[STIX]{x1D6FE}_{m})r].\end{eqnarray}$$
Again, the value of the approximate plateau of our theoretical
 $\unicode[STIX]{x1D6E4}_{11}$
can be represented by its minimum value
$\unicode[STIX]{x1D6E4}_{11}$
can be represented by its minimum value
 $\unicode[STIX]{x1D6E4}_{11min}$
, which can be obtained by solving
$\unicode[STIX]{x1D6E4}_{11min}$
, which can be obtained by solving
 $\text{d}\unicode[STIX]{x1D6E4}_{11}/\text{d}y=0$
using (6.15). The results are
$\text{d}\unicode[STIX]{x1D6E4}_{11}/\text{d}y=0$
using (6.15). The results are
 $$\begin{eqnarray}\unicode[STIX]{x1D6E4}_{11min}={c^{\prime }}^{2}\unicode[STIX]{x1D705}^{\unicode[STIX]{x1D6FE}_{m}-\unicode[STIX]{x1D6FE}_{b}}\left(\frac{2\unicode[STIX]{x1D6FE}_{m}}{1+2\unicode[STIX]{x1D6FE}_{m}}\right)^{1+4\unicode[STIX]{x1D6FE}_{m}}\approx 1.25,\end{eqnarray}$$
which is located at
 $$\begin{eqnarray}y_{11\unicode[STIX]{x1D6E4}}=\left(\frac{2\unicode[STIX]{x1D6FE}_{m}}{1+2\unicode[STIX]{x1D6FE}_{m}}\right)^{2}\approx 0.048.\end{eqnarray}$$
Repeating the calculation for
 $B_{33}$
in (5.16), the logarithmic additive constant
$B_{33}$
in (5.16), the logarithmic additive constant
 $B_{11}$
can be obtained by matching (6.14) with (1.3) at the specific location
$B_{11}$
can be obtained by matching (6.14) with (1.3) at the specific location
 $y=y_{11\unicode[STIX]{x1D6E4}}$
. Substituting
$y=y_{11\unicode[STIX]{x1D6E4}}$
. Substituting
 $y=y_{11\unicode[STIX]{x1D6E4}}\approx 0.048$
into (6.14) yields
$y=y_{11\unicode[STIX]{x1D6E4}}\approx 0.048$
into (6.14) yields
 $W_{11\unicode[STIX]{x1D6E4}}^{+}\approx 5.43$
; therefore
$W_{11\unicode[STIX]{x1D6E4}}^{+}\approx 5.43$
; therefore
 $$\begin{eqnarray}A_{11}=\unicode[STIX]{x1D6E4}_{11min}\approx 1.25,\quad B_{11}=W_{11\unicode[STIX]{x1D6E4}}^{+}+A_{11}\ln y_{11\unicode[STIX]{x1D6E4}}\approx 1.63,\end{eqnarray}$$
which are very close to the empirical values of
 $A_{11}=1.25$
and
$A_{11}=1.25$
and
 $B_{11}=1.61$
obtained by Hultmark et al. (Reference Hultmark, Vallikivi, Bailey and Smits2012). Figure 11 shows our theoretical log law with parameters in (6.17), in good agreement with both (6.9) and data. Thus, (6.9) leads to a local approximate log law, hence presenting an alternative derivation of the Townsend’s log profile.
$B_{11}=1.61$
obtained by Hultmark et al. (Reference Hultmark, Vallikivi, Bailey and Smits2012). Figure 11 shows our theoretical log law with parameters in (6.17), in good agreement with both (6.9) and data. Thus, (6.9) leads to a local approximate log law, hence presenting an alternative derivation of the Townsend’s log profile.
6.5 Composite expression for the entire flow
Now, we incorporate
 $\unicode[STIX]{x1D703}_{outer}$
(or
$\unicode[STIX]{x1D703}_{outer}$
(or
 $\unicode[STIX]{x1D703}_{meso}$
) with
$\unicode[STIX]{x1D703}_{meso}$
) with
 $\unicode[STIX]{x1D6FC}_{11}$
(and hence
$\unicode[STIX]{x1D6FC}_{11}$
(and hence
 $\ell _{11}$
) to form a composite expression for the entire flow, without introducing any additional parameter. Since
$\ell _{11}$
) to form a composite expression for the entire flow, without introducing any additional parameter. Since
 $\unicode[STIX]{x1D6FC}_{11}\propto 1/\sqrt{y^{+}}$
as
$\unicode[STIX]{x1D6FC}_{11}\propto 1/\sqrt{y^{+}}$
as
 $y^{+}\rightarrow 0$
, we now modify the
$y^{+}\rightarrow 0$
, we now modify the
 $y^{+\unicode[STIX]{x1D6FE}_{b}}$
factor in
$y^{+\unicode[STIX]{x1D6FE}_{b}}$
factor in
 $\unicode[STIX]{x1D703}_{outer}$
to match the near-wall scaling
$\unicode[STIX]{x1D703}_{outer}$
to match the near-wall scaling
 $1/\sqrt{y^{+}}$
and obtain the following improved
$1/\sqrt{y^{+}}$
and obtain the following improved
 $\unicode[STIX]{x1D6FC}_{11}$
(explained below):
$\unicode[STIX]{x1D6FC}_{11}$
(explained below):
 $$\begin{eqnarray}\unicode[STIX]{x1D6FC}_{11}^{\prime }=\frac{c_{1}y_{buf}^{+1/2}}{\sqrt{y^{+}}}\left(1+\left(\frac{y^{+}}{y_{B}^{+}}\right)^{4}\right)^{(1/2+\unicode[STIX]{x1D6FE}_{b})/4}\left(1+\left(\frac{y^{+}}{y_{meso}^{+}}\right)^{2}\right)^{(\unicode[STIX]{x1D6FE}_{m}-\unicode[STIX]{x1D6FE}_{b})/2}\left(1+\left(\frac{r_{core}}{r}\right)^{2}\right)^{1/4},\end{eqnarray}$$
and hence
 $$\begin{eqnarray}\ell _{11}^{\prime }=\ell _{12}^{+}\unicode[STIX]{x1D6FC}_{11}^{\prime },\quad \text{and}\quad W_{11}^{+}=W_{12}^{+}(\ell _{11}^{\prime }/\ell _{12})^{2}=W_{12}^{+}(\unicode[STIX]{x1D6FC}_{11}^{\prime })^{2}.\end{eqnarray}$$
It can be easily checked that
 $\unicode[STIX]{x1D6FC}_{11}^{\prime }=\unicode[STIX]{x1D6FC}_{11}$
for
$\unicode[STIX]{x1D6FC}_{11}^{\prime }=\unicode[STIX]{x1D6FC}_{11}$
for
 $y^{+}\ll y_{B}^{+}$
, and
$y^{+}\ll y_{B}^{+}$
, and
 $\unicode[STIX]{x1D6FC}_{11}^{\prime }=\unicode[STIX]{x1D703}_{outer}$
for
$\unicode[STIX]{x1D6FC}_{11}^{\prime }=\unicode[STIX]{x1D703}_{outer}$
for
 $y^{+}\gg y_{B}^{+}$
; note that the second condition implies
$y^{+}\gg y_{B}^{+}$
; note that the second condition implies
 $c_{1}y_{buf}^{+1/2}/y_{B}^{+(1/2+\unicode[STIX]{x1D6FE}_{b})}=c/(1+r_{core}^{2})^{1/4}$
, which leads to the definition of
$c_{1}y_{buf}^{+1/2}/y_{B}^{+(1/2+\unicode[STIX]{x1D6FE}_{b})}=c/(1+r_{core}^{2})^{1/4}$
, which leads to the definition of
 $y_{B}^{+}$
:
$y_{B}^{+}$
:
 $$\begin{eqnarray}y_{B}^{+}=[c_{1}y_{buf}^{+1/2}(1+r_{core}^{2})^{1/4}/c]^{2/(1+2\unicode[STIX]{x1D6FE}_{b})}.\end{eqnarray}$$
Substituting the global coefficients
 $c_{1}=c_{11}/(c_{12}y_{buf}^{+1/2})$
,
$c_{1}=c_{11}/(c_{12}y_{buf}^{+1/2})$
,
 $c_{11}=\unicode[STIX]{x1D705}_{11}y_{sub}^{+1/2}/[y_{buf}^{+}(1+r_{core}^{2})]^{1/2}$
,
$c_{11}=\unicode[STIX]{x1D705}_{11}y_{sub}^{+1/2}/[y_{buf}^{+}(1+r_{core}^{2})]^{1/2}$
,
 $c_{12}=\unicode[STIX]{x1D705}y_{sub}^{+1/2}/[y_{buf}^{+}(1+r_{core}^{2})^{1/4}]$
and
$c_{12}=\unicode[STIX]{x1D705}y_{sub}^{+1/2}/[y_{buf}^{+}(1+r_{core}^{2})^{1/4}]$
and
 $c=c^{\prime }Re_{\unicode[STIX]{x1D70F}}^{-(\unicode[STIX]{x1D6FE}_{m}+\unicode[STIX]{x1D6FE}_{b})/2}$
into (6.20a
) yields
$c=c^{\prime }Re_{\unicode[STIX]{x1D70F}}^{-(\unicode[STIX]{x1D6FE}_{m}+\unicode[STIX]{x1D6FE}_{b})/2}$
into (6.20a
) yields
 $$\begin{eqnarray}y_{B}^{+}=[\unicode[STIX]{x1D705}_{11}y_{buf}^{+1/2}/(c^{\prime }\unicode[STIX]{x1D705})]^{2/(1+2\unicode[STIX]{x1D6FE}_{b})}Re_{\unicode[STIX]{x1D70F}}^{(\unicode[STIX]{x1D6FE}_{b}+\unicode[STIX]{x1D6FE}_{m})/(1+2\unicode[STIX]{x1D6FE}_{b})}\approx 48Re_{\unicode[STIX]{x1D70F}}^{-0.0364}.\end{eqnarray}$$
Here, the values of
 $\unicode[STIX]{x1D705}=0.45$
,
$\unicode[STIX]{x1D705}=0.45$
,
 $y_{buf}^{+}=41$
,
$y_{buf}^{+}=41$
,
 $\unicode[STIX]{x1D705}_{11}=1.02$
,
$\unicode[STIX]{x1D705}_{11}=1.02$
,
 $c^{\prime }=1.72$
,
$c^{\prime }=1.72$
,
 $\unicode[STIX]{x1D6FE}_{b}=0.05$
and
$\unicode[STIX]{x1D6FE}_{b}=0.05$
and
 $\unicode[STIX]{x1D6FE}_{m}=-0.09$
are used.
$\unicode[STIX]{x1D6FE}_{m}=-0.09$
are used.
(a) EXP pipe data (Hultmark et al.
Reference Hultmark, Vallikivi, Bailey and Smits2012) denoted by symbols compared with (6.19) denoted by solid lines for
 $Re_{\unicode[STIX]{x1D70F}}=10\,481$
(downward triangle), 37 450 (leftward triangle) and 98 187 (square) – showing good agreement. Our log profile
$Re_{\unicode[STIX]{x1D70F}}=10\,481$
(downward triangle), 37 450 (leftward triangle) and 98 187 (square) – showing good agreement. Our log profile
 $W_{11}^{+}=-1.25\ln (y^{+}/Re_{\unicode[STIX]{x1D70F}})+1.63$
from (6.17) is marked in dash-dotted line. Also included are predictions for
$W_{11}^{+}=-1.25\ln (y^{+}/Re_{\unicode[STIX]{x1D70F}})+1.63$
from (6.17) is marked in dash-dotted line. Also included are predictions for
 $Re_{\unicode[STIX]{x1D70F}}=3\times 10^{5}$
and
$Re_{\unicode[STIX]{x1D70F}}=3\times 10^{5}$
and
 $10^{6}$
, awaiting future data for validation. (b) The logarithmic diagnostic function
$10^{6}$
, awaiting future data for validation. (b) The logarithmic diagnostic function
 $\unicode[STIX]{x1D6E4}_{11}=-yd_{y}W_{11}^{+}$
for data (symbol) and using (6.19) (solid line) showing good agreement in the entire flow domain. The dashed line marks the log profile slope
$\unicode[STIX]{x1D6E4}_{11}=-yd_{y}W_{11}^{+}$
for data (symbol) and using (6.19) (solid line) showing good agreement in the entire flow domain. The dashed line marks the log profile slope
 $-1.25$
given in (6.17); also included is the prediction of
$-1.25$
given in (6.17); also included is the prediction of
 $\unicode[STIX]{x1D6E4}_{11}$
at
$\unicode[STIX]{x1D6E4}_{11}$
at
 $Re_{\unicode[STIX]{x1D70F}}=3\times 10^{5}$
.
$Re_{\unicode[STIX]{x1D70F}}=3\times 10^{5}$
.

Substituting (6.20b
) into (6.18) and hence (6.19), the resulting
 $W_{11}^{+}$
profiles are shown in figure 12(a), in good agreement with data for the entire flow domain with a departure less than 1. Predictions for two larger
$W_{11}^{+}$
profiles are shown in figure 12(a), in good agreement with data for the entire flow domain with a departure less than 1. Predictions for two larger
 $Re$
values at
$Re$
values at
 $Re_{\unicode[STIX]{x1D70F}}=3\times 10^{5}$
and
$Re_{\unicode[STIX]{x1D70F}}=3\times 10^{5}$
and
 $10^{6}$
are also plotted in the figure, awaiting future measurement for validation. The diagnostic function
$10^{6}$
are also plotted in the figure, awaiting future measurement for validation. The diagnostic function
 $\unicode[STIX]{x1D6E4}_{11}$
for the entire flow domain is also calculated from data and from (6.19), as shown in figure 12(b); the plateau value of the data in the bulk flow is well represented by
$\unicode[STIX]{x1D6E4}_{11}$
for the entire flow domain is also calculated from data and from (6.19), as shown in figure 12(b); the plateau value of the data in the bulk flow is well represented by
 $\unicode[STIX]{x1D6E4}_{min}=1.25$
in (6.16a
). That is why the log profile with
$\unicode[STIX]{x1D6E4}_{min}=1.25$
in (6.16a
). That is why the log profile with
 $A_{11}=1.25$
and
$A_{11}=1.25$
and
 $B_{11}=1.63$
agrees well with the data in figure 12(a).
$B_{11}=1.63$
agrees well with the data in figure 12(a).
 $W_{11}^{+}$
obtained by anomalous scaling modification compared with data of (a) DNS (each profile has been vertically shifted by one unit for better display) and (b) Princeton pipe experiment (EXP) (Hultmark et al.
Reference Hultmark, Vallikivi, Bailey and Smits2012). The departure between data and our theory is shown in (c) (for DNS) and (d) (for EXP) – all bounded within
$W_{11}^{+}$
obtained by anomalous scaling modification compared with data of (a) DNS (each profile has been vertically shifted by one unit for better display) and (b) Princeton pipe experiment (EXP) (Hultmark et al.
Reference Hultmark, Vallikivi, Bailey and Smits2012). The departure between data and our theory is shown in (c) (for DNS) and (d) (for EXP) – all bounded within
 $\pm 1$
. In addition to the DNS channel data in figure 2, DNS pipe data are also included in (a,c) at
$\pm 1$
. In addition to the DNS channel data in figure 2, DNS pipe data are also included in (a,c) at
 $Re_{\unicode[STIX]{x1D70F}}=1142$
by Wu & Moin (Reference Wu and Moin2008) (diamonds) and at
$Re_{\unicode[STIX]{x1D70F}}=1142$
by Wu & Moin (Reference Wu and Moin2008) (diamonds) and at
 $Re_{\unicode[STIX]{x1D70F}}=3008$
by Ahn et al. (Reference Ahn, Lee, Lee, Kang and Sung2015) (leftward triangles).
$Re_{\unicode[STIX]{x1D70F}}=3008$
by Ahn et al. (Reference Ahn, Lee, Lee, Kang and Sung2015) (leftward triangles).

It is interesting to observe that for the two larger
 $Re$
values (
$Re$
values (
 $Re_{\unicode[STIX]{x1D70F}}=3\times 10^{5}$
and
$Re_{\unicode[STIX]{x1D70F}}=3\times 10^{5}$
and
 $10^{6}$
), a more extended logarithmic scaling is predicted by (6.18), and hence (6.19). This is in sharp contrast to the power-law formula by Barenblatt (Reference Barenblatt1993) and Barenblatt & Chorin (Reference Barenblatt and Chorin2004), where their power-law asymptotes to a log law due to a decreasing scaling exponent with increasing
$10^{6}$
), a more extended logarithmic scaling is predicted by (6.18), and hence (6.19). This is in sharp contrast to the power-law formula by Barenblatt (Reference Barenblatt1993) and Barenblatt & Chorin (Reference Barenblatt and Chorin2004), where their power-law asymptotes to a log law due to a decreasing scaling exponent with increasing
 $Re$
. Here, (6.18) predicts the (approximate) log profile for
$Re$
. Here, (6.18) predicts the (approximate) log profile for
 $W_{11}^{+}$
based on three
$W_{11}^{+}$
based on three
 $Re$
-invariant parameters, i.e.
$Re$
-invariant parameters, i.e.
 $c^{\prime }=1.72$
,
$c^{\prime }=1.72$
,
 $\unicode[STIX]{x1D6FE}_{b}=0.05$
and
$\unicode[STIX]{x1D6FE}_{b}=0.05$
and
 $\unicode[STIX]{x1D6FE}_{m}=-0.09$
. Moreover, equation (6.18) extends the log law to the centreline and to the wall, considerably beyond the previous scaling theories valid for a limited flow domain, hence showing the superiority of (6.18).
$\unicode[STIX]{x1D6FE}_{m}=-0.09$
. Moreover, equation (6.18) extends the log law to the centreline and to the wall, considerably beyond the previous scaling theories valid for a limited flow domain, hence showing the superiority of (6.18).
For small
 $Re$
values, using
$Re$
values, using
 $\unicode[STIX]{x1D705}_{11}$
in figure 10(a) and
$\unicode[STIX]{x1D705}_{11}$
in figure 10(a) and
 $y_{B}^{+}$
in (6.20b
), the resulting
$y_{B}^{+}$
in (6.20b
), the resulting
 $W_{11}^{+}$
profiles by (6.19) are shown in figure 13. Note that in this figure,
$W_{11}^{+}$
profiles by (6.19) are shown in figure 13. Note that in this figure,
 $Re_{\unicode[STIX]{x1D70F}}$
covers over two decades from 650 to 98 187. Compared to the canonical descriptions (figure 9
b), the modified
$Re_{\unicode[STIX]{x1D70F}}$
covers over two decades from 650 to 98 187. Compared to the canonical descriptions (figure 9
b), the modified
 $W_{11}^{+}$
profiles agree much better with data (figure 13
a), although there is a slight mismatch in the buffer layer for small
$W_{11}^{+}$
profiles agree much better with data (figure 13
a), although there is a slight mismatch in the buffer layer for small
 $Re$
(figure 13
c). The agreement can be improved by slightly varying
$Re$
(figure 13
c). The agreement can be improved by slightly varying
 $\unicode[STIX]{x1D6FE}_{m}$
(from
$\unicode[STIX]{x1D6FE}_{m}$
(from
 $-0.09$
to
$-0.09$
to
 $-0.07$
). However, to limit the scope and the size of the paper, a detailed discussion of the finite
$-0.07$
). However, to limit the scope and the size of the paper, a detailed discussion of the finite
 $Re$
-dependence of the parameters is not considered. Still, the improvement indicates that the anomalous scaling modification, although inspired from large-
$Re$
-dependence of the parameters is not considered. Still, the improvement indicates that the anomalous scaling modification, although inspired from large-
 $Re$
data, also applies to moderate
$Re$
data, also applies to moderate
 $Re$
. The underpinning physics for the successful modifications of small-
$Re$
. The underpinning physics for the successful modifications of small-
 $Re$
profiles need further studies.
$Re$
profiles need further studies.
Remember that (6.13b
) predicts that the outer peak will exceed 9.2 (the presumed saturated inner peak value) at
 $Re_{\unicode[STIX]{x1D70F}}\approx 5.5\times 10^{5}$
. According to (6.20b
),
$Re_{\unicode[STIX]{x1D70F}}\approx 5.5\times 10^{5}$
. According to (6.20b
),
 $y_{B}^{+}$
decreases from approximately 41 to 31 for
$y_{B}^{+}$
decreases from approximately 41 to 31 for
 $Re_{\unicode[STIX]{x1D70F}}$
varying from
$Re_{\unicode[STIX]{x1D70F}}$
varying from
 $10^{2}$
to
$10^{2}$
to
 $10^{5}$
, and
$10^{5}$
, and
 $y_{B}^{+}\approx 29$
at
$y_{B}^{+}\approx 29$
at
 $Re_{\unicode[STIX]{x1D70F}}=5.5\times 10^{5}$
. For
$Re_{\unicode[STIX]{x1D70F}}=5.5\times 10^{5}$
. For
 $Re\rightarrow \infty$
, equation (6.20b
) indicates that
$Re\rightarrow \infty$
, equation (6.20b
) indicates that
 $y_{B}^{+}\rightarrow 0$
, which seems to be questionable since
$y_{B}^{+}\rightarrow 0$
, which seems to be questionable since
 $y_{B}^{+}$
should saturate to a non-zero value larger than
$y_{B}^{+}$
should saturate to a non-zero value larger than
 $y_{sub}^{+}=9.7$
(i.e. above the sublayer thickness). In fact, a non-zero
$y_{sub}^{+}=9.7$
(i.e. above the sublayer thickness). In fact, a non-zero
 $y_{B}^{+}$
as
$y_{B}^{+}$
as
 $Re_{\unicode[STIX]{x1D70F}}\rightarrow \infty$
indicates that
$Re_{\unicode[STIX]{x1D70F}}\rightarrow \infty$
indicates that
 $\unicode[STIX]{x1D6FE}_{b}+\unicode[STIX]{x1D6FE}_{m}\rightarrow 0$
. However,
$\unicode[STIX]{x1D6FE}_{b}+\unicode[STIX]{x1D6FE}_{m}\rightarrow 0$
. However,
 $y_{B}^{+}$
decays very slowly with
$y_{B}^{+}$
decays very slowly with
 $Re$
, and it is not until
$Re$
, and it is not until
 $Re_{\unicode[STIX]{x1D70F}}>10^{20}$
that
$Re_{\unicode[STIX]{x1D70F}}>10^{20}$
that
 $y_{B}^{+}$
becomes smaller than
$y_{B}^{+}$
becomes smaller than
 $y_{sub}^{+}$
– extremely far away from today’s experiments and simulations. Thus, to re-emphasize, equation (6.20b
) is quite robust for finite
$y_{sub}^{+}$
– extremely far away from today’s experiments and simulations. Thus, to re-emphasize, equation (6.20b
) is quite robust for finite
 $Re$
.
$Re$
.
7 Summary
The symmetry approach developed in Part 1 (She et al.
Reference She, Chen and Hussain2017) for the mean velocity profiles is extended here to quantify the (second-order) Reynolds stress tensor in channel and pipe flows. The canonical four-layer description of the Reynolds shear stress length
 $\ell _{12}$
is extended to similarly obtain those of the three other lengths,
$\ell _{12}$
is extended to similarly obtain those of the three other lengths,
 $\ell _{11}$
,
$\ell _{11}$
,
 $\ell _{22}$
and
$\ell _{22}$
and
 $\ell _{33}$
. Among these length functions, the layer thicknesses are found to be the same (except
$\ell _{33}$
. Among these length functions, the layer thicknesses are found to be the same (except
 $r_{22core}$
is 10 % larger than
$r_{22core}$
is 10 % larger than
 $r_{core}$
), while the scaling exponents are different due to different wall and centreline asymptotes, owing to different symmetries under dilations.
$r_{core}$
), while the scaling exponents are different due to different wall and centreline asymptotes, owing to different symmetries under dilations.
 $W_{12}^{+}$
and
$W_{12}^{+}$
and
 $W_{22}^{+}$
(active motions) agree well with the canonical descriptions; for
$W_{22}^{+}$
(active motions) agree well with the canonical descriptions; for
 $W_{11}^{+}$
and
$W_{11}^{+}$
and
 $W_{33}^{+}$
(inactive motions), small anomalous modifications yield more refined results, representing the effect of symmetry breaking, whose dynamic mechanism will be an intriguing topic for further study.
$W_{33}^{+}$
(inactive motions), small anomalous modifications yield more refined results, representing the effect of symmetry breaking, whose dynamic mechanism will be an intriguing topic for further study.
Let us summarize all parameters describing the multilayer structure of wall turbulence in channel and pipe flows: three layer-thickness parameters characterizing the canonical four-layers structure (
 $y_{sub}^{+}=9.7$
,
$y_{sub}^{+}=9.7$
,
 $y_{buf}^{+}=41$
,
$y_{buf}^{+}=41$
,
 $r_{core}=0.27$
, with slight modification of the last one –
$r_{core}=0.27$
, with slight modification of the last one –
 $r_{22core}=0.3$
for
$r_{22core}=0.3$
for
 $\ell _{22}$
); four proportionality coefficients (
$\ell _{22}$
); four proportionality coefficients (
 $\unicode[STIX]{x1D705}=0.45$
for
$\unicode[STIX]{x1D705}=0.45$
for
 $\ell _{12}$
;
$\ell _{12}$
;
 $\unicode[STIX]{x1D705}_{11}=1.02$
(for high
$\unicode[STIX]{x1D705}_{11}=1.02$
(for high
 $Re$
),
$Re$
),
 $\unicode[STIX]{x1D705}_{22}=0.52$
,
$\unicode[STIX]{x1D705}_{22}=0.52$
,
 $\unicode[STIX]{x1D705}_{33}^{\prime }=0.43$
for
$\unicode[STIX]{x1D705}_{33}^{\prime }=0.43$
for
 $\ell _{11}$
,
$\ell _{11}$
,
 $\ell _{22}$
and
$\ell _{22}$
and
 $\ell _{33}$
, respectively); three anomalous scaling exponents (
$\ell _{33}$
, respectively); three anomalous scaling exponents (
 $\unicode[STIX]{x1D6FE}=0.07$
for
$\unicode[STIX]{x1D6FE}=0.07$
for
 $\ell _{33}$
,
$\ell _{33}$
,
 $\unicode[STIX]{x1D6FE}_{b}=0.05$
and
$\unicode[STIX]{x1D6FE}_{b}=0.05$
and
 $\unicode[STIX]{x1D6FE}_{m}=-0.09$
for
$\unicode[STIX]{x1D6FE}_{m}=-0.09$
for
 $\ell _{11}$
); and finally a coefficient
$\ell _{11}$
); and finally a coefficient
 $c^{\prime }=1.72$
related to the outer peak of
$c^{\prime }=1.72$
related to the outer peak of
 $W_{11}^{+}$
. These parameters completely quantify the multilayer structures of the mean velocity, Reynolds shear stress and three turbulence intensities (including their
$W_{11}^{+}$
. These parameters completely quantify the multilayer structures of the mean velocity, Reynolds shear stress and three turbulence intensities (including their
 $Re$
-scalings and
$Re$
-scalings and
 $y$
-scalings), and each of these parameters is directly and independently measured from data. It would be interesting to test whether they remain invariant at higher
$y$
-scalings), and each of these parameters is directly and independently measured from data. It would be interesting to test whether they remain invariant at higher
 $Re$
.
$Re$
.
Using the above parameters, we theoretically obtain following results, agreeing well with data:
(i) the maximum turbulent production is located at
$y^{+}\approx 12$
;(ii) the location of peak value
$W_{12}^{+}$
has a scaling transition from
$5.7Re_{\unicode[STIX]{x1D70F}}^{1/3}$
to
$1.5Re_{\unicode[STIX]{x1D70F}}^{1/2}$
at
$Re_{\unicode[STIX]{x1D70F}}\approx 3000$
, with the peak magnitude
$1-W_{12p}^{+}$
having a scaling transition from
$8.5Re_{\unicode[STIX]{x1D70F}}^{-2/3}$
to
$3.0Re_{\unicode[STIX]{x1D70F}}^{-1/2}$
;(iii) the peak value
$W_{33p}^{+}\approx 0.84Re_{\unicode[STIX]{x1D70F}}^{0.14}(1-48/Re_{\unicode[STIX]{x1D70F}})$
;(iv) the outer peak of
$W_{11}^{+}$
emerges above
$Re_{\unicode[STIX]{x1D70F}}\approx 10^{4}$
with its location scaling as
$1.1Re_{\unicode[STIX]{x1D70F}}^{1/2}$
and its magnitude scaling as
$2.8Re_{\unicode[STIX]{x1D70F}}^{0.09}$
;(v) alternative derivations of Townsend’s log profiles for inactive motions in the bulk, viz.,
$\overline{u^{\prime }u^{\prime }}^{+}\approx -1.25\ln y+1.63$
and
$\overline{w^{\prime }w^{\prime }}^{+}\approx -0.41\ln y+1.00$
.


The above results obtained from the concise four-layers structure, albeit slight modifications for inactive motions, demonstrate that (Reynolds stress) lengths are the desired similarity variables for quantifying wall turbulence. The reason why these lengths are assumed to have local dilation invariants is that they are believed to characterize spatial scales of (statistical) eddies of wall turbulence. According to structural ensemble dynamics (SED) in Part 1, these lengths are examples to represent the ensemble property of the flows, which are constrained by the wall and obey the dilation invariance ansatze postulated in Part 1. In other words, within each layer, eddies’ scales are related by the simple power law (following the first or the second ansatz); and across different layers, eddies’ scales obey the generalized power law (following the third ansatz). The good agreement between data and the multilayer descriptions illustrates that different components of Reynolds stresses are indeed organized into a self-similar family. Note that in contrast to the wall-attached hypothesis by (Townsend Reference Townsend1976) (mainly for the log layer), the current work provides a framework to define a family of eddies in the entire flow domain. The eddies’ scales characterized by the lengths enable the quantification of mean distributions (e.g. mean velocity, fluctuation intensities), where more refined descriptions (such as anomalous scaling modifications of
 $\ell _{11}$
and
$\ell _{11}$
and
 $\ell _{33}$
) can be pursued further.
$\ell _{33}$
) can be pursued further.
Finally, owing to the universal nature of wall dilation symmetry, the analysis is applicable to many other wall flows with different flow conditions, such as incompressible (Wu et al. Reference Wu, Chen, She and Hussain2013; Chen & She Reference Chen and She2016) and compressible TBL (She et al. Reference She, Chen, Wu and Hussain2010; Zhang et al. Reference Zhang, Bi, Hussain, Li and She2012; Wu et al. Reference Wu, Bi, Hussain and She2017), roughness effects (She et al. Reference She, Wu, Chen and Hussain2012), with and without mild pressure gradients, and turbulent Rayleigh–Bénard convection (to be communicated soon). The results have also been extended to improve turbulent engineering models (Chen et al. Reference Chen, Wei, Hussain and She2015, Reference Chen, Hussain and She2016a ). Note that the random dilation analysis on (approximate) balance equations, which take different forms in different layers, also can be applied to study the scalings of high-order correlations.
Acknowledgements
The authors thank C. E. Willert for sharing the CICLoPE data with us. This work is initially supported by the MOST 973 project 2009CB724100 of China, and then by National Nature Science Foundation of China with nos. 11452002, 11221062.
Appendix A. Matching procedure
The matching procedure developed in Part 1 is summarized here. Suppose we have two different power laws for two adjacent layers, for example,
 $\ell ^{(I)}=c_{I}y^{\unicode[STIX]{x1D6FE}_{I}}$
(layer I) and
$\ell ^{(I)}=c_{I}y^{\unicode[STIX]{x1D6FE}_{I}}$
(layer I) and
 $\ell ^{(II)}=c_{II}y^{\unicode[STIX]{x1D6FE}_{II}}$
(layer II). Recall the third ansatz in Part 1 composed of the two invariants
$\ell ^{(II)}=c_{II}y^{\unicode[STIX]{x1D6FE}_{II}}$
(layer II). Recall the third ansatz in Part 1 composed of the two invariants
 $I_{1}$
and
$I_{1}$
and
 $I_{2}$
, i.e.
$I_{2}$
, i.e.
 $$\begin{eqnarray}I_{2}=\unicode[STIX]{x1D6FE}_{I}I_{1}+c(I_{1})^{n},\end{eqnarray}$$
where
 $\unicode[STIX]{x1D6FE}_{I}$
,
$\unicode[STIX]{x1D6FE}_{I}$
,
 $c$
and
$c$
and
 $n$
are all constants. Substituting the definitions
$n$
are all constants. Substituting the definitions
 $I_{1}=\ell /y^{\unicode[STIX]{x1D6FE}_{II}}$
and
$I_{1}=\ell /y^{\unicode[STIX]{x1D6FE}_{II}}$
and
 $I_{2}=(\text{d}\ell /\text{d}y)/y^{\unicode[STIX]{x1D6FE}_{II}-1}$
obtained from the dilations in the layer II into (A 1), and integrating the subsequent equation with respect to
$I_{2}=(\text{d}\ell /\text{d}y)/y^{\unicode[STIX]{x1D6FE}_{II}-1}$
obtained from the dilations in the layer II into (A 1), and integrating the subsequent equation with respect to
 $y$
, we obtain the following general scaling transition:
$y$
, we obtain the following general scaling transition:
 $$\begin{eqnarray}\ell =c_{I}y^{\unicode[STIX]{x1D6FE}_{I}}(1+(y/y_{c})^{p})^{(\unicode[STIX]{x1D6FE}_{II}-\unicode[STIX]{x1D6FE}_{I})/p},\end{eqnarray}$$
where
 $y_{c}=(c_{I}^{}/c_{II})^{1/(\unicode[STIX]{x1D6FE}_{II}-\unicode[STIX]{x1D6FE}_{I})}$
is the cross
$y_{c}=(c_{I}^{}/c_{II})^{1/(\unicode[STIX]{x1D6FE}_{II}-\unicode[STIX]{x1D6FE}_{I})}$
is the cross
 $y$
-location satisfying
$y$
-location satisfying
 $\ell ^{(I)}=\ell ^{(II)}$
, and the transition sharpness
$\ell ^{(I)}=\ell ^{(II)}$
, and the transition sharpness
 $p=(1-n)(\unicode[STIX]{x1D6FE}_{II}-\unicode[STIX]{x1D6FE}_{I})$
; note that
$p=(1-n)(\unicode[STIX]{x1D6FE}_{II}-\unicode[STIX]{x1D6FE}_{I})$
; note that
 $\ell$
represents any of
$\ell$
represents any of
 $\ell _{11}$
,
$\ell _{11}$
,
 $\ell _{12}$
,
$\ell _{12}$
,
 $\ell _{22}$
and
$\ell _{22}$
and
 $\ell _{33}$
. It can be checked that (A 2) smoothly connects the above two adjacent power laws together.
$\ell _{33}$
. It can be checked that (A 2) smoothly connects the above two adjacent power laws together.
Now we use the above ansatz to obtain the multilayer formulae of the stress length functions. Let us take
 $\ell _{22}$
as an example to show how the composite formula is obtained (note that
$\ell _{22}$
as an example to show how the composite formula is obtained (note that
 $\ell _{12}$
has been obtained in Part 1). First, we apply (A 1) and (A 2) for
$\ell _{12}$
has been obtained in Part 1). First, we apply (A 1) and (A 2) for
 $\ell _{22}$
in the viscous sublayer and buffer layer. For this case,
$\ell _{22}$
in the viscous sublayer and buffer layer. For this case,
 $\ell _{22}^{(I)}=I_{1}^{sub}y^{+2}$
representing the power law for the sublayer, and
$\ell _{22}^{(I)}=I_{1}^{sub}y^{+2}$
representing the power law for the sublayer, and
 $\ell _{22}^{(II)}=I_{1}^{buf}y^{+5/2}$
for the buffer layer. Substituting
$\ell _{22}^{(II)}=I_{1}^{buf}y^{+5/2}$
for the buffer layer. Substituting
 $\ell _{22}$
into (A 1) and carrying out the integration to (A 2) we obtain
$\ell _{22}$
into (A 1) and carrying out the integration to (A 2) we obtain
 $$\begin{eqnarray}\ell _{22}^{+(sub-buf)}=I_{1}^{sub}y^{+2}\left(1+\left(\frac{y^{+}}{y_{sub}^{+}}\right)^{p}\right)^{1/2p}=c_{22}^{\prime }y^{+2}\left(1+\left(\frac{y^{+}}{y_{sub}^{+}}\right)^{4}\right)^{1/8},\end{eqnarray}$$
where
 $y_{sub}^{+}=(I_{1}^{sub}/I_{1}^{buf})^{2}$
is the cross
$y_{sub}^{+}=(I_{1}^{sub}/I_{1}^{buf})^{2}$
is the cross
 $y^{+}$
-location for the two layers,
$y^{+}$
-location for the two layers,
 $c_{22}^{\prime }=I_{1}^{sub}$
is the proportionality coefficient, and the transition sharpness
$c_{22}^{\prime }=I_{1}^{sub}$
is the proportionality coefficient, and the transition sharpness
 $p=4$
is the same as in Part 1.
$p=4$
is the same as in Part 1.
Then, for buffer and log layers,
 $\ell _{22}^{(I)}=I_{1}^{buf}y^{+5/2}$
and
$\ell _{22}^{(I)}=I_{1}^{buf}y^{+5/2}$
and
 $\ell _{22}^{(II)}=I_{1}^{log}y^{+}$
(
$\ell _{22}^{(II)}=I_{1}^{log}y^{+}$
(
 $=\unicode[STIX]{x1D705}_{22}y^{+}$
). Repeating the above derivation procedure, we obtain the scaling transition from buffer to log layers:
$=\unicode[STIX]{x1D705}_{22}y^{+}$
). Repeating the above derivation procedure, we obtain the scaling transition from buffer to log layers:
 $$\begin{eqnarray}\ell _{22}^{+(buf-log)}=I_{1}^{buf}y_{}^{+5/2}\left(1+\left(\frac{y^{+}}{y_{buf}^{+}}\right)^{4}\right)^{-3/8},\end{eqnarray}$$
where
 $y_{buf}^{+}=(I_{1}^{\log }/I_{1}^{buf})^{2/3}$
.
$y_{buf}^{+}=(I_{1}^{\log }/I_{1}^{buf})^{2/3}$
.
Further, using the following multiplicative rule (Van Dyke Reference Van Dyke1964), i.e.
 $$\begin{eqnarray}\unicode[STIX]{x1D719}^{I-III}=\unicode[STIX]{x1D719}^{I-II}\unicode[STIX]{x1D719}^{II-III}/\unicode[STIX]{x1D719}^{Common},\end{eqnarray}$$
which corresponds to
 $$\begin{eqnarray}\ell _{22}^{+Inner}=\ell _{22}^{+(sub-buf)}\ell _{22}^{+(buf-log)}/(I_{1}^{buf}y^{+5/2}),\end{eqnarray}$$
we thus obtain the following composite profile for the inner three layers:
 $$\begin{eqnarray}\ell _{22}^{+Inner}=c_{22}^{\prime }y^{+2}\left(1+\left(\frac{y^{+}}{y_{sub}^{+}}\right)^{4}\right)^{1/8}\left(1+\left(\frac{y^{+}}{y_{buf}^{+}}\right)^{4}\right)^{-3/8}.\end{eqnarray}$$
Similarly, for the outer flow, we have the composite profile connecting the bulk layer and core layer together:
 $$\begin{eqnarray}\ell _{22}^{+Outer}=\frac{\unicode[STIX]{x1D705}_{22}Re_{\unicode[STIX]{x1D70F}}}{4Z_{c}^{\prime }}(1-r^{4})\left(1+\left(\frac{r_{core}}{r}\right)^{2}\right)^{1/2},\end{eqnarray}$$
where
 $Z_{c}^{\prime }=\sqrt{1+r_{core}^{2}}$
. Applying the multiplicative rule (A 5) again for (A 7) and (A 8), with the common state
$Z_{c}^{\prime }=\sqrt{1+r_{core}^{2}}$
. Applying the multiplicative rule (A 5) again for (A 7) and (A 8), with the common state
 $\ell _{22}^{+Common}=\unicode[STIX]{x1D705}_{22}y^{+}=\unicode[STIX]{x1D705}_{22}Re_{\unicode[STIX]{x1D70F}}(1-r)$
, we thus obtain (2.31)
$\ell _{22}^{+Common}=\unicode[STIX]{x1D705}_{22}y^{+}=\unicode[STIX]{x1D705}_{22}Re_{\unicode[STIX]{x1D70F}}(1-r)$
, we thus obtain (2.31)
 $$\begin{eqnarray}\displaystyle \ell _{22}^{+} & = & \displaystyle \ell _{22}^{+Inner}\ell _{22}^{+Outer}/\ell _{22}^{+Common}\nonumber\\ \displaystyle & = & \displaystyle c_{22}y^{+2}\left(1+\left(\frac{y^{+}}{y_{sub}^{+}}\right)^{4}\right)^{1/8}\left(1+\left(\frac{y^{+}}{y_{buf}^{+}}\right)^{4}\right)^{-3/8}\frac{1-r^{4}}{4(1-r)}\left(1+\left(\frac{r_{core}}{r}\right)^{2}\right)^{1/2}.\nonumber\\ \displaystyle & & \displaystyle\end{eqnarray}$$
Note that
 $c_{22}=c_{22}^{\prime }/Z_{c}^{\prime }$
has been substituted in (A 9). Therefore, by the same procedure developed in Part 1, we obtain the four-layer formula for
$c_{22}=c_{22}^{\prime }/Z_{c}^{\prime }$
has been substituted in (A 9). Therefore, by the same procedure developed in Part 1, we obtain the four-layer formula for
 $\ell _{22}$
. This procedure can be similarly applied for
$\ell _{22}$
. This procedure can be similarly applied for
 $\ell _{11}$
and
$\ell _{11}$
and
 $\ell _{33}$
to yield (2.32) and (2.37).
$\ell _{33}$
to yield (2.32) and (2.37).


 Open access