

Physical fitness in childhood and adolescence is currently considered a strong predictor of health at these ages( Reference Ortega, Ruiz and Castillo 1 ) and later in life( Reference Ruiz, Castro-Piñero and Artero 2 ). Physical fitness is usually defined as a set of attributes that people have or achieve that relates to the ability to perform physical activity. This set of attributes refers to the components of physical fitness, which are cardiorespiratory fitness, muscular strength, speed agility and flexibility( Reference Ruiz, Castro-Pinero and Espana-Romero 3 ). Although all of these components are consistently shown to be associated with several health outcomes (such as lower total and central adiposity, lower levels of traditional and emerging CVD risk factors, better bone health, less fatigue and better quality of life in cancer survivors, and better mental health, particularly depression, anxiety, mood status and self-esteem)( Reference Ortega, Ruiz and Castillo 1 ), information about their relationship with cognition and brain is scarce. In depth understanding of the relationship between physical fitness and brain in young ages might have important implications, as physical fitness is a factor that can be modified by physical exercise programmes, which could aim to have a positive effect not only on physical health but also on cognition and brain.
Several authors have recently reviewed the literature on this novel topic and summarised what is currently known about physical fitness and brain in young people( Reference Voelcker-Rehage and Niemann 4 – Reference Khan and Hillman 6 ). It has been suggested that higher levels of cardiorespiratory fitness could be related to brain both at a functional and at a structural level. To the best of our knowledge, only two studies (three articles) conducted by Chaddock et al.( Reference Chaddock, Erickson and Prakash 7 – Reference Chaddock, Hillman and Pontifex 9 ) have explored the associations of cardiorespiratory fitness with brain structures in children and none has been carried out in adolescents. The authors observed that pre-adolescent children with high levels of cardiorespiratory fitness had a larger volume of the hippocampus( Reference Chaddock, Erickson and Prakash 7 ) and basal ganglia, particularly putamen and globus pallidus volumes( Reference Chaddock, Erickson and Prakash 8 , Reference Chaddock, Hillman and Pontifex 9 ). They did not find associations between fitness and whole-brain size (i.e. total grey matter (GM) and/or white matter (WM) volumes), suggesting that the effect of cardiorespiratory fitness on brain structures seems to be very specific. In agreement with animal studies, this effect could mainly take place in brain regions in charge of executive control processes (which include scheduling, planning, working or relational memory, multitasking and dealing with ambiguity)( Reference Hillman, Erickson and Kramer 10 ). In spite of the major contributions made by these pioneering studies, many questions remain to be answered in this novel and emerging field.
As mentioned above, previous studies in children have focused on volumetric measurements of the subcortical regions of the brain (i.e. hippocampus and basal ganglia)( Reference Chaddock, Erickson and Prakash 7 – Reference Chaddock, Hillman and Pontifex 9 ). However, although useful, the volume of a subcortical nucleus is a somewhat crude way of summarising the features of these nuclei and evaluate the potential effects of variables such fitness components. Volume analysis provides information on global changes in the structure, but cannot provide information on regional or local enlargements/contractions. Shape analysis is a sensitive method to detect small changes in brain morphology. Shape is considered as an index of neural development( Reference Sampaio, Bouix and Sousa 11 ), it is related to cognitive performance( Reference Lim, Hong and Jung 12 – Reference Sandman, Head and Muftuler 15 ) and its study in relation to fitness would provide new insights into this field. Similarly, as previous studies have focused only on cardiorespiratory fitness, there is a need for better understanding how other physical fitness components such as muscular strength or speed agility relate to brain structures. The present study aimed to examine the association of the main health-related physical fitness components (i.e. cardiorespiratory fitness, muscular strength and speed agility) with the shapes of subcortical brain structures in a sample of pre-adolescents. As previous studies in children have shown that better cardiorespiratory fitness is associated with larger volumes of subcortical brain regions( Reference Chaddock, Erickson and Prakash 7 – Reference Chaddock, Hillman and Pontifex 9 ), we hypothesised that better cardiorespiratory fitness and perhaps other fitness components also might be associated with the shape of the subcortical nuclei. On the other hand, as this is, to the best of our knowledge, the first study examining the potential link between fitness and shapes of subcortical brains structures either in children or in adults, our study is at the same time explorative and hypothesis generating.
Methods
Study design and sample
This study is a part of a European project called NUHEAL (NUtraceuticals for a HEALthier life; registration no. NCT01180933). The detailed study design, subject recruitment and characteristics, inclusion criteria and outcome measurements have been described previously( Reference Decsi, Campoy and Koletzko 16 – Reference Krauss-Etschmann, Shadid and Campoy 18 ). In brief, pregnant women attending antenatal care clinics for ultrasound examination between gestation weeks 12 and 20 were approached by study our personnel and invited to participate. A total of 315 women from Granada (Spain), Munich (Germany) and Pecs (Hungary) agreed to participate in this study. We do not have data on women who did not agree to participate in the study, and therefore non-response analyses were not conducted. The NUHEAL project is a randomised-controlled trial in which healthy pregnant women were randomly allocated to one of the following four treatment groups: (a) fish oil, (b) folic acid, (c) fish oil+folic acid and (d) placebo. The four groups received their respective supplementations during the second half of pregnancy with the aim to assess the effect of folate and fish oil intake during pregnancy on infant outcomes. Out of the 315 women who agreed to participate in the study, 243 provided maternal blood samples at delivery, and cord blood samples were obtained from 220 cases. The reasons for dropping out from the study have been reported elsewhere, and it has also been reported that dropouts were distributed equally among the study groups( Reference Decsi, Campoy and Koletzko 16 , Reference Krauss-Etschmann, Shadid and Campoy 18 ).
The present study focused on the cross-sectional outcomes obtained from the Spanish cohort (155 participants with valid data at delivery). These newborns were followed-up up to 9–10 years of age, when the children underwent physical fitness and structural MRI examinations. Owing to practical and funding reasons, these two examinations took place within a separate median period of 11·5 months. However, we controlled for this gap in all the statistical analyses. The analyses for the present study were carried out at a cross-sectional level. As there are fundamental differences in the brain structure depending on which hand is dominant, left-handed and right-handed individuals should not be analysed together. In our study, two children were left-handed, and were therefore excluded from the analyses, as is standard in the literature( Reference Chaddock, Erickson and Prakash 7 – Reference Chaddock, Hillman and Pontifex 9 ). In addition, collected images were visually inspected for quality, and a total of six participants were excluded due to movement artifacts in their MRI images. Finally, a total of forty-four children aged 9·7 (sd 0·2) years had valid data for all physical fitness tests and MRI and were included in the final analyses. These forty-four children came from the original four study groups with a relatively homogeneous distribution among them: fish oil (n 10), folic acid (n 8), fish oil+folic acid (n 10) and placebo (n 16). The supplementation during pregnancy with fish oil and folic acid (separately or in combination) had no effect on the children’s brain measures or fitness; therefore, there was no need to control for the effect of the study groups in our analyses. In addition, we tested whether the forty-four participants in the present study differed from the original sample (n 155) in a number of key variables: age of the mother at gestational week 20, BMI of the mother at delivery, birth weight of the participant and weight or BMI at ages 1·5, 4·0, 6·5, 8·5 and 9·5 years (all P≥0·3). This suggests that the present study sample is representative of the original study sample.
This study was conducted according to the guidelines laid down in the Declaration of Helsinki, and all procedures involving human subjects/patients were approved by the local Ethics Committee of San Cecilio University Clinical Hospital of Granada (Spain). Written (or verbal) informed consent was obtained from all the children’s mothers.
Socio-economic status and birth weight assessment
The Hollingshead Scale (1975) was used to determine the socio-economic status of the children by creating a score from a set of variables: self-reported marital status, self-reported maternal and paternal occupation and self-reported maternal and paternal educational level( Reference Peckins and Susman 19 , Reference Jacobson, Chiodo and Sokol 20 ). Weight at birth was also recorded.
Anthropometric assessment
Weight was measured in underwear and without shoes using an electronic scale (Type SECA 861; Seca GmbH & Co. KG) to the nearest 0·1 kg, and height was measured barefoot by using the Frankfort horizontal plane with a telescopic height-measuring instrument (Type SECA 225; Seca GmbH & Co. KG) to the nearest 0·1 cm. BMI was calculated as body weight in kilograms divided by the square of height in metres.
Physical fitness assessment
The field-based fitness tests used to assess the different health-related physical fitness components studied have been used in previous European projects, i.e. the HELENA (Healthy Lifestyle in Europe by Nutrition in Adolescence) and the ALPHA (Assessing Levels of PHysical Activity and fitness at population level) projects. Detailed data on fitness protocols, operational manual, training workshops and standardised instructions to participants have been published elsewhere( Reference Ortega, Artero and Ruiz 21 , Reference Ortega, Artero and Ruiz 22 ). In brief, cardiorespiratory fitness was assessed by the 20-m shuttle-run test, and VO2max (ml/kg per min) was estimated using the equation reported by Léger et al.( Reference Léger, Mercier and Gadoury 23 ). Muscular fitness was assessed by means of the handgrip strength( Reference Espana-Romero, Artero and Santaliestra-Pasias 24 – Reference Espana-Romero, Ortega and Vicente-Rodriguez 26 ) and standing long-jump( Reference Artero, Espana-Romero and Castro-Pinero 25 , Reference Castro-Pinero, Ortega and Artero 27 ) tests. Speed agility was assessed by the 4×10-m shuttle-run test( Reference Vicente-Rodriguez, Rey-Lopez and Ruiz 28 ). All the tests were performed twice and the best score was retained, except for the 20-m shuttle run test, which was performed only once. These physical fitness tests have been shown to be valid, reliable and related with health in young people( Reference Ruiz, Castro-Pinero and Espana-Romero 3 , Reference Ortega, Artero and Ruiz 21 , Reference Artero, Espana-Romero and Castro-Pinero 29 , Reference Castro-Pinero, Artero and Espana-Romero 30 ).
Images acquisition and processing
High-resolution (0·94×0·94×1 mm) T1-weighted structural brain images were acquired for all participants using a three-dimensional (3D) Magnetization Prepared Rapid Gradient Echo Imaging protocol with 160 contiguous axial slices, collected in ascending fashion parallel to the anterior and posterior commissures (echo time=3·77 ms, repetition time=8·17 ms, field of view=240×240 mm, acquisition matrix=256×256 mm, slice thickness=1 mm and flip angle=8°). All images were collected using a 3T head-only Philips Achieva scanner (© Koninklijke Philips N.V) equipped with a eight-channel phased-array head coil.
Total intracranial volume (TIV) was obtained as the sum of GM, WM and cerebrospinal fluid (CSF). TIV is commonly used to control for local volume variability associated with participants’ size, weight and sex( Reference Raz, Lindenberger and Rodrigue 31 , Reference Lenroot, Gogtay and Greenstein 32 ). We used the DARTEL algorithm implemented in SPM8 (http://www.fil.ion.ucl.ac.uk/spm/) for the segmentation of GM, WM and CSF( Reference Ashburner 33 ). Segmentation of subcortical nuclei and shape analysis were carried out using FSL/FIRST software (http://fsl.fmrib.ox.ac.uk/fsl/fslwiki/FIRST)( Reference Patenaude, Smith and Kennedy 34 ). FIRST is a model-based registration tool that uses a set of fifteen subcortical structures outlined by experts on T1-weighted images obtained from 336 subjects ranging from 4·2 to 72 years, which allow the assessment of changes in typical developing brains. Subcortical nuclei volumes were adjusted using a regression approach: subcortical volume=raw subcortical volume−b (TIV−average TIV), b being the slope of the regression of the subcortical volume on TIV( Reference Kennedy, Erickson and Rodrigue 35 ).
Shape analysis
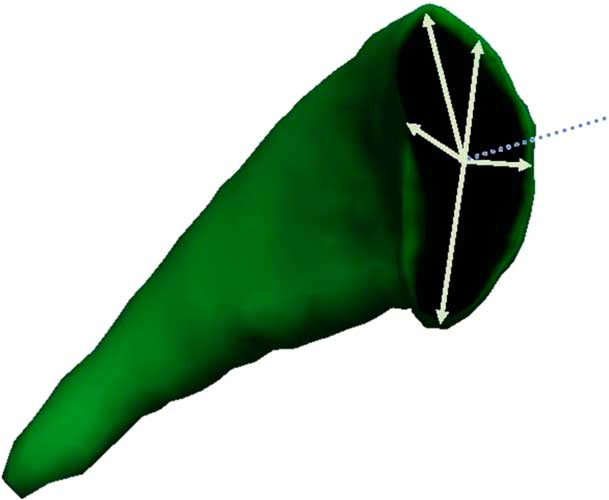
Shape analysis is based on the individual meshes composed by a large number of vertices and triangles. The number of triangles and vertices is the same for each nuclei, allowing the within- and between- subjects comparison of each vertex. These comparisons are possible because all meshes are aligned to the Montreal Neurological Institute space and pose (rotation and translation) is removed( Reference Patenaude, Smith and Kennedy 36 ). Our vertex-wise analysis followed methods described previously( Reference Sandman, Head and Muftuler 15 , Reference Thompson, Hayashi and De Zubicaray 37 ). To assess local changes in each nuclei, we used the radial distance of each vertex to the medial curve of the nuclei (Fig. 1). The medial curve can be thought of as the centroid curve of the nuclei boundary in each section( Reference Thompson, Hayashi and De Zubicaray 37 ) or, similarly, as the skeleton of the 3D structure. Note that the radial distances related each vertex spatial location to the core line of the structure, are objective measures of regional expansion/contraction of the nuclei and are indicators of local changes associated with factors affecting the structure shape. It is important to bear in mind that, although we use throughout the text shape terms such as expansions/contractions or similar terms commonly used in this field (e.g. enlarged/shortened), our study is cross-sectional, and therefore the results cannot be interpreted as changes, but just as the shape of the nuclei at the moment of assessment.
An illustration of radial distances (![]() ) to the medial line (
) to the medial line (![]() ) in a section of the left caudate nucleus. The medial line is independent of the pose of the nucleus.
) in a section of the left caudate nucleus. The medial line is independent of the pose of the nucleus.

Statistical analysis
Correlations between hemispheres were tested in order to decide whether to analyse them separately or together using the average or the sum of them. For the analysis of the relationships of the fitness variables (cardiorespiratory fitness, two tests of muscular strength and speed agility) with the shape of each subcortical nuclei (fourteen nuclei: left and right accumbens, amygdala, caudate, hippocampus, pallidum, putamen and thalamus), we implemented a partial correlation permutation approach. Thus, the correlation between the radial distance of each vertex and each fitness variable was computed after controlling the variance associated with the following set of potential confounders: age at first evaluation visit (i.e. when the MRI scan was performed – namely, MRI age), the time difference between MRI and fitness assessments, sex, socio-economic status of the family, birth weight, BMI and TIV. In order to account for multiple comparisons, we used a t-max approach( Reference Blair and Karniski 38 – Reference Thompson, Hayashi and de Zubicaray 40 ). In short, permutation tests avoid strong assumptions on the distributional features of the variables and compute the empirical distribution of the contrast statistic, by assuming that the outcome–predictor pairs were observed by accident( Reference Nichols and Holmes 41 ). In each simulation run, the largest partial correlation of the whole set of vertices of the nucleus (more than 640) is used to build the empirical distribution of the statistic. Finally, the P value for each vertex is computed as the fraction between the number of accidental partial correlation equal to or greater than that observed in the study and the total number of permutations (10 000 in the present study). We considered significance only when four or more vertices were simultaneously significant at the corrected P level. Results are displayed as colour-coded significance maps. We used dark grey colours to indicate a negative outcome-predictor association (i.e. the higher is the value of the predictor the smaller are radial distances), mid–light grey colours to indicate positive relationships (the higher is the value of the predictor the larger are radial distances) and grey colour to indicate non-significant association. We checked for potential outliers in our analytical sample, as defined by a value beyond 2·5 sd, and we identified no single value over this threshold in the predictors or outcomes. Analyses were run only for subjects with complete valid data on the main predictors (fitness) and outcomes (MRI variables), that is, no imputation method was used.
Results
The sample was aged 9·7 (sd 0·2) years at first assessment (MRI evaluation) and was similarly distributed with regard to sex (i.e. 45·5 % girls). Characteristics of the study sample are shown in Table 1. Volumes (mm3) of the subcortical nuclei and the correlations between hemispheres for each nucleus are displayed in Table 2. Correlations between hemispheres were not very high (although significant) for some of the nuclei, particularly between the two hemispheres of the accumbens, amygdala, hippocampus and pallidum (correlation coefficient ranging from 0·5 to 0·6). On the basis of this, we decided to perform the rest of the analyses separately for the left and right hemispheres.
Descriptive characteristics of the study sample (Mean values and standard deviations)

* The age of children presented in the table is that during the first evaluation visit, that is, the day of the MRI assessment.
† Socio-economic status of the child is a score index based on the Hollingshead Scale (1975), which includes parental marital status, education and occupation; it ranged from 2·1 to 6·6, with higher values indicating higher socio-economic status.
‡ The lower the score in the 4×10-m shuttle-run test (i.e. less seconds to cover a fixed distance), the higher the performance (i.e. the faster and more agile the child is).
Pearson’s correlations between hemisphere volumes (mm3) of subcortical brain structures (Mean values and standard deviations)

r, Linear correlation.
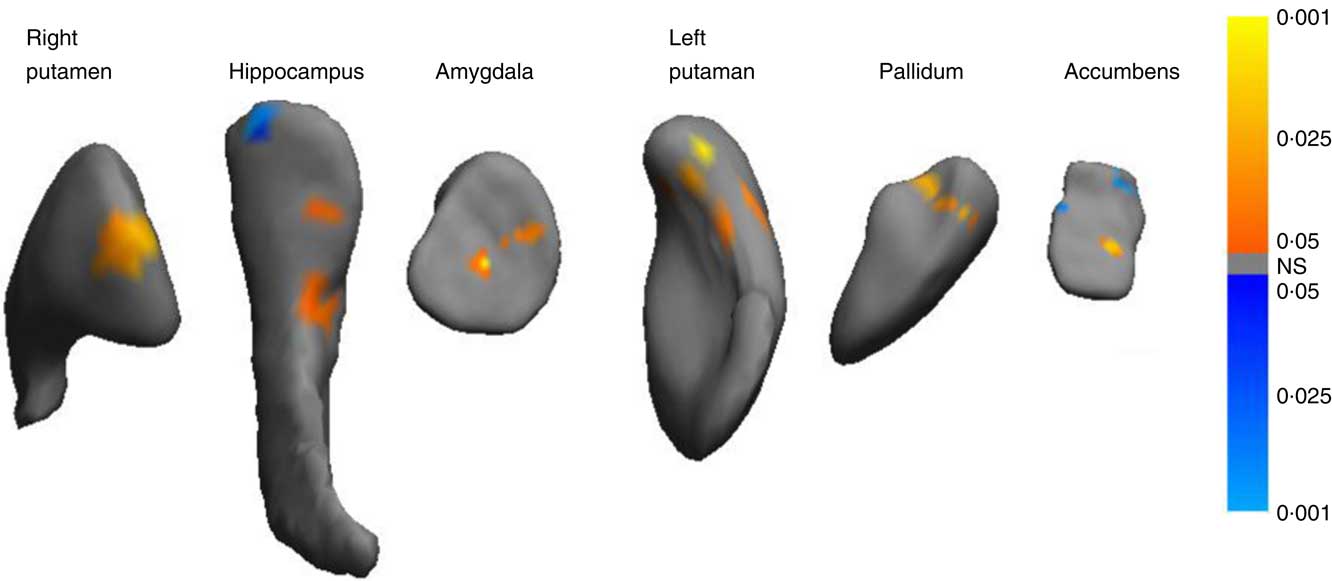
Table 3 (also Fig. 2–5) shows the results from the vertex-wise permutation tests for each fitness variable as predictor, radial distances (brain nuclei shapes) as the outcome and the following set of covariates as potential confounders: age at first evaluation visit (i.e. when the MRI scan was performed – namely, MRI age), the time difference between MRI and fitness assessments, sex, socio-economic status of the family, birth weight, BMI and TIV. We observed that fitness variables were significantly related to the shape (expansions/contractions) of all subcortical brain structures studied except for the right accumbens and right caudate. Out of the fitness components studied, cardiorespiratory fitness was the one showing more significant and positive associations with shapes of subcortical brain structures; particularly, higher cardiorespiratory fitness was associated with expansions in six out of the fourteen structures studied, whereas muscular strength or speed agility were associated with expansion only in two or less of the structures studied. On the other hand, muscular strength as measured by handgrip strength test was mainly related with contractions (i.e. reduced radial distances) in five of the subcortical brain structures studied, while with expansions only in two structures. Muscular strength, as measured by standing long jump, and speed agility were associated with fewer structures (two and four, respectively) and indicating equally expansions and contractions.
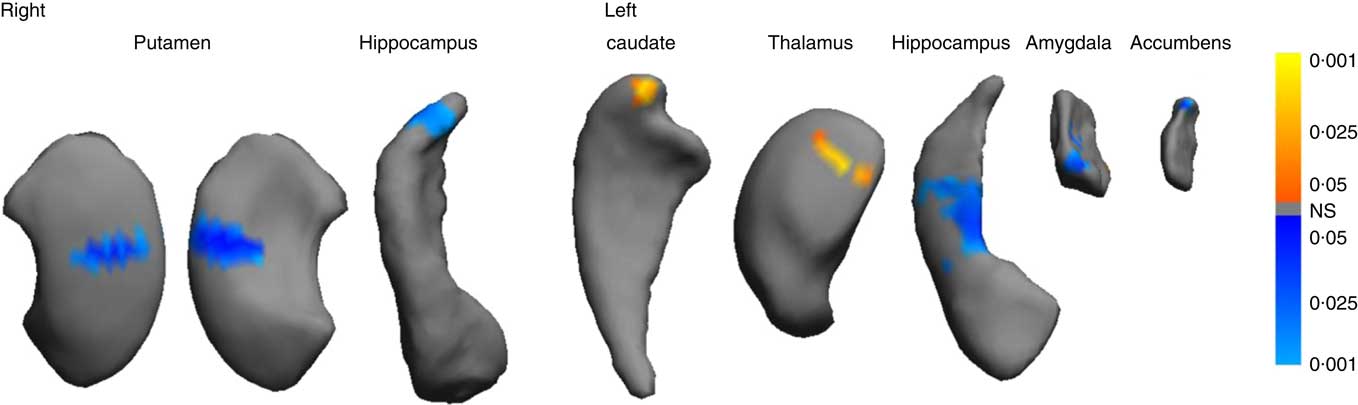
Mappings of significant subcortical nuclei expansions/contractions related to cardiorespiratory fitness (VO2max). The colour bar indicates the significance-corrected P values, with ![]() indicating significant negative associations between predictor and outcome,
indicating significant negative associations between predictor and outcome, ![]() indicating significant positive associations and
indicating significant positive associations and ![]() indicating no association. All the analyses were controlled for age at first evaluation visit, the time difference between MRI and fitness assessments, sex, socio-economic status of the family, birth weight, BMI and total intracranial volume.
indicating no association. All the analyses were controlled for age at first evaluation visit, the time difference between MRI and fitness assessments, sex, socio-economic status of the family, birth weight, BMI and total intracranial volume.

Mappings of significant subcortical nuclei expansions/contraction related to handgrip strength. The colour bar indicates the significance-corrected P values, with ![]() indicating significant negative associations between predictor and outcome,
indicating significant negative associations between predictor and outcome, ![]() indicating significant positive associations and
indicating significant positive associations and ![]() indicating no association. All the analyses were controlled for age at first evaluation visit, the time difference between MRI and fitness assessments, sex, socio-economic status of the family, birth weight, BMI and total intracranial volume.
indicating no association. All the analyses were controlled for age at first evaluation visit, the time difference between MRI and fitness assessments, sex, socio-economic status of the family, birth weight, BMI and total intracranial volume.

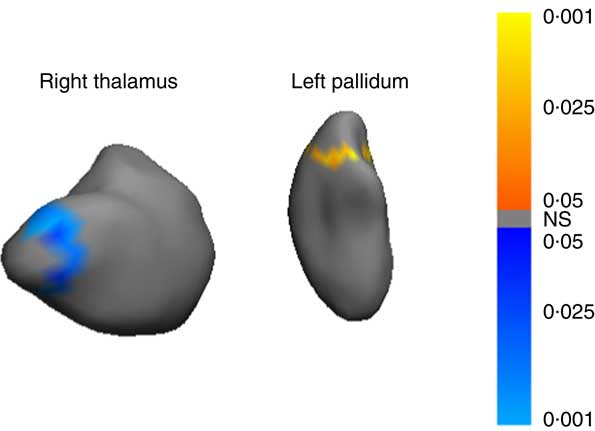
Mappings of significant subcortical nuclei expansions/contraction related to lower-body muscular strength as measured by the standing long jump. Only the most significant sides of the nuclei are displayed. The colour bar indicates the significance-corrected P values, with ![]() indicating significant negative associations between predictor and outcome,
indicating significant negative associations between predictor and outcome, ![]() indicating significant positive associations and
indicating significant positive associations and ![]() indicating no association. All the analyses were controlled for age at first evaluation visit, the time difference between MRI and fitness assessments, sex, socio-economic status of the family, birth weight, BMI and total intracranial volume.
indicating no association. All the analyses were controlled for age at first evaluation visit, the time difference between MRI and fitness assessments, sex, socio-economic status of the family, birth weight, BMI and total intracranial volume.

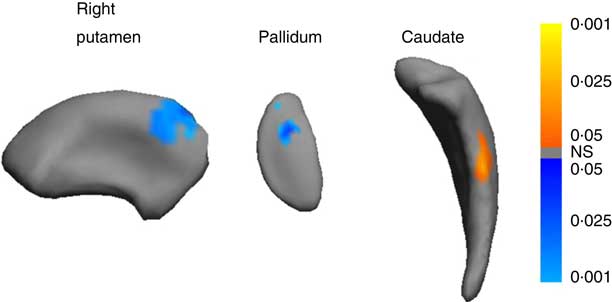
Mappings of significant subcortical nuclei expansions/contraction related to speed agility. Only the most significant sides of the nuclei are displayed. The colour bar indicates the significance-corrected P values, with ![]() indicating significant negative associations between predictor and outcome,
indicating significant negative associations between predictor and outcome, ![]() indicating significant positive associations and
indicating significant positive associations and ![]() indicating no association. The lower the score in the 4×10-m shuttle-run test (i.e. less seconds to cover a fixed distance), the higher the performance (i.e. the faster and more agile the child is). Consequently, negative associations actually mean positive associations between speed agility performance and enlargements of subcortical nuclei. All the analyses were controlled for age at first evaluation visit, the time difference between MRI and fitness assessments, sex, socio-economic status of the family, birth weight, BMI and total intracranial volume.
indicating no association. The lower the score in the 4×10-m shuttle-run test (i.e. less seconds to cover a fixed distance), the higher the performance (i.e. the faster and more agile the child is). Consequently, negative associations actually mean positive associations between speed agility performance and enlargements of subcortical nuclei. All the analyses were controlled for age at first evaluation visit, the time difference between MRI and fitness assessments, sex, socio-economic status of the family, birth weight, BMI and total intracranial volume.

Correlations between fitness variables and subcortical brain shapeFootnote *

* NS indicates non-significant correlation, otherwise the correlation coefficients shown were significant at P<0·05. Data shown are from the permutation tests for shape analysis, showing significant partial correlations between radial distances and fitness variables. Positive correlations indicate that higher fitness is associated with expansions (larger radial distance) and negative correlations indicate that higher fitness is associated with contractions (shorter radial distance) in the subcortical nuclei studied. Number of significant vertices (k) includes both positive/negative (data presented in this order) significant correlations. All the analyses were controlled for age at first evaluation visit, the time difference between MRI and fitness assessments, sex, socio-economic status of the family, birth weight, BMI and total intracranial volume.
† The lower the score in the 4×10-m shuttle-run test (i.e. less seconds to cover a fixed distance), the higher the performance (i.e. the faster and more agile the child is).
Fig. 2–5 graphically show how fitness variables relate to shape of the subcortical nuclei indicating, by means of a colour-coded significance map, the parts of each brain structure that are significantly related to fitness and the direction of that association (positive/negative=expansions/contractions). Fig. 2 shows that cardiorespiratory fitness was related to the right putamen, hippocampus and amygdala as well as the left putamen, pallidum and accumbens. All these associations were positive (expansions), except for the right hippocampus and left accumbens, in which we found both expansions and contractions. Fig. 3 shows that higher handgrip strength was related to expansions in the left caudate head and right anterior thalamus, but was also related to contractions in the right putamen, hippocampus (right and left), left amygdala and left accumbens. Fig. 4 shows that higher muscular strength as measured by standing long jump was related to expansions in the left pallidum and contractions in the right thalamus. Fig. 5 shows that speed agility was negatively related to the right putamen and pallidum, which due to the fact that this test is expressed inversely (i.e. lower score means higher performance), indicating that higher performance in speed agility is related to expansions in these subcortical brain nuclei. Better performance in speed agility was, however, related to contractions in the right caudate. Finally, in order to graphically represent which are the strongest associations found in our study, we provide as the online Supplementary material (Fig. S1–S4) the same set of figures, but showing only those associations with P value<0·025 (instead of 0·05 as standard).
Discussion
This study used a novel approach (shape analysis) to examine brain structure in relation to physical fitness in children, contributing to the current knowledge in this field. Overall, our results suggest that all the main health-related physical fitness components (i.e. cardiorespiratory fitness, muscular strength and speed agility) are significantly related to the shapes of subcortical brain nuclei in childhood. These associations were mainly positive for most of the fitness tests, indicating that a higher level of fitness in childhood is related to expansions in certain parts of the accumbens, amygdala, caudate, hippocampus, pallidum, putamen and thalamus. However, higher fitness was also significantly related to contractions in other parts of these subcortical nuclei, suggesting that fitness might have an effect on brain structures by shaping them in a certain way, and not necessarily by increasing the whole volume of such brain structures. These results highlight that shape rather than volume may be a more sensitive measure of the impact of fitness variables on developing brains( Reference Sandman, Head and Muftuler 15 ). The association between fitness and brain structure shape was examined using correlation coefficients (r statistics), which are considered an effect size measure itself( Reference Nakagawa and Cuthill 42 ). The correlation coefficients obtained inform us that the associations between fitness and subcortical brain structure shapes are of low-to-medium magnitude. In addition, it is important to highlight that, although significant associations were found between fitness and certain regions of the subcortical nuclei studied, other large regions were not associated, suggesting that fitness might be only a modest contributor to brain shaping, with many other genetic and environmental factors influencing brain morphology. On the other hand, it is important to bear in mind that the subcortical regions associated with fitness in the present study, although they seem small, include hundreds of thousands of neurons, fibres and connections, and the effect of these differences in shape on brain functioning is unknown. Whether the associations between fitness and shapes of subcortical brain structures are causal or not will be confirmed or contrasted in future randomised-controlled trials.
We have not found previous studies analysing the shapes of subcortical brain nuclei in young people in relation to physical fitness, which precludes us from carrying out direct comparisons between our results and those from other studies. Previous literature in youth has focused on volumetric analysis of subcortical brain structures and on cardiorespiratory fitness( Reference Chaddock, Erickson and Prakash 7 – Reference Chaddock, Hillman and Pontifex 9 ). These authors observed that higher cardiorespiratory fitness level was associated with higher volume of the hippocampus( Reference Chaddock, Erickson and Prakash 7 ) and basal ganglia, particularly higher putamen and pallidum volumes( Reference Chaddock, Erickson and Prakash 8 , Reference Chaddock, Hillman and Pontifex 9 ). The contribution of our study to the current knowledge base in the field is therefore 2-fold: (1) the inclusion of shape analysis of subcortical brain structures in children and (2) the inclusions of other components of physical fitness such as muscular strength and speed agility as it is unknown whether they could be related to structural measures of brain in children.
We observed that children with higher cardiorespiratory fitness had enlarged regions in the left amygdala, left hippocampus, left and right putamen and right pallidum. These results are in line with previous studies that have reported higher volumes in three (i.e. hippocampus, putamen and pallidum) out of these four brain nuclei in children with a high cardiorespiratory fitness level compared with peers with lower cardiorespiratory fitness levels( Reference Chaddock, Erickson and Prakash 7 – Reference Chaddock, Hillman and Pontifex 9 ). Previous studies in rodents have consistently shown a number of mechanisms that could explain these findings, with special focus on the hippocampus( Reference Voss, Vivar and Kramer 43 ). Aerobic exercise (a major determinant of cardiorespiratory fitness) increases cell proliferation and survival in the dentate gyrus of the hippocampus and increases hippocampal levels of growth factors in the brain, such as the brain-derived neurotrophic factor (BDNF), insulin-like growth factor 1 (IGF-1) and vascular endothelial-derived growth factor, which are involved in neuronal survival, synaptic development and angiogenesis( Reference Cotman, Berchtold and Christie 44 ). Similarly, animal models have demonstrated that aerobic exercise increases the production and secretion of BDNF in the striatum, which includes the caudate and putamen, associated with cardiorespiratory fitness( Reference Aguiar, Speck and Prediger 45 , Reference Marais, Stein and Daniels 46 ). Recent systematic reviews and meta-analyses in humans have confirmed that doing aerobic exercise regularly has a positive effect on BDNF levels( Reference Huang, Larsen and Ried-Larsen 47 , Reference Szuhany, Bugatti and Otto 48 ).
Thus far, we have not found any study examining the association of muscular strength or speed agility with brain structure in any age group. There is, however, emerging evidence suggesting that resistance training (which leads to better muscular strength) could have a beneficial effect on functional plasticity in old women, as measured by functional MRI, particularly in the anterior portion of the left middle temporal gyrus and the left anterior insula extending into the lateral orbital frontal cortex( Reference Liu-Ambrose, Nagamatsu and Voss 49 ). Recent reviews in humans have concluded that low or high resistance exercise increases levels of IGF-1 (yet not of BDNF), which could at least partially mediate the positive effects of exercise on brain functioning mentioned above( Reference Huang, Larsen and Ried-Larsen 47 , Reference Rojas Vega, Knicker and Hollmann 50 ). Voelcker-Rehage & Niemann( Reference Voelcker-Rehage and Niemann 4 ) conducted a comprehensive review on the structural and functional brain changes related to physical activity across the lifespan and classified both aerobic exercise and resistance training as metabolic exercise, arguing that both have important metabolic adaptations. They also grouped other activities as coordinative exercise, which comprises fine and gross motor body coordination such as balance, eye–hand coordination, leg–arm coordination as well as spatial orientation. These authors concluded that, with a few exceptions, all published results support that metabolic exercise modulates structural brain plasticity. They also concluded that coordinative exercise might influence brain structure in a different manner than metabolic exercise, because of its higher cognitive demands and similarly enriched environments in animal studies. Unfortunately, the information currently available about coordinative exercise and brain is very limited. Our speed agility test involves a mixture of metabolic and coordinative exercise, whereas sprinting is an anaerobic physiological effort with a marked impact on metabolism; these tests also include special orientation (changes in directions) and picking–dropping objects (sponges), which would fit in the definition of coordinative exercise. To the best of our knowledge, this is the first study directly comparing how cardiorespiratory fitness, muscular strength and speed agility relate to brain structure and our data support that these three components are associated with brain shaping in children, although the highest number of significant and positive associations was found for cardiorespiratory fitness, suggesting that it is the strongest predictor of brain structure in young people.
Our findings concerning muscular strength might seem contradictory, as associations with shape of brain structures were mainly positive (i.e. expansions) when muscular strength was assessed by the standing long-jump test, whereas the associations were mainly negative (i.e. contractions) when muscular strength was assessed by the handgrip strength test. This however, could have an explanation. Muscular fitness or strength can be assessed using body weight-dependent or body weight-independent tests. The first type includes any activity in which the person has to lift, hold or carry his/her own body weight, for example, hanging from a bar or tree branch, standing long-jump test, etc. Examples of body weight-independent tests include situations in which the person’s body weight per se has no influence on the performance, that is, weight lifting, carrying a suitcase or moving a heavy object, handgrip strength test, etc. Consequently, we used standing long jump as an indicator of body weight-dependent test, whereas the handgrip strength was used as an indicator of body weight-independent test. Overweight–obese children or adolescents have higher levels of fat mass but also higher levels of muscle mass( Reference Ekelund, Franks and Wareham 51 , Reference Gracia-Marco, Ortega and Jiménez-Pavón 52 ), which make them have higher strength as measured by body weight-independent tests, but lower strength when using body weight-dependent tests (e.g. they jump less due to their high body weight)( Reference Artero, Espana-Romero and Ortega 53 ). We have previously reported that these two ways of assessing muscular strength lead to completely different associations with health outcomes such as cardiometabolic risk factors in young people, and our results might suggest that this is also the case for associations with brains measures( Reference Ortega, Sanchez-Lopez and Solera-Martinez 54 ). We attempted to eliminate this potential effect by additionally adjusting our models for BMI, yet we cannot ensure that all the potential confounding effects have been removed.
Limitations and strengths
A major limitation of the present study is the relatively small sample size included (n 44), although it is similar to that from previous studies on this topic conducted in children (i.e. n ranging from 32 to 55)( Reference Chaddock, Erickson and Prakash 7 , Reference Chaddock, Erickson and Prakash 8 ). Owing to this small sample size, and therefore small statistical power (and thus high β error), some potentially significant associations might not have been detected. On the other hand, given this small statistical power, an association becomes significant only when the effect size is relatively large. Our correlation coefficients, an effect size measure regardless of the P values, ranged between 0·3 and 0·5, which is a decent strength of association if considered that the shape of a brain structure is the result of multiple genetic and environmental factors, with fitness being only one of them modestly contributing to it with a small portion of the total variance explained.
As previously mentioned, because of the cross-sectional nature of this study, it is not possible to draw causal relationships. Moreover, this study was conducted in a sample of pre-adolescent children, and we cannot know the extent to which these results apply to other age groups. In addition, the fact that fitness and MRI were not assessed exactly at the same time, but with a time gap of 11·5 months, should be knowledge as a limitation. However, we believe it is unlikely that this could have influenced our results/conclusions to a large extent because of several reasons: (a) all the statistical analyses conducted in this study were adjusted for the time difference between assessments to diminish this potential source of error; (b) this time gap was very homogeneous among the participants, being less than 1 month the difference between the 25th and the 75th percentile (i.e. 11·1 and 12·0 months, respectively), suggesting that any residual error not corrected by the statistical adjustment applied would be similar across the participants; (c) longitudinal studies on fitness have shown small and non-significant (P>0·05) changes in 1 year of follow-up in 10-year-old children (i.e. 1–2 ml/kg per min VO2max, cardiorespiratory fitness)( Reference Janz, Dawson and Mahoney 55 ); and (d) fitness has shown to track well across childhood, with this tracking being particularly high in the short follow-up period (i.e. 1-year follow-up)( Reference Janz, Dawson and Mahoney 55 ) and in the pre-pubertal phase (less physiological changes compared with puberty), which suggests that the fittest participants when measured in our study would also be the fittest participants of the sample if measured 1 year earlier or later.
On the other hand, this study should be acknowledged for the use of highly reliable and valid tests for assessing the main health-related fitness components. The tests used are based on three recent systematic reviews and methodological studies conducted under the umbrella of the European ALPHA project (www.thealphaproject.net)( Reference Ruiz, Castro-Piñero and Artero 2 , Reference Ruiz, Castro-Pinero and Espana-Romero 3 , Reference Ortega, Artero and Ruiz 21 , Reference Artero, Espana-Romero and Castro-Pinero 29 ). Another major strength of this study is the use of a shape analysis approach, which provides new insights into the field of fitness and brain morphology in childhood.
Conclusions
Our results support that cardiorespiratory fitness, muscular strength and speed agility (the main health-related fitness components) are significantly associated with the shapes of subcortical brain nuclei. Higher fitness was associated with expansions in certain parts of these brain nuclei, but also with contractions in other parts of these nuclei, suggesting that fitness could potentially influence the brain by shaping certain nuclei and not necessarily by increasing their volume. Our results support that cardiorespiratory fitness is the fitness component associated with expansions in more subcortical brain structures – that is, six out of fourteen structures studied. Future exercise-based randomised controlled trials will confirm or contrast the present observational evidence. In addition, further research is needed to fully understand the consequences that changes in shapes of subcortical brain structures have on brain functioning.
Acknowledgements
The authors thank all participating women and children for their collaboration and all the colleagues in the study centres for their support. The results of this article are likely to be included in the Doctoral Thesis from D. C. in the context of the NUTRENVIGEN G+D Factors Doctoral Program at the University of Granada.
This work was supported by the Commission of the European Community’s 7th Framework Programme (FP7/2008-2013), grant agreement no. 212652 (NUTRIMENTHE project); within the 6th Framework Programme, contract no. 007036 (EARNEST project); and supported in part by the Commission of the European Community within the 5th Framework Programme, contract no. QLK1-CT-1999-00888 (NUHEAL project). This publication is the work of the authors and does not necessarily reflect the views of the Commission of the European Community. Research by A. C. is funded by a Spanish Ministry of Economy and Competitiveness grant (State Secretariat for Research, Development and Innovation Secretary, PSI2012-39292). F. B. O. is supported by a grant from the Spanish Ministry of Science and Innovation – MINECO – (RYC-2011-09011), C. C.-S. by a grant from the Spanish Ministry of Economy and Competitiveness (BES-2014-068829) and S. A. by the Marie Curie post-doctoral fellowship (no. 329812, NutriOmics). The present data analysis and interpretation take place under the umbrella of the ActiveBrains project (DEP2013-47540-R), which deals with the effects of exercise and fitness on brains. The funders had no role in the design, analysis or writing of this article.
All the authors helped in the interpretation of the results and contributed to manuscript preparation. F. B. O., M. M.-M. and C. M.-Z. designed and participated in fitness data collection; D. C., M. M.-M. and C. M.-Z. performed the rest of children’s examinations. A. C. performed the neuroimaging analysis and interpretation; A. C. and F. B. O. carried out the statistical analysis and wrote the manuscript; S. A. and C. C.-S. critically reviewed the manuscript providing relevant comments, and S. A. revised the English grammar. C. C. was the coordinator of the NUHEAL study in Spain and the NUTRIMENTHE EU project and supervised the writing of the manuscript.
The authors declare that there are no conflicts of interest.
Supplementary Material
For supplementary material/s referred to in this article, please visit http://dx.doi.org/doi:10.1017/S0007114516001239


 Open access