


Depressive symptoms are the most common outcomes of stress-induced reactions in humans(Reference Leonard1) and have been studied in relation to a wide array of diseases and conditions including CVD(Reference Lesperance and Frasure-Smith2, Reference Ketterer, Mahr and Goldberg3), cancer(Reference Newport and Nemeroff4, Reference Spiegel5), type 2 diabetes mellitus(Reference Talbot and Nouwen6, Reference Kawakami, Takatsuka and Shimizu7) and allergic responses(Reference Cuffel, Wamboldt and Borish8, Reference Bell, Jasnoski and Kagan9). Recent research has pointed to a link between oxidative stress and psychological stressors conducive to elevated depressive symptoms(Reference Moller, Wallin and Knudsen10).
Dietary antioxidants include a number of micronutrients that have been shown to reduce oxidative stress triggered by injury, characterising the pathogenesis of many chronic diseases, including type 2 diabetes, CVD, rheumatological conditions and carcinogenesis(Reference Soory11). In fact, serum levels of antioxidants reflected their dietary intakes based on several studies(Reference Campbell, Gross and Martini12, Reference Stryker, Kaplan and Stein13). One class of antioxidants, known as carotenoids, are found primarily in fruits and vegetables (FV), while their secondary sources are bread, eggs, beverages, fats and oils(Reference Rao and Rao14). Even though the human diet contains over forty different types of carotenoids, only β-carotene, α-carotene, β-cryptoxanthin, lycopene, lutein and zeaxanthin have detectable concentrations in human serum(Reference Rao and Rao14). Other micronutrients with well-established antioxidative properties include vitamin C, retinol (sparing provitamin A) and vitamin E(Reference Paolisso, D'Amore and Balbi15–Reference Sies and Stahl17).
Evidence from basic experimental and epidemiological studies has triggered a number of hypotheses regarding the possible direction of the association between serum antioxidant levels and depressive symptoms in humans as follows: (1) depression is the outcome of low serum antioxidant status; (2) antioxidant status is the outcome of poor diet resulting from depression; (3) both depression and antioxidant status are markers of a third factor (e.g. a genetic variant), which makes them non-causally related. However, assuming the first scenario is true, one possible hypothesis (hypothesis A) is that depressive symptoms caused by external stressors trigger oxidative stress which in turn causes reduced concentrations of certain antioxidants in serum, independently of the dietary intake of those antioxidants(Reference Liu, Wang and Mori18–Reference Tsuboi, Shimoi and Kinae22). Another hypothesis (hypothesis B) is that increased intake of antioxidants in the diet reduces oxidative stress by increasing serum antioxidant levels(Reference Campbell, Gross and Martini12, Reference Stryker, Kaplan and Stein13), thereby reducing the incidence of elevated depressive symptoms by reducing lipid peroxidation in the brain(Reference Irwin23–Reference Craft, Haitema and Garnett25). While both hypotheses are possible, hypothesis B is more amenable to dietary intervention. In order to test hypothesis B, it is important to allow dietary intakes of the specific antioxidant to vary while adjusting for other potentially confounding covariates. To test hypothesis A, additional adjustment for dietary intake of antioxidants is required.
To date, however, few epidemiological studies have directly assessed the association between antioxidant status (or dietary intakes of antioxidants) and elevated depressive symptoms among adults(Reference Tsuboi, Shimoi and Kinae22, Reference Oishi, Doi and Kawakami26–Reference Milaneschi, Bandinelli and Penninx32), and none so far have used nationally representative US data.
The present study uses national data on US adults to examine the relationship of elevated depressive symptoms with antioxidant status. We hypothesise that there is an inverse association between serum antioxidant status and the number and severity of depressive symptoms among US adult men and women, which is partially accounted for by dietary intake of those antioxidants (hypotheses A and B).
Materials and methods
Database and study subjects
The National Health and Nutrition Examination Surveys (NHANES) include a series of cross-sectional surveys providing nationally representative data on the nutrition and health status of the US civilian population. The National Center for Health Statistics, Centers for Disease Control, conducted three earlier waves of NHANES (NHANES I, II and III) in 1971–5, 1976–80 and 1988–94, respectively. Since 1999, the NHANES became a continuous survey. Using a stratified, multistage probability cluster sampling design, the NHANES consists of an in-home interview for demographic and basic health information and a health examination in a mobile examination centre (MEC). Household interviews were conducted by trained staff and the MEC consists of physicians, medical and health technicians, and dietary and health interviewers. Detailed descriptions of the sample design, interview procedures and physical examinations conducted have been published elsewhere(Reference Ogden, Carroll and Curtin33). The present study was conducted according to the guidelines laid down in the Declaration of Helsinki and all procedures involving human subjects/patients were approved by the Institutional Review Board of the Centers for Disease Control, National Center for Health Statistics. Written or verbal informed consent was obtained from all subjects/patients. Verbal consent was witnessed and formally recorded(34).
We analysed NHANES data on adults aged 20–85 years from 2005 to 2006. Among a sample of 4979 adult subjects (2387 men and 2592 women) with complete basic demographic data (sample 1), 3097 had complete serum antioxidant status and dietary data. Among those, complete data on other covariates of interest including physical activity, smoking status, supplement use, weight and height, serum 25-hydroxyvitamin D, folate, vitamin B12, homocysteine and total cholesterol were available for 2859 participants (sample 2). Among those in sample 2, complete data on depressive symptoms were available for 1798 participants (i.e. study sample: sample 3). Sample 3 differed from sample 1 on some basic demographic variables. Specifically, sample 3 participants were younger, more likely to be women, non-Hispanic black or Mexican-Americans, with an education level above high school and to be current or former smokers compared with those selected only in sample 1.
Outcome assessment
The questionnaire section of NHANES 2005–6 included the Patient Health Questionnaire (PHQ). This set of ten questions reflects self-reported depressive signs and symptoms that are derived from the diagnostic and statistical manual IV criteria. There are nine signs and symptoms in diagnostic and statistical manual IV that were scored between 0 (not at all) and 3 (nearly every day), and an additional follow-up question to assess overall impairment ascribed to depressive symptoms. The PHQ was validated in primary care settings and shown as a reliable tool for depression diagnosis(Reference Kroenke, Spitzer and Williams35, Reference Spitzer, Kroenke and Williams36). Summing scores on ten PHQ items potentially yields a total score between 0 and 30. In our sample, the 90th percentile on the total PHQ score corresponded to a value of 10. This cut-off point was similarly used elsewhere and had a sensitivity of 88 % and a specificity of 88 % for major depression(Reference Kroenke, Spitzer and Williams35, Reference Spitzer, Kroenke and Williams36).
Exposure assessment
Using HPLC with photodiode array detection, serum concentrations of key antioxidants were measured. In the present study, retinol and retinyl esters (defined as the sum of retinyl palmitate and retinyl stearate) were of interest separately and as their sum. Additionally, carotenoids grouped as α-carotene, β-carotene (cis+trans), β-cryptoxanthin, lutein+zeaxanthin, total lycopene and total carotenoids were considered as exposures. Vitamin E was defined as the sum of α- and γ-tocopherol. Vitamin C was also measured by HPLC with electrochemical detection(37, 38).
Covariates
Sociodemographic covariates included age, sex, race/ethnicity, education, marital status and family income, measured by the poverty:income ratio ( < 100 % of the poverty line, 100– < 200 % and ≥ 200 %). An objective measure for physical activity was constructed based on individual leisure-time activities with an intensity score assessed by metabolic equivalents multiplied by duration of the activity and frequency converted to per week unit. This metabolic equivalent × h/week value was summed for each subject depending on the number of leisure-time physical activities elicited, with participants not eliciting any activity being considered as sedentary (score 0)(Reference Cheng, Gregg and De Rekeneire39–Reference McCullough, Feskanich and Rimm41). This continuous score was categorised as ‘0– < 5’, ‘5–10’ and ‘>10’, in the main part of the analysis. Cigarette smoking status was defined as never, former or current smoker. All NHANES participants were eligible for two 24 h recalls in the 2005–6 wave. The first one was administered during MEC examinations and the second 3–10 d later by telephone interview. The average of the two 24 h recalls was examined from which nutrient intakes were estimated using a revised nutrient database(42). Total dietary intakes of alcohol, selected antioxidants (α-carotene, β-carotene, β-cryptoxanthin, lutein+zeaxanthin, lycopene, total carotenoids (i.e. the sum of previously listed micronutrients in μg/d), vitamin C and vitamin E in mg/d) and n-3 PUFA (sum of DHA+EPA+n-3 docosapentaenoic acid (C ≥ 20), in g/d) were considered as potential confounders, given their putative associations with elevated depressive symptoms(Reference Oishi, Doi and Kawakami26, Reference Silvers and Scott43–Reference Raimo and Schuckit45). Moreover, total energy intake was added into statistical models as a covariate to obtain energy-adjusted associations between nutrients and outcome. Using another database to obtain MyPyramid Equivalents(46) of each food group, cup equivalents of FV were estimated per individual and averaged out between the two 24 h recalls. Participants with only one 24 h recall were excluded in the final analysis. A general measure of dietary supplement use over the past 30 d was computed as follows: 0, non-users; 1, using one supplement; 2, using two supplements or more. Another measure of antidepressant use was obtained from the medication data file with the first-level category being ‘242’ and the second-level category being ‘249’, using Multum's therapeutic classification system(47). The final variable was coded as ‘having used an antidepressant’ (1 = yes; 0 = no) over the past 30 d.
Serum folate and vitamin B12 were measured using the ‘Quantaphase II Folate’ radioassay kit (Bio-Rad Laboratories)(48, 49). Total homocysteine in serum was measured using the fully automated Abbott IMx Homocysteine assay method (Abbott Laboratories)(Reference Pernet, Lasnier and Vaubourdolle50). Serum 25-hydroxyvitamin D was measured by RIA (Diasorin, Inc.)(51). Those nutritional biomarkers were associated with mood disorders and cognitive function in a number of previous studies(Reference Wilkins, Sheline and Roe52–Reference Beydoun, Shroff and Beydoun68).
Moreover, because depressive symptoms are usually increased in number and severity in the presence of co-morbid chronic conditions, we created three measures using self-reports for history of ‘type 2 diabetes’, ‘CVD’ (i.e. congestive heart failure, CVD, angina, heart attack or stroke) and ‘cancer of any type’. Finally, many of the lipophilic vitamins are highly correlated with serum lipids, and thus total cholesterol was also adjusted for in the analysis as was done in a previous study(Reference Beydoun, Shroff and Chen69).
Statistical analysis
Using Stata (release 11.0; StataCorp LP), we first described NHANES 2005–06 study sample characteristics by sex and elevated depressive symptoms status. Differences in means across groups and associations between categorical variables were tested with t and χ2 tests, respectively. Second, we used Pearson's correlations to examine the associations between loge-transformed serum antioxidant variables, first, between each other and, second, with selected dietary factors and the continuous PHQ score. Partial correlations were additionally conducted to examine the degree to which the association between serum antioxidants and the corresponding dietary antioxidant is explained by dietary intakes of FV and by dietary supplement use. A full multiple regression model of covariates and dietary factors as predictors of serum antioxidants has been published elsewhere using NHANES 2001–6 data(Reference Beydoun, Shroff and Chen69). Third, multiple logistic regression models were conducted to test the associations between antioxidant status (standardised z-scores computed from the total NHANES sample aged 20–85 years with available antioxidant data) and ‘elevated depressive symptoms’, controlling for potential confounders (i.e. all covariates as described earlier, entered simultaneously) and stratifying by sex, as was done in a previous study(Reference Beydoun, Shroff and Beydoun68). These associations were tested for depressive symptoms count score (range 0–30) as well using multiple zero-inflated Poisson (ZIP) regression models(Reference Long70). The choice of the ZIP model over Poisson and negative binomial models was based on a previous similar analysis that compared the three models(Reference Bandiera, Arheart and Caban-Martinez71). To test hypotheses A and B, two sets of models were carried out, as described earlier. One set controlled for all factors except for dietary antioxidants while another set, in addition to all factors, controlled for dietary antioxidants. Models were compared between hypotheses B and A, in terms of change-in-estimate(Reference Selvin72), when dietary antioxidants and supplement use were entered into the model.
To test dose–response relationships, quartiles of main antioxidants (Q2, Q3, Q4v. Q1) were entered into multiple logistic regression models and P values for trend were computed. In all analyses, sampling design complexity was taken into account and adequate sampling weights, strata and primary sampling units were specified using Stata survey commands. For most sample estimations, 2-year MEC examination weights were used, and masked variance units were used to estimate variances using the Taylor series linearisation method(Reference Lohr73).
To additionally account for potential selection bias in all main analyses (logistic and ZIP regression models), given missing data on the outcome variable compared with the MEC examination sample, we constructed a two-stage Heckman selection model(Reference Heckman74), as was done previously in another study using a similar sample(Reference Beydoun, Shroff and Beydoun68). To this end, a probit model was conducted at first in which the main selection variable (i.e. belonging to sample 3 v. not, among those in sample 1) was modelled against basic sociodemographic variables that were pseudo-complete for the total NHANES adult sample (i.e. sample 1). These variables included age, sex, race/ethnicity, marital status, education, poverty:income ratio and smoking status. A dummy variable for missing data on those variables was included. From the probit model, the conditional probability of being selected was predicted from which an inverse Mills ratio, a function of that predicted probability, was computed and entered at a second stage as a covariate into the main statistical models(Reference Puhani75).
In addition, confounding effects of various covariates included in the model were explored using a change-in-estimate type of analysis, in which all main exposures were retained in the model while other covariates were backward eliminated sequentially from each model. The effect of eliminating each covariate on the main effects of interest was assessed accordingly by examining the percentage change in the estimate of OR associated with each exposure when each covariate was eliminated(Reference Wang76). This analysis, however, did not take design complexity into account.
To test for sex differences in main associations, multiple logistic and ZIP regression models were re-ran in a non-stratified model, adding a main effect for sex and an interaction term for each of the antioxidant exposure with sex. Sex difference in the association between each serum antioxidant and the PHQ was deemed significant if the interaction term was significant at a level of 0·10, given the lower power of interaction terms compared with the main effects(Reference Selvin72). All other P values presented were two-tailed with P< 0·05 being considered as statistically significant and P< 0·10 considered as marginally significant, before correction for multiple testing. Multiple testing correction was done by considering a P value < 0·001 as statistically significant when comparing one quartile of a predictor with the referent category (e.g. Q4v. Q1) or examining standardised predictor variables in relation to the outcome (i.e. per sd). The same cut-off was applied to the P value for trend and the P value for interaction.
Results
Study sample characteristics
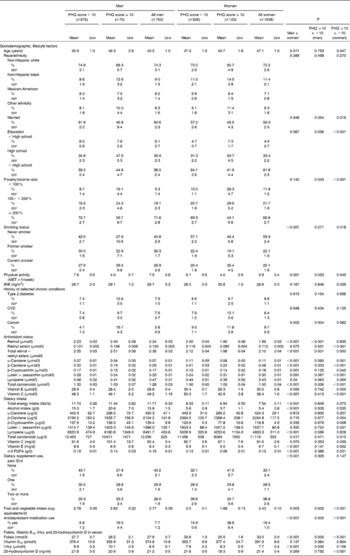
Table 1 presents the distribution of sample characteristics by sex and depressive symptoms status based on the PHQ score. The mean PHQ score was significantly higher among women compared with men (4·5 (sem 0·2) v. 3·9 (sem 0·2), P< 0·05). Participants with elevated depressive symptoms were generally less educated, more likely to belong to the poverty:income ratio < 100 % category, be unmarried, less physically active and had a higher proportion with history of cancer. Women with elevated depressive symptoms were more likely to be current smokers and had a higher mean BMI. Men and women with elevated depressive symptoms had consistently lower serum levels of β-carotene and total carotenoids combined compared with their non-depressed counterparts and were more likely to use antidepressants. Women with elevated depressive symptoms had lower serum levels of vitamins E and C as well as all carotenoids compared with their non-depressed counterparts. They additionally reported lower intakes of β-carotene, β-cryptoxanthin, lutein+zeaxanthin, total carotenoids, vitamin C, vitamin E, n-3 PUFA and a lower consumption of FV. Moreover, they exhibited lower serum folate and 25-hydroxyvitamin D status. Men with elevated depressive symptoms had higher mean total homocysteine compared with their non-depressed counterparts. Sex differences in dietary intakes and other covariates were also observed, including intakes of carotenoids, vitamin E, n-3 PUFA, antidepressant use, dietary supplement use, consumption of FV as well as serum levels of folate and total homocysteine.
Selected baseline characteristics of National Health and Nutrition Examination Survey 2005–6 participants by sex and ‘elevated depressive symptoms’ status* (Mean values with their standard errors; percentages and standard errors of the proportion (SEP), n 1798)
PHQ, Patient Health Questionnaire; MET, metabolic equivalents; tHcy, total homocysteine.
* Sampling design complexity is taken into account in all analyses. This analysis is done among participants with complete data for the PHQ and other key variables of interest (n 1798).
† P value was based on t test when the row variable was continuous and design-based χ2 test when the row variable was categorical.
Correlation between key study variables
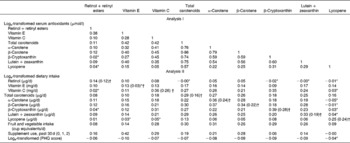
Pearson's correlation coefficients between the loge-transformed serum antioxidant status variables (between each other (analysis I); with other dietary variables and the PHQ continuous score (analysis II)) are presented in Table 2. For analysis I, correlation coefficients between the serum antioxidant variables ranged between < 0·10 and non-significant (e.g. lycopene and retinol+retinyl esters), and >0·70 (e.g. α-carotene and β-carotene). For analysis II, most correlations were weak to moderate ( < 0·10–0·40), with the strongest coefficients being 0·42 (supplement use v. serum vitamin E). As expected, the PHQ score was inversely related to most serum antioxidant variables.
Pearson's correlation coefficients between the loge-transformed serum antioxidant status variables (analysis I) and the loge-transformed serum antioxidant status variables v. selected dietary intake variables and the continuous Patient Health Questionnaire (PHQ) score (analysis II); National Health and Nutrition Examination Surveys 2005–6 (n 1798)
* P>0·05 for null hypothesis that Pearson's correlation coefficient (r) = 0. All other correlations were statistically significant.
† Correlation coefficients in parentheses are partial correlations between serum antioxidant and its corresponding dietary antioxidant (both loge-transformed), controlling for loge-transformed fruit and vegetable intake and supplement use (0, 1, 2 or more).
Partial correlations of serum antioxidants with their corresponding dietary intake variable, controlling for FV consumption and supplement use, indicated that both sources were important in explaining those correlations, with the partial correlation being attenuated by 14 % (retinol) to 77 % (vitamin E).
Antioxidant status and depressive symptoms
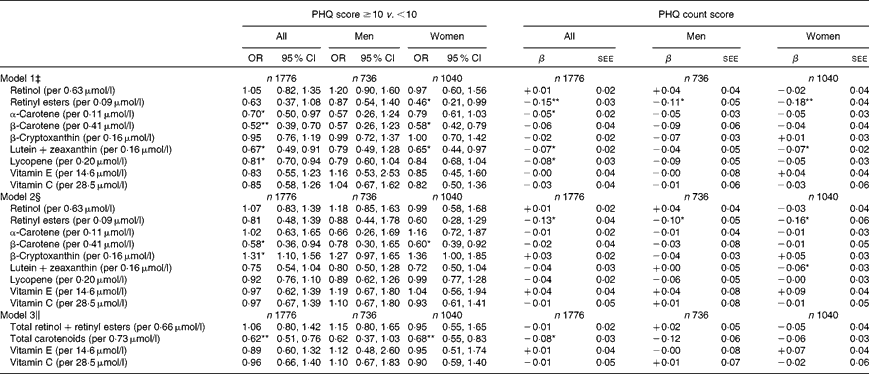
The findings from a series of multiple logistic and ZIP models examining the associations between the selected serum antioxidant status variables and depressive symptoms (measured by the PHQ) are presented in Table 3. In all the presented models, dietary antioxidants and supplement use were not among the covariates that were adjusted for. In a first series of models (model 1), serum carotenoids, retinol, retinyl esters, vitamins C and E were entered separately as predictors for depressive symptoms along with potential confounding covariates. Significant inverse associations were found between elevated depressive symptoms and three different carotenoids (β-carotene (all, women), lutein+zeaxanthin (all, women) and lycopene (all)) and with retinyl esters in women only. Among those, only β-carotene remained significantly inversely related to elevated depressive symptoms after correction for multiple testing (all: OR 0·52, 95 % CI 0·39, 0·70 P< 0·001).
Associations between selected serum antioxidant status (per 1 sd increase) and depressive symptoms: multiple logistic and zero-inflated Poisson regression models, uncontrolled for dietary antioxidant intakes or supplement use (hypothesis B); two-stage Heckman selection models; National Health and Nutrition Examination Surveys 2005–6† (Odds ratio and 95 % confidence intervals or β coefficients with their standard errors of the estimate (SEE))
PHQ, Patient Health Questionnaire.
*P< 0·05; **P< 0·001 for null hypothesis that β = 0 or loge(OR) = 0 based on the Wald test.
† Sampling design complexity is taken into account in all analyses.
‡ Model 1 included each antioxidant exposure separately and adjusted for sociodemographic factors: age, sex, race/ethnicity, marital status, educational level and poverty:income ratio, and other potential confounders – lifestyle and health-related factors (smoking status, BMI, physical activity: metabolic equivalents × h/week, recoded as ‘0– < 5’; ‘5–10’; ‘>10’, history of selected chronic conditions (i.e. type 2 diabetes, CVD and cancer)), antidepressant use and dietary intakes (total energy intake, alcohol, n-3 PUFA), serum folate, total homocysteine, vitamin B12, 25-hydroxyvitamin D and total serum cholesterol levels, and the inverse Mills ratio, two-stage Heckman selection model.
§ Model 2 included all serum antioxidant exposures simultaneously, controlling for the same covariates as above.
∥ Model 3 is model 2 (i.e. controlling for the same covariates as above) but with main exposures being the total retinol+retinyl esters, total carotenoids, vitamin E and vitamin C.
Similar patterns of association were found when the PHQ count (model 1) was the outcome in the series of ZIP models, though only the inverse relationship between retinyl esters and the PHQ count was deemed significant after correction for multiple testing, in both the total population and among women.
In model 2, when all antioxidants were entered into the same model simultaneously along with potential confounding covariates, some of the previously observed inverse associations remained significant (though slightly attenuated) but not others. In particular, while the association between lycopene and elevated depressive symptoms became non-significant, the significance of the inverse association was retained for β-carotene (all, women), while β-cryptoxanthin became associated with elevated depressive symptoms in the total population (OR 1·31, 95 % CI 1·10, 1·56). In ZIP models, an inverse relationship between lutein+zeaxanthin and the PHQ count score was found only among women. In addition, those models indicated that retinyl esters were inversely related to the PHQ count score among both men and women. None of these associations was deemed statistically significant when correcting for multiple testing (P>0·001).
In model 3, all antioxidants were similarly entered simultaneously while combining total carotenoids and retinol+retinyl esters together as two main exposures and adjusting for the same covariates as in model 1. In logistic regression models, among both sexes combined and in women, there was an inverse association between the total carotenoid level and elevated depressive symptoms with a reduction in the odds by 38 % overall and 32 % in women (P< 0·001). In ZIP models, this inverse association was observed only in both sexes combined, but did not reach significance after correction for multiple testing (P>0·001). None of the other antioxidants had a significant association with depressive symptoms independently of total carotenoids and other covariates. Although some of the associations were found to be significant in women and not in men, it is worth noting that sex differences as tested in a separate model with interaction terms were not statistically significant at the 0·10 level.
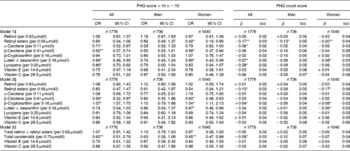
In models presented in Table 4, when additional control was made on dietary antioxidants and supplement use, most of the findings remained consistent with those presented in Table 3, even after correction for multiple testing.
Associations between selected serum antioxidant status (per 1 sd increase) and depressive symptoms: multiple logistic and zero-inflated Poisson regression models, controlled for dietary antioxidant intakes and supplement use (hypothesis A); two-stage Heckman selection models; National Health and Nutrition Examination Surveys 2005–6† (Odds ratio and 95 % confidence intervals or β coefficients with their standard errors of the estimate (SEE))
PHQ, Patient Health Questionnaire.
*P< 0·05; **P< 0·01 for null hypothesis that β = 0 or loge(OR) = 0 based on the Wald test.
† Sampling design complexity is taken into account in all analyses.
‡ Model 1 included each antioxidant exposure separately and adjusted for sociodemographic factors: age, sex, race/ethnicity, marital status, educational level and poverty:income ratio, and other potential confounders – lifestyle and health-related factors (smoking status, BMI, physical activity: metabolic equivalents × h/week, recoded as ‘0– < 5’; ‘5–10’; ‘>10’, history of selected chronic conditions (i.e. type 2 diabetes, CVD and cancer)) and dietary intakes (total energy intake, alcohol, dietary antioxidant (or group of antioxidants), n-3 PUFA, dietary supplement use), serum folate, total homocysteine, vitamin B12, 25-hydroxyvitamin D and total serum cholesterol levels, antidepressant use, and the inverse Mills ratio, two-stage Heckman selection model.
§ Model 2 included all antioxidant exposures simultaneously, controlling for the same covariates as above.
∥ Model 3 is model 2 (i.e. controlling for the same covariates as above) but with main exposures being the total retinol+retinyl esters, total carotenoids, vitamin E and vitamin C.
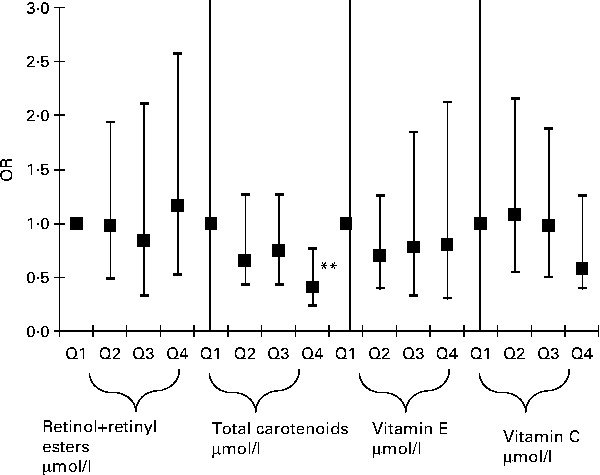
In order to further examine the dose–response relationships between antioxidant status and elevated depressive symptoms, quartiles of main exposures were used and the P value for trend was obtained (Fig. 1) for men and women combined. This particular analysis was uncontrolled for dietary antioxidants or supplement use. Among all serum antioxidant exposures entered into the model, only total carotenoids showed an apparent linear dose–response relationship with a P value for trend of 0·035 and the OR for elevated depressive symptoms and quartiles of carotenoids was only significant when comparing Q4 (1·62–10·1 μmol/l) with Q1 (0·06–0·86 μmol/l) (OR 0·41; 95 % CI 0·23, 0·76; P< 0·001), suggesting a possible threshold of 1·62 μmol/l before a significant association can be detected between serum carotenoids and elevated depressive symptoms. When dietary antioxidants and supplement use were introduced into the same model (Fig. 2), the results remained similar, with a P value for trend of 0·041 for total serum carotenoids expressed as quartiles. However, the linear dose–response relationship was no longer significant in both Figs. 1 and 2 when taking multiple testing into account (P for trend >0·001). A sensitivity analysis that additionally controlled for employment status and medical insurance coverage resulted in a slight attenuation of effects, though the OR for Q4v. Q1 for total carotenoids in relation to elevated depressive symptoms remained statistically significant in the analyses shown in both Figs. 1 and 2 (P= 0·02). Another sensitivity analysis in which subjects with inadequate dietary intakes of antioxidants were excluded did not alter the present findings appreciably.
Adjusted OR (with 95 % CI) of the major serum antioxidant levels (expressed as quartiles, Q2, Q3, Q4v. Q1) and elevated depressive symptoms among US adults, uncontrolled for dietary antioxidant intakes or supplement use; National Health and Nutrition Examination Surveys 2005–6. Ranges (in μmol/l) for each antioxidant quartile are as follows: retinol+retinyl esters (Q1: 0·07–1·7; Q2: 1·7–2·1; Q3: 2·1–2·5; Q4: 2·5–8·9; P for trend = 0·775); total carotenoids (Q1: 0·06–0·86; Q2: 0·86–1·18; Q3: 1·18–1·62; Q4: 1·62–10·1; P for trend = 0·035); vitamin E (Q1: 0·2–26·7; Q2: 21·7–27·3; Q3: 27·4–35·9; Q4: 35·9–303·8; P for trend = 0·678); vitamin C (Q1: 0·6–34·6; Q2: 35·2–54·5; Q3: 55·1–70·4; Q4: 71·0–274·2; P for trend = 0·299). Analyses were based on multiple logistic regression models that included all antioxidant exposures simultaneously adjusted for sociodemographic factors: lifestyle and health-related factors (smoking status, BMI, physical activity: metabolic equivalents h/week, recoded as ‘0– < 5’; ‘5–10’; ‘>10’, history of selected chronic conditions (i.e. type 2 diabetes, CVD and cancer)), antidepressant use and dietary intakes (total energy intake, alcohol, n-3 PUFA), serum folate, total homocysteine, vitamin B12, 25-hydroxyvitamin D and total serum cholesterol levels, antidepressant use, and the inverse Mills ratio, two-stage Heckman selection model. ** P< 0·001 for null hypothesis that loge(OR) = 0.
Adjusted OR (with 95 % CI) of the major serum antioxidant levels (expressed as quartiles, Q2, Q3, Q4v. Q1) and elevated depressive symptoms among US adults, controlled for dietary antioxidant intakes and supplement use; National Health and Nutrition Examination Surveys 2005–6. Ranges (in μmol/l) for each antioxidant quartile are as follows: retinol+retinyl esters (Q1: 0·07–1·7; Q2: 1·7–2·1; Q3: 2·1–2·5; Q4: 2·5–8·9; P for trend = 0·656); total carotenoids (Q1: 0·06–0·86; Q2: 0·86–1·18; Q3: 1·18–1·62; Q4: 1·62–10·1; P for trend = 0·041); vitamin E (Q1: 0·2–26·7; Q2: 21·7–27·3; Q3: 27·4–35·9; Q4: 35·9–303·8; P for trend = 0·286); vitamin C (Q1: 0·6–34·6; Q2: 35·2–54·5; Q3: 55·1–70·4; Q4: 71·0–274·2; P for trend = 0·180). Analyses were based on multiple logistic regression models that included all antioxidant exposures simultaneously adjusted for sociodemographic factors: age, sex, race/ethnicity, marital status, educational level and poverty:income ratio, and other potential confounders – lifestyle and health-related factors (smoking status, BMI, physical activity: metabolic equivalents h/week, recoded as ‘0– < 5’; ‘5–10’; ‘>10’, history of selected chronic conditions (i.e. type 2 diabetes, CVD and cancer)) and dietary intakes (total energy intake, alcohol, dietary antioxidant (or group of antioxidants), n-3 PUFA, dietary supplement use), serum folate, total homocysteine, vitamin B12, 25-hydroxyvitamin D and total serum cholesterol levels, antidepressant use, and the inverse Mills ratio, two-stage Heckman selection model. ** P< 0·001 for null hypothesis that loge(OR) = 0.
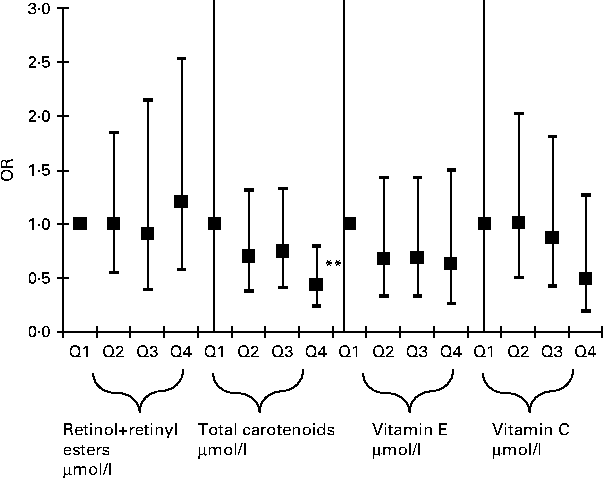
Potential confounding by various covariates entered into the main statistical models, particularly the logistic regression model of Fig. 2, was assessed using a change-in-estimate analysis, which did not take into account sampling design complexity (data not shown). The present findings suggest that when covariates aside from main antioxidant exposures were backward eliminated (model presented in Fig. 2, with antioxidant quartiles entered as an ordinal variable to assess the dose–response relationship), change-in-estimate of the OR did not exceed 10 % (for total serum carotenoids as a covariate, when main exposure was serum vitamin C), suggesting a weak confounding effect exerted by each of the other antioxidants and the remaining covariates in the model. More notably, dietary antioxidants did not act as significant confounders in the association between serum antioxidants and elevated depressive symptoms.
Discussion
The present study used national data on US adults to examine the relationship of elevated depressive symptoms with antioxidant status as measured by serum levels of carotenoids, retinol (free and retinyl esters), vitamin C and vitamin E. There were several key findings. First, we found an inverse association between the total serum carotenoid level and elevated depressive symptoms with a reduction in the odds by 38 % overall with each sd increase in exposure, and by 32 % among women (P< 0·05). Second, we found a dose–response relationship when total carotenoids were expressed as quartiles (Q4 (1·62–10·1 μmol/l)v. Q1 (0·06–0·86 μmol/l): OR 0·41, 95 % CI 0·23, 0·76, P< 0·001; P for trend = 0·035), though no significant associations were found with the other antioxidant levels. Third, among carotenoids, β-carotene (both sexes combined) and lutein+zeaxanthins (among women, after control for dietary intake and supplement use) were associated inversely with elevated depressive symptoms among US adults.
To date, only a handful of studies have evaluated the role played by antioxidants in depressive symptoms(Reference Tsuboi, Shimoi and Kinae22, Reference Oishi, Doi and Kawakami26, Reference Tiemeier, Hofman and Kiliaan30, Reference Milaneschi, Bandinelli and Penninx32) or depression(Reference Tsuboi, Shimoi and Kinae22, Reference Oishi, Doi and Kawakami26–Reference Owen, Batterham and Probst28, Reference Tiemeier, Hofman and Kiliaan30Reference Shibata, Kumagai and Watanabe31). The majority of those studies focused on elderly populations(Reference Oishi, Doi and Kawakami26, Reference Tiemeier, Hofman and Kiliaan30–Reference Milaneschi, Bandinelli and Penninx32) and the most frequently studied antioxidant was vitamin E(Reference Oishi, Doi and Kawakami26–Reference Owen, Batterham and Probst28, Reference Tiemeier, Hofman and Kiliaan30Reference Shibata, Kumagai and Watanabe31). Moreover, one study(Reference Oishi, Doi and Kawakami26) examined carotene and vitamin C in relation to depressive symptoms, another focused on total serum carotenoids(Reference Milaneschi, Bandinelli and Penninx32), while a third study(Reference Tsuboi, Shimoi and Kinae22) tested several antioxidants simultaneously. In a case–control study, Maes et al. (Reference Maes, De Vos and Pioli27) found significantly lower serum levels of vitamin E among forty-two patients with major depressive disorder compared with twenty-six healthy volunteers. Owen et al. measured both serum and dietary levels of vitamin E among depressed adults based on the Beck Depression Inventory. Their results suggested no significant association between the dietary level of vitamin E and major depression, but a significantly lower serum vitamin E level among depressed adults compared with the general population(Reference Owen, Batterham and Probst28). Shibata et al. used the short version of the Geriatric Depression Scale to assess the cross-sectional and longitudinal effects of blood levels of vitamin E on depressive status among 504 elderly residents of a rural community. While cross-sectional analysis revealed no significant findings, longitudinal analysis showed a protective effect of vitamin E on depressive status among men only, after adjustment for age, education and baseline Geriatric Depression Scale score(Reference Shibata, Kumagai and Watanabe31). In the Rotterdam study, Tiemeir et al. investigated the association of blood vitamin E level with depressive symptoms as determined by the Center for Epidemiologic Studies Depression Scale, comparing 262 cases with 459 randomly selected controls. After adjustment for biological and behavioural factors, no significant associations were observed between blood vitamin E level and depressive symptoms or depression among elderly men and women(Reference Tiemeier, Hofman and Kiliaan30). Oishi et al. conducted a cross-sectional study of 279 community-dwelling Japanese elderly persons to evaluate dietary factors, including several antioxidants, in relation to depressive symptoms measured using the Center for Epidemiologic Studies Depression Scale. Among males, the observed OR for the depressive state were 0·36 (95 % CI 0·13, 0·98) in the highest tertile of carotene intake, 0·33 (95 % CI 0·12, 0·93) in the highest tertile of vitamin C intake and 0·33 (95 % CI 0·12, 0·92) in the medium tertile of vitamin E intake(Reference Oishi, Doi and Kawakami26). Among females, similar results were observed, but these results were not statistically significant(Reference Oishi, Doi and Kawakami26). Recently, a longitudinal study using InChianti data found a clear inverse relationship between total serum carotenoids at baseline and the incidence of elevated depressive symptoms after a 6-year follow-up period (OR 0·72, 95 % CI 0·52, 0·99, P= 0·04), adjusting for important confounders. This association has been shown to be partially mediated by inflammatory markers such as IL-1 receptor antagonist(Reference Milaneschi, Bandinelli and Penninx32).
The present findings of an association between total serum carotenoids, β-carotene and lutein+zeaxanthin and elevated depressive symptoms are similar to that study(Reference Milaneschi, Bandinelli and Penninx32), and unlike the study by Oishi et al. (Reference Oishi, Doi and Kawakami26), we did not observe a strong association between depressive symptoms and dietary carotenoids. In addition, while our unadjusted analyses indicated that depressed women had lower levels of vitamins C and E compared with non-depressed women, this association became null after adjustment for potentially confounding factors and other serum antioxidants. These findings indicate that only total carotenoids are associated with a reduced risk of depression especially after reaching a threshold corresponding to the uppermost quartile in our sample (>1·62 μmol/l). Since this effect was not attenuated by dietary or supplemental intake, this suggests that hypothesis A is more likely than hypothesis B. In other words, depressive symptoms caused by external stressors(Reference Moller, Wallin and Knudsen10) trigger oxidative stress which in turn causes reduced concentrations of total carotenoids in serum, independently of dietary intake of this class of antioxidants. The differential effect of total carotenoids as opposed to vitamins C and E should be studied further. Nevertheless, reverse causation whereby lower carotenoid levels among depressed individuals is due to poor diet can only be ruled out in a longitudinal study.
The biological mechanisms behind the putative causal association between antioxidant status and depression, in general, can be outlined as follows: the brain is considered particularly vulnerable to oxidative stress due to its high oxygen consumption, its modest antioxidant defences and its lipid-rich constitution(Reference Halliwell77, Reference Valko, Leibfritz and Moncol78). The brain is also susceptible to secondary and self-perpetuating damage from oxidative cellular injury via the neurotoxic effects of released excitatory amines (mainly glutamate) and Fe, and the activated inflammatory response(Reference Halliwell77). Oxidative stress, an imbalance between the production of reactive oxygen species and the cell's ability to scavenge those species with various antioxidants, has been implicated in the pathogenesis of many chronic diseases, including type 2 diabetes mellitus, CVD, rheumatological disorders and carcinogenesis(Reference Soory11). Oxidative stress induces damage to DNA and cell membranes in both animal experiments(Reference Sies and Stahl17) and human epidemiological studies(Reference Florence79). Many studies have found evidence of an increase in reactive oxygen species with age and their deleterious effects on lipids, especially PUFA. The increase in lipid peroxidation affects the oxidation of structurally important proteins disrupting transmembrane ion movements and cellular metabolic processes(Reference Mason, Walter and Mason80, Reference Tirosh, Kohen and Katzhendler81), the most notable one of which is brain synaptic function.
Furthermore, oxidative damage may cause an autoimmune response by changing the chemical structures of otherwise ubiquitous molecules to generate a variety of new, highly immunogenic epitopes(Reference Maes, Galecki and Chang82). Overall, these oxidative insults lead to a decrease in membrane fluidity, an inactivation of enzymes, ion channels and receptors, and, as a result, alterations of neurotransmission, neuronal function and general brain activity(Reference Mason, Walter and Mason80, Reference Tirosh, Kohen and Katzhendler81).
In animal studies, adding immobilisation stress on rats triggered increased levels of lipid peroxidation and a weakened endogenous antioxidant system in plasma(Reference Liu, Wang and Mori18, Reference Davydov and Shvets19). In mice, adding another form of stressor, a communication box paradigm with electric stress, has been shown to increase lipid peroxidation activity in the brain(Reference Matsumoto, Yobimoto and Huong20). Those stress-induced changes in lipid peroxidation and levels of antioxidants have also been recently shown in human subjects(Reference Cernak, Savic and Kotur21, Reference Tsuboi, Shimoi and Kinae22).
The present study has notable strengths, which include its selection of a large nationally representative sample, the collection of antioxidant status biomarker data and use of a validated questionnaire for assessment of depressive symptoms. However, the present study also suffers from some limitations. First, although use of dietary supplements over a 30 d period was considered a proxy or crude measure for individual micronutrient supplementation, it was previously shown to be directly associated with each of the serum antioxidant status measures, with a clear dose–response relationship, independently of sociodemographic, lifestyle and health-related factors(Reference Beydoun, Shroff and Chen69). Second, because of the study's cross-sectional design, it was not possible to make causal inference through ascertaining temporality of associations. Hence, we were not able to ascertain the temporality of the associations between serum antioxidants, depressive symptoms and oxidative stress, though it was clear that serum carotenoids were a direct reflection of an increased consumption of FV as well as dietary supplement use. Lower intake of fruits, vegetables and fibres may mediate the relationship between lower carotenoid levels and depression. Indeed, depression is directly associated with a reduction in dietary quality, thus a reduction in the consumption of antioxidants(Reference Beydoun, Shroff and Chen69). Finally, residual confounding by unmeasured covariates cannot be totally discounted.
In conclusion, we found a relationship between carotenoids and depressive symptoms with some dose–response. Further investigation is needed through randomised controlled trials and longitudinal studies to examine the nature of the temporality of the relationship. Currently, there is limited evidence to support the role of antioxidants, in general, and carotenoids, in particular, for the prevention of depression or depressive symptoms. Thus, additional intervention research is needed before making any prescriptive or policy recommendations for antioxidants in the prevention of depression.
Acknowledgements
This study was fully supported by the Intramural Research Program of the National Institute on Aging, NIA/NIH/IRP. The contributions of each author are as follows: M. A. B. contributed to the conceptualisation of the study, the literature review, the plan of the analysis, the data management and statistical analysis, and the writing and revision of the manuscript; H. A. B. contributed to the literature search and review, the plan of the analysis, the writing of part of the paper and the revision of the manuscript; A. B. carried out the literature search and review, wrote part of the paper and revised the manuscript; M. R. S. carried out the literature search, drafted the plan of the analysis, wrote part of the paper and revised the manuscript; A. B. Z. drafted the plan of the analysis, wrote part of the paper and revised the manuscript. The authors declare that there is no conflict of interest.



