


Introduction
The broomrapes (Orobanche spp. and Phelipanche spp.) are among the most destructive parasitic plants worldwide (Atsmon et al. Reference Atsmon, Kizel, Eizenberg, Lati and Stafford2025; Parker Reference Parker2009, Reference Parker2012; Zhang et al. Reference Zhang, Cao, Yao, Dong, Chen and Xiao2022), and their management remains a major challenge in agriculture. Branched broomrape [Phelipanche ramosa (L.) Pomel], a well-known species within this group of obligate holoparasites, parasitizes a wide range of crops in several families (Gibot-Leclerc et al. Reference Gibot-Leclerc, Dessaint, Reibel and Le Corre2013; Osipitan et al. Reference Osipitan, Hanson, Goldwasser, Fatino and Mesgaran2021; Stojanova et al. Reference Stojanova, Delourme, Duffé, Delavault and Simier2019), and its parasitism has led to substantial yield losses across a range of host crops and geographies, with reports of 25% average losses in Greek tomato (Solanum lycopersicum L.) fields, 10% to 50% in Cuban tobacco (Nicotiana tabacum L.), and up to 80% in Chilean tomato production (Eizenberg and Goldwasser Reference Eizenberg and Goldwasser2018; Mauromicale et al. Reference Mauromicale, Monaco, Longo and Restuccia2005; Parker Reference Parker2009).
The processing tomato industry, a cornerstone of California’s agricultural economy, has been under increasing threat from the reemergence of P. ramosa in recent years (Fatino and Hanson Reference Fatino and Hanson2022; Osipitan et al. Reference Osipitan, Hanson, Goldwasser, Fatino and Mesgaran2021). California produces more than 95% of the ∼12.8 million Mg of processing tomatoes in the United States, with US$2.01 billion value in 2023 (USDA-NASS 2024), highlighting the substantial economic stakes associated with P. ramosa interference in processing tomato production. This weed, P. ramosa, has been designated an “A list” quarantine pest by the California Department of Food and Agriculture (CDFA 2020), prompting ongoing quarantine and eradication efforts to contain its spread. Despite these efforts, the threat posed by P. ramosa persists, and effective, sustainable control methods are urgently needed to manage this weed and prevent long-term establishment (Fatino and Hanson Reference Fatino and Hanson2025).
Phelipanche ramosa spends a significant portion (∼70%) of its life cycle underground, making early detection and timely intervention challenging. This unique life cycle of P. ramosa, coupled with factors like long seed dormancy and extremely small seed size, complicates control efforts (Cartry et al. Reference Cartry, Steinberg and Gibot-Leclerc2021; Eizenberg and Goldwasser Reference Eizenberg and Goldwasser2018; Osipitan et al. Reference Osipitan, Hanson, Goldwasser, Fatino and Mesgaran2021). Effective P. ramosa management requires precise timing, as the parasite is most vulnerable to control measures during its belowground early developmental stage (Aly et al. Reference Aly, Goldwasser, Eizenberg, Hershenhorn, Golan and Kleifeld2001; Eizenberg et al. Reference Eizenberg, Aly and Cohen2012a; Eizenberg and Goldwasser Reference Eizenberg and Goldwasser2018; Hershenhorn et al. Reference Hershenhorn, Plakhine, Goldwasser, Westwood, Foy and Kleifeld1998, Reference Hershenhorn, Eizenberg, Dor, Kapulnik and Goldwasser2009). A thorough understanding of P. ramosa biology and predictions of the life-cycle stages are essential for optimizing management practices such as herbicide applications.
Predictive models that simulate the growth and development of parasitic weeds based on thermal time have been useful in improving control strategies (Eizenberg et al. Reference Eizenberg, Hershenhorn, Achdari and Ephrath2012b; Eizenberg and Goldwasser Reference Eizenberg and Goldwasser2018). For example, Weibull and logistic functions have been used successfully to model dynamics of Orobanche spp. parasitism in sunflower (Helianthus annuus L.), red clover (Trifolium pratense L.), and potato (Solanum tuberosum L.) based on soil temperature (Eizenberg et al. Reference Eizenberg, Colquhoun and Mallory-Smith2005, Reference Eizenberg, Hershenhorn, Achdari and Ephrath2012b; Hosseini et al. Reference Hosseini, Ahmadvand, Oveisi, Morshedi and Gonzalez-Andujar2017).
Advanced models, such as the PICKIT decision support system (DSS), have been developed in Israel to assist in the management of Egyptian broomrape [Orobanche aegyptiaca Pers.; syn. Phelipanche aegyptiaca (Pers.) Pomel], offering growers insights into the optimal timing for herbicide application (Eizenberg and Goldwasser Reference Eizenberg and Goldwasser2018). Recent field trials in California have tested herbicide programs inspired by Israel’s PICKIT DSS, which successfully manages P. aegyptiaca using the acetolactate synthase–inhibiting herbicides sulfosulfuron and imazapic (Fatino and Hanson Reference Fatino and Hanson2022). However, key differences in climate, cropping systems, and the biology of P. ramosa have limited the direct transferability of this approach. Moreover, although chemigated imazapic showed potential for suppression, it faced regulatory barriers in California, shifting research efforts toward imazamox, which demonstrated similar efficacy but raised concerns about crop safety under certain irrigation conditions (Fatino et al. Reference Fatino, Martin, Dayan and Hanson2024). Rimsulfuron was registered for this use in 2023, but performance can vary among treatment protocols (Fatino and Hanson Reference Fatino and Hanson2025). These findings highlight the relatively narrow margin for error in timing herbicide applications, particularly because P. ramosa spends the majority of its life cycle underground, making it difficult to detect and target early. Therefore, developing California-specific models to predict P. ramosa life stages is critical. Such models could guide optimal herbicide timing and reduce treatment performance variability, ultimately improving the consistency and sustainability of control efforts under California’s unique agronomic and regulatory conditions.
This study aimed to characterize the life cycle of P. ramosa in California processing tomato systems and develop a regionally adapted predictive model based on thermal time accumulation. By integrating growing degree day (GDD) data with field observations of parasite developmental stages, the model was intended to simulate P. ramosa growth dynamics on tomato as the host crop. This predictive framework is intended to inform and optimize the timing of control measures (particularly soil-applied herbicide programs) thereby enhancing the effectiveness of integrated weed management (IWM) strategies for P. ramosa in the high-value processing tomato production system.
Materials and Methods
Greenhouse Study
Rhizotrons Experiment
Two replicated experiments were conducted at the Contained Research Facility (CRF) of the University of California, Davis, during 2021 and 2022. The P. ramosa seeds used in these experiments were originally collected in 2019 from greenhouse-grown plants, which were derived from seeds in field soil collected in 2019 near Woodland, CA. The seeds were stored in dark conditions at 4 C. ‘Red Siberian’ tomato seeds (TomatoFest®, Little River, CA, USA) were sown in plug trays to produce seedlings, while the P. ramosa seeds underwent preconditioning. For preconditioning, approximately 5 mg of P. ramosa seeds were placed on Whatman® filter papers (Global Life Sciences Solutions, Marlborough, MA, USA) in each of the 10 petri dishes (60 mm) and moistened with distilled water; dishes were sealed with Parafilm® and incubated at 25 C in darkness (Isotemp Incubator, Fisher Scientific, Waltham, MA, USA), for approximately 14 d at which time the tomato seedlings were also ready for transplantation.
Nondestructive monitoring of belowground parasitism of tomato by P. ramosa was conducted using 10 custom-built, glass-fronted rhizotrons (Figure 1) constructed from halved PVC tubes (40 cm in diameter and 65 cm in length). The rhizotrons were filled with Redi-Gro Rose and Flower Mix soil (Redi-Gro, Sacramento, CA, USA), a dark, perlite-free potting medium that enhanced the visibility of the early stage of P. ramosa attachment. Two-week-old tomato seedlings were carefully removed from plug trays, their roots washed to remove substrate, and inoculated with preconditioned P. ramosa seeds before transplanting. The remaining P. ramosa seeds from each petri dish were mixed with a small amount of soil and applied to the soil adjacent to the glass panel on both the left and right sides of the rhizotron to ensure seed presence along potential zones of lateral root growth. The CRF greenhouse temperature was maintained at 25 C during the day and 18 C at night. The greenhouse photoperiod was set to 16:8 h (light:dark) for both experimental runs, except during July and August, when natural daylight exceeded this duration and supplemental lighting was not used. Soil temperature at a 10-cm depth was recorded hourly in four of the rhizotrons using a ZL6 Data Logger (METER Group, USA) equipped with four thermal sensors. Plants were manually irrigated and fertigated (Jack’s Professional General Purpose 20–20–20 [N-P-K], Allentown, PA, USA) to prevent water or nutrient stress.
Custom-built glass-fronted rhizotrons used for nondestructive monitoring of Phelipanche ramosa belowground parasitism (Davis, CA). Each rhizotron was constructed from a halved PVC tube (40 cm in diameter and 65 cm in length) and filled with potting soil to facilitate observation of parasite attachment and development on tomato roots. A flowering P. ramosa and several attachments are visible in the image.

Tomato seedlings were transplanted on August 25, 2021, and October 26, 2022, corresponding to two experimental runs. The tomato roots visible through the glass-front rhizotrons were visually inspected to record the number of P. ramosa plants and underground developmental stages (attachment and elongation). Aboveground stages (emergence and full flowering) were also recorded visually, along with survival at all life stages (Figure 1). The recorded data were counts of individuals at each given stage, for example, 20 attachments or 15 individuals at the elongation stage. These stages were monitored as categorical observations. During the first month after attachment initiation, data were collected daily; thereafter, data collection occurred every other day for an additional 3 mo.
Pot Experiment
A separate pot experiment was conducted in the CRF greenhouse in 2022 to specifically observe and document the two aboveground life stages of P. ramosa: emergence and full flowering. Ten 1-gallon (3.78 L) black plastic pots were filled with Redi-Gro Rose and Flower Mix, the same dark, perlite-free potting medium used in the rhizotron study. Preconditioned P. ramosa seeds (2 mg per pot) were mixed directly into the upper soil layer of each pot before transplanting. One 2-wk-old tomato seedling (Red Siberian) was transplanted into each pot on October 26, 2022, which aligned with the second run of the rhizotron experiment. The tomato plants were monitored for a total of 5 mo. Starting from the initial appearance of P. ramosa shoots, aboveground parasitic development was recorded every other day to track the timing and progression of emergence and transition to full flowering. These observations provided additional replicate data for the emergence and full flowering stages in the phenological model. Because the model does not account for mortality between stages, attachment counts were not required; the data were instead normalized within each stage to represent proportional timing, consistent with the rhizotron-based modeling approach.
Field Experiment
To assess the performance of the model, emergence data were collected from two field experiments conducted in a P. ramosa–infested commercial tomato field in Yolo County, CA (38.70°N, 121.82°W) during the 2022 and 2023 growing seasons. The experiments were conducted as part of a broader herbicide evaluation study (Fatino et al. Reference Fatino, Galaz and Hanson2025; Fatino and Hanson Reference Fatino and Hanson2022), and the data used in the present study were obtained from the untreated control plots within these experiments. The soil at this site was classified as a clay loam (25% sand, 42% silt, and 33% clay), with 2.7% organic matter, a pH of 7.2, and an estimated CEC of 23.6 cmolc kg−1. Plots were 30.5-m long on 1.5-m-wide beds. The tomato seedlings (‘HM 58841’) were mechanically transplanted on May 3, 2022, and May 22, 2023. Each bed had one row of tomatoes with plants spaced 30.5 cm apart and was irrigated with a 22.2-mm drip irrigation line buried at a 25-cm depth in the center of the bed. All plots were managed under standard commercial practices, including fertilization, irrigation, and pest control. Preplant herbicides applied across the entire field included S-metolachlor (350 g ai ha−1), pendimethalin (87.3 g ai ha−1), and metribuzin (91.9 g ai ha−1), which are regionally common commercial weed management standards that are not known to control P. ramosa. These plots were arranged in a randomized complete block design with four replications. The P. ramosa emergence was monitored weekly by visual scouting of each plant row from both sides of the planting beds. However, data collection on the emergence of P. ramosa is imperfect due to the challenge of observing the small shoots through the canopy of the unstaked and densely planted processing tomato. Thus, many of the observations were well after initial emergence from the soil surface and typically coincided with the flowering stage. Soil temperature (C) was recorded hourly at the field site using a ZL6 Data Logger (METER Group), with two sensors installed at a 10-cm depth in the tomato root zone.
Model Development
Four distinct developmental stages of P. ramosa were defined based on morphological observations from the rhizotron experiments (Figure 2):
-
1. Attachment: The earliest visible stage, characterized by the formation of small (1- to 2-mm) spherical swellings (tubercles) on host roots. These structures expand into spider-shaped attachments with crown roots but no shoot formation, reaching 10 to 20 mm in diameter. This stage corresponds to what is commonly referred to as the “tubercle” or “nodule” stage (Parker and Riches Reference Parker and Riches1993).
-
2. Elongation: Marked by the emergence of a shoot from the center of the spider-shaped attachment that extends toward the soil surface. This phase represents shoot bud differentiation and elongation beneath the soil before emergence (Pérez-de-Luque et al. Reference Pérez-de-Luque, Sillero, Moral, Cubero and Rubiales2004).
-
3. Emergence: Defined by the appearance of the primary shoot and its branches above the soil surface. This stage marks the transition from subterranean to aboveground development.
-
4. Full flowering: Begins with visible flower development on emerged shoots and continues until the majority of flowers are open.
Phelipanche ramosa growth stages: (A) the earliest visible attachment of P. ramosa on tomato root; (B) attachments expand into spider-shaped structures with crown roots but without shoot formation; (C) elongation: a shoot emerges from the center of the spider-shaped attachment; (D) shoot elongating toward the soil surface; (E) initial emergence; and (F) emerged plant at full flowering.

Data from two independent rhizotron experiments conducted in 2021 and 2022 were used to characterize four distinct P. ramosa growth stages: (1) attachment, (2) elongation, (3) emergence, and (4) full flowering. Frequency distributions of the GDD for these stages were visualized with ridge plots using the geom_density_ridges() function from the ggridges R package, which fits empirical density kernels to the data (Wilke Reference Wilke2021). These rhizotron datasets were then combined with observations from the 2022 pot experiment, which included emergence and flowering only, to develop a unified predictive model of P. ramosa phenology.
The hourly average soil temperature was used to calculate cumulative growing degree days (GDD) after transplanting using the following equation (Equation 1):
 $${\rm{GDD}} = \mathop \sum \limits_{i = 1}^n [{\overline T_i} - {T_{{\rm{base}}}}]$$
where $\overline {{T_i}} $
represents the average temperatures of the ith day from hourly records, and T
base is the tomato base temperature defined as 10 C (Van Der Ploeg and Heuvelink Reference Van der Ploeg and Heuvelink2005; Wolf et al. Reference Wolf, Rudich, Marani and Rekah1986). According to Gibot-Leclerc et al. (Reference Gibot-Leclerc, Corbineau, Sallé and Côme2004), the base temperature for P. ramosa is reported to be 5 C. However, considering that the development of the parasite primarily depends on the host (tomato), a base temperature of 10 C was used in this calculation (Eizenberg and Goldwasser Reference Eizenberg and Goldwasser2018).
$\overline {{T_i}} $
represents the average temperatures of the ith day from hourly records, and T
base is the tomato base temperature defined as 10 C (Van Der Ploeg and Heuvelink Reference Van der Ploeg and Heuvelink2005; Wolf et al. Reference Wolf, Rudich, Marani and Rekah1986). According to Gibot-Leclerc et al. (Reference Gibot-Leclerc, Corbineau, Sallé and Côme2004), the base temperature for P. ramosa is reported to be 5 C. However, considering that the development of the parasite primarily depends on the host (tomato), a base temperature of 10 C was used in this calculation (Eizenberg and Goldwasser Reference Eizenberg and Goldwasser2018).
A modeling approach similar to time-to-event models was used to characterize four growth stages, where time (expressed in GDD from transplanting) to observe a specific event is modeled using a nonlinear function (Onofri et al. Reference Onofri, Mesgaran and Ritz2022). For instance, in the 2022 rhizotron experiment, the first attachment was observed at ∼336 degree days. Because there were a total of 103 attachments in this experiment, 336 degree days represent the GDD for ∼1% (1/103) of attachments. At around 350 degree days, we observed four additional attachments, indicating that a GDD of 350 degree days corresponds to a cumulative attachment of ∼5%, that is, (1 + 4)/103. In fact, what we measured is the length of time, expressed in GDD, required to reach a given percentile of the event of interest. Accordingly, we obtained four sets of GDD values corresponding to the four phenological stages. As these GDDs were highly correlated (see “Results and Discussion”), we were able to develop a very parsimonious model to describe the four stages based primarily on the attachment dynamics. Our framework follows a time-to-event approach in which GDD represents the thermal time required for a given percentile of the event to occur and is therefore treated as the dependent variable, while the percentiles of the event of interest (e.g., attachment) serve as the independent variable. This concept aligns with the statistical distribution-based methodology developed for germination and emergence modeling (Onofri et al. Reference Onofri, Mesgaran, Tei and Cousens2011, Reference Onofri, Benincasa, Mesgaran and Ritz2018, Reference Onofri, Mesgaran and Ritz2022).
Various forms of the Weibull distribution have been widely used in modeling plant phenology, particularly in modeling weed seedling emergence (Marschner et al. Reference Marschner, Colucci, Stup, Westbrook, Brunharo, DiTommaso and Mesgaran2024). The cumulative distribution function for the Weibull model is defined as follows (Mesgaran et al. Reference Mesgaran, Mashhadi, Alizadeh, Hunt, Young and Cousens2013):
 $$p = F\left( t \right) = 1 - {\rm{exp}}{\left( { - {t \over {\rm{\sigma }}}} \right)^{\rm{\lambda }}}$$
where p is the cumulative fractions of an event (e.g., cumulative seedling emergence) as a function of time (t), ${\rm{\sigma }}$
is the scale parameter (with the same unit as t) corresponding to a t value at which p = 63%, and λ is the shape parameter that determines the skewness (shape) of the model. In this model, t is often expressed in GDD or hydrothermal time, for example, when modeling seedling emergence or germination (Eizenberg et al. Reference Eizenberg, Colquhoun and Mallory-Smith2004; Mesgaran et al. Reference Mesgaran, Onofri, Mashhadi and Cousens2017).
${\rm{\sigma }}$
is the scale parameter (with the same unit as t) corresponding to a t value at which p = 63%, and λ is the shape parameter that determines the skewness (shape) of the model. In this model, t is often expressed in GDD or hydrothermal time, for example, when modeling seedling emergence or germination (Eizenberg et al. Reference Eizenberg, Colquhoun and Mallory-Smith2004; Mesgaran et al. Reference Mesgaran, Onofri, Mashhadi and Cousens2017).
However, in our modeling approach, time (GDD) is the dependent variable, and hence the quantile (inverse) of the Weibull function was used (Equation 3):
 $$t = {\rm{\sigma }}\;{( - \log \left( {1 - p} \right))^{{1 \over {\rm{\lambda }}}}}\;$$
which models time, t (in GDD), required to observe a given percentile of an event ( $p \in (0,1$
)). Equation 3 was fit to the relation between cumulative attachment (independent variable) and GDD (dependent variable) and
$p \in (0,1$
)). Equation 3 was fit to the relation between cumulative attachment (independent variable) and GDD (dependent variable) and ${\rm{GD}}{{\rm{D}}_{{\rm{at}}}}$
was used instead of t in Equation 3 for a better presentation of the equation:
${\rm{GD}}{{\rm{D}}_{{\rm{at}}}}$
was used instead of t in Equation 3 for a better presentation of the equation:
 $${\rm{GD}}{{\rm{D}}_{{\rm{at}}}} = {\rm{\sigma }}\;{( - \log \left( {1 - {p_{{\rm{at}}}}} \right))^{{1 \over {\rm{\lambda }}}}}\;$$
Unless otherwise stated, the subscripts “at”, “el”, “em”, and “fl” refer to attachment, elongation, emergence, and full flowering, respectively. Owing to the strong correlation between the raw GDDs of the four growth stages (see “Results and Discussion”), we found that by adding a constant ( ${{\rm{\delta }}_{{\rm{el}}}}$
) to the GDD calculated for attachment, the GDD for elongation (
${{\rm{\delta }}_{{\rm{el}}}}$
) to the GDD calculated for attachment, the GDD for elongation ( ${\rm{GD}}{{\rm{D}}_{{\rm{el}}}}$
) can be accurately estimated:
${\rm{GD}}{{\rm{D}}_{{\rm{el}}}}$
) can be accurately estimated:
 $${\rm{GD}}{{\rm{D}}_{{\rm{el}}}} = {\rm{GD}}{{\rm{D}}_{{\rm{at}}}} + {{\rm{\delta }}_{{\rm{el}}}}$$
For emergence, we found that its progress can be modeled as a multiplier of the elongation GDD, where multiplying a constant b by ${\rm{GD}}{{\rm{D}}_{{\rm{el}}}}$
gave an accurate estimate of the emergence GDD (
${\rm{GD}}{{\rm{D}}_{{\rm{el}}}}$
gave an accurate estimate of the emergence GDD ( ${\rm{GD}}{{\rm{D}}_{{\rm{em}}}}$
):
${\rm{GD}}{{\rm{D}}_{{\rm{em}}}}$
):
 $${\rm{GD}}{{\rm{D}}_{{\rm{em}}}} = b \times {\rm{GD}}{{\rm{D}}_{{\rm{el}}}}$$
Finally, the GDD to full flowering for any given fraction could be estimated by adding a constant ( ${{\rm{\delta }}_{{\rm{fl}}}}$
) to the GDD of emergence:
${{\rm{\delta }}_{{\rm{fl}}}}$
) to the GDD of emergence:
 $${\rm{GD}}{{\rm{D}}_{{\rm{fl}}}} = {\rm{GD}}{{\rm{D}}_{{\rm{em}}}} + {{\rm{\delta }}_{{\rm{fl}}}}$$
The use of additive or multiplicative constants between developmental stages was determined empirically. Several model configurations were tested (e.g., all additive, all multiplicative, or mixed combinations), and the formulation that minimized the root mean-square error (RMSE) between observed and predicted values was selected. Because the number of parameters remained constant across all configurations, the model with the lowest RMSE was considered the best candidate without the need for additional statistical comparison.
Therefore, all four stages of development could be predicted simultaneously based on the dynamics of initial attachment. The model (Equations 4 to 7) was fit to data using the Levenberg-Marquardt nonlinear least-squares algorithm (nlsLM() function) of minpack.lm (v. 1.2-4) package (Elzhov et al. Reference Elzhov, Mullen, Spiess and Bolker2023) in R (R Core Team 2024).
Nonetheless, the equations already provided can also be individually applied to model each phenological stage of P. ramosa as follows:
 $${\rm{Attachment\!\!:}}\,\,\,\,\,\,\,\,\,\,\,\,\,\,\,\,\,{\rm{GD}}{{\rm{D}}_{{\rm{at}}}} = {\rm{\sigma \;}}{( - \log \left( {1 - {p_{{\rm{at}}}}} \right))^{{1 \over {\rm{\lambda }}}}}\,\,\,\,\,\,\,\,\,\,\,\,\,\,\,\,\,\,\,\,\,\,\,\,\,\,\,$$
 $${\rm{Elongation\!\!:}}\,\,\,\,\,\,\,\,\,\,\,\,\,\,\,\,\,\,\,{\rm{GD}}{{\rm{D}}_{{\rm{el}}}} = {\rm{\sigma \;}}{( - \log \left( {1 - {p_{{\rm{el}}}}} \right))^{{1 \over {\rm{\lambda }}}}} + {{\rm{\delta }}_{{\rm{el}}}},\,\,\,\,\,\,\,\,\,\,\,$$
 $$\!\!\!\!{\rm{Emergence\!\!: \,\,\,GD}}{{\rm{D}}_{{\rm{em}}}} = b \times \left( {\sigma \;{{( - \log \left( {1 - {p_{{\rm{em}}}}} \right))}^{{1 \over\rm{\lambda }}}} + {\delta _{{\rm{el}}}}} \right)$$
 $$\,\,{\rm{Full \ flowering\!\!: GD}}{{\rm{D}}_{{\rm{fl}}}} = \left( {b \times \left( {\sigma \;{{( - \log \left( {1 - {p_{{\rm{fl}}}}} \right))}^{{1 \over \rm{\lambda }}}} + {\delta _{{\rm{el}}}}} \right)} \right) + {\delta _{{\rm{fl}}}}$$
These formulations (Equations 8 to 11) allow each stage to be modeled independently without requiring sequential estimation of preceding stages.
The correlation coefficients between raw GDDs of different growth stages of P. ramosa were calculated and visualized using the corrplot package in R (Wei and Simko Reference Wei and Simko2024).
Model Validation
Data collected from the non-treated control plots of two field experiments were used for model validation. Soil temperature, recorded hourly at a 10-cm depth, was used to calculate GDD using Equation 1. Field observations of flowering time during 2022 and 2023 were used to assess the performance of the model in describing this growth stage. Model performance was evaluated visually and by calculating the RMSE. The RMSE values were calculated separately for each study year (2022 and 2023) as well as for both years combined.
Results and Discussion
Phelipanche ramosa Phenology Stages Description and Correlation with GDD
The life cycle of P. ramosa was divided into four distinct stages - attachment, elongation, emergence, and full flowering - based on observations from the rhizotron experiments (Figure 2). The observed GDD-based frequency of these four stages is shown in Figure 3 and can be described as:
-
1. Attachment: The earliest visible stage of P. ramosa development was first observed around 250 GDD and continued through 800 GDD, with a median occurrence around 310 GDD (Figure 3). As development advanced, these structures expanded into spider-shaped forms with crown roots but no shoot formation, reaching diameters of 10–20 mm (Figure 2A and B). Some studies further subdivide this stage based on attachment diameter to capture gradual developmental transitions (Eizenberg et al. Reference Eizenberg, Colquhoun and Mallory-Smith2004; Pérez-de-Luque et al. Reference Pérez-de-Luque, Sillero, Moral, Cubero and Rubiales2004, Reference Pérez-de-Luque, Flores and Rubiales2016).
Figure 3.Relative frequency distribution of Phelipanche ramosa growth stages over growing degree day (GGD) based on two experimental runs of 10 replicate rhizotrons with tomato as the host plant, conducted in the greenhouse at Davis, CA. The curve represents the empirical kernel fit to the data. Thick vertical lines show the location of the median time (GDD) for each growth stage.
 Figure 4.
Survival of Phelipanche ramosa across developmental stages relative to the number of initial attachments, based on two experimental runs with 10 replicate rhizotrons using tomato as the host plant at Davis, CA. Percentages are calculated relative to attachments, while absolute numbers (in parentheses) indicate the number of individuals at each stage.
Figure 5.Scatter plots showing correlations between growing degree days (GGD) of four phenological stages of Phelipanche ramosa. Each plot represents the relationship between two consecutive life stages, based on two experimental runs of 10 replicate rhizotrons with tomato as the host plant at Davis, CA.
Figure 6.A multiphasic model (Equations 4–7), based on an inverse Weibull function, fit (lines) to cumulative data of each Phelipanche ramosa stage (circles). Data are derived from two experimental runs, each consisting of 10 replicate rhizotrons and one run of 10 pots, all with tomato as the host plant, conducted in a greenhouse environment at Davis, CA. See Table 1 for model parameter estimates.
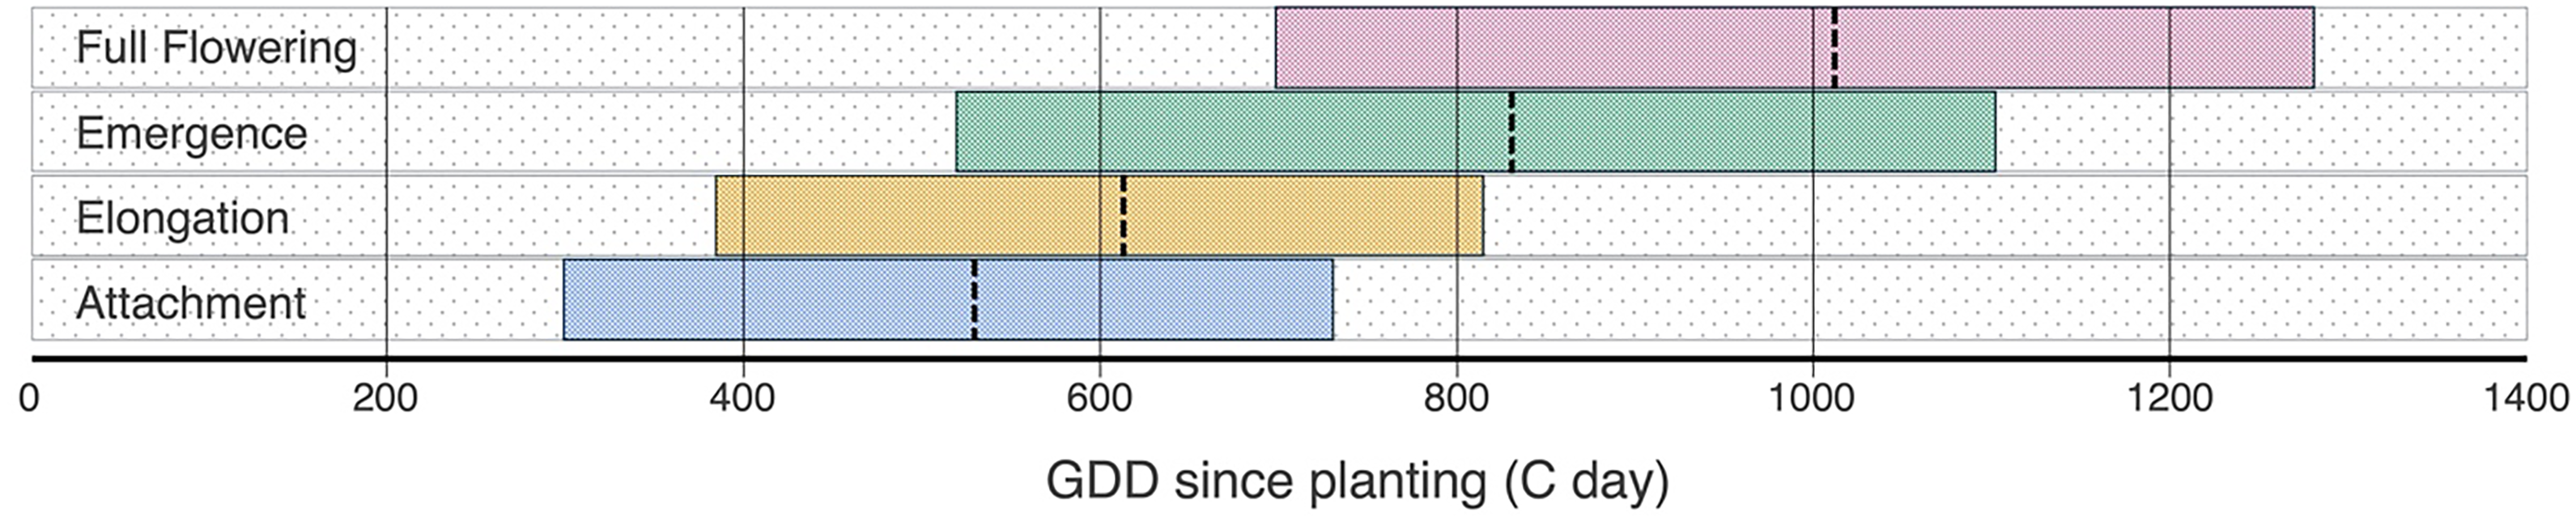
Figure 7.Predicted thermal time in growing degree days (GDD) for the progression of the four phenological stages of Phelipanche ramosa, based on the multiphasic model (Equations 4–7) and parameter estimates in Table 1. Each horizontal box represents the range between the 5% and 95% percentages of a given stage, while dashed vertical lines denote the 50% (median) timing. Data are derived from two experimental runs, each consisting of 10 replicate rhizotrons and one run of 10 pots, all with tomato as the host plant, conducted in a greenhouse environment at Davis, CA.
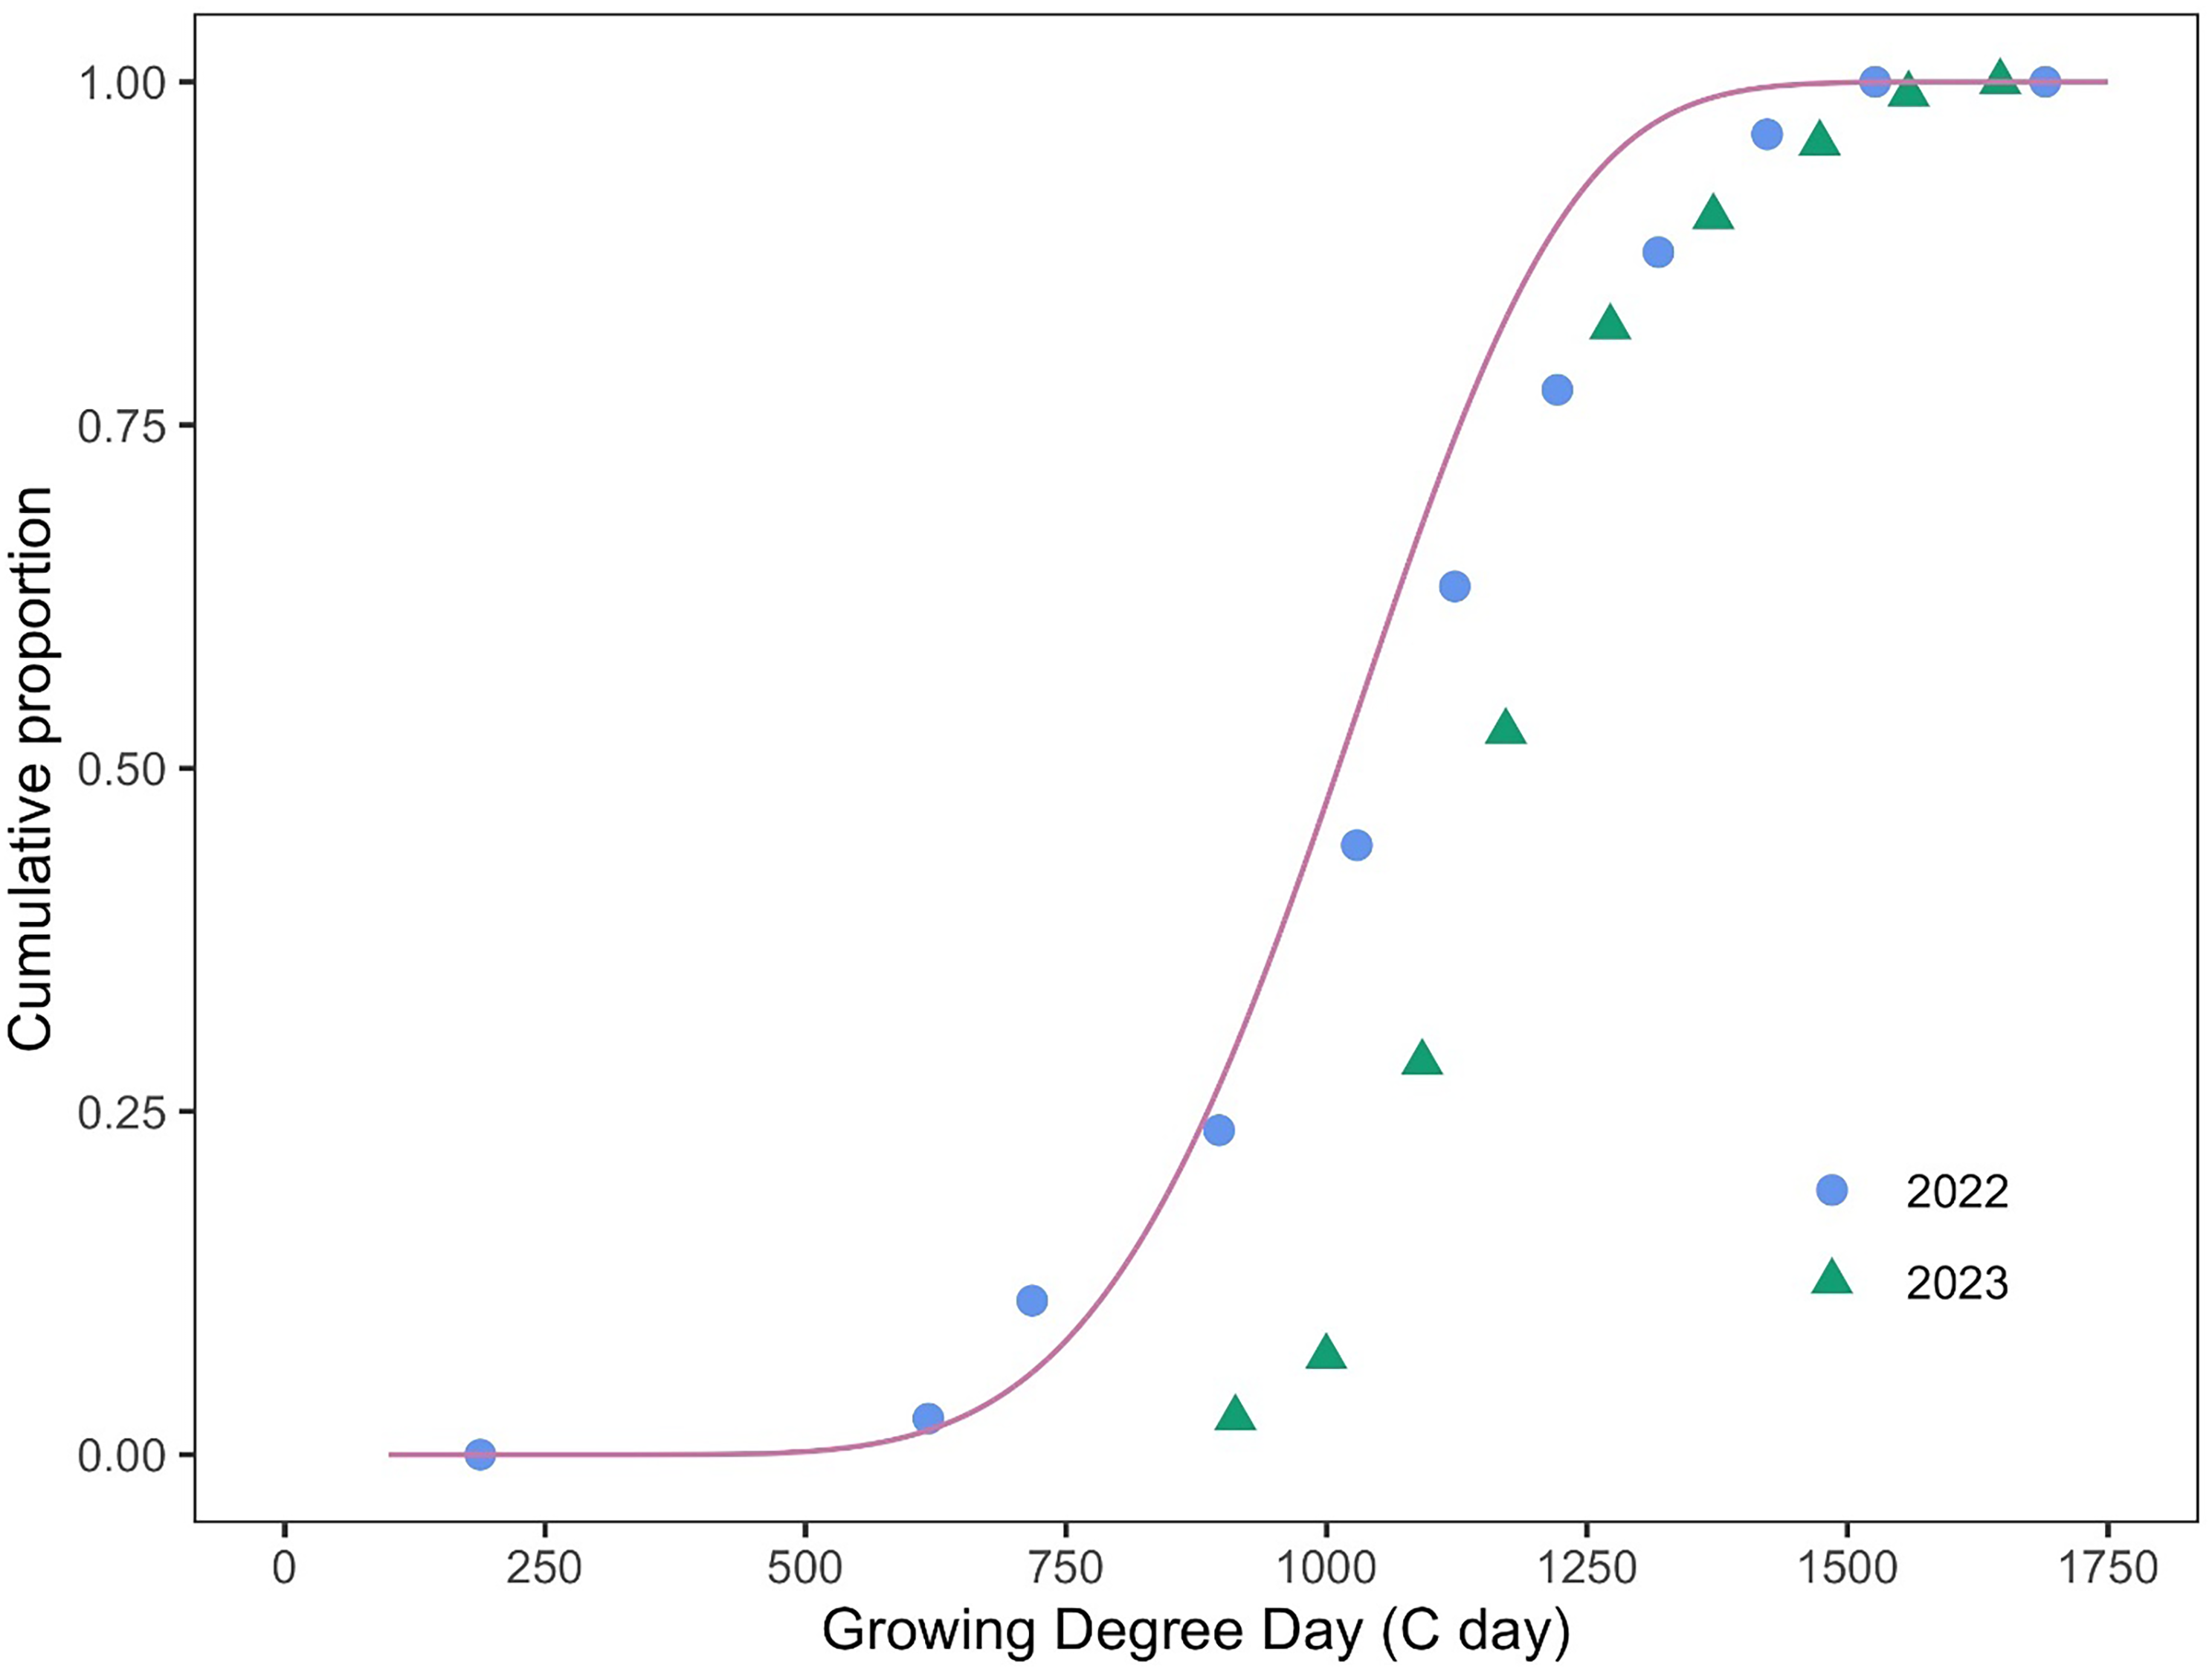
Figure 8.Model performance (Equation 7, Table 1) against independent data of the full flowering stage in Phelipanche ramosa. Observed field data at Woodland, CA, from 2022 and 2023 (solid circles and triangles), extracted from the control treatments, are plotted against the model-predicted full flowering (pink line) to evaluate predictive performance and accuracy. The root mean-square error (RMSE) of the model averaged across years was 142.3 growing degree days (GGD), with values of 74.6 GDD for 2022 and 194.5 GDD for 2023.
-
2. Elongation: This stage began at approximately 320 GDD and continued until 900 GDD, with a median occurrence around 600 GDD (Figure 3). Previous studies have described this phase as “shoot bud differentiation” (Parker and Riches Reference Parker and Riches1993) or “shoot formation” (Pérez-de-Luque et al. Reference Pérez-de-Luque, Sillero, Moral, Cubero and Rubiales2004), highlighting the shoot’s initial growth below the soil before it breaks the surface.
-
3. Emergence: This stage was initiated at around 500 GDD and extended to 1,100 GDD, with a median occurrence at 800 GDD (Figure 3). It marked the transition of P. ramosa from its subterranean phase to active aboveground development.
-
4. Full flowering: Full flowering began around 700 GDD and continued until 1,400 GDD. The median occurrence of full flowering was approximately 1,020 GDD (Figures 2F and 3).


Growth stage definitions have been widely used in parasitic plant studies to better understand the developmental processes of these plants (Cochavi et al. Reference Cochavi, Rubin, Smirnov, Achdari and Eizenberg2016; Eizenberg et al. Reference Eizenberg, Colquhoun and Mallory-Smith2005; Pointurier et al. Reference Pointurier, Gibot-Leclerc, Moreau, Reibel, Vieren and Colbach2021), and each stage’s timing and duration vary depending on the host plant’s growth cycle and environmental conditions (Gibot-Leclerc et al. Reference Gibot-Leclerc, Dessaint, Reibel and Le Corre2013).
A difference was observed between the 2 yr of greenhouse data, with P. ramosa attachment occurring approximately 100 GDD earlier in 2021 compared with 2022, likely due to an earlier planting date in 2021 (Figure 3). The development of P. ramosa is likely influenced by both environmental factors and host–parasite interactions. Although factors such as temperature (Eizenberg et al. Reference Eizenberg, Colquhoun and Mallory-Smith2004) and photoperiod (Holdsworth and Nutman Reference Holdsworth and Nutman1947) influence the life-cycle duration of P. ramosa, the parasite appears to synchronize its biological cycle with that of its host, optimizing resource uptake and reproductive success (Terry Reference Terry1996). Therefore, host development is expected to play a key role in regulating attachment timing.
The young attachment stage represents a vulnerable phase in the P. ramosa life cycle and is therefore a critical target for management interventions, including herbicide applications and biological control using pathogenic agents (Eizenberg et al. Reference Eizenberg, Hershenhorn, Ephrath, Kanampiu, Joel, Gressel and Musselman2013; Fatino et al. Reference Fatino, Galaz and Hanson2025; Fernández-Aparicio et al. Reference Fernández-Aparicio, Reboud and Gibot-Leclerc2016). For chemical treatments that target early attachments, such as chemigation with rimsulfuron (Fatino and Hanson Reference Fatino and Hanson2025), applications should be timed between approximately 200 and 800 GDD (Figure 3) to ensure contact with the seedling before or during initial host root penetration (Eizenberg et al. Reference Eizenberg, Hershenhorn, Ephrath, Kanampiu, Joel, Gressel and Musselman2013). If chemical treatments that target the early attachment stage are delayed until approximately 20% of P. ramosa plants have reached full flowering and are easily observed in the field, most potential attachments will have already occurred, and the treatment is likely to be ineffective. This highlights the necessity of applying chemical control measures well before P. ramosa becomes visible above ground. Currently, remote and proximal sensing technologies are being investigated to differentiate P. ramosa–infected host plants from non-infected ones, enabling early detection before the parasite emerges above the soil (Atsmon et al. Reference Atsmon, Pourreza, Kamiya, Mesgaran, Kizel, Eizenberg and Nisim Lati2024; Narimani et al. Reference Narimani, Pourreza, Moghimi, Farajpoor, Jafarbiglu and Mesgaran2025).
Over the course of a two rhizotron study, 255 P. ramosa attachments were recorded. Of these, 87% (223) progressed to the elongation stage, 63% (162) reached emergence, and 55% (142) successfully advanced to full flowering (Figure 4). Notably, 51% of P. ramosa attachments failed to reach the full flowering stage, with mortality observed at various developmental stages. The highest loss (24%) occurred during the transition from elongation to emergence (Figure 4). A similar mortality pattern has been observed in bean broomrape (Orobanche crenata Forssk.) across various crops, where the majority of attachments failed to reach emergence (Pérez-de-Luque et al. Reference Pérez-de-Luque, Flores and Rubiales2016). The O. crenata development varied across host species, with lower emergence rates and slower progression to later stages in parasitizing faba bean (Vicia faba L.) compared with those attached to grass pea (Lathyrus sativus L.) or lentil (Lens culinaris Medik.) (Pérez-de-Luque et al. Reference Pérez-de-Luque, Flores and Rubiales2016). These differences are likely driven by variations in resource availability and nutrient allocation from the host plant (Arnaud et al. Reference Arnaud, Véronési and Thalouarn1999; Pérez-de-Luque et al. Reference Pérez-de-Luque, Flores and Rubiales2016). In the current study, P. ramosa on tomato exhibited 51% mortality from attachment to full flowering (Figure 4).
Strong correlations were observed between all P. ramosa developmental stages based on cumulative GDD (Figure 5). The degree of correlation diminished slightly as the growth stages progressed. For instance, the correlation between attachment and elongation stages was high at r = 0.99, but the correlation between attachment and the later stage of flowering was lower at r = 0.88 (Figure 5). A strong correlation, such as between the attachment and elongation stages, suggests that the GDD required for one stage (e.g., attachment) is a strong predictor of the GDD required for another stage (e.g., elongation). This correlation simplifies the modeling process by allowing for a reduction in the number of model parameters, as shown in the following section.
Model Development
The multiphasic model successfully described all four phenological stages of P. ramosa (Figure 6) with a remarkably low RMSE of 28 GDD while utilizing only five parameters (Table 1). As shown in Figure 6, the two belowground stages (attachment and elongation) progress in a parallel manner. However, a distinct deviation from this pattern occurs during the transition to the aboveground phase, where the two aboveground stages (emergence and full flowering) once again exhibit parallel progression. This pattern explains why a multiplier (coefficient b) was necessary for modeling emergence, whereas for the other stages, adding constants ( ${{\rm{\delta }}_{{\rm{el}}}}$
and
${{\rm{\delta }}_{{\rm{el}}}}$
and ${{\rm{\delta }}_{{\rm{fl}}}}$
) proved sufficient. We used this model to estimate the GDD required for 5%, 50%, and 95% progress in each of the four growth stages (Figure 7). For example, the model estimated that only 5% of attachments occurred by 300 GDD, while 95% are completed by 730 GDD (Figure 7). Following the attachment, the elongation stage begins about 85 GDD later, as determined by the parameter
${{\rm{\delta }}_{{\rm{fl}}}}$
) proved sufficient. We used this model to estimate the GDD required for 5%, 50%, and 95% progress in each of the four growth stages (Figure 7). For example, the model estimated that only 5% of attachments occurred by 300 GDD, while 95% are completed by 730 GDD (Figure 7). Following the attachment, the elongation stage begins about 85 GDD later, as determined by the parameter ${{\rm{\delta }}_{{\rm{el}}}}$
(Table 1). The estimated GDD thresholds for 5% and 95% elongation were 385 GDD and 815 GDD, respectively (Figure 7). This progression reflects a gradual transition from root attachment to shoot elongation, marking the plant’s shift toward aboveground development.
${{\rm{\delta }}_{{\rm{el}}}}$
(Table 1). The estimated GDD thresholds for 5% and 95% elongation were 385 GDD and 815 GDD, respectively (Figure 7). This progression reflects a gradual transition from root attachment to shoot elongation, marking the plant’s shift toward aboveground development.
According to the parameter ${{\rm{\delta }}_{{\rm{fl}}}} = 180.9{\rm{\;}}\left( {{\rm{SE}}:4.53} \right)$
, once a P. ramosa plant emerges from the soil, it only requires 180.9 GDD to reach the full flowering stage. Based on an average soil temperature of 26 C in July in Woodland, CA (2021 to 2024), this developmental transition can occur in as few as 11 d. This rapid transition to flowering ensures early seed production, allowing P. ramosa to maximize its reproductive success even under variable environmental conditions or host availability (Prider Reference Prider2015).
${{\rm{\delta }}_{{\rm{fl}}}} = 180.9{\rm{\;}}\left( {{\rm{SE}}:4.53} \right)$
, once a P. ramosa plant emerges from the soil, it only requires 180.9 GDD to reach the full flowering stage. Based on an average soil temperature of 26 C in July in Woodland, CA (2021 to 2024), this developmental transition can occur in as few as 11 d. This rapid transition to flowering ensures early seed production, allowing P. ramosa to maximize its reproductive success even under variable environmental conditions or host availability (Prider Reference Prider2015).
The relationship between the field observation and predicted full flowering data is illustrated in Figure 8. The validation results indicate an adequate alignment between the model’s predicted full flowering and the observed data, with a RMSE of 142.3 GDD, averaged across the 2 yr. When evaluated separately, the RMSE was 74.6 GDD for 2022 and 194.5 GDD for 2023.
The GDD required for the first attachment of broomrapes (Orobanche spp. and Phelipanche spp.) varies depending on the species and host plant. For sunflower broomrape (Orobanche cumana Wallr.) on sunflower, the first attachment is estimated at 420 GDD (Eizenberg et al. Reference Eizenberg, Hershenhorn, Achdari and Ephrath2012b), whereas for lesser broomrape (Orobanche minor Sm.) on red clover, attachment occurs later at 750 GDD (Eizenberg et al. Reference Eizenberg, Colquhoun and Mallory-Smith2004). In P. aegyptiaca parasitizing tomato, attachment has been observed as early as 200 GDD after transplanting (Eizenberg and Goldwasser Reference Eizenberg and Goldwasser2018; Ephrath et al. Reference Ephrath, Hershenhorn, Achdari, Bringer and Eizenberg2012). For P. aegyptiaca on potato, attachment was reported at 614 GDD (Hosseini et al. Reference Hosseini, Ahmadvand, Oveisi, Morshedi and Gonzalez-Andujar2017). An experiment on P. ramosa infecting tomato recorded attachment occurring between 120 and 250 GDD (Díaz et al. Reference Díaz, Norambuena and López-Granados2006). In this experiment, the first attachment of P. ramosa occurred around 250 GDD. These variations highlight the species-specific and host-dependent nature of P. ramosa attachment, emphasizing the importance of accurate GDD estimation for predicting parasitic plant development and optimizing management strategies.
Modeling techniques have been employed to gain valuable insights into P. ramosa life cycle and behavior, facilitating improved decision making for implementing control measures. The GDD emerges as a valuable tool for describing the parasite’s development and determining its life cycle. The predicted model fits very well with the 2022 data of the field, but to a lesser extent with the 2023 data. The field emergence (full flowering stage) of P. ramosa differed between years and began later in 2023, resulting in a more pronounced deviation from model predictions. The reason for this slower development in 2023 remains unclear, but one potential factor could be the later planting date, which was 19 d later than in 2022. In recent planting date studies conducted at the same location, P. ramosa emergence was dramatically reduced with later transplanting. It is possible that high temperatures induce secondary dormancy in P. ramosa seeds or otherwise influence late-season phenological development, a hypothesis that we are currently investigating. Previous reports have documented variations in Orobanche spp. infestation based on the crop type and environmental conditions (Pérez-de-Luque et al. Reference Pérez-de-Luque, Sillero, Moral, Cubero and Rubiales2004).
Various nonlinear regression models have been employed to predict the attachment of Phelipanche spp. and Orobanche spp. based on thermal time. Orobanche cumana and P. aegyptiaca parasitism in sunflower and potato demonstrated a strong correlation with soil temperature when the Weibull model was used (Eizenberg et al. Reference Eizenberg, Hershenhorn, Achdari and Ephrath2012b; Hosseini et al. Reference Hosseini, Ahmadvand, Oveisi, Morshedi and Gonzalez-Andujar2017). A three-parameter logistic function was used for the prediction of O. minor growing stages in red clover (Eizenberg et al. Reference Eizenberg, Colquhoun and Mallory-Smith2005) and O. cumana and P. aegyptiaca in sunflower (Ephrath and Eizenberg Reference Ephrath and Eizenberg2010). The developmental progression of the parasite growth stages showed a strong correlation with the GDD, and variations were found among different host crops (Pérez-de-Luque et al. Reference Pérez-de-Luque, Flores and Rubiales2016). For example, modeling developmental stages of O. crenata by a three-parameter logistic function showed a significant difference for three crops, faba bean, grass pea, and lentil (Pérez-de-Luque et al. Reference Pérez-de-Luque, Flores and Rubiales2016). Almost all previous models have typically described only a single stage of the parasitism at a time. This study is the first attempt to develop a multiphasic model capable of describing multiple stages of a parasitic plant, yet maintaining relative simplicity.
Given the early timing of attachment and its significance for control, predictive modeling becomes a powerful tool for planning management practices. The model developed in this study provides a framework for forecasting key developmental stages of P. ramosa based on GDD, allowing for timely and targeted interventions. Similar to the PICKIT DSS developed for P. aegyptiaca in Israel, which integrates predictive models to optimize the timing and method of herbicide application (Eizenberg and Goldwasser Reference Eizenberg and Goldwasser2018), this model has the potential to serve as the foundation for a DSS tailored to P. ramosa in California. By anticipating the optimal window for control (e.g., 300 to 730 GDD for attachment), such a system could support the use of preemergence, postemergence, or chemigation strategies to maximize herbicide efficacy and minimize crop damage. This GDD-based approach could be readily adapted for use in precision agriculture and IWM programs.
The parameter estimates for the inverse Weibull model (Equations 4–7) fit to data from four growth stages of Phelipanche ramosa. a

a Data were obtained from greenhouse experiments (two experimental runs of 10 replicate rhizotrons and 10 pots) at Davis, CA.
b ${\rm{\sigma }}$
is the scale parameter corresponding to a growing degree day (GGD) value at which cumulative attachment is 63%, λ is the shape parameter that determines the skewness (shape) of the model,
${\rm{\sigma }}$
is the scale parameter corresponding to a growing degree day (GGD) value at which cumulative attachment is 63%, λ is the shape parameter that determines the skewness (shape) of the model, ${{\rm{\delta }}_{{\rm{em}}}}$
represents the constant added to the calculated GDD for attachment to estimate the onset of the elongation stage,
${{\rm{\delta }}_{{\rm{em}}}}$
represents the constant added to the calculated GDD for attachment to estimate the onset of the elongation stage, ${{\rm{\delta }}_{{\rm{fl}}}}$
represents the constant added to the calculated GDD for emergence to estimate the onset of the full flowering stage, and b is the multiplier for calculating emergence GDD from that of elongation. Values in parentheses are the standard errors.
${{\rm{\delta }}_{{\rm{fl}}}}$
represents the constant added to the calculated GDD for emergence to estimate the onset of the full flowering stage, and b is the multiplier for calculating emergence GDD from that of elongation. Values in parentheses are the standard errors.
c RMSE is root mean-square error in GDD.
Acknowledgments
The authors gratefully acknowledge the contributions and assistance of Adewale Osipitan, as well as the students and research staff for their help and support, particularly those who contributed to field data collection.
Funding statement
This research was supported by the California Tomato Research Institute and the California Department of Food and Agriculture Specialty Crop Block Grant Program (19-0001-043-SF to MBM and 22-0001-031-SF to BDH), as well as by USDA-NIFA (CA-D-PLS-2874-RR to MBM).
Competing interests
The authors declare no conflicts of interest.
Acknowledgment of AI assistance
Language editing of this manuscript was assisted by ChatGPT (OpenAI), and the authors reviewed and take full responsibility for all content and interpretations.


 Open access