


1 Introduction
Scottish Gaelic is almost universally described as displaying a system of nine monophthongal vowel qualities, including two back unrounded vowels and a contrast between open-mid and close-mid vowels (e.g. Clement Reference Clement1984, MacAulay Reference MacAulay1992a, Gillies Reference Gillies2009, Bosch Reference Bosch, Moray and Michelle2010a), both of which set it apart from most dialects of its sister language Irish (e.g. Ó Dochartaigh Reference Ó Dochartaigh1984, Reference Ó Dochartaigh1992; Mac Eoin Reference Mac Eoin and Ball1993; Ó Baoill Reference Ó Baoill2009). This paper describes the vowel system of the dialect of Ness, at the far northern end of Lewis in the Outer Hebrides, which differs from the general Scottish Gaelic system in several important ways. As well as lacking some of the phonemic contrasts found in other dialects, several vowels display allophonic variation in Ness that has not been investigated instrumentally, and in some cases has not been reported in the existing literature for this or any other dialect of Scottish Gaelic. First of all, the short front vowels /i e/ both display tense and lax allophones whose distribution is governed by the following consonantal environment. While the existence of some sort of conditioned variation in the quality of /i/ has been reported before for various dialects, the tense and lax allophones of /e/ in Ness correspond in quality to two vowels that are generally considered to be phonemically contrastive in Scottish Gaelic. Secondly, both short and long /a(ː)/ display a retracted allophone when adjacent to a velarised consonant, which has also been reported at some other locations. This paper first lays out the findings of a descriptive study of the Ness Gaelic vowel system based on traditional linguistic fieldwork methods, and then presents an acoustic study of nine speakers that provides instrumental support for these findings and explores the nature of the aforementioned allophonic oppositions.
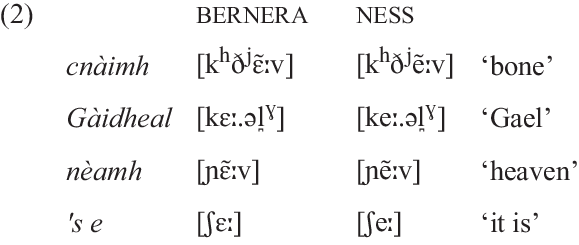
Although other Lewis dialects are thoroughly documented by Borgstrøm (Reference Borgstrøm1940), Oftedal (Reference Oftedal1956) and Ladefoged et al. (Reference Ladefoged, Ladefoged, Turk, Hind and Skilton1998), very little literature exists on the Ness dialect specifically, apart from some brief notes in Borgstrøm (Reference Borgstrøm1940) and an examination of one speaker by Nance & Ó Maolalaigh (Reference Nance and Maolalaigh2021). Ness is also represented by survey point (henceforth pt.) 1 in the Survey of the Gaelic Dialects of Scotland (SGDS; Ó Dochartaigh Reference Ó Dochartaigh1994–7). This study therefore provides vital documentation of the vowel system of a dialect that is, in certain ways, somewhat divergent from existing descriptions of Scottish Gaelic.
The categoricity of these oppositions is investigated by searching for bimodality in the acoustic distribution of tokens (following Bermúdez-Otero & Trousdale Reference Bermúdez-Otero and Trousdale2011), and it is concluded that speakers vary as to whether tense and lax /i e/ can be shown to be represented by two discrete categories in the phonological grammar. In the case of retraction of /a(ː)/, it is found that similar inter-speaker variation occurs in the long vowel, while no speakers display categoricity in the short vowel. This variation is framed in terms of the diachronic process of stabilisation, in the context of the life cycle of phonological processes (Bermúdez-Otero Reference Bermúdez-Otero and Paul2007, Reference Bermúdez-Otero, Patrick and Salmons2015).
The phonetic grounding of the allophonic patterns reported here is also considered. While the retraction of /a(ː)/ next to velarised consonants can probably be attributed to co-articulation, the motivation for the distribution of tense and lax /i e/ is less obvious. A solution is offered based on a generalised version of Storme’s (Reference Storme2019) analysis of the laxing of vowels in closed syllables in languages such as French, where laxing serves to enhance the perceptual distinctiveness of an immediately-following supra-glottal consonant by allowing for more distinctive formant transitions.
The structure of the paper is as follows. Section 2 provides background information on the general Lewis dialect of Scottish Gaelic on the basis of the existing literature. Section 3 presents a descriptive study of the vowel system of Ness Gaelic, while Section 4 presents an acoustic study that supports these findings. Section 5 provides some general discussion and Section 6 concludes the paper.
2 Background
Scottish Gaelic belongs to the Goidelic branch of the Celtic languages and is closely related to Irish and Manx. It is spoken mostly in northwestern Scotland by speakers numbering approximately 60,000 according to the 2011 census (National Records of Scotland 2015). Although it has undergone rapid decline since the early 20th century (see e.g. MacKinnon Reference MacKinnon, Moray and Michelle2010), it nevertheless remained the dominant language acquired by children among the native population of the Outer Hebrides until around the 1980s. For detailed sociolinguistic analysis of the current state of the language, see Ó Giollagáin et al. (Reference Ó Giollagáin, Camshron, Moireach, Ó Curnáin, Caimbeul, MacDonald and Péterváry2020).
This paper is concerned with a dialect spoken in Lewis, which comprises the northern two thirds of the northernmost island in the Outer Hebrides. The dialect of Bernera, on the west side of Lewis, is described in detail by Borgstrøm (Reference Borgstrøm1940) and revisited more recently in a phonetic study by Ladefoged et al. (Reference Ladefoged, Ladefoged, Turk, Hind and Skilton1998). Meanwhile, Oftedal (Reference Oftedal1956) provides a detailed description of the dialect of Leurbost in the east. The dialect of Ness, at the far northern end of Lewis – which forms the basis of the present study – is the subject of a few pages of notes in Borgstrøm (Reference Borgstrøm1940); additionally, Nance & Ó Maolalaigh (Reference Nance and Maolalaigh2021) provide an overview of the sound system of one Ness speaker. Finally, SGDS includes survey data from nine speakers at various locations around Lewis. This section outlines the sound inventory of the general Lewis Gaelic system, which is mostly agreed upon across these sources, discussing consonants in Section 2.1 and vowels in Section 2.2.
2.1 Lewis Gaelic consonants
The consonant phonemes of Lewis Gaelic are shown in Table 1. When non-initial, the aspirated stops are pre-aspirated rather than post-aspirated. This is realised throughout Lewis as a short [h]-like period of glottal frication preceding the stop closure, i.e. [hp ht̪ htj hk hkj], or as devoicing of an immediately-preceding sonorant. The ordinary short glottal pre-aspiration found at all places of articulation in Lewis distinguishes this dialect from the majority of other dialects of Scottish Gaelic, which instead mostly have [hp ht̪ htj xk xjkj] or [xp xt̪ xtj xk xjkj] (see Borgstrøm Reference Borgstrøm1974; Ó Baoill Reference Ó Baoill1980; Bosch Reference Bosch, Christina, Matthieu, Aled Llion, Edyta and Sarah2010b; Clayton Reference Clayton2010: 36ff.; Ó Maolalaigh Reference Ó Maolalaigh2010 for overviews of this variation).Footnote 1
An important characteristic of all Scottish Gaelic dialects is the existence of contrastive palatalised and non-palatalised series of coronal and dorsal consonants. Palatalisation on /lj ðj/ is very weak, and many other authors transcribe /l ð/, but morphological alternations clearly show that they belong to the palatalised series from a phonological point of view (see e.g. Morrison Reference Morrison2020: 138ff.). Another important characteristic is the existence of a series of velarised coronal sonorants /n̪ɣ l̪ɣ rɣ/, although initial /n̪ɣ/ is at most very weakly velarised in Lewis and may be indistinguishable from /n/ in this position; Nance & Ó Maolalaigh (Reference Nance and Maolalaigh2021) also report that /rɣ/ is merged with /ɾ/ for their Ness speaker. In Lewis Gaelic there is also a series of velarised retroflex consonants [ʈɣ ʂɣ ɳɣ ɭɣ], which are normally assumed to represent underlying clusters /rɣt̪ rɣs rɣn̪ɣ rɣl̪ɣ/.Footnote 2
The consonant phonemes of Lewis Gaelic.
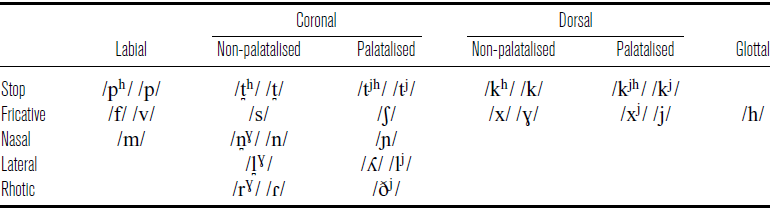
There are several important differences between the transcription system employed here and those in Ladefoged et al. (Reference Ladefoged, Ladefoged, Turk, Hind and Skilton1998) and Nance & Ó Maolalaigh (Reference Nance and Maolalaigh2021). First of all, a front glide may occur between a labial consonant and a stressed non-front vowel in Lewis Gaelic, which I transcribe as a separate segment [j], e.g. beò [pjɔː] ‘alive’, in agreement with Borgstrøm’s (Reference Borgstrøm1940: 18) description. On the other hand, Ladefoged et al. and Nance & Ó Maolalaigh choose to transcribe this as palatalisation, e.g. [pjɔː], resulting in an additional series of palatalised labials with a highly restricted surface distribution (for debate over the status of palatalisation in labials, see Fraser Reference Fraser1938: 95; Borgstrøm Reference Borgstrøm1940: 18–19; MacAulay Reference MacAulay1962: 174–175, Reference MacAulay1966; Oftedal Reference Oftedal1963; Jackson Reference Jackson and Wolfgang1967; Ternes Reference Ternes1973: 32ff.).Footnote 3 Secondly, I follow Ladefoged et al. in choosing not to explicitly mark affrication in [tjh tj], which are transcribed [tʃh tʃ] by Nance & Ó Maolalaigh, and I settle on [kjh kj xj j] for the palatalised dorsal series where Ladefoged et al. have [khj kj Ç ɣj] and Nance & Ó Maolalaigh have [ch c Ç j]. Thirdly, I transcribe pure palatals [ɲ ʎ] where Ladefoged et al. have [nj lj] and Nance & Ó Maolalaigh have [n̪j l̪j] – while these sounds often have some degree of alveolar and/or denti-alveolar contact, I consider the most salient component of their articulation to be that occurring in the palatal region. Finally, I transcribe velarised retroflex consonants as [ʈɣ], etc. in agreement with Borgstrøm (Reference Borgstrøm1940: 75–76) and Oftedal’s (Reference Oftedal1956: 126–127) descriptions, while Ladefoged et al. and Nance & Ó Maolalaigh transcribe [ʈ] and [ɽʈ], etc. respectively. Where appropriate, transcriptions from these and other sources are normalised to this system when cited in this paper.
2.2 Lewis Gaelic vowels
The monophthongal vowel phonemes of Lewis Gaelic are shown in Table 2. Only stressed vowels are considered in this paper, and stress occurs on the initial syllable unless otherwise indicated. In addition to the monophthongs in Table 2, there are also opening diphthongs /iə ia uə ua/ and numerous closing diphthongs such as /ui ei ɤi ai ɔu au/, although the exact inventory of closing diphthongs varies within Lewis. A characteristic feature of the Lewis dialect is the existence of two highly distinct allophones of /u(ː)/: a true back vowel [u(ː)] next to velarised consonants, and a more central vowel [ʉ(ː)] elsewhere. This has been confirmed instrumentally by Ladefoged et al. (Reference Ladefoged, Ladefoged, Turk, Hind and Skilton1998) and Nance (Reference Nance, Wai-Sum and Eric2011). When short, the true back allophone also occurs before /x/ as well as, in Leurbost and Ness at least, before /j/. Impressionistically, /ɯ(ː)/ also tends to be more central than back in Lewis Gaelic, and not fully close.
The monophthongal vowel phonemes of Lewis Gaelic.
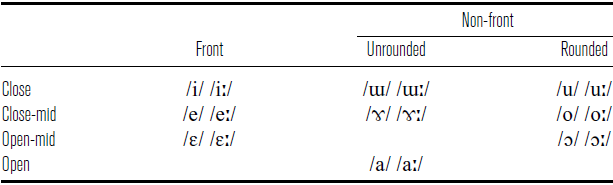
Most stressed vowels and diphthongs may also occur with nasalisation. Vowel nasalisation in Scottish Gaelic is a complex phenomenon: stressed vowels display two degrees of nasalisation when next to nasal consonants, interpreted by Morrison (Reference Morrison2021) as categorical phonological nasalisation and gradient phonetic nasalisation, and may also be independently nasalised outwith this environment. I will mark nasalisation in this paper only where I believe it to be categorical and phonological.
Unstressed vowels display a reduced inventory /ə a ɔ/, of which the first has a conditioned variant [i] before certain palatalised consonants. Word-finally or before hiatus, unstressed [i u] also occur which can be taken to represent underlying /əj əv/.
3 Ness Gaelic vowels: Descriptive study
Ness, at the far northern end of Lewis, consists of a dense cluster of around 14 villages mostly strung along a main road from southwest to northeast for a distance of around 6 km. The total population of the district is approximately 1,000 today, although it reached several times that number at its peak during the 19th century. In this section I provide the results of a descriptive study of the vowel system of Ness Gaelic conducted using traditional linguistic fieldwork methods, based primarily on highly detailed observation of the speech of one male informant born in 1952 in the village of Adabrock (speaker S1 in the experiment described in Section 4). My findings are discussed in the context of the existing literature on Ness Gaelic and on Lewis Gaelic more generally.
The primary informant was born and raised in Ness but spent a considerable portion of his adult life living on the Scottish mainland before returning to the same village. Forms were elicited and transcribed by the author, who is not a native speaker of Scottish Gaelic, by means of informal conversation in English on a day-to-day basis over a number of years. This was complemented on occasion by passive observation of the spontaneous speech of other members of the community.
The consonant system of Ness differs little from the general Lewis system described in Section 2.1. My primary informant frequently pronounces /n̪ɣ/ as a retroflex [ɳɣ] in non-initial position – such a pronunciation has never been reported before for Ness, but it is occasionally recorded in SGDS for speakers on the east coast of Lewis, e.g. chunnaic [xuɳɣikj] ‘see.pst’ (pt. 6, Tolsta), ceannaich [kjhɑɳɣixj] ‘buy’ (pt. 7, Point).
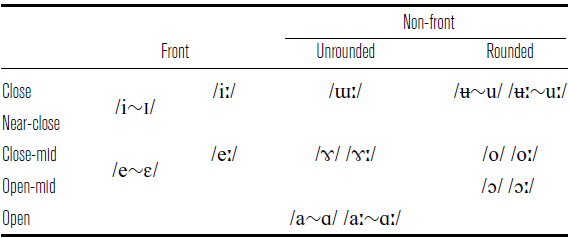
This section is concerned with the vowel system of Ness Gaelic, which differs in various ways from the general Lewis system described in Section 2.2. For comparison with the general Lewis system in Table 2, the Ness system described here is summarised in Table 3. The absence of /ɯ ɛː/ will be discussed in Section 3.1 and Section 3.2 respectively, the tense and lax allophones of /i e/ in Section 3.3 and Section 3.4 respectively, and retraction of /a(ː)/ in Section 3.5.
The monophthongal vowel phonemes of Ness Gaelic.
3.1 Absence of /ɯ/
As a distinctive characteristic of the Ness dialect, Borgstrøm (Reference Borgstrøm1940: 120) reports that wherever Bernera has short [ɯ] followed by a palatalised consonant, Ness has [i]:
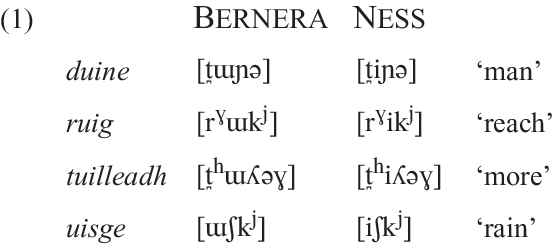
This is in agreement with my own observations for Ness Gaelic. As it happens, [ɯ] in Bernera is nearly always followed by a palatalised consonant, meaning that Borgstrøm’s rule covers the vast majority of occurrences of this vowel while theoretically leaving unchanged only a small number of forms that display it in other environments, e.g. Bernera turadh [t̪hɯɾəɣ] ‘dry weather’. However, as will be discussed in Section 3.3, the lax allophone of /i/ in Ness Gaelic is often retracted so far as to occupy the region of vowel space where /ɯ/ would be expected to occur. Since the vowel of turadh, and the few other items that Borgstrøm’s rule fails to cover, occurs in an environment where /i/ would be expected to display its lax allophone, it can in fact simply be assigned to underlying /i/ in the context of the Ness system. The same can probably be said for the handul of forms that are recorded in SGDS with [ɯ] in Ness, e.g. lugha [l̪ɣɯɣə] ‘small.cmp’.Footnote 4 I therefore consider /ɯ/ to be fully merged with /i/ in this system, even though vowels that I regard as positional allophones of /i/ may often be somewhat [ɯ]-like in quality.
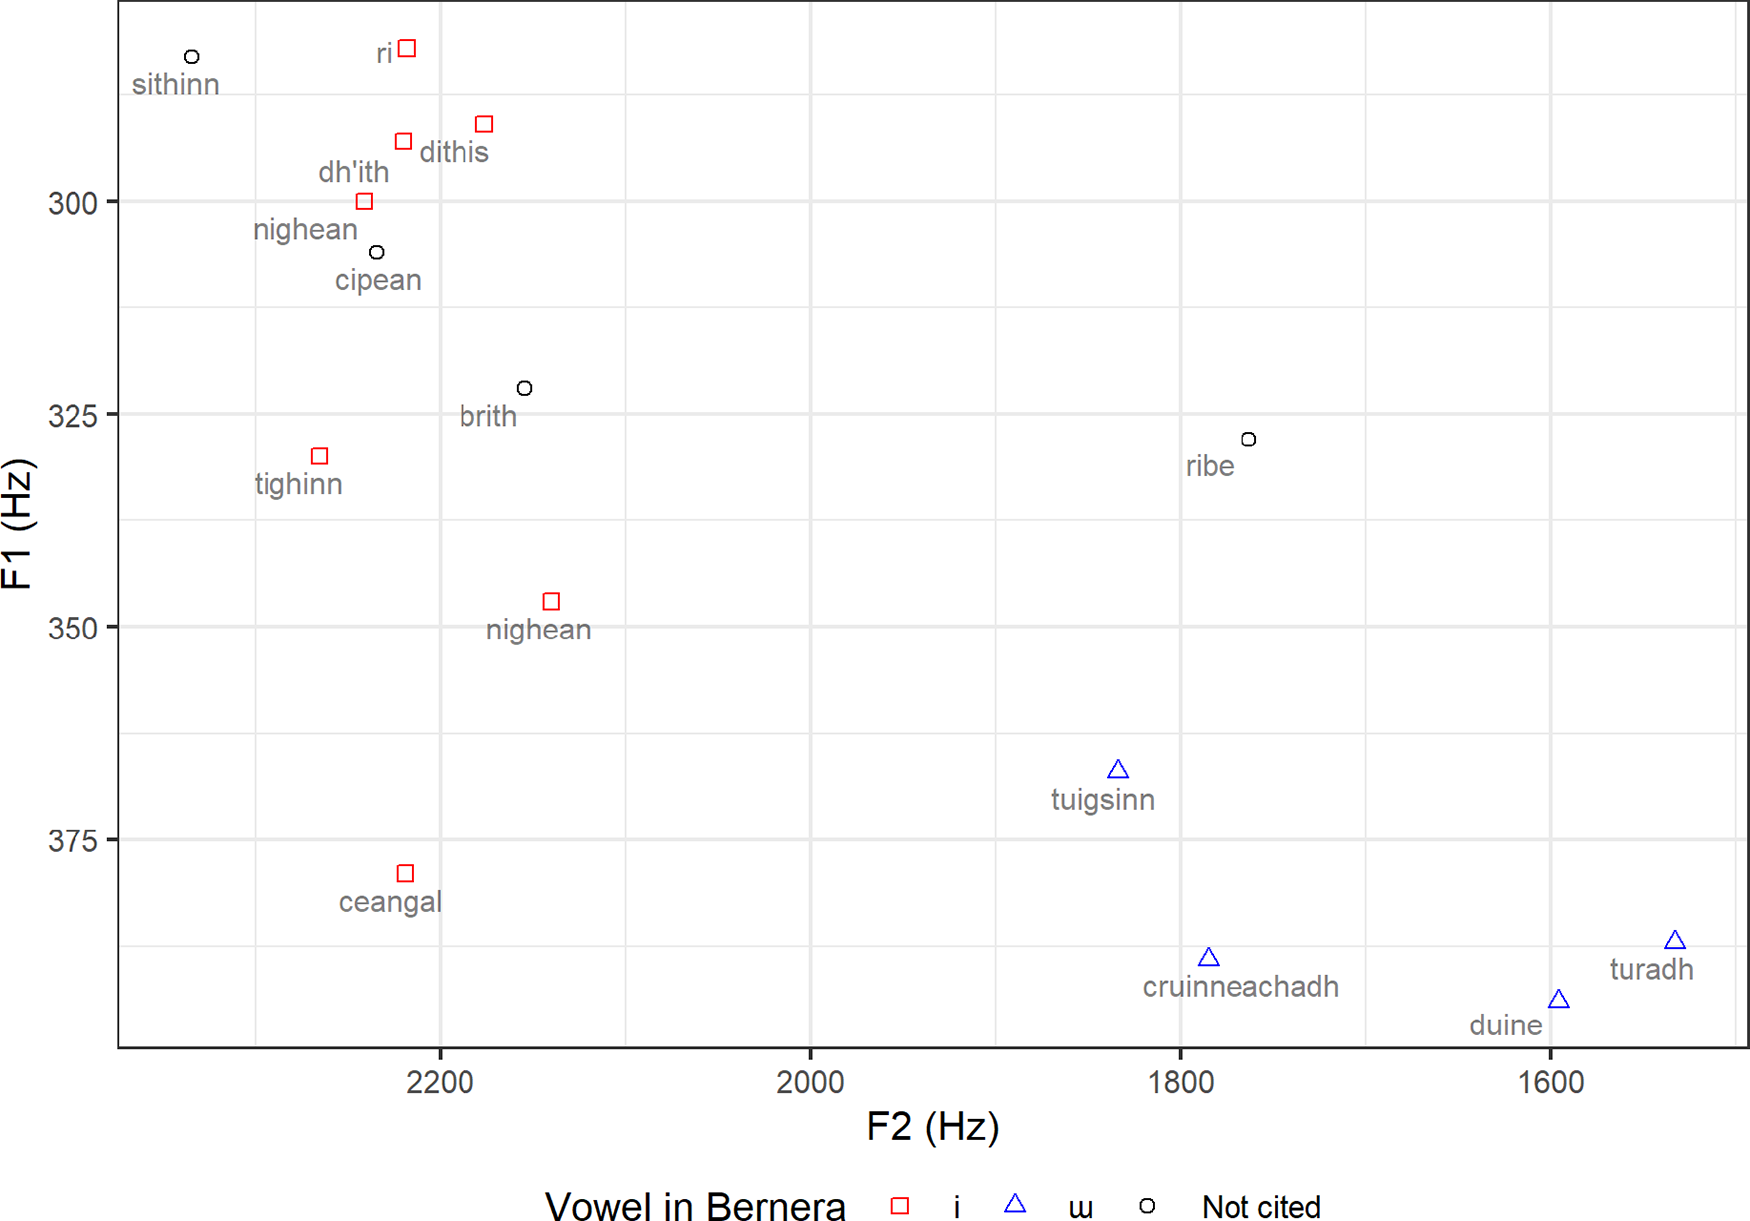
Nance & Ó Maolalaigh (Reference Nance and Maolalaigh2021) nevertheless report two phonemes /i/ and /ɯ/ in their Ness speaker. Figure 1, produced using their supplementary audio files, shows the distribution in vowel space of all forms containing either of these vowels in a stressed syllable. Where applicable, these are coded according to the vowel with which they are recorded for Bernera by Borgstrøm (Reference Borgstrøm1940). As far as it is possible to tell, this speaker perfectly reproduces the Bernera system – note in particular the occurrence of [ɯ] before palatalised consonants in cruinneachadh [khɾɯɲəxəɣ] ‘gather.vn’, duine [t̪ɯɲə] ‘man’, tuigsinn [t̪hɯkjʃiɲ] ‘understand.vn’, in stark contradiction to the characteristic Ness system established by Borgstrøm (Reference Borgstrøm1940), analysis of SGDS data, and my own observations.Footnote 5 It therefore appears that their speaker actually resists this Ness merger.
The distribution in vowel space of forms containing either /i/ or /ɯ/ in Nance & Ó Maolalaigh (Reference Nance and Maolalaigh2021), coded according to the vowel with which they are recorded for Bernera by Borgstrøm (Reference Borgstrøm1940).
3.2 Absence of /₵ː/
Borgstrøm (Reference Borgstrøm1940: 27ff.) records two distinct long mid front vowels /eː ɛː/ in Bernera, and makes no mention of any deviation from this in his notes on Ness. However, both Borgstrøm (Reference Borgstrøm1940: 27) and Oftedal (Reference Oftedal1956: 57) note that long /ɛː/ is somewhat higher than its short counterpart /ɛ/, encroaching on the territory of /eː/, and this is confirmed instrumentally for Bernera by Ladefoged et al. (Reference Ladefoged, Ladefoged, Turk, Hind and Skilton1998: 27). According to my own observations, and in agreement with Nance & Ó Maolalaigh’s (Reference Nance and Maolalaigh2021: 268) findings, /ɛː/ is in fact fully merged with /eː/ in the present-day Ness dialect.Footnote 6 Items that Borgstrøm (Reference Borgstrøm1940) records with /ɛː/ in Bernera therefore have /eː/ in Ness:
To the best of my knowledge, [ɛː] is recorded in SGDS only twice for Ness, in two instances of the word cnàimh. The handful of words which display [ɛː] elsewhere in Lewis are nearly always transcribed with [eː] not only in Ness but also in Tolsta (pt. 6) and Point (pt. 7) on the east coast, suggesting a near-total loss of [ɛː] in a contiguous area covering the northeast quarter of the island. Outwith Lewis, a similar absence of [ɛː] is reported by Dorian (Reference Dorian1978: 58) for East Sutherland.
3.3 Tense and lax /i/
Many of the more detailed descriptions of Scottish Gaelic dialects (Borgstrøm Reference Borgstrøm1940: 29, 120, 136; Reference Borgstrøm1941: 18, 71; Oftedal Reference Oftedal1956: 64; Dorian Reference Dorian1978: 56; Wentworth Reference Wentworth2005: 172ff.) report the existence of a somewhat retracted and lowered allophone of /i/ in various environments, most commonly before certain non-palatalised consonants. As far as I am aware, however, this has not been investigated instrumentally. Borgstrøm (Reference Borgstrøm1940: 120) singles out Ness as a dialect in which this retraction and lowering is particularly strong – so much so that he introduces a separate symbol ı for it in his transcription system, alongside ordinary i. According to my own observations, the fully close front allophone, which I refer to as tense and transcribe [i], occurs in Environment A (see example (3a) below). On the other hand, the retracted and lowered allophone, which I refer to as lax and transcribe [ɪ], occurs in Environment B (see (3b)). Note that /lj ðj/ do not appear to pattern with other palatalised consonants in this respect – recall from Section 2.1 that they are normally pronounced with only very weak palatalisation:
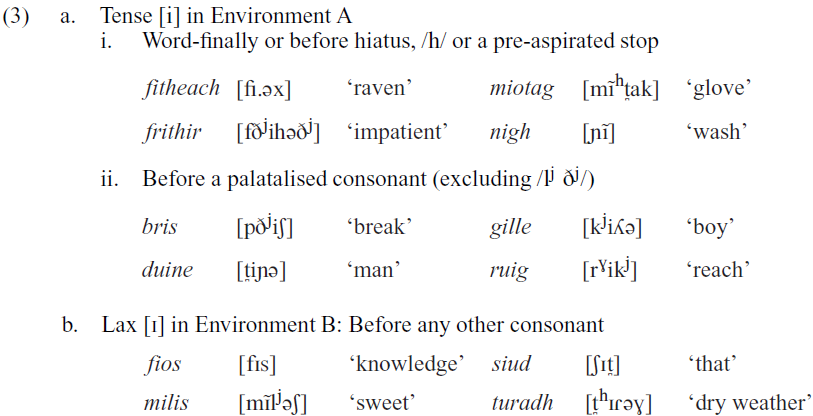
The distribution reported by Borgstrøm (Reference Borgstrøm1940: 120) in his notes on Ness is largely consistent with the pattern in (3), although few examples are provided.
While the tense allophone [i] is similar in quality to long /iː/, the lax allophone [ɪ] often approaches the quality of long /ɯː/ (which is, recall from Section 2.2, more central than back in Lewis, and not fully close). As stated in Section 3.1, a form such as turadh [t̪hɪɾəɣ] ‘dry weather’ can therefore be considered to display the lax allophone of /i/ in the context of the Ness system, even though its vowel likely differs little in quality from Bernera /ɯ/.
Although the rule in (3) can be taken as a starting point, speakers appear to vary slightly with respect to the precise conditioning environments of the two allophones. This means that lax [ɪ] may occasionally be heard in Environment A and tense [i] in Environment B – although the requirement that only tense [i] occur word-finally or before hiatus, /h/ or a pre-aspirated stop appears to be absolute. One informant asserted that the lexical distribution of tense and lax /i/ differs from one end of Ness to the other, with some words, e.g. giomach [kjiməx ∼ kjɪməx] ‘lobster’, displaying tense [i] at the southwest end and lax [ɪ] at the northeast end. This would result in [ɪ] being more frequent in general in the northeast of Ness. He explicitly associated this variation with the catchment areas of the two primary schools that served the area until the early 2000s: one in Cross serving the southwestern half of Ness, and one in Lionel serving the northeastern half.
There are 61 forms recorded in SGDS with either [i] or [ɪ] in Ness. Of the 55 that contain Environment A, 48 have tense [i] and just seven have lax [ɪ]. Conversely, of the six that contain Environment B, all except one have lax [ɪ]. This speaker therefore displays a clear trend towards the pattern in (3), but does not maintain it consistently. Lax [ɪ] is occasionally recorded at other locations in Lewis as well, albeit less frequently than in Ness, and among these the Tolsta (pt. 6), Carloway (pt. 4) and Leurbost (pt. 8) speakers display traces of a similar trend.
3.4 Tense and lax /e/
/e ɛ/ are generally considered to be phonemically contrastive in Scottish Gaelic, although both Borgstrøm (Reference Borgstrøm1940: 12) and Oftedal (Reference Oftedal1956: 58) note that the opposition is neutralised in a large number of environments: for instance, in Bernera, only /e/ occurs between palatalised consonants and only /ɛ/ before /t̪ s x ɾ/. Ó Maolalaigh (Reference Ó Maolalaigh1997) explores whether they can be reduced to a single phoneme in the system described by Oftedal (Reference Oftedal1956) for Leurbost, and concludes that it is not possible. Borgstrøm’s (Reference Borgstrøm1940: 119) notes on Ness suggest that the relative lexical distribution of these two vowels is roughly as in Bernera. According to my own observations, however, they are in perfect complementary distribution in the Ness system, representing two positional allophones of a single phoneme which I will label /e/. [e], which I refer to as the tense allophone, occurs in Environment A, while [ɛ], which I refer to as lax, occurs in Environment B. Note that this rule is identical to the rule for /i/, except that a following palatalised consonant does not cause tenseness:
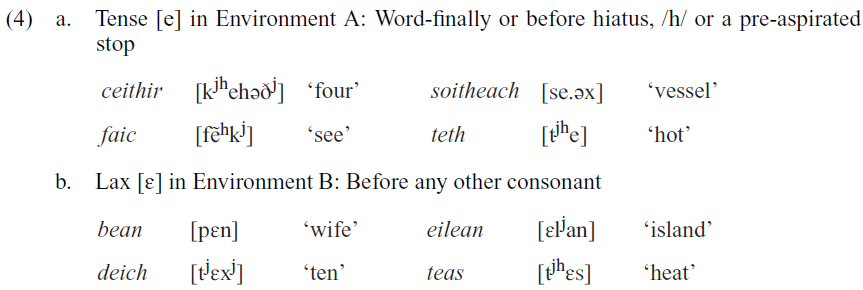
While the tense allophone [e] is similar in quality to long /eː/, the lax allophone [ɛ] is lower and less fully front than this. For some Ness speakers – especially my primary informant – the lax allophone tends to be retracted so far as to render it indistinguishable in quality from /ɤ/. Borgstrøm (Reference Borgstrøm1940: 119) reports this retraction in Ness only before [k], e.g. beag [pɤk] ‘small’, freagairt [fɾɤkəʈɣ] ‘answer’, where other dialects normally have [e]. The former of these two words occurs in SGDS, where it is transcribed with [ɤ] in both Ness and Point (pt. 7) and with [e] elsewhere in Lewis. Nance & Ó Maolalaigh’s (Reference Nance and Maolalaigh2021) Ness speaker has [ɤ] in both these words as well as (nasalised) before [ɣ] in teanga [tjhɤ̃ɣə] ‘tongue’, which has [ɛ̃] in other dialects but usually [ɪ̃] in Ness (see Borgstrøm Reference Borgstrøm1940: 239).Footnote 7
There are 42 forms recorded in SGDS with either [e] or [ɛ] in Ness. Of the 21 that contain Environment A, 16 have tense [e] and five have lax [ɛ]. Conversely, of the 21 that contain Environment B, all except one have lax [ɛ]. As with tense and lax /i/ in the previous section, this speaker therefore displays a clear trend towards the pattern in (4) but does not maintain it consistently. Outwith Ness, speakers throughout the east coast of Lewis (pts. 6–9) show similar traces of this pattern while those on the west side (pts. 2–5) do not.
Nance & Ó Maolalaigh (Reference Nance and Maolalaigh2021) report two phonemes /e/ and /ɛ/ in their Ness speaker, and do not discuss their relative distribution. However, as shown in Figure 2, produced using their supplementary audio files, the distribution of these two vowels almost totally conforms to the pattern in (4). The only clear exception is teinne [tjheɲə] ‘tight.cmp’, which has tense [e] in Environment B (although aige [ɛkjə] ‘at.3sg.m’ displays an anomalous value for F2 as a result of poor formant tracking caused by creaky voice).Footnote 8
The distribution in vowel space of forms containing either /e/ or /ɛ/ in Nance & Ó Maolalaigh (Reference Nance and Maolalaigh2021), coded for Environment A or B.

3.5 Retraction of /a(ː)/
Borgstrøm (Reference Borgstrøm1940: 119) notes that /a(ː)/ in the Ness dialect, unlike that of Bernera, is characterised by the occurrence of a retracted allophone [ɑ(ː)] when it occurs next to velarised consonants. This is parallel to the allophony in /u(ː)/ throughout Lewis mentioned in Section 2.2, except that a following /x/ or /j/ does not trigger retraction in /a/. According to my own observations, this retraction occurs next to all velarised consonants except initial /n̪ɣ/ – recall that this consonant displays at most very weak velarisation in initial position in Lewis. It therefore occurs before (but not after) /n̪ɣ/, before and after /l̪ɣ/, and before and after /rɣ/. Additionally, it occurs before the velarised retroflex consonants [ʈɣ ʂɣ ɳɣ ɭɣ] representing underlying clusters /rɣt̪ rɣs rɣn̪ɣ rɣl̪ɣ/. Note that long /aː/ is either extremely rare or non-existent before /n̪ɣ/, so no examples are given:
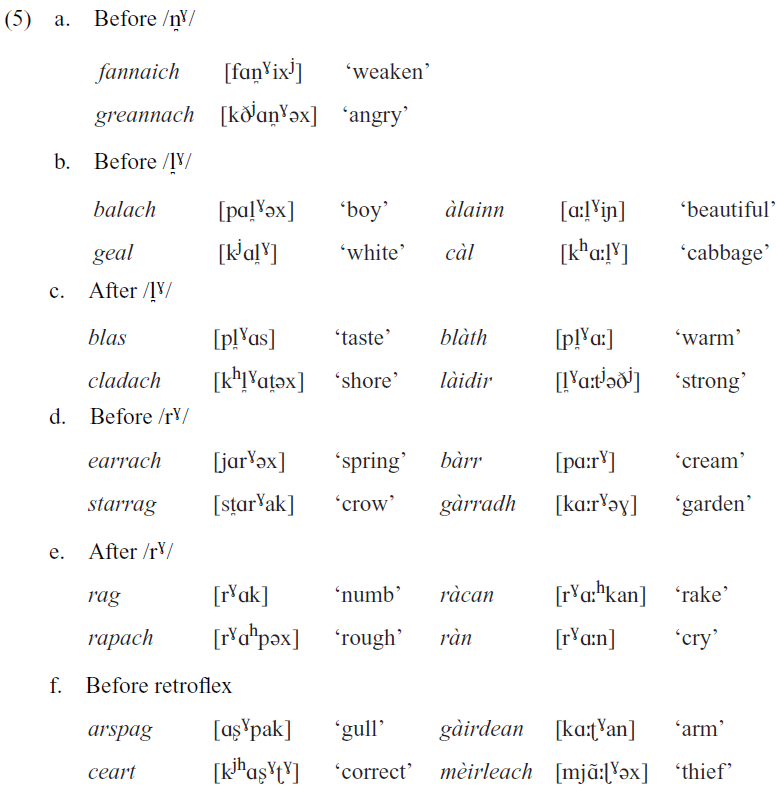
In the case of initial /rɣ/, the lenition mutation leads to alternations in the vowel, compare dà ràcan [t̪aː ɾaːhkan] ‘two rakes’. Morphological palatalisation of final /l̪ɣ/ can also trigger alternations, compare càil [khaːlj] ‘cabbage.gen’.Footnote 9
The degree of retraction may vary slightly on the basis of both environment and vowel length. For example, retraction tends to be more clearly audible next to /l̪ɣ/ than in other environments, and more so in long /aː/ than short /a/. Although centralised [ä(ː)] may therefore capture the quality of the vowel more accurately than fully back [ɑ(ː)] in some cases, I have been unable to perceive such a three-way distinction with sufficient consistency, and so will employ the symbol [ɑ(ː)] for any retracted allophone of /a(ː)/.
This retraction is also noted by Nance & Ó Maolalaigh (Reference Nance and Maolalaigh2021; 268) for their Ness speaker. A similar opposition is also reported by Oftedal (Reference Oftedal1956: 52–53) for Leurbost, and SGDS shows frequent retraction at all locations in Lewis except for the speaker nearest to Bernera (pt. 4, Carloway). It therefore appears to be fairly characteristic of Lewis Gaelic in general, except for, coincidentally, the area where Borgstrøm (Reference Borgstrøm1940) happened to carry out the majority of his fieldwork. Retraction in the same environment is also reported in some other locations further afield, e.g. Applecross in Ross-shire (Ternes Reference Ternes1973: 146).
There is one further environment in which this retraction may occur in Ness Gaelic. While the pre-aspirated stop /hk/ and the cluster /xk/ are normally distinct in Lewis Gaelic, e.g. tac [t̪hahk] ‘farm’, seac [ʃahk] ‘wither’ vs. tachd [t̪haxk] ‘choke’, seachd [ʃaxk] ‘seven’, some Ness speakers – including my primary informant – merge both to [hk]. When this occurs, the contrast appears to be transferred to a preceding short /a/, which is retracted before underlying /xk/, e.g. tac [t̪hahk], seac [ʃahk] vs. tachd [t̪hɑhk], seachd [ʃɑhk]. This is in spite of the fact that retraction does not occur before [xk] in those speakers who do have this cluster, and no speakers have retraction of /a/ before [x] in general. Note that long /aː/ is extremely rare before /xk/, so it is not clear whether it would be subject to retraction under the same circumstances.
4 Ness Gaelic vowels: Acoustic study
In this section I describe an acoustic study of the Ness Gaelic vowel system that investigates instrumentally the allophonic patterns described in Section 3. The aims of the experiment are discussed in Section 4.1, the methods in Section 4.2 and the results in Section 4.3.
4.1 Aims
The first aim of this study is to document the vowels of Ness Gaelic, focusing on those parts where it differs from the general Lewis system described in Section 2.2. Since the rounded vowels of Ness Gaelic display no noteworthy departure from this system, only unrounded vowels will be investigated.
The second aim of this study is to determine whether the patterns of allophonic variation described in Section 3 for /i e a(ː)/ in Ness Gaelic, which are hitherto based almost entirely upon auditory observation, can be verified acoustically by measuring formant values. It is predicted that /i e/ will display higher F1 and lower F2 in Environment B than Environment A (as defined separately for the two vowels), because the lax allophone of each vowel is retracted and lowered with respect to the tense allophone. It is also predicted that /a(ː)/ will display lower F2 in retracting environments than in non-retracting environments.
The third aim is to search for evidence of bimodality in the distribution of tense vs. lax /i/, tense vs. lax /e/, and retracted vs. non-retracted /a(ː)/ in individual speakers, and determine whether or not all speakers display similar patterns to one another. Bermúdez-Otero & Trousdale (Reference Bermúdez-Otero and Trousdale2011: 7), in a study of diachronic pathways of sound change, argue that bimodality in the distribution of tokens can be taken as conclusive evidence that two allophones are encoded as discrete phonological categories in a speaker’s grammar (although the absence of bimodality does not necessarily entail the absence of categoricity). This is supported by experimental evidence presented by Maye, Werker & Gerken (Reference Maye, Werker and Gerken2002) showing that infants learn to discriminate tokens located at the endpoints of an acoustic continuum if and only if the tokens on which they are trained are distributed bimodally, which suggests that bimodality in the input is what prompts the learner to set up two discrete categories during acquisition. If tokens of tense and lax /i e/, or retracted and non-retracted /a(ː)/, are distributed bimodally in vowel space, then I take this as an indication that the rule governing their distribution belongs to the categorical phonology rather than the gradient phonetics. For those speakers for whom it is possible to identify two separate categories, it will also be noted whether or not all items fall into the expected category according to the rules given in Section 3. However, no systematic attempt will be made to redefine those rules in the event that a particular speaker deviates from the expected distribution, since this would require the use of a very large number of different stimuli.
As noted in Section 3.3, there is anecdotal evidence of microdialectal variation within Ness with respect to the lexical distribution of tense and lax /i/, with lax [ɪ] more frequent at the northeast end than the southwest end. Systematic investigation of this variation is not an aim of this study, since this would require a large number of speakers and stimuli, but it will be noted whether or not any inter-speaker variation in the distribution of tense and lax /i/ conforms to such a pattern.
4.2 Method
4.2.1 Speakers
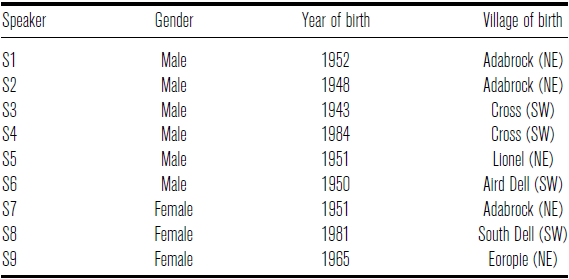
Table 4 provides details of the nine native speakers of Scottish Gaelic who took part in the study, including gender, year of birth and village of birth (marked according to whether the village is located in the southwestern half of Ness or the northeastern half). All were born and raised in Ness and lived there at the time of recording, although speakers S1, S2 and S6 had spent a significant portion of their adult lives living on the Scottish mainland – a factor which Ladefoged et al. (Reference Ladefoged, Ladefoged, Turk, Hind and Skilton1998: 25) suggest may lie behind the loss of vocalic distinctions among some of their speakers. All used Scottish Gaelic on a daily basis either at home, in the community, or both. Speakers S1, S2 and S7 are siblings. All were sufficiently literate in Scottish Gaelic to participate in the study without difficulty.
The nine speakers who took part in the study.
4.2.2 Word list
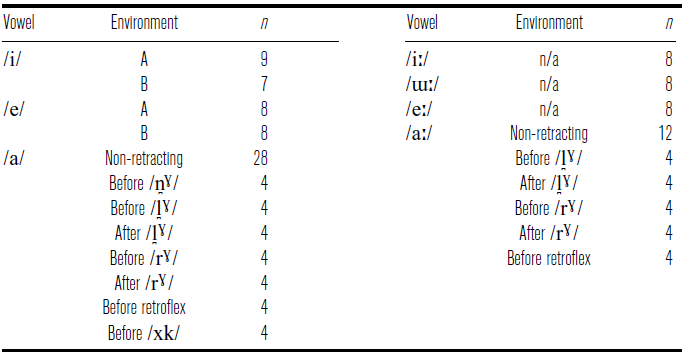
The word list consisted of 144 stimuli containing the vowels /i(ː) ɯː e(ː) a(ː)/ in the stressed syllable. This set of vowels represents all of the unrounded monophthongal vowel phonemes of Ness Gaelic except for /ɤ(ː)/, which is relatively rare and is not included in this study. Effort was made to include as wide a variety of phonological environments as possible in each case, in order to avoid artificially inducing bimodality into the token distributions.
The numerical distribution of the target vowels among the 144 stimuli is shown in Table 5. After the recording of the first three participants, S1, S2 and S7, two problematic stimuli were replaced with similar words for the remaining participants. The full word list can be found in the appendix.
The distribution of target vowels in the 144 stimuli used in the word list.
Each participant was presented with a different iteration of the randomised word list. Stimuli were presented in Scottish Gaelic orthography, alongside an English gloss to provide clarification in the event that a participant failed to recognise a word from its orthographic form. Participants were instructed to read aloud each stimulus three times within the carrier sentence ‘S e … a chanas mi [ʃe … ə xanəs mi] ‘It is … that I will say’.
4.2.3 Recording
Recording was carried out in Praat (Boersma Reference Boersma2001) in a quiet room using a Logitech AK5370 USB desktop microphone connected directly to a computer. Altogether 3,865 tokens were successfully obtained, after a small number (less than 1%) were discarded either due to unclear pronunciation or due to an unexpected pronunciation that did not contain any of the target vowels (conversely, a handful of extra tokens were gained ‘for free’ when speakers accidentally read a word four times instead of three).Footnote 10
4.2.4 Analysis
The start and end points of the target vowel of each token were determined using waveforms and spectrograms in Praat, and the quality of the vowel was identified auditorily. This was carried out at the phonemic level only, i.e. no attempt was made to auditorily distinguish between tense and lax /i e/ or between retracted and non-retracted /a(ː)/, since the categoricity of these oppositions is in question. Nasalisation was ignored, because it displays very little interaction with vowel quality in this dialect. Each token was coded for vowel and, where relevant, for environment. If a token was produced with an unexpected vowel, it was retained and coded accordingly as long as the vowel used belonged to the set of target vowels – for instance, several speakers pronounced teanga ‘tongue’ as [tjhɛ̃ɣə] instead of expected [tjhɪ̃ɣə], so these tokens were coded with /e/ instead of /i/. Any relevant variant pronunciations by individual speakers are noted in the appendix.Footnote 11 Tokens representing underlying /xk/ after /a/ were coded separately only for those speakers who realised it as [hk], since it is only in this situation that it counts as a retracting environment; for those who realised it as [xk], this was coded as a non-retracting environment just like any other following [x].
Values for F1 and F2 were extracted using a Praat script at the temporal midpoint of each target vowel.Footnote 12 Formant tracking was then checked and, where necessary, corrected manually using Formant Editor (Sóskuthy Reference Sóskuthy2015). A number of tokens were discarded at this stage due to unclear formants, and a further two tokens from speaker S7 were later discarded due to extreme outlying values for F1 even after attempted manual correction. Ultimately, 3,811 useable tokens were retained. Formant values were then normalised for each speaker using the S-centroid method following Fabricius, Watt & Johnson (Reference Fabricius, Dominic and Daniel2009), taking each speaker’s mean F1 and F2 for long /iː aː/ to represent the top-left and bottom-centre corners of the vowel space respectively. Vowel durations were extracted using a Praat script by calculating the interval between the start and end point of each target vowel.
Because the laxing of /i e/ involves both retraction and lowering of the vowel, the tense and lax allophones are expected to be distributed diagonally in F1–F2 space relative to one another. A combination of both F1 and F2 values is therefore required in order to quantify the degree of tenseness displayed by a given token. This can be achieved by defining the tenseness T of a token of /i/ or /e/ as follows, where c is a constant whose value reflects the relative contribution of F1 and F2 to tenseness:
(6) $\qquad\ T=c\times \textrm{F2}_{norm}-\textrm{F1}_{norm}$
Since the tenseness of a token of /i e/ appears to be conditioned by its environment, the most intuitively meaningful measure of tenseness is the one that most effectively differentiates between tokens in Environment A and those in Environment B. The optimum value of c can therefore be taken to be that which minimises the variance of T in the individual environments A and B relative to the overall variance of T in both environments combined. It is therefore the value that minimises the ratio r defined as follows:
(7) $\qquad\ r = (n_{A} \times \textrm{Var}(T_{A}) + n_{B} \times \textrm{Var}(T_{B})) / (n \times \textrm{Var}(T))$
If tokens in environments A and B are distributed as expected, plotting r against potential values of c will reveal a single minimum in r at a particular value of c. Using this method, separate values c i and c e were determined for /i/ and /e/ respectively, based on the combined data of all nine speakers. This provided a means to quantify i-tenseness T i and e-tenseness T e , such that lax tokens of /i e/ will display lower values of T i and T e respectively than tense tokens.
Because the retraction of /a(ː)/ almost exclusively affects F2, the value of F2 norm alone was used to quantify the degree of retraction displayed by a given token. Retracted tokens will display lower values of F2 norm than non-retracted tokens.
Linear mixed effects (LME) models were fitted in R (R Core Team 2017) using the lme4 (Bates et al. Reference Bates, Mächler [Maechler], Bolker and Walker2015) and lmerTest (Kuznetsova, Brockhoff & Christensen Reference Kuznetsova, Brockhoff and Christensen2017) packages in order to determine whether the patterns of allophonic variation described in Section 3 for /i e a(ː)/ in Ness Gaelic can be confirmed statistically. Bimodality in the distribution of tokens was provisionally identified through visual inspection of density plots, and then investigated statistically by means of Hartigan’s Dip Test for multimodality using the diptest package (Maechler Reference Maechler [Mächler]2016).
4.3 Results
4.3.1 Overall vowel system
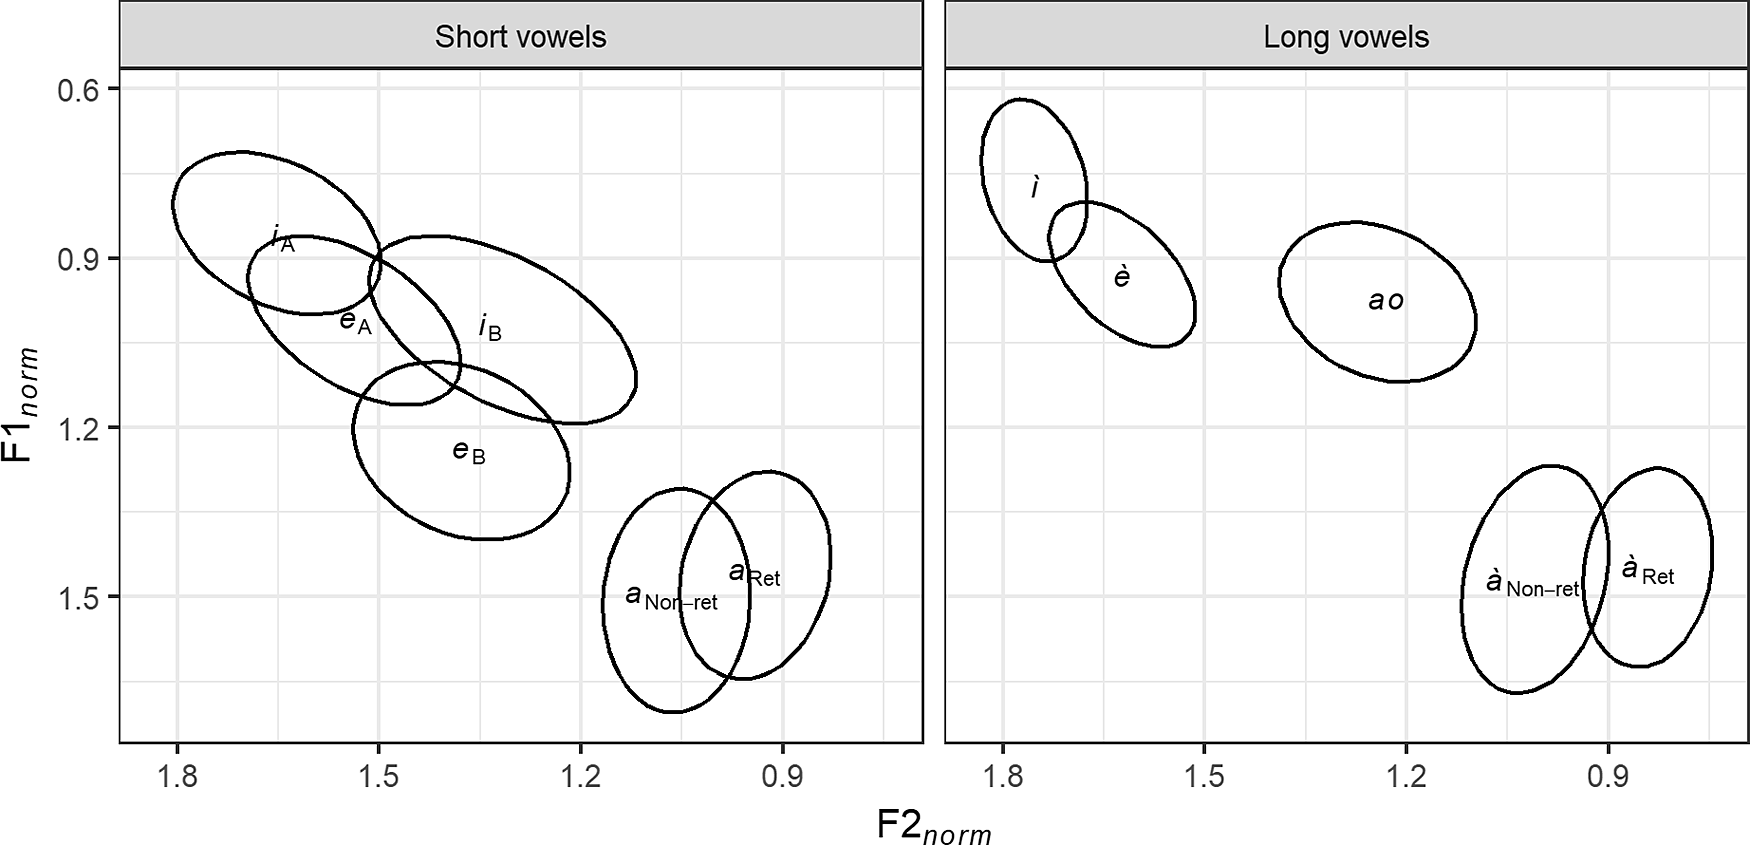
Based on combined data from all nine speakers, the distribution of the target vowels in normalised vowel space is shown in Figure 3. Note that /i/ in Environment B is highly retracted and lowered relative to Environment A, and occupies a similar area of vowel space to long /ɯː/, while /e/ in Environment B occurs further down the front diagonal than in Environment A. Note also that /a(ː)/ occurs further back in retracting environments than in non-retracting environments.
4.3.2 Tense and lax /i/
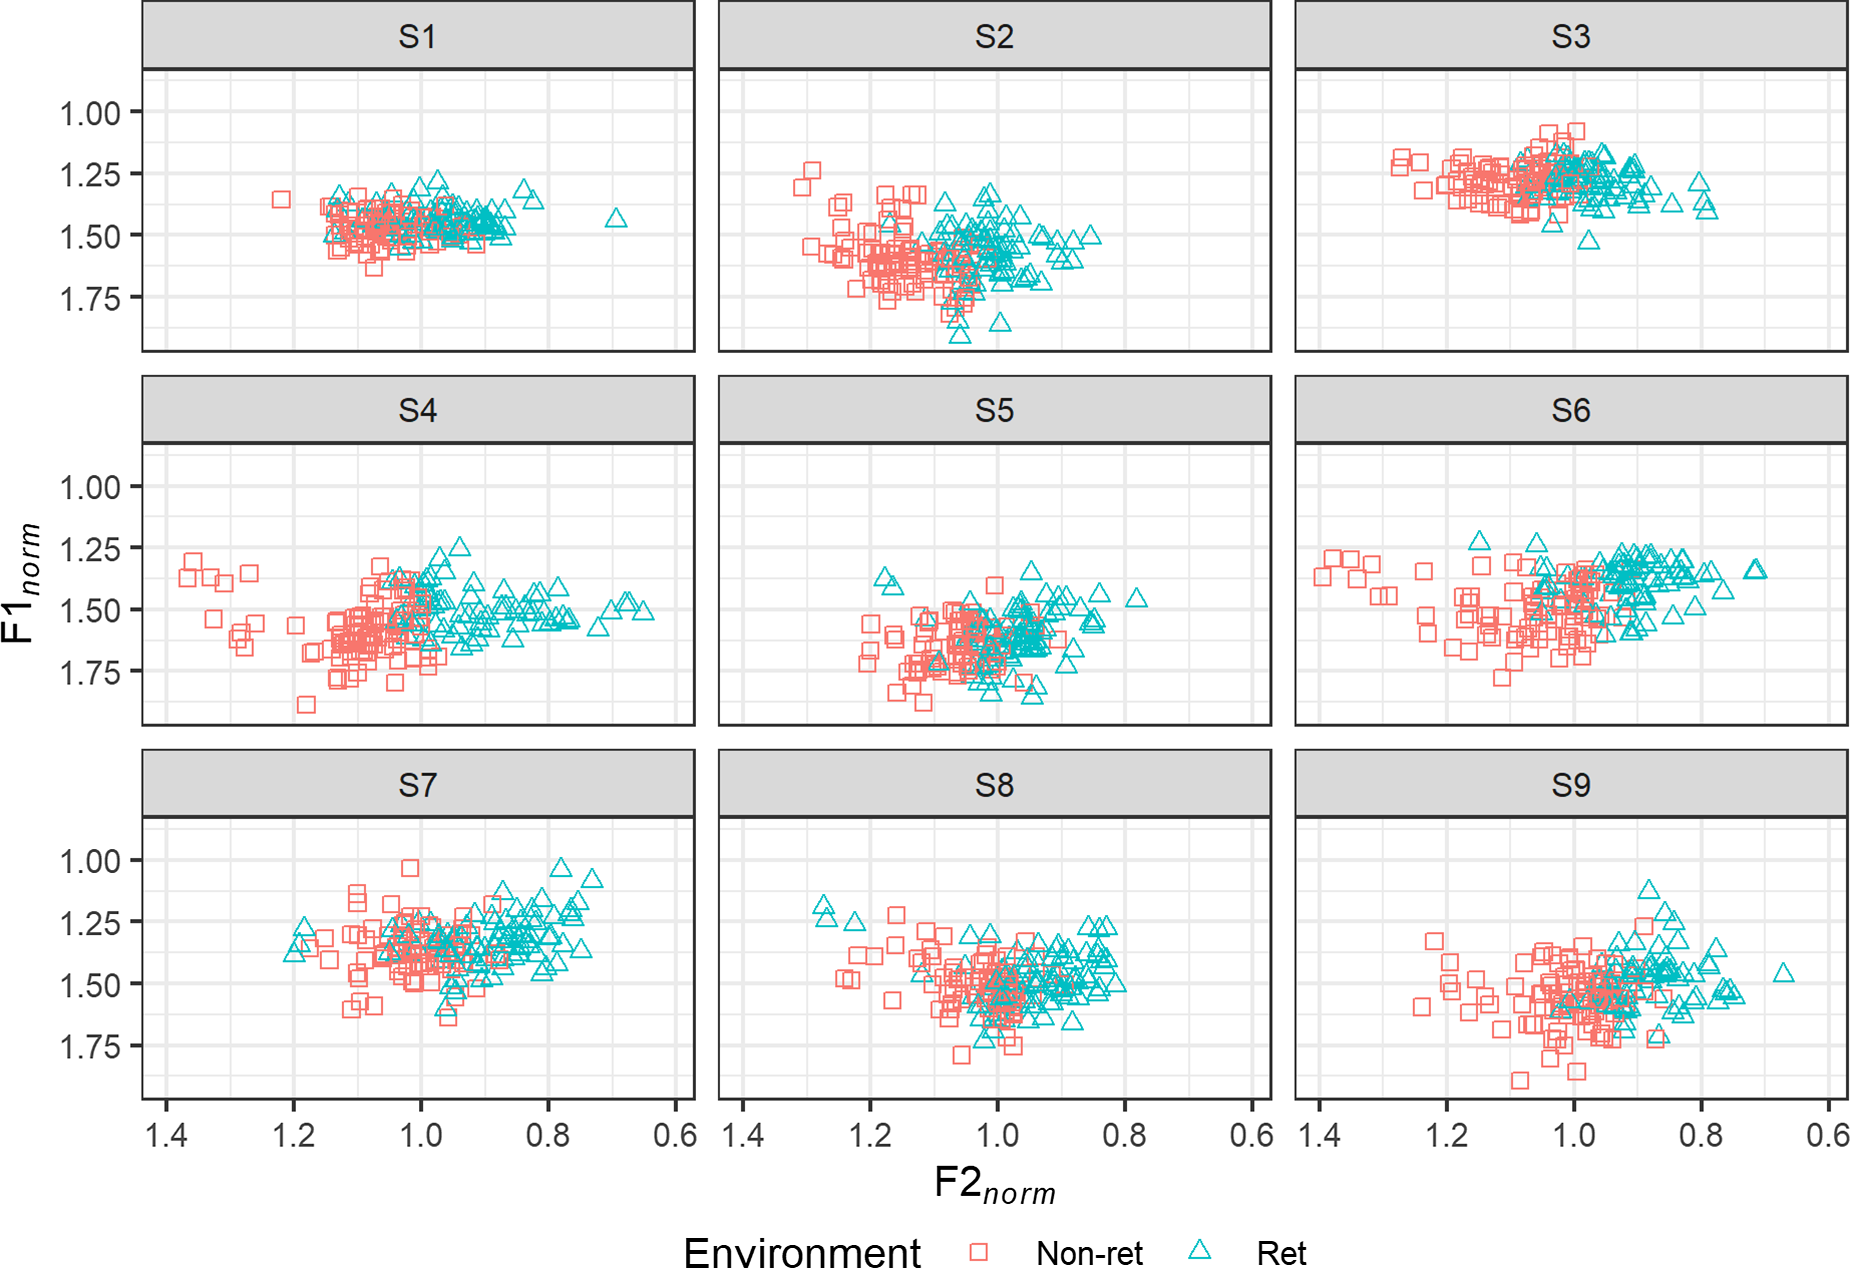
The distribution of tokens of /i/ in normalised vowel space in environments A and B is shown for each speaker in Figure 4. Following the procedure described in Section 4.2.4, the optimum value of the constant c i was determined to be 4.47. Therefore i-tenseness T i is defined as follows:
(8) $\qquad\ T_{i} = 4.47 \times \textrm{F2}_{norm}-\textrm{F1}_{norm}$
The distribution of T i according to environment is shown in the boxplots in Figure 5. All speakers display a clear tendency for tokens in Environment B to have higher F1 norm and lower F2 norm , and thus lower T i , than those in Environment A.
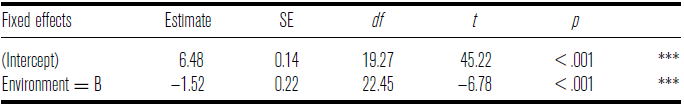
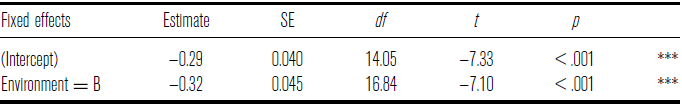
In order to determine whether this allophonic variation can be confirmed statistically, an LME model was fitted with i-tenseness T i as the dependent variable and a fixed effect of environment (two levels: A, B). Unless otherwise stated, all LME models reported in this paper also include a random intercept in speaker, a random slope in speaker by environment, and a random intercept in stimulus, each of which significantly contributed to the fit according to LRTs in every case. A random slope in stimulus by environment was not included in any case as this did not significantly improve fit. The model is summarised in Table 6. Tokens of /i/ in Environment B display significantly lower T i than those in Environment A.
LME model summary for T i of /i/ against environment.
* $p < .05$
; **
$p < .05$
; ** $p < .01$
; ***
$p < .01$
; *** $p < .001$
The distribution of the target vowels in normalised vowel space, combined for all nine speakers. The labels i e a represent /i e a/ respectively; represent /iː Ⅿː eː aː/. Labels are centred on the mean, and ellipses represent one standard deviation from the mean.

T i of /i/ in environments A and B for each speaker.

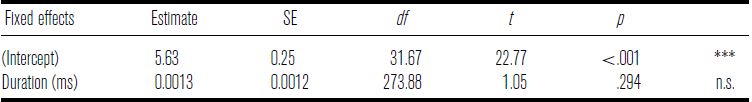
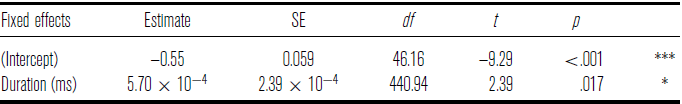
In many languages, such as English, German and Irish (but not all, e.g. Italian), there exists a close correlation between tenseness and vowel length, with short vowels displaying a lax quality relative to their long counterparts. It has therefore been proposed that tense–lax contrasts are derived from underlying length contrasts (Lindau Reference Lindau1978: 557), since the greater duration of long vowels may allow for more peripheral articulation than their short counterparts. In order to investigate the possible effect of phonetic duration on tenseness in Scottish Gaelic, a fixed effect of duration was added to the model in Table 6. This did not significantly improve the fit of the model (χ 2(1) = 1.02, p = .312). A further model, summarised in Table 7, was fitted with duration as the sole fixed effect and random intercepts in speaker and stimulus. Duration alone is not a significant predictor of T i .
In order to search for evidence of categoricity in the distribution of tense and lax /i/, the density distribution of tokens of /i/ with respect to T i in environments A and B is plotted for each speaker in Figure 6. All speakers except for S2 and S3 display clear visible signs of bimodality, defined as the presence of a pronounced dip in the overall distribution near to the point where the density curves for the separate environments cross.
LME model summary for T i of /i/ against duration.
* $p < .05$
; **
$p < .05$
; ** $p < .01$
; ***
$p < .01$
; *** $p < .001$
The density distribution of tokens of /i/ with respect to T i in environments A and B for each speaker (bandwidth = (T iA − T iB)/4). The solid grey curve represents the overall distribution.
Hartigan’s Dip Test for multimodality was carried out in order to determine whether the presence of bimodality in the overall distribution of tokens of /i/ could be confirmed statistically for any of those seven speakers. The results are shown in Table 8. To account for multiplicity, significance was assessed by means of the Holm-Bonferroni method (Holm Reference Holm1979). After this correction, speaker S9 displays significant evidence of bimodality, meaning that at least this individual can be said to display two phonological categories for /i/, but the apparent bimodality displayed by the other speakers cannot be confirmed statistically.Footnote 13 However, since this may be due to the noisiness of the data and the relatively small sample size per speaker, this should not necessarily be taken as evidence against the presence of categoricity in the other speakers.
Results of Hartigan’s Dip Test for multimodality in those speakers who display visible signs of bimodality in T i of /i/.

* $p < .05$
; **
$p < .05$
; ** $p < .01$
; ***
$p < .01$
; *** $p < .001$
(after Holm-Bonferroni correction)
$p < .001$
(after Holm-Bonferroni correction)
For each of those speakers who display visible signs of bimodality, the location of the dip was taken as an estimate of the location of the boundary between the two (putative) categories, in order to establish whether individual words display the expected distribution according to the rule in (3). For all eight speakers, the majority of tokens fall on the expected side of the dip. However, giomach is consistently tense for S6 while mil is consistently tense for S4, S6, S8 and S9, all of whom are from the southwestern end of Ness except for S9.Footnote 14 Conversely, bruich is consistently lax for S1 and S7, who are siblings from the northeastern end of the district, while duine and tuilleadh are consistently lax for S4. This is therefore largely consistent with the anecdotal evidence mentioned in Section 3.3 regarding microdialectal variation in the lexical distribution of tense and lax /i/, although no firm conclusions may be drawn from the data available.
4.3.3 Tense and lax /e/
The distribution of tokens of /e/ in normalised vowel space in environments A and B is shown for each speaker in Figure 7. Again following the procedure described in Section 4.2.4, the optimum value of the constant c e was determined to be 0.47, so e-tenseness T e is defined as follows:
(9) $\qquad\ T_{e} = 0.47 \times \textrm{F2}_{norm} \, \, \textrm{F1}_{norm} $
The distribution of T e according to environment is shown in the boxplots in Figure 8. Again, all speakers display a clear tendency for tokens in Environment B to have higher F1 norm and lower F2 norm , and thus lower T e , than those in Environment A. Note that the lax allophone is particularly strongly retracted for S1.

T e of /e/ in environments A and B for each speaker.
In order to determine whether this allophonic variation can be confirmed statistically, an LME model was fitted as before, this time with e-tenseness T e as the dependent variable and a fixed effect of environment (two levels: A, B). The model is summarised in Table 9. As with /i/, tokens of /e/ in Environment B display significantly lower T e than those in Environment A.
LME model summary for T e of /e/ against environment.
* $p < .05$
; **
$p < .05$
; ** $p < .01$
; ***
$p < .01$
; *** $p < .001$
In order to once again investigate the possible effect of duration, a fixed effect of duration was added to the model in Table 9. This did not significantly improve the fit of the model (χ 2(1) = 2.15, p = .142). A further model, summarised in Table 10, was fitted with duration as the sole fixed effect and random intercepts in speaker and stimulus. This time there was a small but significant effect, with tokens of greater duration displaying slightly greater T e .
LME model summary for T e of /e/ against duration.
* $p < .05$
; **
$p < .05$
; ** $p < .01$
; ***
$p < .01$
; *** $p < .001$
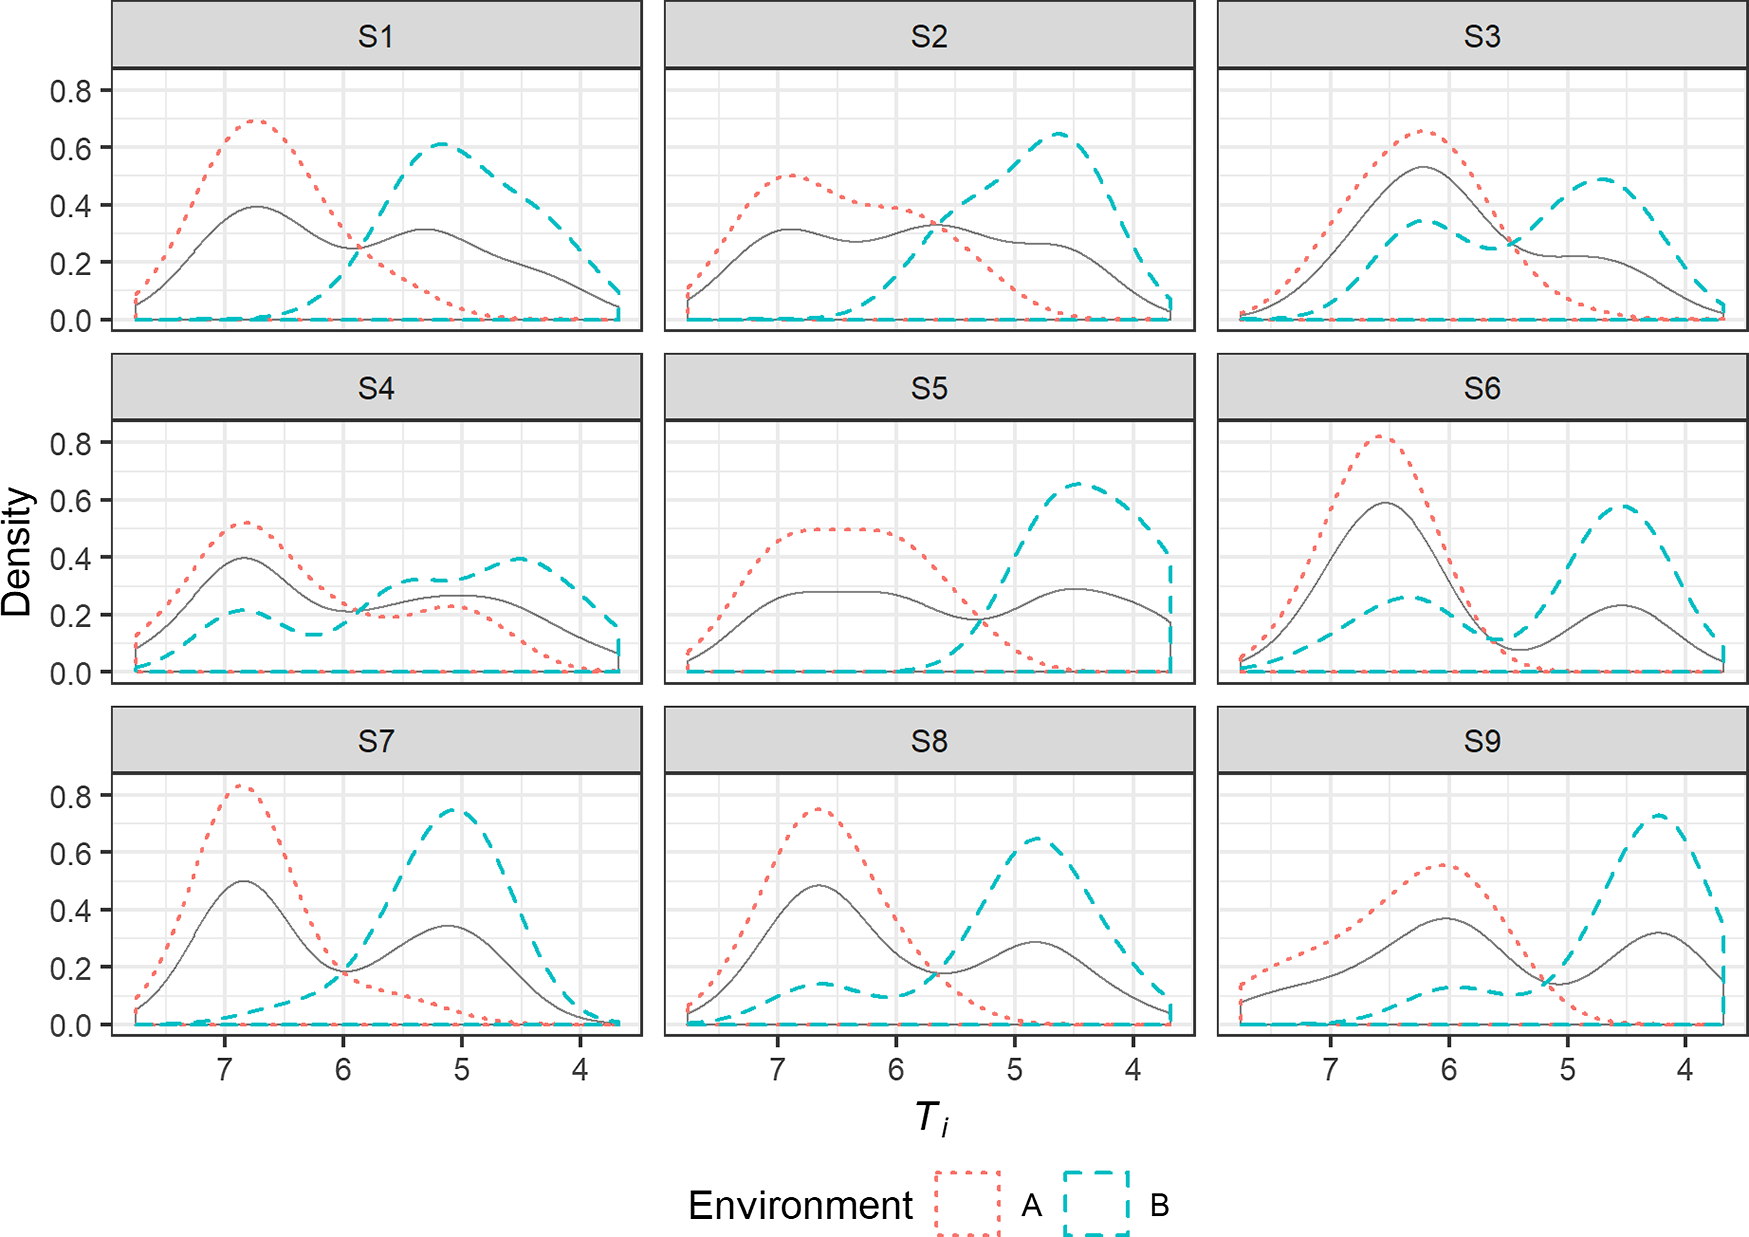
As before, the density distribution of tokens of /e/ with respect to T e in environments A and B is plotted for each speaker in Figure 9. All speakers except for S3, S6 and S9 display clear visible signs of bimodality.
The density distribution of tokens of /e/ with respect to T e in environments A and B for each speaker (bandwidth = (T eA − T eB)/4). The solid grey curve represents the overall distribution.

Hartigan’s Dip Test for multimodality was again carried out in order to determine whether the presence of bimodality in the overall distribution of tokens of /e/ could be confirmed statistically for any of those six speakers. The results are shown in Table 11. As before, significance was assessed by means of the Holm-Bonferroni method. Speakers S1, S5 and S7 display significant evidence of bimodality, meaning that at least those three individuals can be said to display two phonological categories for /e/, but the apparent bimodality displayed by S2, S4 and S8 cannot be confirmed statistically.Footnote 15
Results of Hartigan’s Dip Test for multimodality for those speakers who display visible signs of bimodality in T e of /e/.

* $p < .05$
; **
$p < .05$
; ** $p < .01$
; ***
$p < .01$
; *** $p < .001$
(after Holm-Bonferroni correction)
$p < .001$
(after Holm-Bonferroni correction)
The distribution of tokens of short /a/ in normalised vowel space in retracting and non-retracting environments for each speaker.
By again taking the location of the dip as an estimate of the location of the boundary between the two (putative) categories for each of those speakers who display visible signs of bimodality, it was possible to establish whether individual words display the expected distribution according to the rule in (4). For all six speakers, the majority of tokens fall on the expected side of the dip. However, breac and reic are consistently lax for S8.Footnote 16
4.3.4 Retraction of /a(ː)/
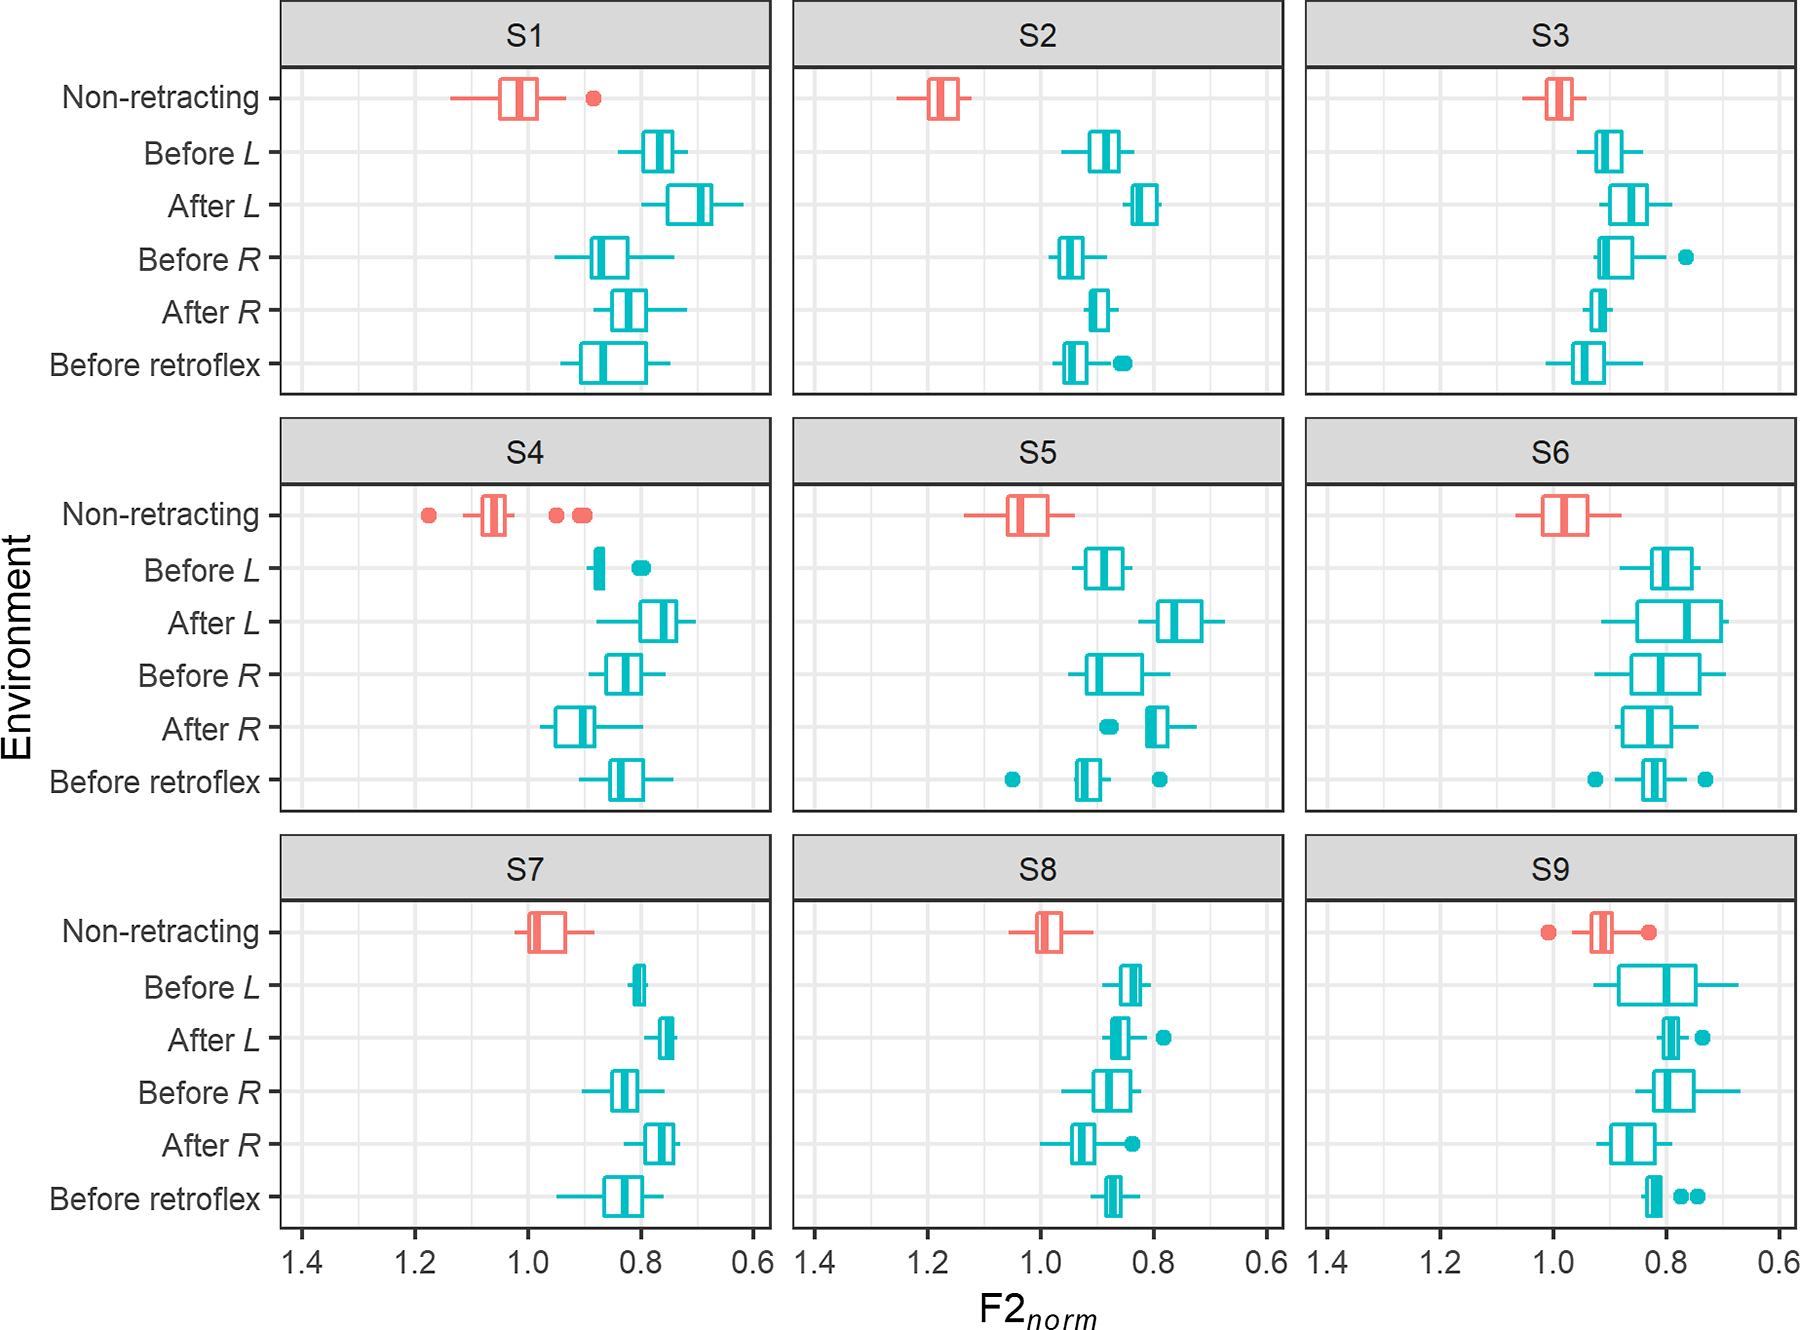
The distribution of tokens of short /a/ in normalised vowel space in retracting and non-retracting environments is shown for each speaker in Figure 10, and F2 norm is shown in the boxplots in Figure 11. All speakers display a clear tendency for tokens in retracting environments to have lower F2 norm than those in non-retracting environments. Note that only speakers S1, S5, S7 (sister of S1) and S8 display the merger of /xk/ and /hk/ discussed in Section 3.5, so this particular retracting environment is found only in these speakers.
LME model summary for F2 norm of short /a/.

* $p < .05$
; **
$p < .05$
; ** $p < .01$
; ***
$p < .01$
; *** $p < .001$
F2 norm of short /a/ in retracting and non-retracting environments for each speaker. N L R chd refer to /n̪ɣ l̪ɣ rɣ xk/ respectively.
An LME model was fitted with F2 norm as the dependent variable and a fixed effect of environment (eight levels: non-retracting, before /n̪ɣ/, before /l̪ɣ/, after /l̪ɣ/, before /rɣ/, after /rɣ/, before retroflex, before /xk/). The model is summarised in Table 12. Relative to non-retracting environments, tokens of short /a/ display significantly lower F2 norm in every retracting environment except before /xk/.Footnote 17
Closer inspection of stimuli with /a/ before /xk/, for those four speakers who display the merger of /xk/ and /hk/, reveals that retraction in this environment is highly inconsistent. Only S5 maintains a clearly audible distinction in both of the minimal pairs tac ∼ tachd and seac ∼ seachd. S1 distinguishes only the former pair in the recording, even though I have known this speaker to explicitly contrast the latter pair on other occasions (in fact, it was S1’s correction of my own pronunciation of seac vs. seachd that originally brought my attention to this particular retraction process in the first place), while both pairs appear to be homophonous for S7 and S8. There is insufficient data to allow for systematic investigation of retraction in this specific environment.
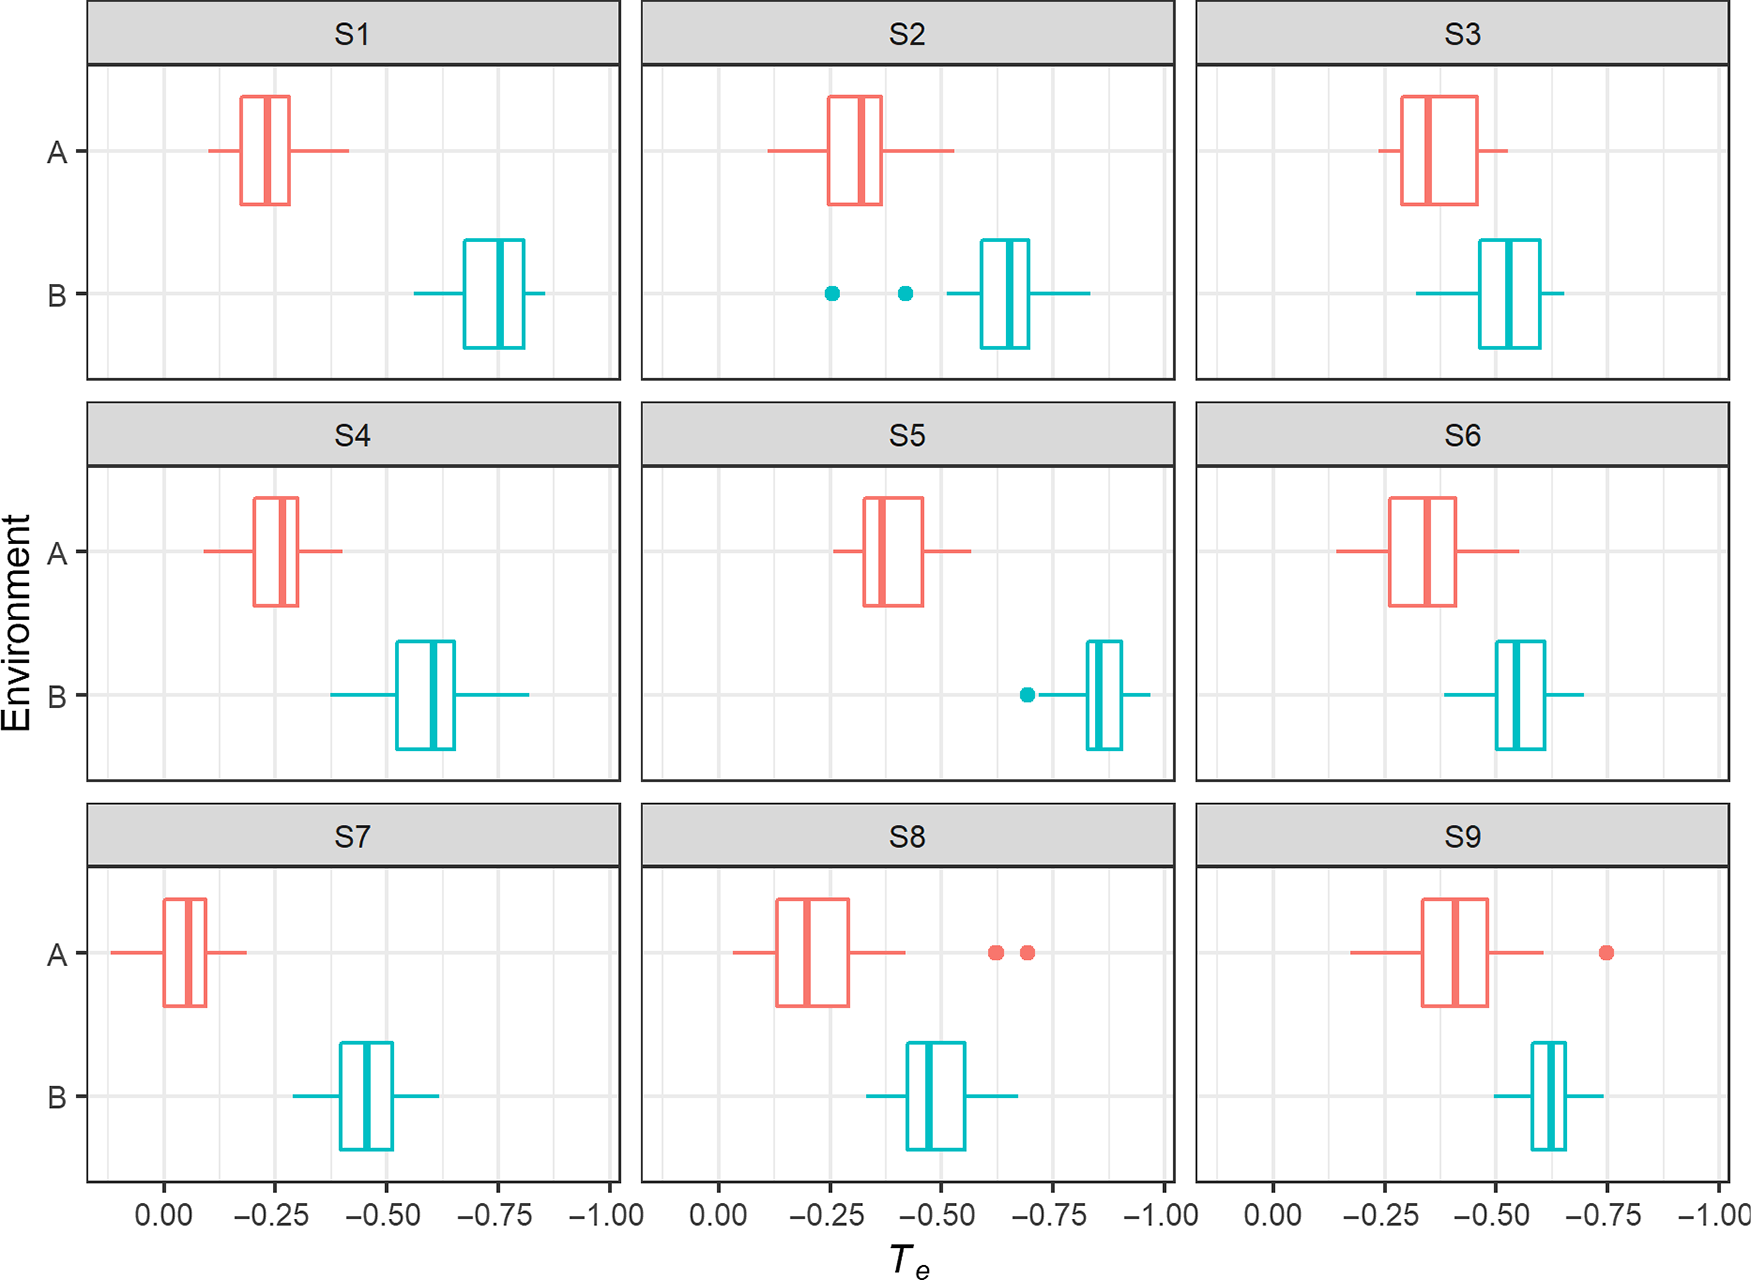
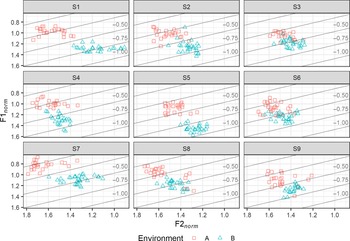
The distribution of tokens of long /aː/ in normalised vowel space in retracting and non-retracting environments is shown for each speaker in Figure 12, and F2 norm is shown in the boxplots in Figure 13. Again, all speakers display a clear tendency for tokens in retracting environments to have lower F2 norm than those in non-retracting environments.
A similar LME model was fitted with F2 norm as the dependent variable and a fixed effect of environment (six levels: non-retracting, before /l̪ɣ/, after /l̪ɣ/, before /rɣ/, after /rɣ/, before retroflex). The model is summarised in Table 13. It can be seen that tokens of long /aː/ in every retracting environment display significantly lower F2 norm than those in non-retracting environments.
LME model summary for F2 norm of long /aː/.

* $p < .05$
; **
$p < .05$
; ** $p < .01$
; ***
$p < .01$
; *** $p < .001$
The distribution of tokens of long /aː/ in normalised vowel space in retracting and non-retracting environments for each speaker.

F2 norm of long /aː/ in retracting and non-retracting environments for each speaker. L R refer to /l̪ɣ rɣ/ respectively.
In order to search for evidence of categoricity in the distribution of retracted and non-retracted /a(ː)/, the density distributions of tokens of short /a/ and long /aː/ with respect to F2 norm in retracting and non-retracting environments are plotted in Figures 14 and 15 respectively. While no clear bimodality can be seen in the distribution of short /a/ for any speaker, siblings S1, S2, and S7, as well as speaker S4, show clear visible signs of bimodality in the distribution of long /aː/.
The density distribution of tokens of short /a/ with respect to F2 norm in retracting and non-retracting environments (bandwidth = (F2 normNon-ret – F2 normRet)/4). The solid grey curve represents the overall distribution.

The density distribution of tokens of long /aː/ with respect to F2 norm in retracting and non-retracting environments (bandwidth = (F2 normNon-ret – F2 normRet)/4). The solid grey curve represents the overall distribution.

Once again, Hartigan’s Dip Test for multimodality was carried out in order to determine whether the presence of bimodality in the overall distribution of tokens of long /aː/ could be confirmed statistically for any of those four speakers. The results are shown in Table 14. As before, significance was assessed by means of the Holm-Bonferroni method. Speakers S2 and S4 display significant evidence of bimodality, meaning that at least those two individuals can therefore be said to display two phonological categories for long /aː/, but the apparent bimodality displayed by S1 and S7 cannot be confirmed statistically.
Results of Hartigan’s Dip Test for multimodality for those speakers who display visible signs of bimodality in F2 of long /aː/.

* $p < .05$
; **
$p < .05$
; ** $p < .01$
; ***
$p < .01$
; *** $p < .001$
(after Holm-Bonferroni correction)
$p < .001$
(after Holm-Bonferroni correction)
By once again taking the location of the dip as an estimate of the location of the boundary between the two (putative) categories for those speakers who display visible evidence of bimodality, it was possible to establish whether individual words display the expected distribution according to the rule in (5) above. For all four speakers, the majority of tokens fall on the expected side of the dip. However, several items display some inconsistency for S1, S4 and S7 and occasionally straddle the boundary between the two categories. In most cases, these are items with /aː/ before or after /rɣ/ or before a retroflex, where retraction appears to be weaker than in other retracting environments (see e.g. S1 in Figure 13 above).Footnote 18
It is worth noting in Tables 12 and 13 that, in nearly all comparable retracting environments, long /aː/ is retracted to a greater degree than short /a/. The greater overall spread of retracted and non-retracted allophones of long /aː/ compared to short /a/ can also be clearly seen by comparing the left and right panels in Figure 3. It may be that the greater duration of the long vowel allows for greater peripherality in the retracted allophone, thus providing more room in acoustic space for bimodality to emerge. This could explain the striking asymmetry between long and short /a(ː)/ with respect to the presence or absence of categoricity in several speakers.
4.3.5 Sociolinguistic factors
Although the small number of speakers (nine) is unlikely to allow for any detailed sociolinguistic analysis, multiple linear regression analyses were carried out in order to determine whether any correlation could be found between sociolinguistic factors and the degree of laxing or retraction displayed by speakers. Four models were fitted, with the dependent variables (i) degree of i-laxing (speaker mean of T i in Environment A − speaker mean of T i in Environment B); (ii) degree of e-laxing (speaker mean of T e in Environment A − speaker mean of T e in Environment B); (iii) degree of retraction of short /a/ (speaker mean of F2 norm in non-retracting environments − speaker mean of F2 norm in retracting environments); and (iv) the same again for long /aː/. In each case the three factors were gender, year of birth and location of village of birth (southwestern Ness or northeastern Ness). None of the three factors achieved significance for any of the four dependent variables.
It is also possible to look for patterns with respect to whether or not a speaker displays bimodality for a given allophonic process. Again there can be no detailed analysis, but it is worth noting that the only two speakers who show no visible evidence of bimodality in i-tenseness (S2 and S3) are the two oldest speakers in the sample, and the only speaker who displays no bimodality for any of the four processes (S3) is the oldest. Note also that, of the four speakers who display visible evidence of bimodality in long a-retraction, three (S1, S2 and S7) are the siblings from Adabrock.
5 Discussion
In this section I provide some general discussion of the results of the acoustic study described in Section 4, and consider the phonetic grounding of the various allophonic processes observed. Tense and lax /i e/ are discussed in Section 5.1, and the retraction of /a(ː)/ in Section 5.2.
5.1 Tense and lax /i e/
In accordance with the impressionistic observations detailed in Section 3, it is found in Section 4 that both /i/ and /e/ display significantly lower tenseness in Environment B than Environment A (as defined separately for the two vowels) when this is quantified using a combination of F1 and F2 values. However, speakers appear to vary with respect to the categoricity of the opposition. In the case of /i/, all but one of the nine speakers display visible signs of bimodality in the distribution of the tense and lax allophones, but this could be confirmed statistically for only one individual. It can therefore be concluded that at least some Ness Gaelic speakers display a categorical phonological opposition between tense and lax /i/, while for others the opposition may exist only at the gradient phonetic level. For the eight speakers for whom it is possible to establish a boundary between two (putative) categories, the majority of words display the expected allophone according to the rule in (3). Among those words that do display some inter-speaker variation, the distribution of the tense and lax allophones among speakers appears largely consistent with anecdotal evidence of microdialectal variation within Ness, with the lax allophone occurring more frequently at the northeast end of the district than the southwest end. However, without the use of a greater variety of stimuli it is not possible to be sure whether this variation is governed by a phonological rule or is in fact lexical: while it may be the case that speakers simply differ in the precise conditioning environments that govern the distribution of tense and lax /i/, it is also possible that the opposition has in fact undergone phonemicisation in some speakers and is thus no longer entirely rule-governed.
Turning now to /e/, six out of the nine speakers display visible signs of bimodality in the distribution of the tense and lax allophones, and this is confirmed statistically for three of those speakers. As with /i/, it can be concluded that at least some Ness Gaelic speakers display a categorical phonological opposition between tense and lax /e/, while for others the opposition may exist only at the gradient phonetic level. For the six speakers for whom it is possible to establish a boundary between two (putative) categories, the majority of words display the expected allophone according to the rule in (4). However, it is again not possible to be sure whether the variation that does occur is rule-governed or lexical, and it is possible that some speakers display a phonemic contrast similar to that found in other dialects.
Due to the limitations of the available evidence, any interpretation in terms of diachronic change must inevitably be somewhat speculative. However, it is noted in Section 4.3.5 that the only two speakers who show no bimodality in i-tenseness are the two oldest speakers in the sample, and that the only speaker who displays no bimodality for any of of the processes investigated is the oldest. This might suggest that categoricity in at least some cases has begun to emerge only in the last few generations. This could explain the differences between my observations (speakers born in the years 1943–84) and Borgstrøm’s (Reference Borgstrøm1940; speakers probably born late 1800s) with respect to the laxing of /i e/, as well as the semi-consistent application of the rules in (3) and (4) in the chronologically intermediate SGDS data (Ness speaker born c.1922).
In terms of the life cycle of phonological processes (Bermúdez-Otero Reference Bermúdez-Otero and Paul2007, Reference Bermúdez-Otero, Patrick and Salmons2015), according to which the rules that govern sound patterns advance deeper into the grammar along predictable diachronic pathways, the rule determining the distribution of the two allophones would be said to have undergone stabilisation for a certain proportion of speakers in both cases. This refers to the diachronic stage at which a process formerly restricted to the gradient phonetic grammar is reanalysed by the learner, during intergenerational transmission, as part of the categorical phonology. In turn, gradient phonetic processes are assumed to ultimately originate from language-universal articulatory, auditory or perceptual biases that come to be encoded in speakers’ phonetic grammars. This leads us to ask what phonetic biases may ultimately lie behind the particular distribution of tense and lax /i e/ in Ness Gaelic.
For both /i/ and /e/, tenseness is conditioned by the immediately-following environment. Tense [i e] occur word-finally or before hiatus, /h/ or a pre-aspirated stop, and in the case of /i/ the tense allophone also occurs before the majority of palatalised consonants. Lax [ɪ ɛ] occur before all other consonants. The occurrence of tense [i] before palatalised consonants can probably be attributed to simple co-articulation: the close front position of the tongue body during the production of this allophone serves to anticipate the palatal secondary articulation of the following consonant. Subordinate to this is a requirement that a tense vowel occur word-finally or before hiatus, /h/ or a pre-aspirated stop, and a lax vowel before all other consonants, and it is the phonetic grounding of this rule to which we will now turn.
A potential correlation between tenseness and duration was investigated in Section 4. While duration plays no role in the tenseness of /i/, it was found that there is a small but significant positive correlation between tenseness and duration for /e/. However, although shorter duration could increase the likelihood of undershoot and hence a more lax articulation, the small size of the effect and the fact that it is only detectable in /e/ mean that it is unlikely to be the cause of laxing.
Storme (Reference Storme2019) argues that the laxing of mid vowels in closed syllables in languages such as French is grounded in a trade-off between conflicting strategies of contrast enhancement in vowels and consonants. Largely due to their higher F1, lax vowels allow for more distinctive formant transitions at the VC boundary than tense vowels, so laxing can enhance perceptual cues to the place of articulation of a following consonant. This is supported experimentally by Lisker (Reference Lisker1999), who finds that English voiceless stops with no audible release burst are correctly identified more frequently after lax or open monophthongs than after tense non-open monophthongs or closing diphthongs. Because coda consonants tend to lack other strong cues to place of articulation, closed-syllable laxing in languages such as French may serve to enhance the perceptual distinctiveness of coda consonants. On the other hand, when there is no following coda consonant in need of such enhancement, vowels are tense by default as this maximises their own perceptual distinctiveness.
Although laxing in Ness Gaelic occurs not only before coda consonants but before onset consonants as well,Footnote 19 it is noteworthy that the environments in which lax [ɪ ɛ] occur are precisely those environments in which there is a direct transition between the stressed vowel and a following supra-glottal consonant. Apart from the overriding requirement that /i/ be tense before the majority of palatalised consonants, /i e/ are lax before all supra-glottal consonants except for pre-aspirated stops. The environments in which they are tense are (i) word-finally, where no consonant follows; (ii) before hiatus, where again no consonant follows; (iii) before /h/, which has no oral place of articulation; and (iv) before a pre-aspirated stop, where a period of [h]-like glottal frication intervenes between the vowel and the stop closure. The lax allophone therefore occurs if and only if there is the potential for formant transitions to contribute to the perceptual distinctiveness of a following consonant. Note in particular that pre-aspiration ‘blinds’ the laxing rule to the supra-glottal articulation of a following stop.Footnote 20
I therefore propose a generalised version of Storme’s (Reference Storme2019) analysis, hypothesising that laxing may potentially serve to enhance the perceptual distinctiveness of not only coda consonants but any immediately-following consonant. Languages vary with respect to the lengths they will go to in order to enhance consonantal contrasts in this way. While languages with closed-syllable laxing, such as French, are willing to sacrifice some of the perceptual distinctiveness of a vowel only as a last resort, i.e. for the benefit of a perceptually vulnerable coda consonant, it may be the case that Ness Gaelic reaches a different trade-off, favouring the consonant even when it is not in the coda. If this is true, it would be consistent with a far more general trend in the development of the Goidelic languages whereby vocalic distinctions are frequently overridden in order to enhance contrasts in adjacent consonants. This is seen, for instance, in the backing or breaking of front vowels before certain non-palatalised consonants in Scottish Gaelic, e.g. geal [kjɑl̪ɣ] ‘white’, sìos [ʃiəs] ‘down’ (Early Irish gel, sís), or the development of an alleged vertical system of short vowels in Irish (Ó Siadhail & Wigger Reference Ó Siadhail and Wigger1975, Ó Siadhail Reference Ó Siadhail1989, Ní Chiosáin Reference Ní Chiosáin1991).
Ideally, a perceptual study would help to establish whether laxing indeed serves to enhance the perceptual distinctiveness of a following consonant in Ness Gaelic. Unfortunately, this lies outwith the scope of the present paper and must remain a potential point of future research.
5.2 Retraction of /a(ː)/
Again in accordance with the auditory observations detailed in Section 3, it is found that, relative to non-retracting environments, long and short /a(ː)/ display significantly lower F2 in all retracting environments except before /xk/. In the case of short /a/, no speaker shows any evidence of bimodality in the distribution of the retracted and non-retracted allophones, so it can be concluded that this retraction probably occurs only at the gradient phonetic level. However, four out of the nine speakers display visible signs of bimodality in the distribution of retracted and non-retracted long /aː/, and this is confirmed statistically for two of those speakers, so it can be concluded that this is a categorical phonological opposition for at least some Ness Gaelic speakers.
As with tense and lax /i e/, the retraction of long /aː/ can be said to have undergone stabilisation for a certain proportion of speakers. However, the retraction of short /a/ appears to still be at pre-stabilisation stage of the life cycle, displaying no sign of having entered the categorical phonology for any speakers. The phonetic grounding of retraction next to velarised consonants can probably be attributed to coarticulation, since velarisation itself involves retraction of the tongue body. However, the occasional retraction of /a/ before [hk] when this represents underlying /xk/ is less clear, since retraction does not generally occur next to consonants with velar primary articulation. This instead appears to represent a more complex process of transphonologisation, whereby the velar consonant /x/ is compensated for, in the event of its loss, by retraction of the vowel in order to preserve the underlying contrast. It is interesting to note, however, that /x/ does pattern with the velarised consonants with respect to some other interactions with vowels. Recall from Section 2.2 that it triggers retraction of short /u/ in Lewis, and note also that, at a deeper phonological level, /x/ in the Ness dialect joins the velarised consonants in enforcing preceding /a/ where other dialects have /ɛ/, e.g. neach [ɲãx] ‘person’ in Ness vs. [ɲɛ̃x] elsewhere.
6 Conclusion
The vowel system of present-day Ness Gaelic differs in several important respects from the system normally reported for Lewis Gaelic and for Scottish Gaelic dialects in general. As discussed in Section 3, short /ɯ/ and long /ɛː/ do not occur. Additionally, short /i/ displays a lax allophone [ɪ] in certain consonantal environments, and short /e ɛ/ are in complementary distribution according to a similar rule to that governing the distribution of tense and lax /i/. Finally, both short and long /a(ː)/ display a retracted allophone [ɑ(ː)] next to velarised consonants. This study documents these aspects of the Ness dialect, some of which have not been reported in the existing literature, and in Section 4 provides the first instrumental examination of these allophonic patterns.
It is shown that speakers vary with respect to whether these processes belong to the gradient phonetics or the categorical phonology. In terms of the life cycle of phonological processes (Bermúdez-Otero Reference Bermúdez-Otero and Paul2007, Reference Bermúdez-Otero, Patrick and Salmons2015), individual speakers are said in Section 5 to lie at different points along the diachronic pathway by which gradient phonetic processes are reanalysed as belonging to the phonological grammar. Following Storme (Reference Storme2019), it is proposed in Section 5 that the distribution of tense and lax /i e/ is grounded in competing strategies of contrast enhancement, whereby vowels undergo laxing in order to maximise the perceptual distinctiveness of a following consonant. Finally, from a more general perspective, this paper provides vital documentation of a unique dialect of a language undergoing rapid decline.
Appendix. Word list
The full word list is shown in Table A1. Stimuli and glosses are shown here spelled exactly as they were presented to participants.
The full word list.

Acknowledgements
I am grateful to Ricardo Bermúdez-Otero for many years of guidance, Claire Nance and three anonymous reviewers for useful comments and suggestions, and audiences at the 3rd Poznań Conference of Celtic Studies and Rannsachadh na Gàidhlig 2018 for helpful feedback. This work was supported by the Economic and Social Research Council (grant number ES/J500094/1).


 Open access