

INTRODUCTION
Many marine organisms undergo daily shifts in activity. These daily shifts are often associated with the exploitation of food, avoidance of predators, and reproductive efforts (e.g. Sancho et al., Reference Sancho, Solow and Lobel2000; Zemke-White et al., Reference Zemke-White, Choat and Clements2002). Such diel activity patterns are also correlated with multiple environmental cues, including lunar periodicity and ambient light (Naylor, Reference Naylor1999; Tessmar-Raible et al., Reference Tessmar-Raible, Raible and Arboleda2011), tide cycles (Palmer, Reference Palmer2000; Gibson, Reference Gibson2003), and physiological cues derived from circadian rhythms (Reebs, Reference Reebs2002; Connor & Gracey, Reference Connor and Gracey2011).
The diel activity patterns of small, mobile, benthic invertebrate zooplankton are particularly well-documented. These organisms regularly undergo daily vertical migrations. In both marine and freshwater environments, they find refuge from fish predators in the benthos during daytime, and move up the water column at night, where food is typically more dense and easier to locate (Gilbert & Hampton, Reference Gilbert and Hampton2001; Hays, Reference Hays2003). Although the diel activity patterns of zooplankton may be in part related to endogenous cues, there is evidence that they can moderate their activity levels based on factors such as light availability, which in turn are associated with season and time of day (Hays, Reference Hays1995; Cohen & Forward, Reference Cohen and Forward2009).
Isopods of the family Gnathiidae are a major part of the community of small, mobile, benthic invertebrates in marine systems (Hobson & Chess, Reference Hobson and Chess1976; Hammer & Zimmerman, Reference Hammer and Zimmerman1979; Hammer, Reference Hammer1981; Jacoby & Greenwood, Reference Jacoby and Greenwood1988). They inhabit both temperate and tropical oceans (Smit & Davies, Reference Smit and Davies2004; Ferreira et al., Reference Ferreira, Smit, Grutter and Davies2009; Sikkel & Welicky, Reference Sikkel and Welickyin press). Gnathiids are considered one of the most common ectoparasitic groups found infecting marine fishes (Grutter, Reference Grutter1994; Grutter & Poulin, Reference Grutter and Poulin1998a, Reference Grutter and Poulinb; Coile & Sikkel, Reference Coile and Sikkel2013) as they infest hosts during each of three juvenile stages. After the final feeding, they metamorphose into non-feeding sexually dimorphic adults (Smit & Davies, Reference Smit and Davies2004; Ferreira et al., Reference Ferreira, Smit and Davies2010; Farquharson et al., Reference Farquharson, Smit and Sikkel2012). Thus, most of their fish-parasitic juvenile stages and all of their adult stage are spent free-living. Gnathiids can impact fish hosts in multiple ways. They can alter host physiology through reduced haematocrit (Jones & Grutter, Reference Jones and Grutter2005), increased levels of corticosteroid stress hormones (Triki et al., Reference Triki, Grutter, Bshary and Ros2016), and the creation of wounds that can lead to secondary infection (Bunkley-Williams & Williams, Reference Bunkley-Williams and Williams1998). They may transmit blood-borne parasites (Smit & Davies, Reference Smit and Davies2004; Curtis et al., Reference Curtis, Grutter, Smit and Davies2013), and in extreme cases can cause host mortality in adult-size fish (Bunkley-Williams & Williams, Reference Bunkley-Williams and Williams1998; Hayes et al., Reference Hayes, Smit, Grutter and Davies2011). Gnathiids can even infest and kill settlement-stage fishes (Grutter et al., Reference Grutter, Pickering, McCallum and McCormick2008, Reference Grutter, Crean, Curtis, Kuris, Warner and McCormick2011a; Penfold et al., Reference Penfold, Grutter, Kuris, McCormick and Jones2008; Artim et al., Reference Artim, Sellers and Sikkel2015). Gnathiids on coral reefs play a major role in marine cleaning symbioses where they are the main food item for cleaner fishes (e.g. Côté, Reference Côté2000; Grutter, Reference Grutter2002) and appear to influence the interaction of fish hosts with cleaners (Grutter, Reference Grutter1999; Côté & Molloy, Reference Côté and Molloy2003; Sikkel et al., Reference Sikkel, Cheney and Côté2004, Reference Sikkel, Herzlieb and Kramer2005). These cleaning interactions have been reported to play a significant role in coral reef community dynamics (Waldie et al., Reference Waldie, Blomberg, Cheney, Goldizen and Grutter2011; reviewed by Sikkel & Welicky in press).
Although gnathiids have a near global distribution, the majority of studies examining gnathiid activity patterns have been conducted on tropical species in the Pacific and Caribbean. Activity patterns at some Great Barrier Reef sites tend to peak during new and full moon (Jacoby & Greenwood, Reference Jacoby and Greenwood1988; Grutter et al., Reference Grutter, Lester and Greenwood2000), whereas Caribbean gnathiid activity patterns show little correlation with lunar periodicity (Welicky et al., Reference Welicky, Cheney, Coile, McCammon and Sikkel2013). Studies in both the Caribbean and Pacific have demonstrated a correlation between gnathiid activity and time of day, where infestation by gnathiids peaks at dawn and/or night, and daytime activity is considerably lower (Grutter, Reference Grutter1999; Grutter & Hendrikz, Reference Grutter and Hendrikz1999; Chambers & Sikkel, Reference Chambers and Sikkel2002; Sikkel et al., Reference Sikkel, Shaumburg and Mathenia2006, Reference Sikkel, Ziemba and Sears2009; Jones & Grutter, Reference Jones and Grutter2007). Accordingly, gnathiids in shallow coral reef habitats appear to be predominantly nocturnal.
In contrast to the myriad of ecological research on coral reef gnathiids, ecological information on intertidal gnathiids is limited. Intertidal habitats are often less accessible due to the high-energy wave action of these areas. Accordingly, studies within these areas are difficult to conduct. The ecological data currently available on intertidal gnathiids have been extrapolated mainly from studies on a closely related genus, Elaphognathia (Tanaka & Aoki, Reference Tanaka, Aoki, Watanabe and Fusetani1998, Reference Tanaka and Aoki1999), as well as gnathiid taxonomy (Smit et al., Reference Smit, Van As and Basson2002; Hadfield et al., Reference Hadfield, Smit and Avenant-Oldewage2008), life cycle (Smit et al., Reference Smit, Basson and Van As2003; Hadfield et al., Reference Hadfield, Smit and Avenant-Oldewage2009), and fish blood haemogregarine studies (Davies & Smit, Reference Davies and Smit2001; Davies et al., Reference Davies, Smit, Hayes, Seddon and Wertheim2004). From studies examining the distribution of Elaphognathia, we know that the density of Elaphognathiid larvae is greatest at the midpoint between high and low tide, and the overall distribution of Elaphognathiids spans the entire distribution of their sponge habitat, and they are observed throughout the year (Tanaka & Aoki, Reference Tanaka, Aoki, Watanabe and Fusetani1998; Tanaka & Aoki, Reference Tanaka and Aoki1999).
Gnathia africana Barnard, 1914 is one of the few intertidal gnathiid species that has been studied in detail, and its morphology (Smit et al., Reference Smit, Van As and Basson1999, Reference Smit, Van As and Basson2002) and full life cycle (Smit et al., Reference Smit, Basson and Van As2003) have been described. Gnathia africana has been collected from the intertidal of the temperate south and cold west coasts of southern Africa, where it inhabits sponge and infects Clinus superciliosus Linnaeus, 1758 (Smit et al., Reference Smit, Van As and Basson1999). Gnathia africana metamorphose from larvae to adult male and female over ~34 and 41 days, respectively, and can survive in waters from 8–25°C (Smit et al., Reference Smit, Basson and Van As2003). Despite extensive taxonomic research on this species, no ecological studies for this species have been conducted.
The goal of this study is to provide the first steps towards understanding the ecology of intertidal gnathiids by examining the interactions between G. africana and its host Clinus superciliosus. Given that time of day influences the activity patterns of other gnathiid species, and environmental factors associated with tidal cycles play a significant role in shaping intertidal ecosystem dynamics, the primary objectives of this study were to quantify G. africana activity patterns with respect to time of day, tidal zone and tidal cycle.
MATERIALS AND METHODS
Study area and site selection
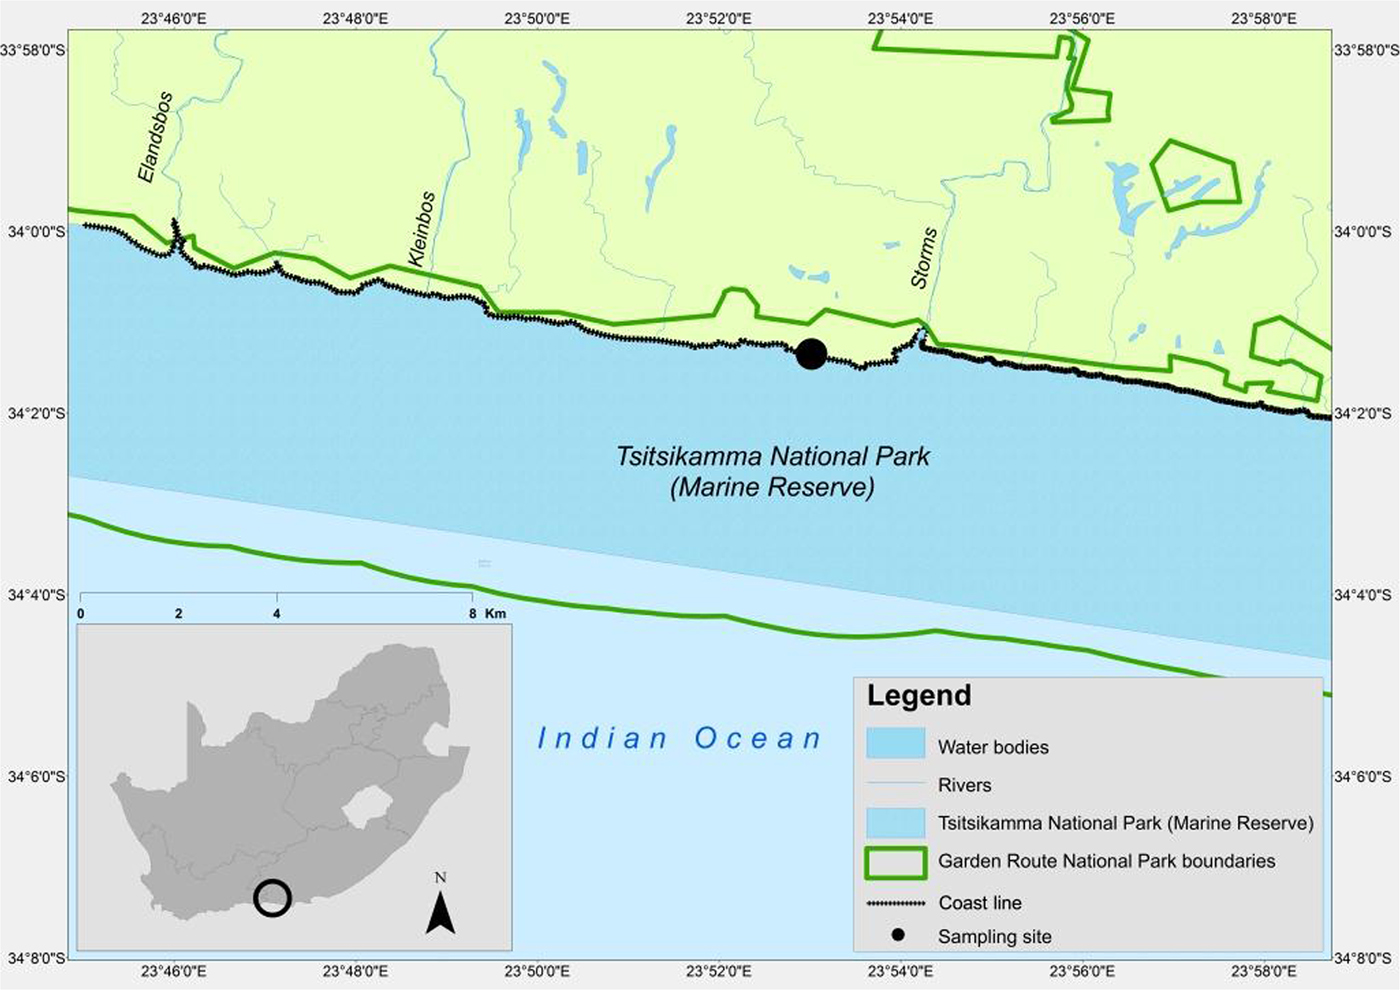
Tsitsikamma National Park (TNP) (34°01′16.35″S 23°53′43.87″E) is situated in the southern Cape of South Africa, and is one of the largest Marine Protected Areas (MPA) in the world, and the oldest MPA in South Africa (Turpie et al., Reference Turpie, Clark and Hutchings2006) (Figure 1). The shoreline consists of steep rocky cliffs, with occasional sandy beaches. Since 1964, TNP has been closed to fishing (Sauer et al., Reference Sauer, Penney, Erasmus, Mann, Brouwer, Lamberth and Stewart1997), and thereby provides a refuge for fishes and other marine animals, as well as pristine sampling habitat for such organisms.
Map of study site within Tsitsikamma National Park, South Africa.
Fish and parasite sampling protocol
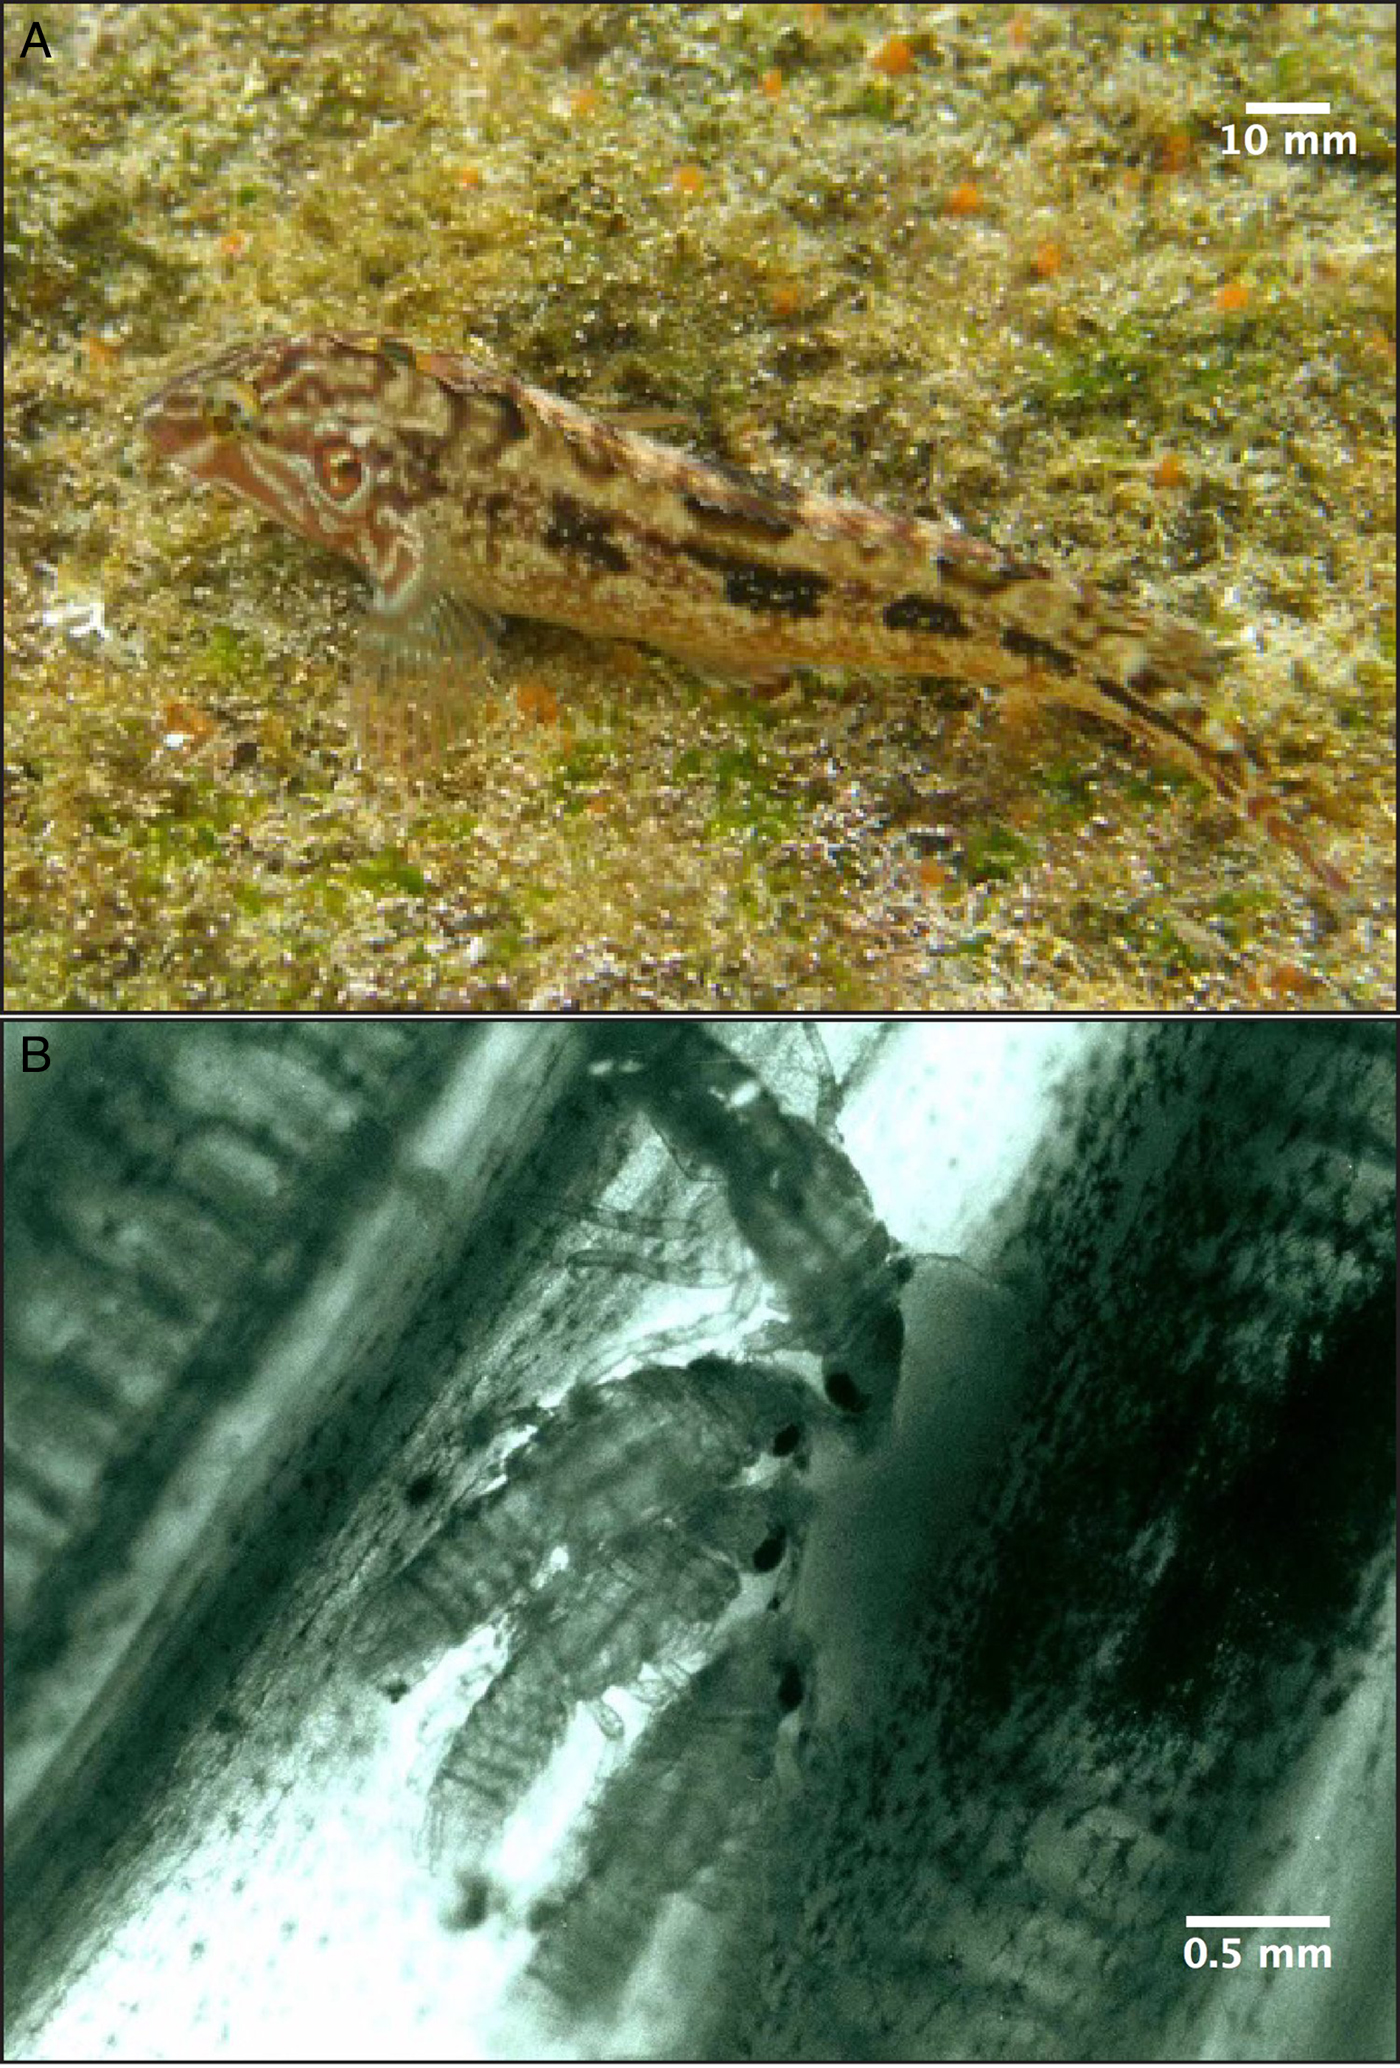
Fish were caught using baited hooks and line during April 2007, July 2008 and November 2008. Identity of captured fish was confirmed using Smith & Heemstra (Reference Smith and Heemstra2003), total length (TL) was measured (in cm), and fish were held in buckets of fresh, aerated seawater for ~3 h to allow attached gnathiid juveniles (pranizae) to complete their feeding and dislodge from the host fish naturally (Figure 2). These ‘gnathiid free’ C. superciliosus were placed into cages and exposed to the sea for a period of 4 h, except for those that were set for the early morning retrieval and were set for ~8 h. The cages were set within the following intervals, which were modified from Grutter (Reference Grutter1999) and Chambers & Sikkel (Reference Chambers and Sikkel2002): early morning (~2200–0800), morning (0600–1200), afternoon (1000–1600), early evening (1400–1900), evening (1800–2400). The cages were constructed of galvanized steel and mesh, and the dimensions of each cage were ~30 cm wide by 30 cm high. The mesh opening allowed for water and zooplankton to easily flow through the cage. The cages were set within the intertidal or infratidal zone, and during periods of both high and low tide. Infratidal was defined as the zone below the low tide mark, and the intertidal zone was defined as the zone between the high and low tide marks. Following retrieval, fish were removed from cages, placed in resealable plastic bags filled with seawater, and transported to the mobile research station inside TNP. At the mobile station, aerators were inserted into the fish's bag to oxygenate the water. After 24 h, C. superciliosus were released, and the water in which they were held was sieved and screened for gnathiids. Gnathiid juveniles were all identified as Gnathia africana from Smit et al. (Reference Smit, Van As and Basson1999), and were mainly pranzia (fed gnathiids). Few zuphea (unfed gnathiids) were also obtained and these were gnathiids that detached from hosts but did not complete their feeding. Zuphea were included in gnathiid counts as they were attached to the fish upon collection. The number and feeding stages of pranizae/zuphea collected from each fish were recorded and divided into first, second and third stages based on size and morphology (Smit et al., Reference Smit, Van As and Basson1999; Smit & Davies, Reference Smit and Davies2004).
(A) Clinus superciliosus. (B) Gnathia africana parasitizing Clinus superciliosus. Photos courtesy of N. J. Smit.
Statistical analyses
A relationship between fish body size and ectoparasite load has been reported in other studies (e.g. Grutter & Poulin, Reference Grutter and Poulin1998b; Poulin, Reference Poulin2000). Thus, the relationship between fish length and gnathiid load was assessed to determine whether fish length should be included as a covariate in the analyses described below (Coile & Sikkel, Reference Coile and Sikkel2013; Coile et al., Reference Coile, Welicky and Sikkel2014).
The statistical analyses explained hereafter used the independent variables collection period, tide, tide zone and time. The variable collection period had three levels, one per collection period (April, July, November). The variable tide had two levels, high and low tide. Tide zone also had two levels, infratidal and intertidal. Time was divided into five levels, one per time interval (see above). There were four dependent variables, which were assessed separately: the total number of gnathiids (all stages combined), stage 1 gnathiids, stage 2 gnathiids and stage 3 gnathiids.
To examine if any of the independent variables were predictors of the dependent variables, bootstrapped analyses of variance with 10,000 replications (with replacement) were conducted. Bootstrapped analyses of variance were conducted as raw data were not normally distributed following transformation, the dataset was small with a small range in values, and contained many zero counts (Artim & Sikkel, Reference Artim and Sikkel2016). By conducting bootstrapped analyses of variance with 95% confidence intervals, we were able to approximate the true distribution of the dataset and assess the effects of the independent variables on the dependent variables. Interaction effects among the independent variables were not included in the analyses as they are not biologically relevant, and were controlled for throughout sampling. For example, although high and low tide changes daily, cages were always set according to that day's high and low tide, and within the respective infratidal and intertidal zones.
For each dependent variable, two bootstrapped analyses of variance were conducted (as described above). In the first analysis all independent variables were used. In the second analysis, only those variables which were significant at the P = 0.1 level in the first analysis were included. The second analysis was conducted to ensure the large number of independent variables would not mask factors that were significant. Post-hoc comparisons of significant predictors from the second analysis are reported. All descriptive statistics are reported as mean ± SD.
RESULTS
Descriptive statistics
Over the course of the study, 172 C. superciliosus (April, N = 57; July, N = 41; November = 74; mean TL = 15.4 cm ± 2.3) were used for sampling. Details of the number of fish collected and tested by tide zone and time of day are reported in Table 1. In April, July and November, the mean total number of gnathiids collected per fish was 2 ± 5, 3 ± 8, and 0 + 1, respectively. The overall mean number of total gnathiids collected per fish was 1 ± 5, and this was not correlated with TL (r 2 = 0.000, P = 0.877). The mean total number of gnathiids was greatest during morning and afternoon, and lowest during early morning (Figure 3). The average number of stage 1, 2 and 3 gnathiids collected was 0 + 4, 0 + 1 and 0 + 1, respectively. The TL data were not correlated with the number of stage 1 (r 2 = 0.003, P = 0.437), 2 (r 2 = 0.009, P = 0.224) and 3 (r 2 = 0.007, P = 0.263) gnathiids.
Total number of gnathiids collected per fish by time of day. Boxplot values were calculated using bootstrapping with 10,000 replications. The centreline is the mean total number of gnathiids collected per fish, the lower and upper box lines indicate the 95% confidence interval, and the lower and upper stems indicate the minimum and maximum number of gnathiids collected per fish, respectively. No lower stems are depicted for values below 0, as 0 is the least number of gnathiids possibly collected.
Sample sizes of the number of fish used in the study by time of day and tide zone.

Total number of gnathiids
In the first analysis, tide was not a significant predictor of total number of gnathiids (Table 2). In the second analysis, both tide zone and collection period were not significant predictors of the total number of gnathiids collected (Table 2). The time at which caged fish were collected significantly influenced the total number of gnathiids present (Table 2). There were significantly more gnathiids collected in afternoon compared with evening and early morning, and there were significantly fewer gnathiids collected in early evening, evening and early morning compared with morning (Table 3). Thus gnathiid activity was greatest during morning and afternoon.
Results of bootstrapped analyses of variance.

Values in bold were considered significant at P = 0.01 level in the first analysis. Those that met this criterion were used in the second analysis, and evaluated for significance at P = 0.05 level and are in bold.
Posthoc pairwise time interval comparisons with Bonferroni adjustment for the total number of gnathiids (df = 164) and stage 1 (df = 165) and 2 (df = 166) gnathiids at the 99.5% confidence interval.

Number of gnathiids by developmental stage
In the first and second analyses, time of day was a significant predictor for the number of stage 1 and 2 gnathiids (Table 2). There were significantly fewer stage 1 gnathiids collected during early evening, evening, and early morning compared with morning (Table 3). Significantly more stage 2 gnathiids were collected in the afternoon compared with early evening and early morning, and there were significantly more stage 2 gnathiids collected in early evening compared with early morning and evening (Table 3). In the first and second analyses of stage 1 gnathiids, collection period was a significant predictor, such that similar numbers of stage 1 gnathiids were collected in July and April (P = 0.077) and fewer were collected in November as compared with July (P = 0.025) and April (P = 0.044). No other predictors significantly influenced the number of stage 1, 2 and 3 gnathiids in both the first and second analyses (Table 2).
DISCUSSION
This study is the first to report on the abundance and diel activity patterns of temperate gnathiids. Whereas tropical reef gnathiids have been reported as generally more abundant and most active at night, the findings of this study indicate that temperate intertidal gnathiids may be more active during the day, independent of the tide cycle and tidal zones.
The number of intertidal gnathiids collected from C. superciliosus at this site was much smaller than those typically collected from coral reef habitats (Grutter & Poulin, Reference Grutter and Poulin1998b; Grutter, Reference Grutter1999, Reference Grutter2008; Coile & Sikkel, Reference Coile and Sikkel2013; Welicky et al., Reference Welicky, Cheney, Coile, McCammon and Sikkel2013; Sikkel et al., Reference Sikkel, Welicky, Artim, McCammon, Sellers, Coile and Jenkins2017). There are at least three possible explanations for this difference. First, the fish species composition and the nature and diversity of feeding modalities vary greatly between these two systems. Whereas on coral reefs, cleaner fish and shrimp prey upon gnathiids during the day, in the intertidal, some small Clinus spp. forage on gnathiids (Bennett et al., Reference Bennett, Griffiths and Penrith1983) and Clinus spp. may forage on gnathiids throughout the day. Clinus spp. may forage continually, and it has been suggested that C. superciliosus may consume ~21% of the available small crustacean, polychaete and mollusc prey items within their habitat (Bennett, Reference Bennett1984; Gibbons, Reference Gibbons1988). If other resident intertidal fish consume similar prey items, such fish would consume 64% of the available items (Bennett, Reference Bennett1984). This intense predation could contribute to and greatly reduce the overall gnathiid population size. Secondly, the smaller number of gnathiids observed in this intertidal system as compared with coral reef studies may be associated with the generally stronger and more frequent wave action observed in the intertidal vs reef system (e.g. Abelson & Denny, Reference Abelson and Denny1997). High wave action could reduce the swimming and attachment capacity of gnathiids, and thus reduce their success of infesting hosts. However, this explanation is unlikely because there were no significant differences in the number of gnathiids collected between high and low tide, and if gnathiids infested hosts more easily in calmer water, then significantly more gnathiids should have been collected during low tide in the intertidal pools. A third and more plausible alternative is that G. africana appears to feed on a narrow range of hosts (Smit & Davies, Reference Smit and Davies1999), and to be a habitat specialist. Generally, intertidal systems are less diverse than reef systems and may have fewer host species available (Stuart-Smith et al., Reference Stuart-Smith, Bates, Lefcheck, Duffy, Baker, Thomson, Stuart-Smith, Hill, Kininmonth, Airoldi and Becerro2013). It is conceivable that G. africana have a preference for a particular host species as other gnathiids are considered generalists with preferences (Jones et al., Reference Jones, Nagel, Hughes, Cribb and Grutter2007; Nagel & Grutter, Reference Nagel and Grutter2007), and the preferred hosts for G. africana may be less abundant than the preferred hosts in coral reef systems. Thus, the small number of gnathiids collected in this study may be associated with fish using gnathiids as a predominant prey resource, and/or host and habitat availability being limited.
The numbers of gnathiids collected from fish were similar among tidal cycles and zones, and this likely reflects the relatively expansive movement and distribution of both susceptible hosts and gnathiids. In a mark and recapture study of Clinus spp., fish were reported to move mainly during high tide, recaptures occurred only half the time, and those recaptured were within 0–4 m of the locality in which they were first observed (Marsh et al., Reference Marsh, Crowe and Siegfried1978). Given that the fish themselves may serve as a mechanism of transport and dispersal (Sikkel et al., Reference Sikkel, Welicky, Artim, McCammon, Sellers, Coile and Jenkins2017), infected C. superciliosus that do move among tidal pools at high tide probably facilitate the transport and distribution of gnathiids between and within the inter and infratidal zones. Fish that remain within the same locality over the course of high tide probably aid in maintaining gnathiid abundance in that particular area. Gnathiids themselves may also contribute to their distribution as juvenile stage gnathiids are morphologically equipped for limited swimming (Smit et al., Reference Smit, Van As and Basson1999). Models estimating movement distance of tropical gnathiids have reported they may move as much as 1.8 m to locate a host (Artim & Sikkel, Reference Artim and Sikkel2016). Since the combined distances fish and gnathiids can travel are within the boundaries of the entire intertidal zone, it is plausible that gnathiids are dispersed fairly evenly within the inter- and infratidal zones, and this is supported by our high vs low tide and inter vs infra tidal zone findings.
Unlike some tropical reef gnathiids, intertidal gnathiids in this study were most active during daytime hours. The diurnal activity of gnathiids is unexpected, given that their likely main predators, intertidal fishes, are also their prey and are mainly diurnal. Gnathiids may be most vulnerable to predation when they emerge from the benthos to infest a host, and when they detach from a host and return to the benthos to digest their blood meal. Accordingly, the time gnathiids spend infesting hosts may be the time at which gnathiids are least vulnerable to predation if hosts provide refuge from predators, especially in an environment with no known cleaner organisms (which would prey on gnathiids off of host fish). Gnathiids infesting hosts may evade predation from intertidal carnivorous fishes as most C. superciliosus are typically too large to serve as prey, and thus gnathiids on C. superciliosus would not be inadvertently depredated. Hence, the greatest predation risk for gnathiids is likely when they are in the water column (by filter feeders) or benthic substrate (by benthic dwellers). Ultimately, the hosts that gnathiids try to infest may utilize gnathiids as a prey resource, but G. africana have been reported to infest hosts’ away from their head (Smit et al., Reference Smit, Basson and Van As2003), which would reduce their chances of being seen and consumed by host fish. A further possibility is that the small number of gnathiids collected in this study is attributable to C. superciliosus having physiological defences against parasitism (Wisenden et al., Reference Wisenden, Goater, James, Zaccone, Perrière and Kapoor2009; Grutter et al., Reference Grutter, Rumney, Sinclair-Taylor, Waldie and Franklin2011b). To better understand gnathiid–host interactions, further comparative studies of G. africana and its interactions with diurnal and nocturnal fishes are needed.
The difference in peak activity time between intertidal and reef gnathiids may be reflected in functional morphological differences (Hammer, Reference Hammer1981; Nagel et al., Reference Nagel, Montgomerie and Lougheed2008). Nocturnal reef gnathiids have been reported to have significantly longer antennules and larger eyes than diurnal reef gnathiids (Nagel et al., Reference Nagel, Montgomerie and Lougheed2008; Nagel, Reference Nagel2009). Comparisons of G. africana eye size with other intertidal species, and the associations between their eye size and activity patterns have not been investigated.
Generally, we observed more first stage gnathiids than second and third stage gnathiids. This result is not surprising as it probably reflects a decline in gnathiid survivorship over the course of their life cycle (Smit et al., Reference Smit, Basson and Van As2003; Artim & Sikkel, Reference Artim and Sikkel2016). The greater number of first stage gnathiids observed in April (autumn) and July (winter) compared with November (summer) may reflect the fact that females release their larvae more often during particular times of year. In part, this may suggest that intertidal gnathiids exhibit more seasonality than previously reported (Smit et al., Reference Smit, Basson and Van As2003), but further research is needed to better understand if there are peak times for gnathiid reproduction. Nonetheless, this research suggests that G. africana release at least some larvae year round. To examine the factors associated with the timing of larval release and gnathiid survival, complementary field and laboratory studies are needed.
Perhaps the most important aspect of this research are the questions that have developed from our findings. Given that we now know that G. africana is a predominantly diurnal species, and that infection intensity on hosts is very low within tidal pools of TNP, a suite of studies examining what regulates the timing of G. africana activity as well as their functional role and significance in intertidal trophic dynamics are needed. While obtaining these data are difficult given the high-wave action of intertidal systems, our study is the first to provide information about the timing and distribution of temperate intertidal gnathiids. Thus the findings of this research can facilitate the successful implementation of future temperate intertidal gnathiid ecology studies.
ACKNOWLEDGEMENTS
We thank former and current members of the Water Research Group of North-West University and University of Johannesburg for their assistance in the field. We express gratitude for the assistance in project development by the late Angela Davies-Russell. We thank South Africa National Parks for their assistance with and permitting of this project, entitled ‘Biodiversity, Ecology, and Systematics of Gnathiid Isopoda (Crustacea) Parasitic on Marine Fishes of South Africa, PI NJ Smit, 2006–2011’. This is contribution number 201 from the NWU-Water Research Group.
FINANCIAL SUPPORT
Financial support from the Claude Leon Foundation of South Africa for Rachel L. Welicky made this research possible. Financial assistance of South Africa's National Research Foundation (NRF) towards this research is hereby acknowledged (NRF Project IFR170210222411, NJ Smit, PI). Opinions expressed and conclusions arrived at, are those of the authors and are not necessarily to be attributed to the NRF.


 Open access