


1. Introduction
Helicon wave plasma (HWP) source, as a revolutionary technology in the field of low-temperature plasmas, has been known for its high density (Carter et al. Reference Carter2002), high ionisation efficiency (Batishchev et al. Reference Batishchev2009), low electron/ion temperature, no electrode contact (avoiding electrode erosion and instability (Goulding, Caughman & Rapp Reference Goulding2017)) and flexibility of external operational parameters (wide range adjustment of magnetic field, air pressure and frequency (Shinohara Reference Shinohara2018)). It continues to lead the development of high-efficiency plasma generation technology.
The HWP discharge can be classified into three typical working modes based on the configuration of magnetic field strength and radio-frequency (RF) power: it presents a capacitive coupling mode (E mode) in the low-magnetic-field–low-power range; an inductive coupling mode (H mode) under medium parameter conditions; and a helicon-wave-dominant mode (W mode) when combined with high magnetic field and high power. As the RF power and axial magnetic field gradually increase, the plasma working mode will undergo a transition from E mode to H mode to W mode. At low RF powers and low magnetic fields, HWP discharge cannot realise the helicon wave mode at all. At high RF powers and high magnetic fields, it can realise the helicon mode with helicon blue core formation (Ellingboe & Boswell Reference Ellingboe and Boswell1996; Thakur, Brandt & Cui Reference Thakur2015; Chang, Caneses & Thakur Reference Chang, Caneses and Thakur2022; Cui, Zang & He Reference Cui2024). It is precisely because of the existence of this mode transformation, compared with traditional capacitive coupled plasma (CCP) and inductive coupled plasma (ICP) sources, that HWP sources can achieve a density leap of 1–2 orders of magnitude, which is attributed to their unique wave–particle energy coupling mechanism (Chen Reference Chen2015).
In recent years, the advantages of HWP sources have been widely utilised by scholars in various fields, including thin-film deposition (Chen, Bagnall & Koh Reference Chen1998; Yerokhin, Nie & Leyland Reference Yerokhin1999; Gallo, Fedorczak & Elmore Reference Gallo2017), wall retention cleaning in tokamaks (Huang et al. Reference Huang, Jin, Yu, Yang, Zhuge, Wu and Sha2017; Huang et al. Reference Huang, Jin, Yang, Wu, Zhuge, Wang and Ji2018), plasma propulsion (Charles et al. Reference Charles2009; Shinohara et al. Reference Shinohara2014; Takahashi et al. Reference Takahashi2019) and toroidal current drive (Wang, Wi & Kim Reference Wang2017; Li et al. Reference Li, Zhao, Wang and Xiang2020). In addition, due to its superior discharge characteristics compared with traditional CCP and ICP, the HWP can generate higher plasma density and decrease the processing time in the semiconductor etching process. However, it has not yet been accepted by the semiconductor industry, which is also a difficult problem that needs to be urgently overcome in the industrial application field of HWP (Chen Reference Chen2015). For different applications, it is particularly important to perfect HWP discharge experiments. The HWP source determines the state and form of the HWP discharge. According to different research objectives, different HWP sources need to be designed to meet the experimental requirements. In order to deal with large-scale material handling and high-power plasma propulsion, it is necessary to design a large-radius antenna for HWP discharge to generate a larger volume of plasma (Chang et al. Reference Chang2018). In tube coating experiments, it is necessary to design an HWP antenna with a small radius to generate plasma with a sufficient radius to pass through the tube base (Sun, Yan & Ji Reference Sun2018; Bakeev et al. Reference Bakeev, Klimov, Oks and Zenin2023).
In a review study (Chen Reference Chen2015; Shinohara Reference Shinohara2018; Chang, Boswell & Scime Reference Chang2024), it was presented that the HWP source has evolved from miniaturised thruster applications (such as SHD (Kuwahara, Mishio & Nakagawa Reference Kuwahara2013), with a diameter as small as 0.3 cm) to large-scale basic research devices (such as LHPD (Shinohara & Tanikawa Reference Huang, Jin, Yu, Yang, Zhuge, Wu and Sha2004, Reference Jung2005; Tanikawa & Shinohara Reference Tanikawa and Shinohara2006), with a diameter of 73.8 cm, a length of 486 cm and the world’s largest volume of 2.1 m3). The high diversity in size and configuration of HWP sources is of great significance for the study of new HWP sources.
Designing HWP sources of different sizes requires a significant investment of time and money, as it is not feasible to rely on trial and error by continually creating new antennas. Therefore, it is crucial to determine the optimal parameters of antennas under various experimental conditions through numerical simulation. In recent years, there has been substantial progress in the numerical simulation of HWP. The HELIC code (Arnush & Chen Reference Arnush and Chen1998) conducts theoretical analysis of electromagnetic fields to calculate the energy deposition of helicon wave (H wave) and Trivelpiece–Gould wave (TG wave), as well as the distribution of electric, magnetic and current fields. The ANTENA2 code (Mouzouris et al. Reference Mouzouris and Scharer1996) utilises collision mechanisms and Landau damping heating mechanisms to compute the electromagnetic field and power deposition in plasmas. The SPIREs code (Melazzi et al. Reference Melazzi2012) employs the FDTD algorithm to efficiently solve electromagnetic field problems and power deposition problems in cylindrical plasmas. The ADAMANT code (Melazzi et al. Reference Melazzi and Lancellotti2015) uses the MOM algorithm to investigate antenna geometry and its impact on power deposition. These codes serve as valuable computational tools for designing HWP sources.
The HELIC code is able to match the boundary conditions quickly because of its unique solution method, which can significantly reduce calculation costs. Therefore, based on the High Magnetic field Helicon eXperiment (HMHX), this paper selected the HELIC code as the calculation tool to simulate the experimental parameters, to analyse the effects of antenna type, RF and discharge gas on power deposition of HWP discharge and to determine the optimal discharge parameters for the subsequent optimisation of antenna size. In addition, in order to complete a hydrogen–HWP discharge, antennas of different sizes are designed for numerical simulation, in order to obtain the optimal power deposition effect under the discharge condition of hydrogen. The research in this paper has certain guiding significance for the optimisation of HWP sources on HMHX and the development of related physical experiments.
2. Theoretical formula and calculation model
2.1. Theoretical formula
The HELIC code uses specific boundary conditions to solve six radially coupled differential equations (Li et al. Reference Li, Zhao and Wang2020a , Reference Li, Zhao, Wang and Xiangb ; Zhou, Huang & Wu Reference Zhou, Huang and Wu2024):
 \begin{equation} \frac{\partial E_{\varphi }}{\partial r}=\frac{im}{r}E_{{r}}-\frac{E_{\varphi }}{r}+i\omega B_{{z}}, \end{equation}
 \begin{equation} \frac{\partial E_{{z}}}{\partial r}=ikE_{{r}}-i\omega B_{\varphi }, \end{equation}
 \begin{equation} i\frac{\partial B_{\varphi }}{\partial r}=\frac{m}{r}\frac{k}{\omega }E_{\varphi }-\frac{iB_{\varphi }}{r}+\left(P-\frac{m^{2}}{{k_{0}}^{2}r^{2}}\right)\frac{\omega }{c^{2}}E_{{z}}, \end{equation}
 \begin{equation} i\frac{\partial B_{{z}}}{\partial r}=-\frac{\omega }{c^{2}}iDE_{{r}}+\left(k^{2}-{k_{0}}^{2}S\right)\frac{E_{\varphi }}{\omega }+\frac{m}{r}\frac{k}{\omega }E_{{z}}, \end{equation}
 \begin{equation} B_{{r}}=\frac{1}{k_{0}c}\left(\frac{m}{r}E_{{z}}-E_{\varphi }\right)\!, \end{equation}
 \begin{equation} E_{{r}}=\frac{D}{S}iE_{\varphi }+\frac{kc}{k_{0}S}B_{\varphi }-\frac{m}{r}\frac{c}{k_{0}S}B_{{z}}, \end{equation}
where $B_{{r}}$
,
$B_{{r}}$
, $B_{\varphi }$
and
$B_{\varphi }$
and $B_{{z}}$
are radial, angular and axial induced magnetic fields,
$B_{{z}}$
are radial, angular and axial induced magnetic fields, $E_{{r}}$
,
$E_{{r}}$
, $E_{\varphi }$
and
$E_{\varphi }$
and $E_{{z}}$
are radial, angular and axial induced electric fields, k is axial mode number, ω is wave frequency and
$E_{{z}}$
are radial, angular and axial induced electric fields, k is axial mode number, ω is wave frequency and $k_{0}=\omega /c$
with c the speed of light. Also,
$k_{0}=\omega /c$
with c the speed of light. Also,
 \begin{equation} {S}=1-\sum _{\alpha }\frac{\omega +iv_{\alpha }}{\omega }\frac{{\omega _{{p}\alpha }}^{2}}{\left(\omega +iv_{\alpha }\right)^{2}-{\omega _{c\alpha }}^{2}}, \end{equation}
 \begin{equation} {D}=-\sum _{\alpha }\frac{\omega _{c\alpha }}{\omega }\frac{\omega _{{p}\alpha }}{\left(\omega +iv_{\alpha }\right)^{2}-\omega _{c\alpha }}, \end{equation}
 \begin{equation} {P}=1-\sum _{\alpha }\frac{{\omega _{{p}\alpha }}^{2}}{\omega \left(\omega +iv_{\alpha }\right)}, \end{equation}
where $\omega _{{p}{\unicode[Arial]{x03B1}} },\; \omega _{{c}{\unicode[Arial]{x03B1}} }\text{ and } v_{\alpha }$
are plasma frequency, plasma cyclotron frequency and effective collision frequency between particles and α is the type of particles.
$\omega _{{p}{\unicode[Arial]{x03B1}} },\; \omega _{{c}{\unicode[Arial]{x03B1}} }\text{ and } v_{\alpha }$
are plasma frequency, plasma cyclotron frequency and effective collision frequency between particles and α is the type of particles.
Schematic diagram and structure of HMHX.

As for the absorbed power of plasma, the specific plasma power spectrum function $S(k)$
is defined as
$S(k)$
is defined as
 \begin{equation} S(k)=\frac{1}{2}\textit{Re}\left(\int \boldsymbol{E}^{\boldsymbol{*}}\boldsymbol{\cdot }\boldsymbol{J}_{\text{plasma}}\,\textit{d}^{3}r\right)\!. \end{equation}
Here, $\boldsymbol{J}_{\text{plasma}}$
is the current density of plasma, which can be expressed in terms of the cold plasma tensor:
$\boldsymbol{J}_{\text{plasma}}$
is the current density of plasma, which can be expressed in terms of the cold plasma tensor:
 \begin{equation} J_{\text{plasma}}=-i\omega \varepsilon _{0}\left(\begin{array}{c@{\quad}c@{\quad}c} S & -iD & 0\\ iD & S & 0\\ 0 & 0 & P \end{array}\right)\left(\begin{array}{c} E_{{r}}\\ E_{\varphi }\\ E_{{z}} \end{array}\right)\!. \end{equation}
The electric field E and current density J in real space are excited by an antenna whose spectrum is $K_{\varphi }(k')=\delta (k'-k)$
. Since S(k) is even, it can be used to simplify the calculation:
$K_{\varphi }(k')=\delta (k'-k)$
. Since S(k) is even, it can be used to simplify the calculation:
 \begin{equation} p_{A}\!\left(k\right)=\left| K_{\varphi }\!\left(k\right)\right| ^{2}+\left| K_{\varphi }\!\left(-k\right)\right| ^{2}. \end{equation}
Therefore, the absorbed power from k to (k + dk) and from −k to −(k + dk) is
 \begin{align}{P}\!\left(k\right)&= S\left(k\right)p_{A}\left(k\right)\nonumber\\ &=\frac{\omega \epsilon _{0}}{2}\int _{0}^{a}\text{Im}\{S(| E_{{r}}| ^{2}+| E_{\varphi }| ^{2})+P|E_{{z}}| ^{2}+2D\,\textit{Re}\{E_{{r}}^{*}E_{\varphi }\}\}r\text{d}r. \end{align}
Then the total absorbed power is
 \begin{equation} {P}_{\textit{abs}}=2\int _{k_{\it min}}^{k_{\it max}}P(k)\text{d}k=R .\end{equation}
2.2. Calculation model
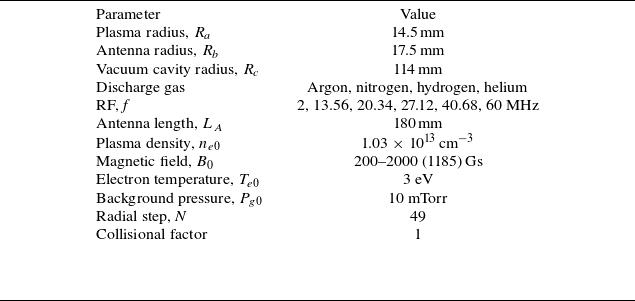
HMHX is independently designed and constructed by the Plasma Technology Research Center of Soochow University. A schematic diagram and structure of the device are shown in figure 1. The device uses a modular design. It can be divided into a source area (internal diameter is 228 mm, length is 800 mm) and a plasma–material interaction area (internal diameter is 400 mm, length is 400 mm). Because HMHX can produce HWP of high density and energy, it can be used to study the characteristics of HWP and the interaction between plasma and material. The antenna is a right-handed helicon antenna (internal diameter is 35 mm, length is 180 mm) which is wrapped around a quartz tube with a thickness of 3 mm (Zhou et al. Reference Zhou, Ji, Li, Zhuge and Wu2023). In table 1, the discharge parameters have been set. Among them, the radial step defines the mesh size of the simulation region (typically from the magnetic axis to the plasma boundary) in the radial direction. When the radial step is smaller, the computational grid becomes denser, and theoretically, the solution accuracy is higher. However, the memory and CPU time required for the calculation also increase sharply. When the radial step is larger, the calculation speed will be faster, but important physical details may be lost or inaccurate values may result. Therefore, based on some previous studies (Ping et al. Reference Ping2019; Li et al. Reference Li, Zhao and Wang2020a , Reference Li, Zhao, Wang and Xiangb ) on HWP using HELIC, a radial step of 49 was selected to ensure a certain balance between computational accuracy and speed. The collisional factor is a factor that artificially enhances the frequency of collisions. Excessive collisional factor can cause the resistance effect to be overly exaggerated, thereby resulting in physical distortion. However, a collisional factor that is too small will result in a resistance effect that is too weak to distinguish, making numerical solution extremely difficult.
Plasma parameters and boundary conditions.

In actual HWP discharge experimental devices, the axial magnetic field is mostly provided by electromagnetic coils or permanent magnets. This leads to subtle changes in the axial magnetic field during the actual discharge process, rather than the uniform distribution in the ideal state (D’lppolito et al. Reference D’lppolito2012; Hong, Li & Hajjar Reference Hong2018a , Reference Hongb ). A change in the axial magnetic field will lead to variations in the axial boundary conditions, thereby affecting the dynamic characteristics of the plasma (Thakur, Xu & Manz Reference Thakur2013; Vaezi, Holland & Thakur Reference Vaezi2017a , Reference Vaezib ). In simulation studies, it can be assumed that the magnetic field does not change in the axial direction, thereby shortening the overall calculation time. Although the final result is bound to have errors compared with an actual experiment, it can basically remain consistent in the overall trend of change. In the HELIC code, the magnetic field density is uniform along the axial direction, and the density distribution of the particles is also uniform along the axial direction. The radial density can be determined by the following function:
 \begin{eqnarray}\frac{n}{n_{e0}}=\left[1-\left(\frac{r}{\omega }\right)^{s}\right]^{t},\quad \omega =\frac{R_{a}}{\left[1-{f_{a}}^{1/t}\right]^{1/s}},\end{eqnarray}
where s and t are constants, $f_{a}$
represents the relative density at r = Ra
and
$f_{a}$
represents the relative density at r = Ra
and $n_{e0}$
is the density at the centre of the plasma.
$n_{e0}$
is the density at the centre of the plasma.
The radial density gradient and edge density have a great influence on the non-resonant mode conversion of H wave into TG wave and power deposition. Therefore, two common density distributions can be selected: Gaussian distribution and parabolic distribution. As shown in figure 2, these two density distributions have the same peak value on axis but different gradient in radius. The edge values of the Gaussian distribution and parabolic distribution are 0.01 and 0.1, respectively, of the peak value (Shamrai Reference Shamrai1998).
Plasma radial density distributions.

3. Results and discussion
3.1. Antenna type
During the process of HWP discharge, it is essential to utilise an antenna for coupling the energy from the RF power supply to the plasma. This allows HWP to transfer energy to electrons through the TG–H coupling mode (Ping et al. Reference Ping2019). Therefore, when designing the device, selecting the appropriate antenna type is crucial. In this study, three different antenna types were chosen: half-helix antenna (Chi, Sheridan & Boswell Reference Chi, Sheridan and Boswell1999), Boswell antenna (Charles, Boswell & Lieberman Reference Charles, Boswell and Lieberman2003) and loop antenna. The off-axis peak of the loop antenna exhibits an m = 0 mode structure, which differs from the m = 1 mode driven by the other two antennas (Jung, Park & Kim Reference Jung2004). Figures 3(a1)–3(a3), respectively, illustrate the radial relative absorption power of half-helix, loop and Boswell antennas under the parabolic density distribution. By comparing figures 3(a1) and 3(a2), it can be observed that in comparison with the loop antenna, the half-helix antenna demonstrates higher relative absorption power at the centre of the plasma but little difference in relative absorption power at the edge. Since the coupling effect mainly manifests in relative absorption power at the centre, the half-helix antenna can achieve a better coupling effect than the loop antenna. Furthermore, comparing figures 3(a1) and 3(a3) reveals that the relative absorption power of the Boswell antenna at the plasma centre is numerically higher than that of the half-helix antenna and, correspondingly, the relative absorption power of the Boswell antenna at the edge surpasses that of the half-helix antenna as well. Higher edge relative absorption power indicates more edge heating generation which significantly influences plasma power deposition. Therefore, based on the parabolic distribution, it can be concluded that the half-helix antenna produces superior coupling effect compared to the others.
Relative absorption power under three types of antennas: (a) parabolic distribution; (b) Gaussian distribution.

Figures 3(b1)–3(b3) show the relative absorption power of the half-helix antenna, loop antenna and Boswell antenna under the Gaussian density distribution. The absorption power of the half-helix antenna and Boswell antenna is higher under the Gaussian density distribution compared with the parabolic density distribution, but the overall absorption power distribution is similar. The Boswell antenna exhibits a higher edge relative absorption power than the half-helix antenna, resulting in a decline in the coupling effect. However, the loop antenna with the Gaussian distribution presents a completely different distribution of relative absorption power, possibly due to its two-dimensional nature being affected by different radial density distribution.
Based on the analysis above, it can be concluded that the half-helix antenna can produce better power deposition effects and excite higher plasma density compared with the other two antennas. Therefore, the half-helix antenna is selected as the excitation antenna for HMHX.
3.2. Radio frequency
The operating frequency of the antenna is a crucial parameter for HWP discharge, as it directly impacts the power deposition effect between the antenna and plasma. In this study, six common RFs were selected for the HWP discharge, and simulation calculations were conducted to determine the most suitable RFs for HMHX, as shown in figure 4. The black axis corresponds to 13.56 MHz and the red axis corresponds to 2, 20.34, 27.12, 40.68 and 60 MHz.
Relative absorption power under six RFs. Black axis: 13.56 MHz; red axis: 2, 20.34, 27.12, 40.68 and 60 MHz.

Relative absorption power under four types of gas: (a) argon and nitrogen; (b) hydrogen and helium.

The results show that the absorption power distribution shows a significant edge enhancement characteristic, and the relative absorption power in the central region is close to zero under the low-frequency condition of 2 MHz. This phenomenon indicates that the helicon wave mode cannot be excited effectively at this frequency, and the discharge is mainly maintained in the inductive coupling mode. It is worth noting that the power absorption curve shows obvious oscillation in the near-edge region, which may be caused by wave mode coupling caused by the low-frequency standing-wave effect. The observed results are consistent with the physical characteristics of the enhanced edge plasma density in a typical ICP discharge. When the frequency is increased to 13.56 MHz, the absorption power distribution changes significantly: the relative absorption power in the central region increases significantly (compared with the 2 MHz condition), while the absorption power in the edge region increases synchronously. The two characteristic parameters show good spatial equilibrium, which indicates that the helical wave dominant discharge mode is successfully excited. The equalisation trend of the spatial distribution confirms that increasing the RF can effectively suppress the inhomogeneity of plasma parameters, which is consistent with the wave field homogenisation effect predicted by spiral wave propagation theory. When the RF continues to increase to 27.12 MHz, the absorbed power in the central region decreases significantly, while the absorption power in the edge region continues to decline. This phenomenon reveals the cutoff effect of electromagnetic wave propagation under high-frequency conditions: when the driving frequency exceeds the critical value, the axial propagation of the spiral wave is strongly inhibited, while the absolute absorption efficiency of the TG wave still decreases with the increase of frequency although it maintains a strong power absorption capacity. This frequency-dependent mode conversion mechanism directly affects the stability of the HWP discharge. Although Chen’s research demonstrated that a RF of 27.12 MHz could also achieve HWP discharge mode, the antenna they selected for that frequency was a single-turn annular antenna, and the plasma density generated by its discharge was also lower than that at 13.56 MHz (Chen Reference Chen2012). In HMHX, the antenna used is a half-helix antenna. The special antenna structure enables it to present the best discharge effect at 13.56 MHz. The results of simulation provide an important theoretical basis for parameter optimisation of HMHX. The follow-up plan is to carry out experimental verification through Langmuir probe diagnosis and emission spectrum diagnosis, focusing on the mode conversion threshold characteristics of the 13.56 MHz band.
3.3. Gas type
For HWP discharge, it is necessary to select different gases as discharge gas according to the specific experiment. In common HWP discharge experiments, the selected gases typically include argon, nitrogen, hydrogen and helium. Figure 5 illustrates the radial relative absorption power corresponding to different gases. From figure 5(a), it can be observed that when argon and nitrogen are used as discharge gases, the radial relative absorption power is higher at the centre and edge of the plasma than at other locations. A higher centre absorption power can enhance the power deposition effect of the antenna. However, a higher edge absorption power results in increased temperature at the antenna’s edge which will lead to more edge heating due to its own material in the HWP discharge process. Excessive edge heating not only reduces power deposition but also shortens the lifespan of the antenna. Therefore, effective cooling of the antenna itself is crucial during actual discharge experiments. Figure 5(b) demonstrates that when using hydrogen and helium as discharge gases, the radial relative absorption power presents a completely different distribution compared with that for argon and nitrogen, with absorption power gradually increasing from centre to edge. While this affects edge heating, it does not allow for higher relative absorption power in the centre which significantly impacts the antenna’s power deposition. Without an effective power deposition effect, achieving HWP discharge mode becomes impossible. However, it cannot be denied that in the research of Houshmandyar and Woller, HWP discharge using helium as the discharge gas has been achieved (Houshmandyar, Sears & Thakur Reference Houshmandyar2010; Woller, Whyte & Wright Reference Woller, Whyte and Wright2017). However, in the experimental research of HMHX, helium discharge has never been achieved, which may be closely related to the structure of the antenna and the parameters of the discharge. In this regard, it is necessary to draw on the experience of other successful discharges and further optimise the device.
To sum up, argon and nitrogen are selected as discharge gases in HMHX to achieve the best power deposition effect. However, due to the strong reducibility of hydrogen, if hydrogen were to be used as a discharge gas to achieve HWP discharge, the higher plasma density will undoubtedly amplify the reducibility of hydrogen in HWP discharge mode, which will have a far-reaching impact on much material processing (Guittienne et al. Reference Guittienne2021). Therefore, the antenna size will be changed later in this paper to achieve hydrogen–HWP discharge.
3.4. Parameter optimisation
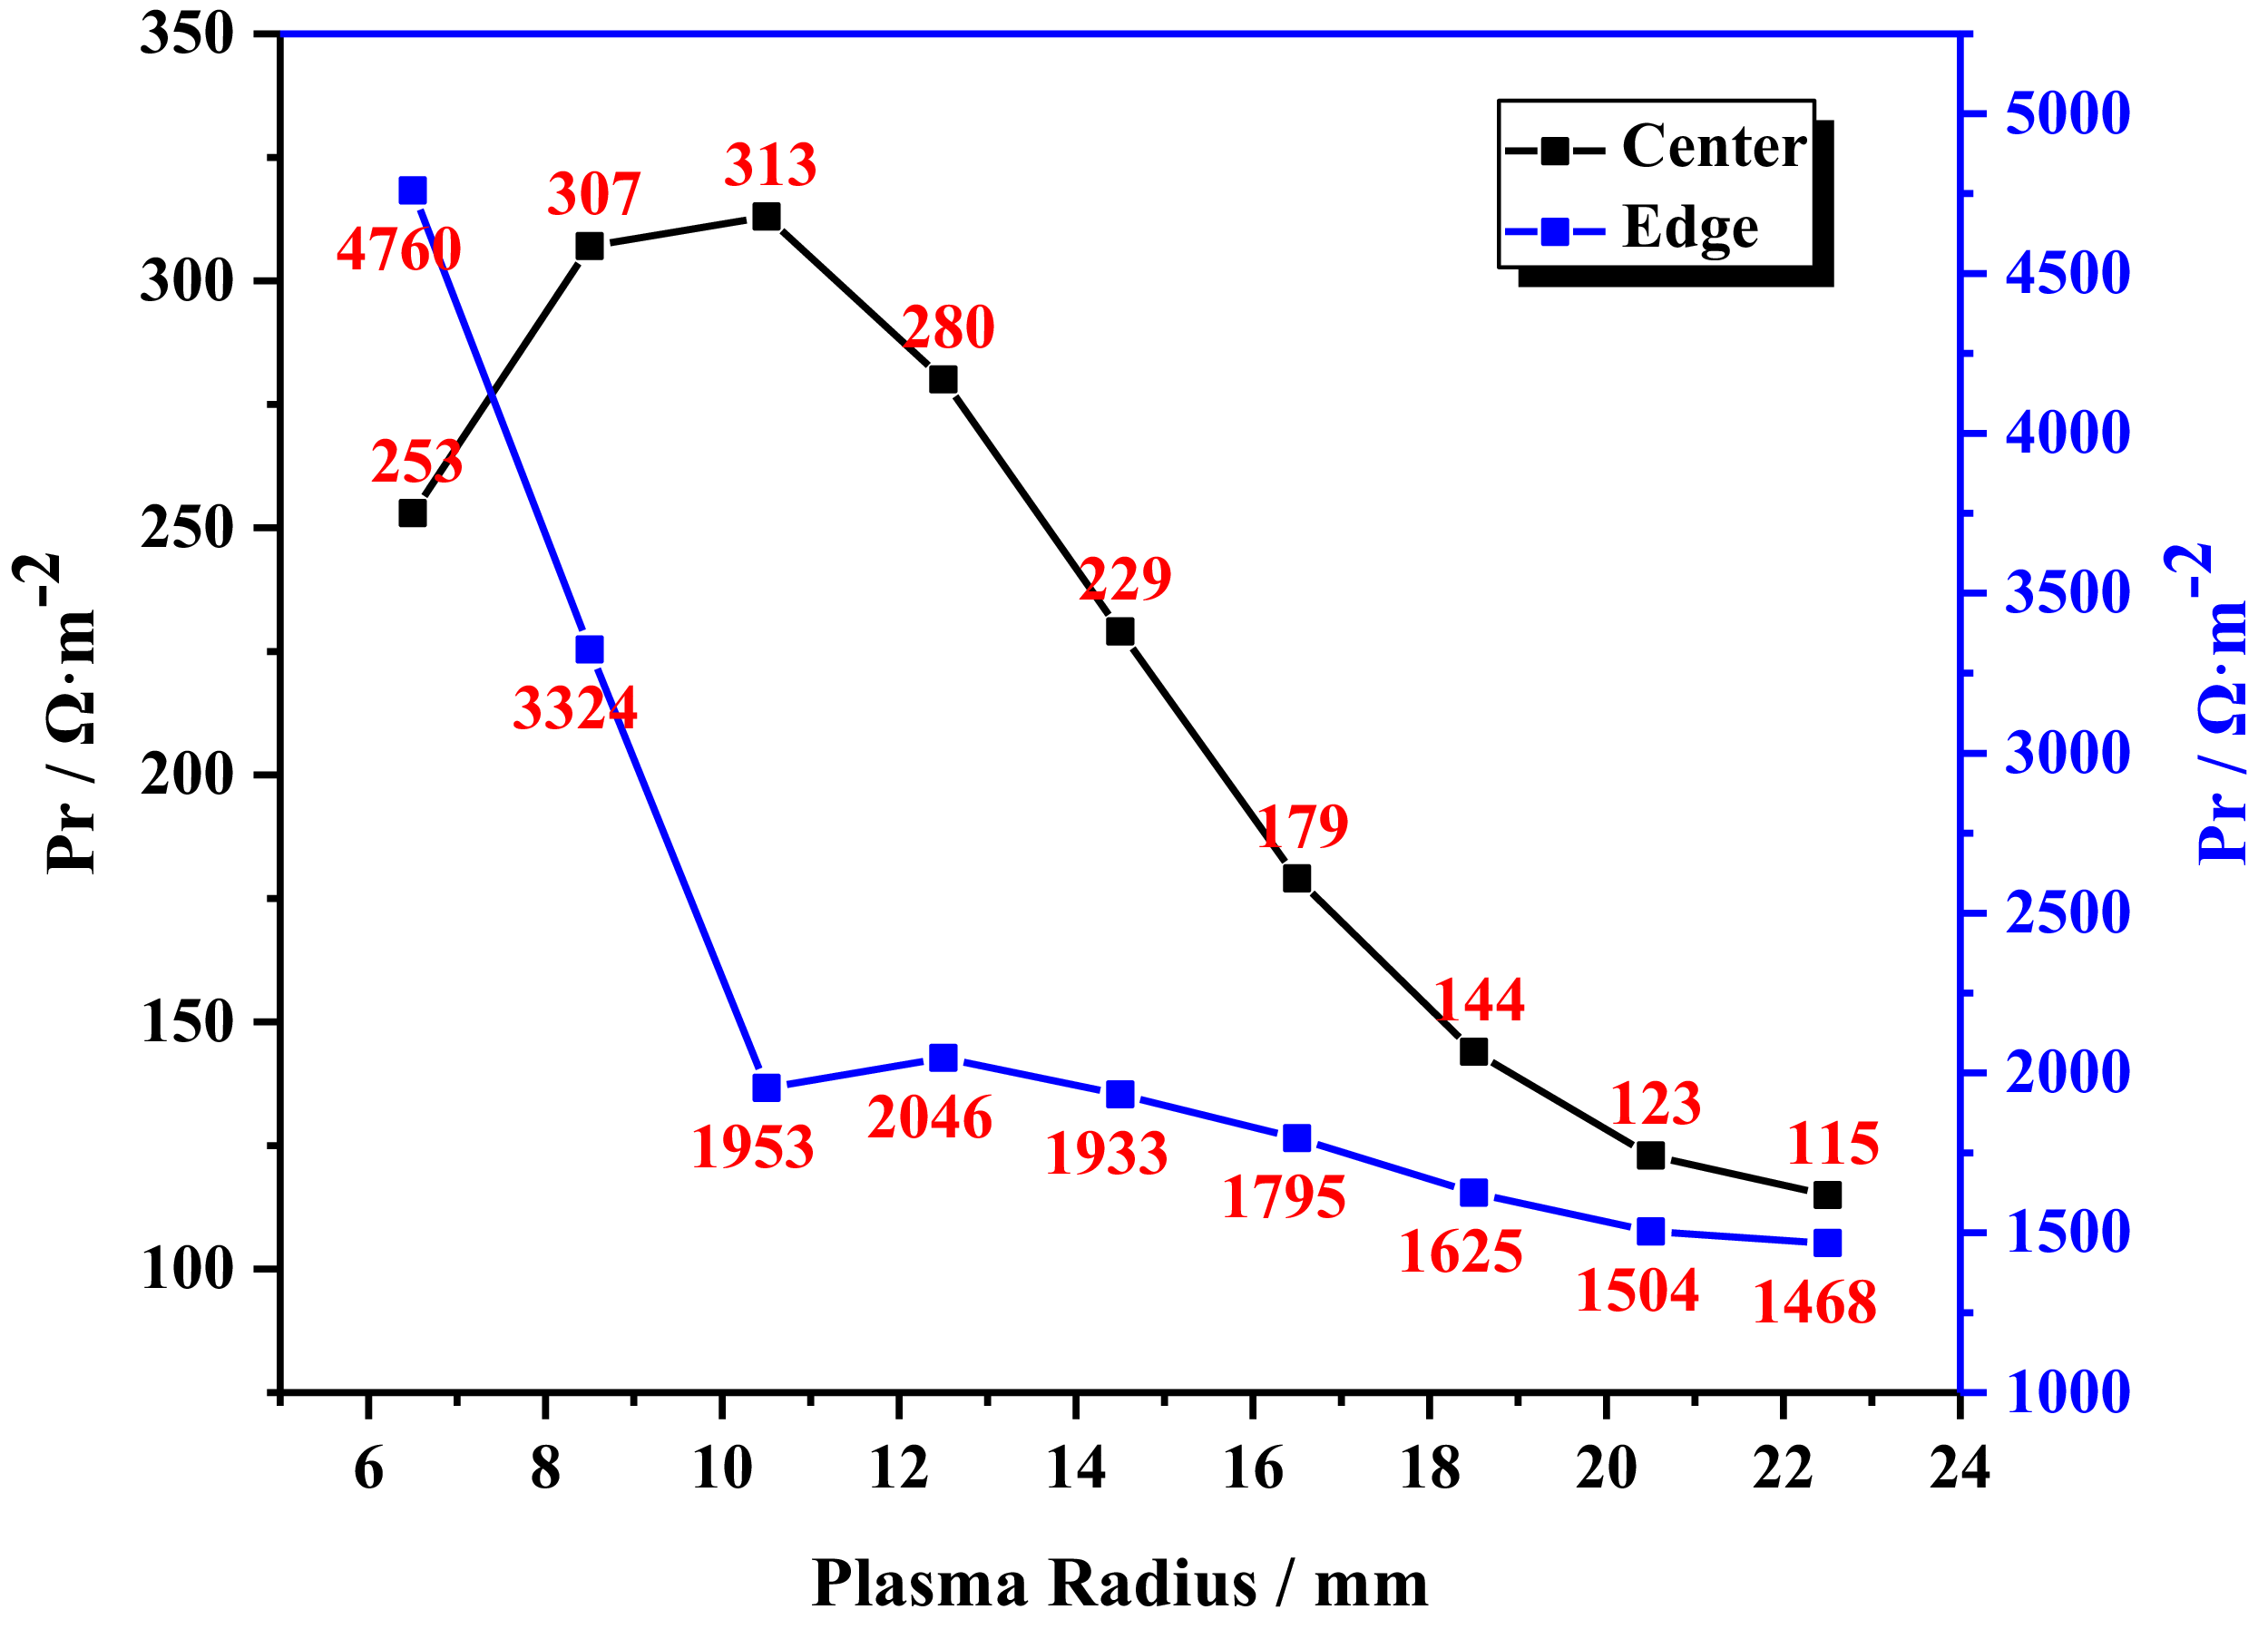
To date, many studies have achieved hydrogen–HWP discharge (Lumsdaine, Thakur & Tipton Reference Lumsdaine2020; Caneses Marine et al. Reference Caneses Marin2021; Thakur, Simmonds & Caneses Reference Thakur2021). To realise hydrogen–HWP discharge in HMHX, experience can be drawn from these successful cases to better optimise the devices. Firstly, it is essential to optimise the parameters of the helicon wave antenna. When the antenna is a half-helix antenna, and the RF is 13.56 MHz, various sizes of antennas have been chosen for calculation, each corresponding to a different plasma radius. The plasma radius ranges from 6.5 to 22.5 mm at intervals of 2 mm. Figure 6 illustrates how the relative absorption power at the centre and edge of the plasma varies with the plasma radius. During HWP discharge experiments, higher absorption power at the centre can enhance the power deposition effect of both the antenna and plasma. Conversely, higher power absorption at the edge will result in increased edge heating, leading to an uneven radial energy distribution within the plasma and ultimately reducing overall power deposition efficiency. Therefore, when designing a HWP source, it is crucial to avoid generating high relative absorption power at the edge.
Relative absorption power at the centre and edge for different sizes.

The relative absorption power in the central region represented by the black curve presents a typical single-peak distribution with the change of plasma radius. When the plasma radius gradually increases from 6.5 mm, the absorption power at the centre rises rapidly, reaching a peak value (about 1.3 times the initial value) at r = 10.5 mm, and then showing a decreasing trend with the continuing increase of the radius. This phenomenon shows that there is an optimal plasma size effect: too small a discharge cavity cannot afford an effective energy coupling, and too large a size leads to increased energy dissipation. In contrast, the relative absorption power of the edge region represented by the blue curve decreases monotonically with the increase of the radius. It is worth noting that in the range of r $\,{\lt}\,$
10.5 mm, the edge power will decrease sharply with the increase of the radius (the decrease rate is 59 %), and when r
$\,{\lt}\,$
10.5 mm, the edge power will decrease sharply with the increase of the radius (the decrease rate is 59 %), and when r $\,{\gt}\,$
10.5 mm, the decline rate is significantly reduced. This shows that when the plasma radius exceeds the critical threshold, the contribution of the edge effect to the overall power deposition is negligible.
$\,{\gt}\,$
10.5 mm, the decline rate is significantly reduced. This shows that when the plasma radius exceeds the critical threshold, the contribution of the edge effect to the overall power deposition is negligible.
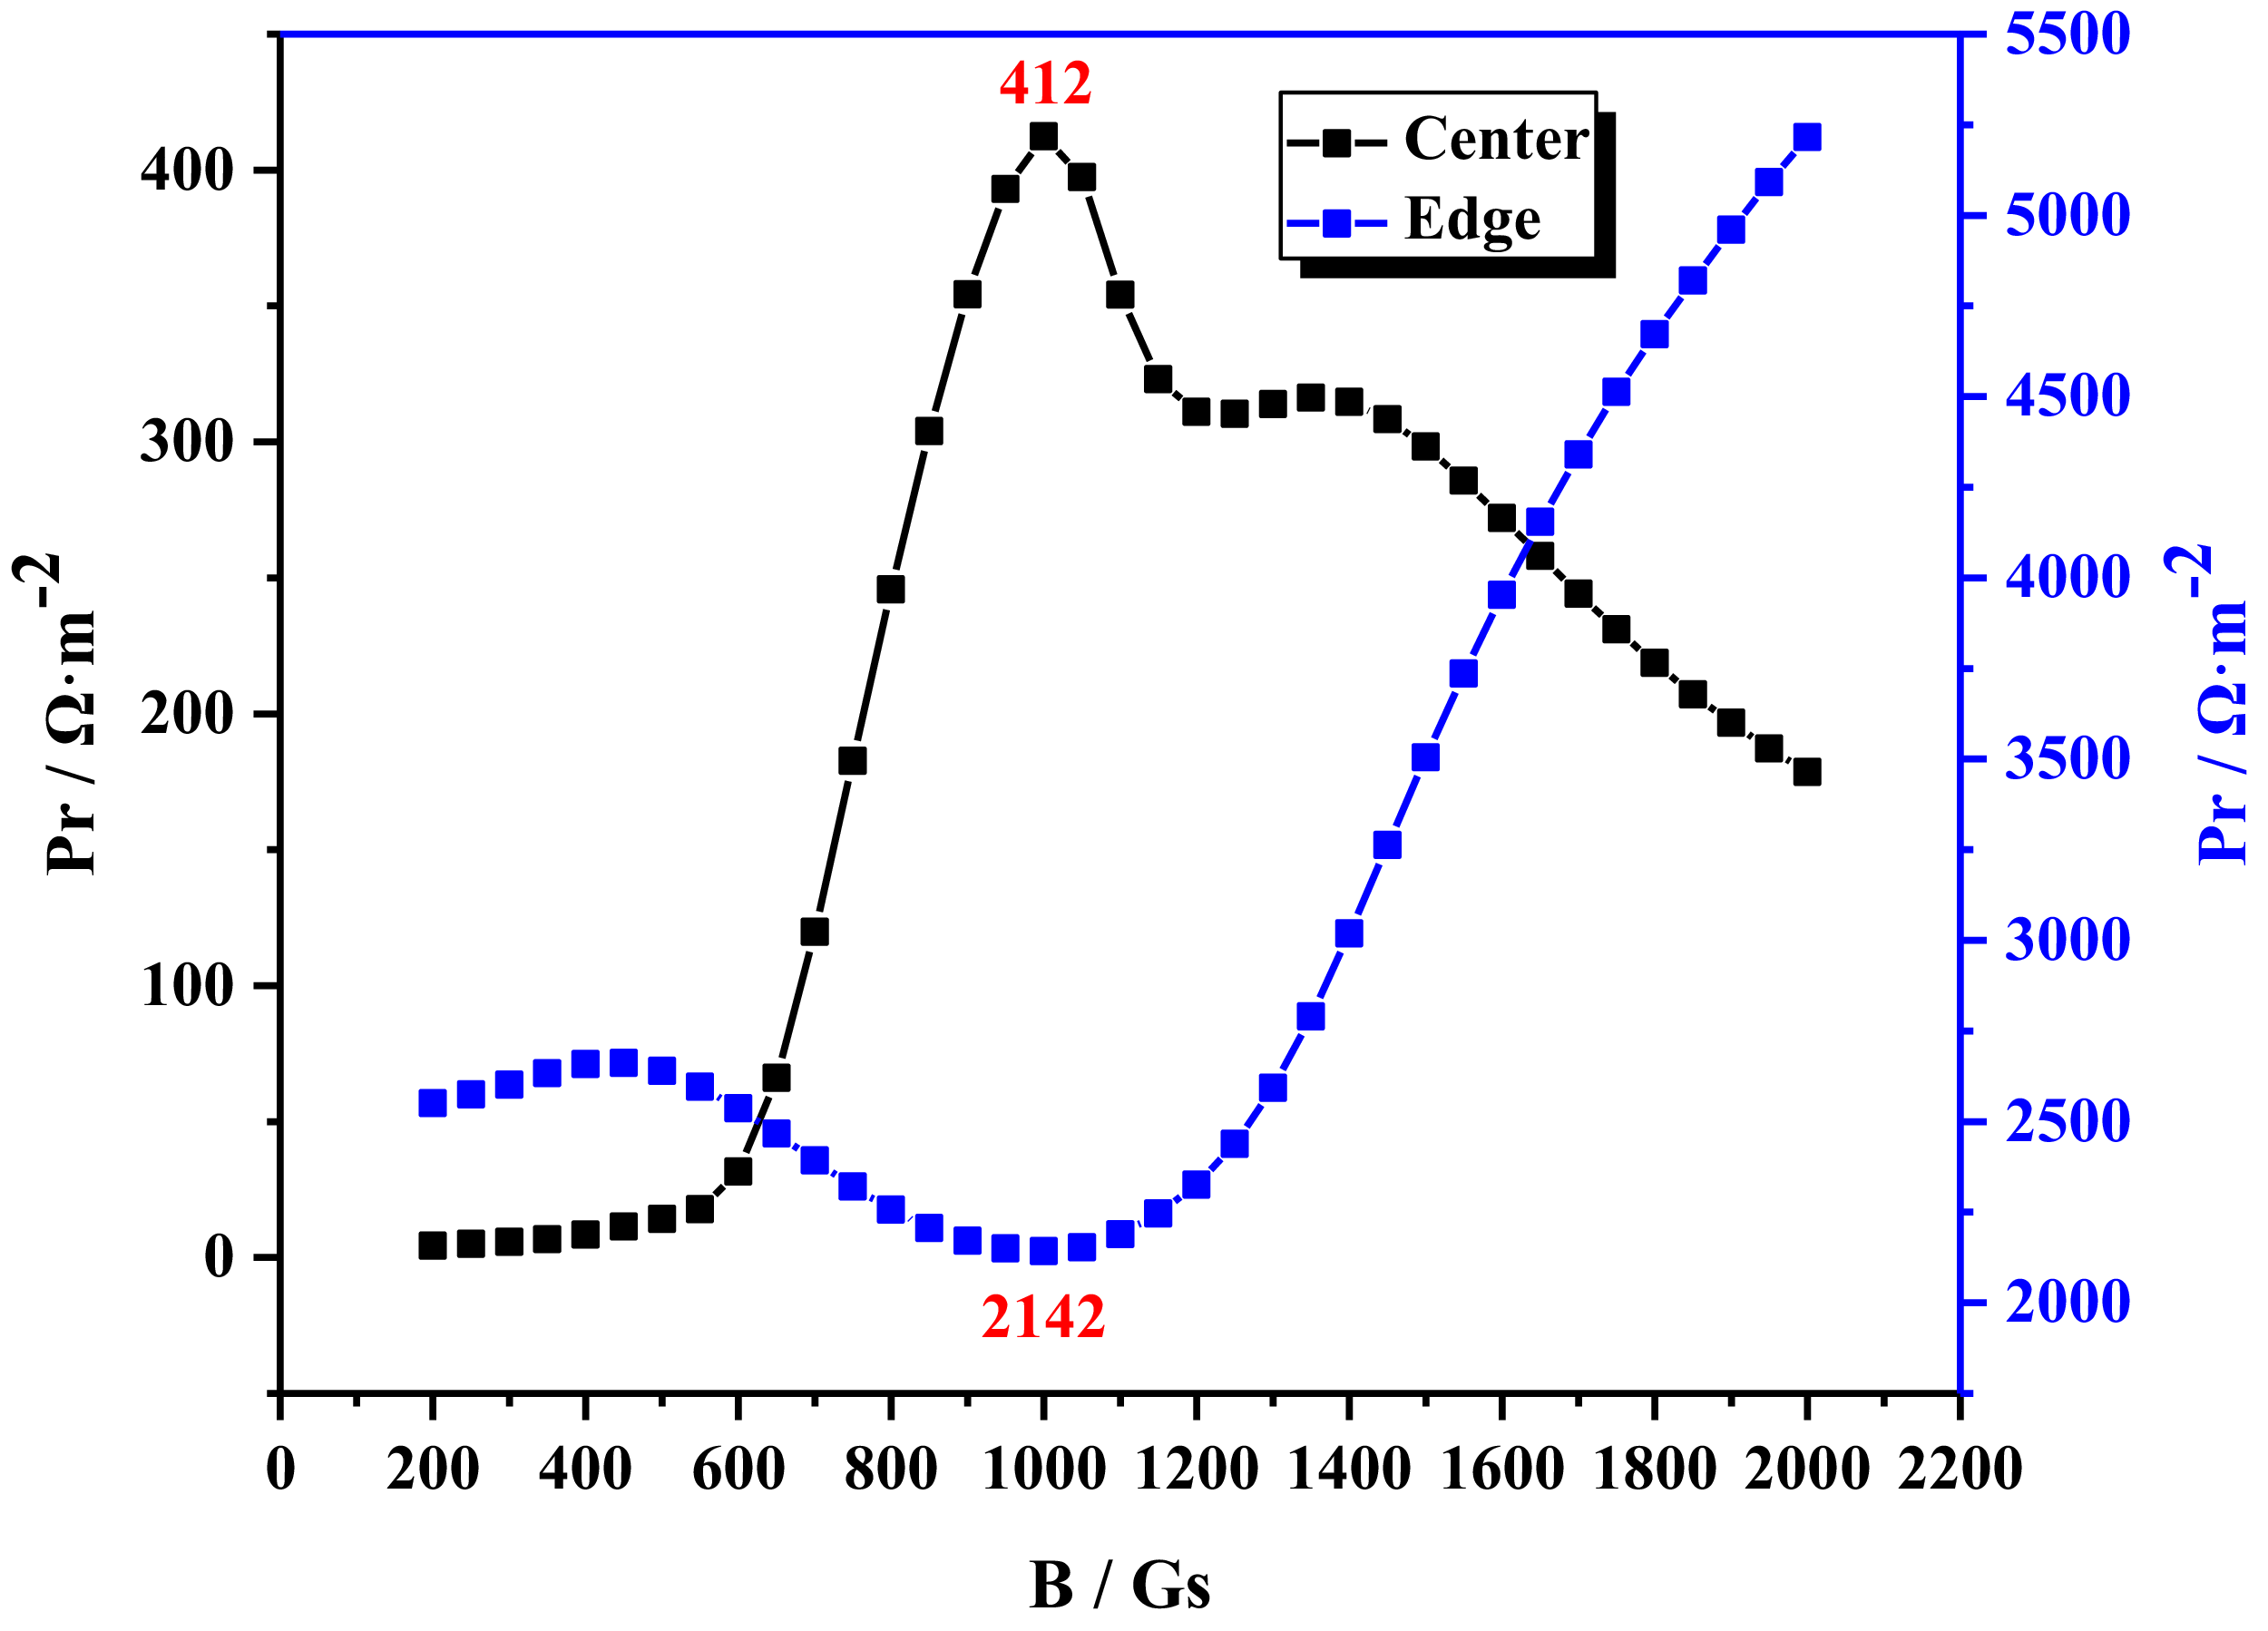
In the HWP discharge experiment, an external static magnetic field is applied to facilitate deep propagation of H waves within the plasma column, resulting in a greater power deposition effect. Different sizes of helicon wave antennas require different magnetic fields to confine various charged particles in the plasma, optimising the effect of the HWP discharge (Magarotto et al. Reference Magarotto, Melazzi and Pavarin2019). As for the selection of the magnetic field interval, Thakur’s research has achieved significant results in the study of magnetic field scanning in HWP discharge. That research indicates that when the magnetic field varies within a range from low to relatively high (400–2400 Gs), a high-density HWP discharge can be achieved (Thakur, Brandt & Cui Reference Thakur2014). In order to obtain the best hydrogen–HWP discharge in HMHX, the results for the half-helix antenna and RF of 13.56 MHz are maintained under the premise of a plasma radius of 10.5 mm, and the magnetic field intensity is changed to determine the best magnetic field. The calculated range for the magnetic field is 200–2000 Gs. The relative absorption power at the centre and edge under varying magnetic fields is shown in figure 7. It can be observed that as the magnetic field intensity increases, the absorption power at the centre initially rises and then declines. At a magnetic field intensity of 1000 Gs, maximum relative absorption power at the centre is achieved, while at the edge, absorption power decreases initially and then increases with increasing magnetic field strength until reaching a minimum value at 1000 Gs. In HWP discharge experiments, greater absorption power at the centre indicates improved power deposition effects, while lower absorption power at the edge signifies reduced edge heating effects and more uniform energy distribution resulting in better discharge effects. Therefore, both excessively small or large magnetic fields have negative impacts on discharges. For newly designed antennas, optimal discharge effects are achieved when using a magnetic field intensity of 1000 Gs.
Relative absorption power at the centre and edge for different magnetic fields.

4. Conclusions
Using the HELIC code, this study focuses on the parameter optimisation design of a HWP source and compares the results when the radial density distribution is parabolic and Gaussian.
The findings indicate that the half-helix antenna can generate a more effective power deposition and excite higher plasma density compared with the loop antenna and Boswell antenna. Additionally, it is observed that as the RF increases from 2 to 13.56 MHz, the HWP discharge achieves better power deposition effects. However, as the frequency continues to increase beyond 13.56 MHz, there is a gradual decrease in relative absorption power at both the edge and centre of the plasma, with a more significant decrease at the centre. When argon and nitrogen are used as discharge gases, higher centre absorption power can enhance the power deposition effect of the antenna. It is crucial to effectively cool the antenna to mitigate edge heating resulting from higher edge absorption power. Therefore, for HMHX, we recommend using a half-helix antenna as an excitation antenna with a frequency of 13.56 MHz as its power source while utilising argon and nitrogen as discharge gases.
In order to achieve hydrogen–HWP discharge, different sizes of antennas are considered for calculation purposes. When considering relative absorption powers at both the centre and edge, an optimal design consists of an antenna with a plasma radius of 10.5 mm and an overall radius of 13.5 mm. Furthermore, it is noted that different magnetic fields are required for various sizes of helicon wave antennas in order to confine charged particles within the plasma effectively. Too small or too large a magnetic field will have adverse effects on discharge performance. For newly designed antennas targeting hydrogen–HWP discharge applications, it has been determined that achieving optimal discharge effects requires a magnetic field intensity of 1000 Gs.
The results indicate that different types of HWP discharge experiments can be conducted by designing various sizes of HWP sources. We can carry out hydrogen–HWP discharge experiments using the new antenna based on parameters obtained in this paper to verify the accuracy of calculated results. Additionally, these findings can serve as a reference for optimising existing HWP sources and designing future HWP sources.
Acknowledgements
Editor Troy Carter thanks the referees for their advice in evaluating this article.
Funding
This work was supported by the National Natural Science Foundation of China (grant numbers 12175160, U2341250, 12305284); the National Key R&D Program of China (grant number 2022YFE03050001); and the Priority Academic Program Development of Jiangsu Higher Education Institutions (grant number PAPD).
Declaration of interests
The authors report no conflict of interest.


 Open access