





Adolescence is a transitional period marked by pubertal changes, shifting academic and vocational expectations, and rapidly transforming interpersonal relationships (Sawyer et al., Reference Sawyer, Azzopardi, Wickremarathne and Patton2018). These transitions can be challenging for social and mental health. Indeed, many adolescents experience heightened loneliness, defined as the perceived discrepancy between one’s desired and actual social connections (Twenge et al., Reference Twenge, Haidt, Blake, McAllister, Lemon and Le Roy2021). They also experience increased vulnerability to depressive symptoms, which can include low mood, lack of motivation, and disturbances in sleep, appetite, and functioning (Qualter et al., Reference Qualter, Brown, Rotenberg, Vanhalst, Harris, Goossens, Bangee and Munn2013; Shorey et al., Reference Shorey, Ng and Wong2022). Given the relatively high prevalence and co-occurrence of loneliness and depressive symptoms in adolescents (Cacioppo et al., Reference Cacioppo, Hawkley, Ernst, Burleson, Berntson, Nouriani and Spiegel2006; Shorey et al., Reference Shorey, Ng and Wong2022; Twenge et al., Reference Twenge, Haidt, Blake, McAllister, Lemon and Le Roy2021), there is an urgent need to clarify how they co-develop and potentially influence one another, to allow us to better support adolescents’ well-being (Mund et al., Reference Mund, Maurer, Jeronimus and Buecker2025).
The ways loneliness and depressive symptoms influence each other may depend on the timescales of observation. In the short term, a balancing feedback loop is theorized to be in play in two steps: initially, transient loneliness increases depressed feelingsFootnote 1 for self-preservation. In turn, these feelings prepare adolescents for reaffiliation that reduces loneliness. Without this short-term balancing feedback loop in place, adolescents risk long-term increases in loneliness and depressive symptoms. Furthermore, over the long term, loneliness and depressive symptoms are thought to exacerbate each other in a reinforcing feedback loop (Allen & Badcock, Reference Allen and Badcock2003; Balsters et al., Reference Balsters, Krahmer, Swerts and Vingerhoets2013; Burholt & Scharf, Reference Burholt and Scharf2014; Cacioppo & Cacioppo, Reference Cacioppo and Cacioppo2018; Qualter et al., Reference Qualter, Vanhalst, Harris, Van Roekel, Lodder, Bangee, Maes and Verhagen2015; Starr & Davila, Reference Starr and Davila2008; Steger & Kashdan, Reference Steger and Kashdan2009). This study tests the above dynamics within and across timescales in two steps. First, we examined the temporal bidirectionality between loneliness and depressive symptoms at two timescales: half-yearly (long-term), using a sample of 774 adolescents, and hourly (short-term; approximately every 1.5 hr), using a subset of 84 adolescents. Second, we tested whether these hourly dynamics in loneliness and depressed feelings were predictive of half-yearly changes in loneliness and depressive symptoms. By investigating how these timescales interconnect, this study aims to clarify how short-term emotion dynamics shape adolescents’ long-term changes in social and mental health.
Do loneliness and depressive symptoms influence each other differently over the short- and long-term?
Loneliness and depressive symptoms are distinct concepts, as they center on perceived social isolation and mood, respectively. But they do often overlap in experience: An ostracized adolescent may feel depressed in response to isolation, while an adolescent coping with depressive symptoms may feel lonely in enduring the burden from depressive symptoms (Cacioppo et al., Reference Cacioppo, Hawkley, Ernst, Burleson, Berntson, Nouriani and Spiegel2006). This overlap suggests that loneliness and depressive symptoms may not only co-occur but also exert mutual influences over time.
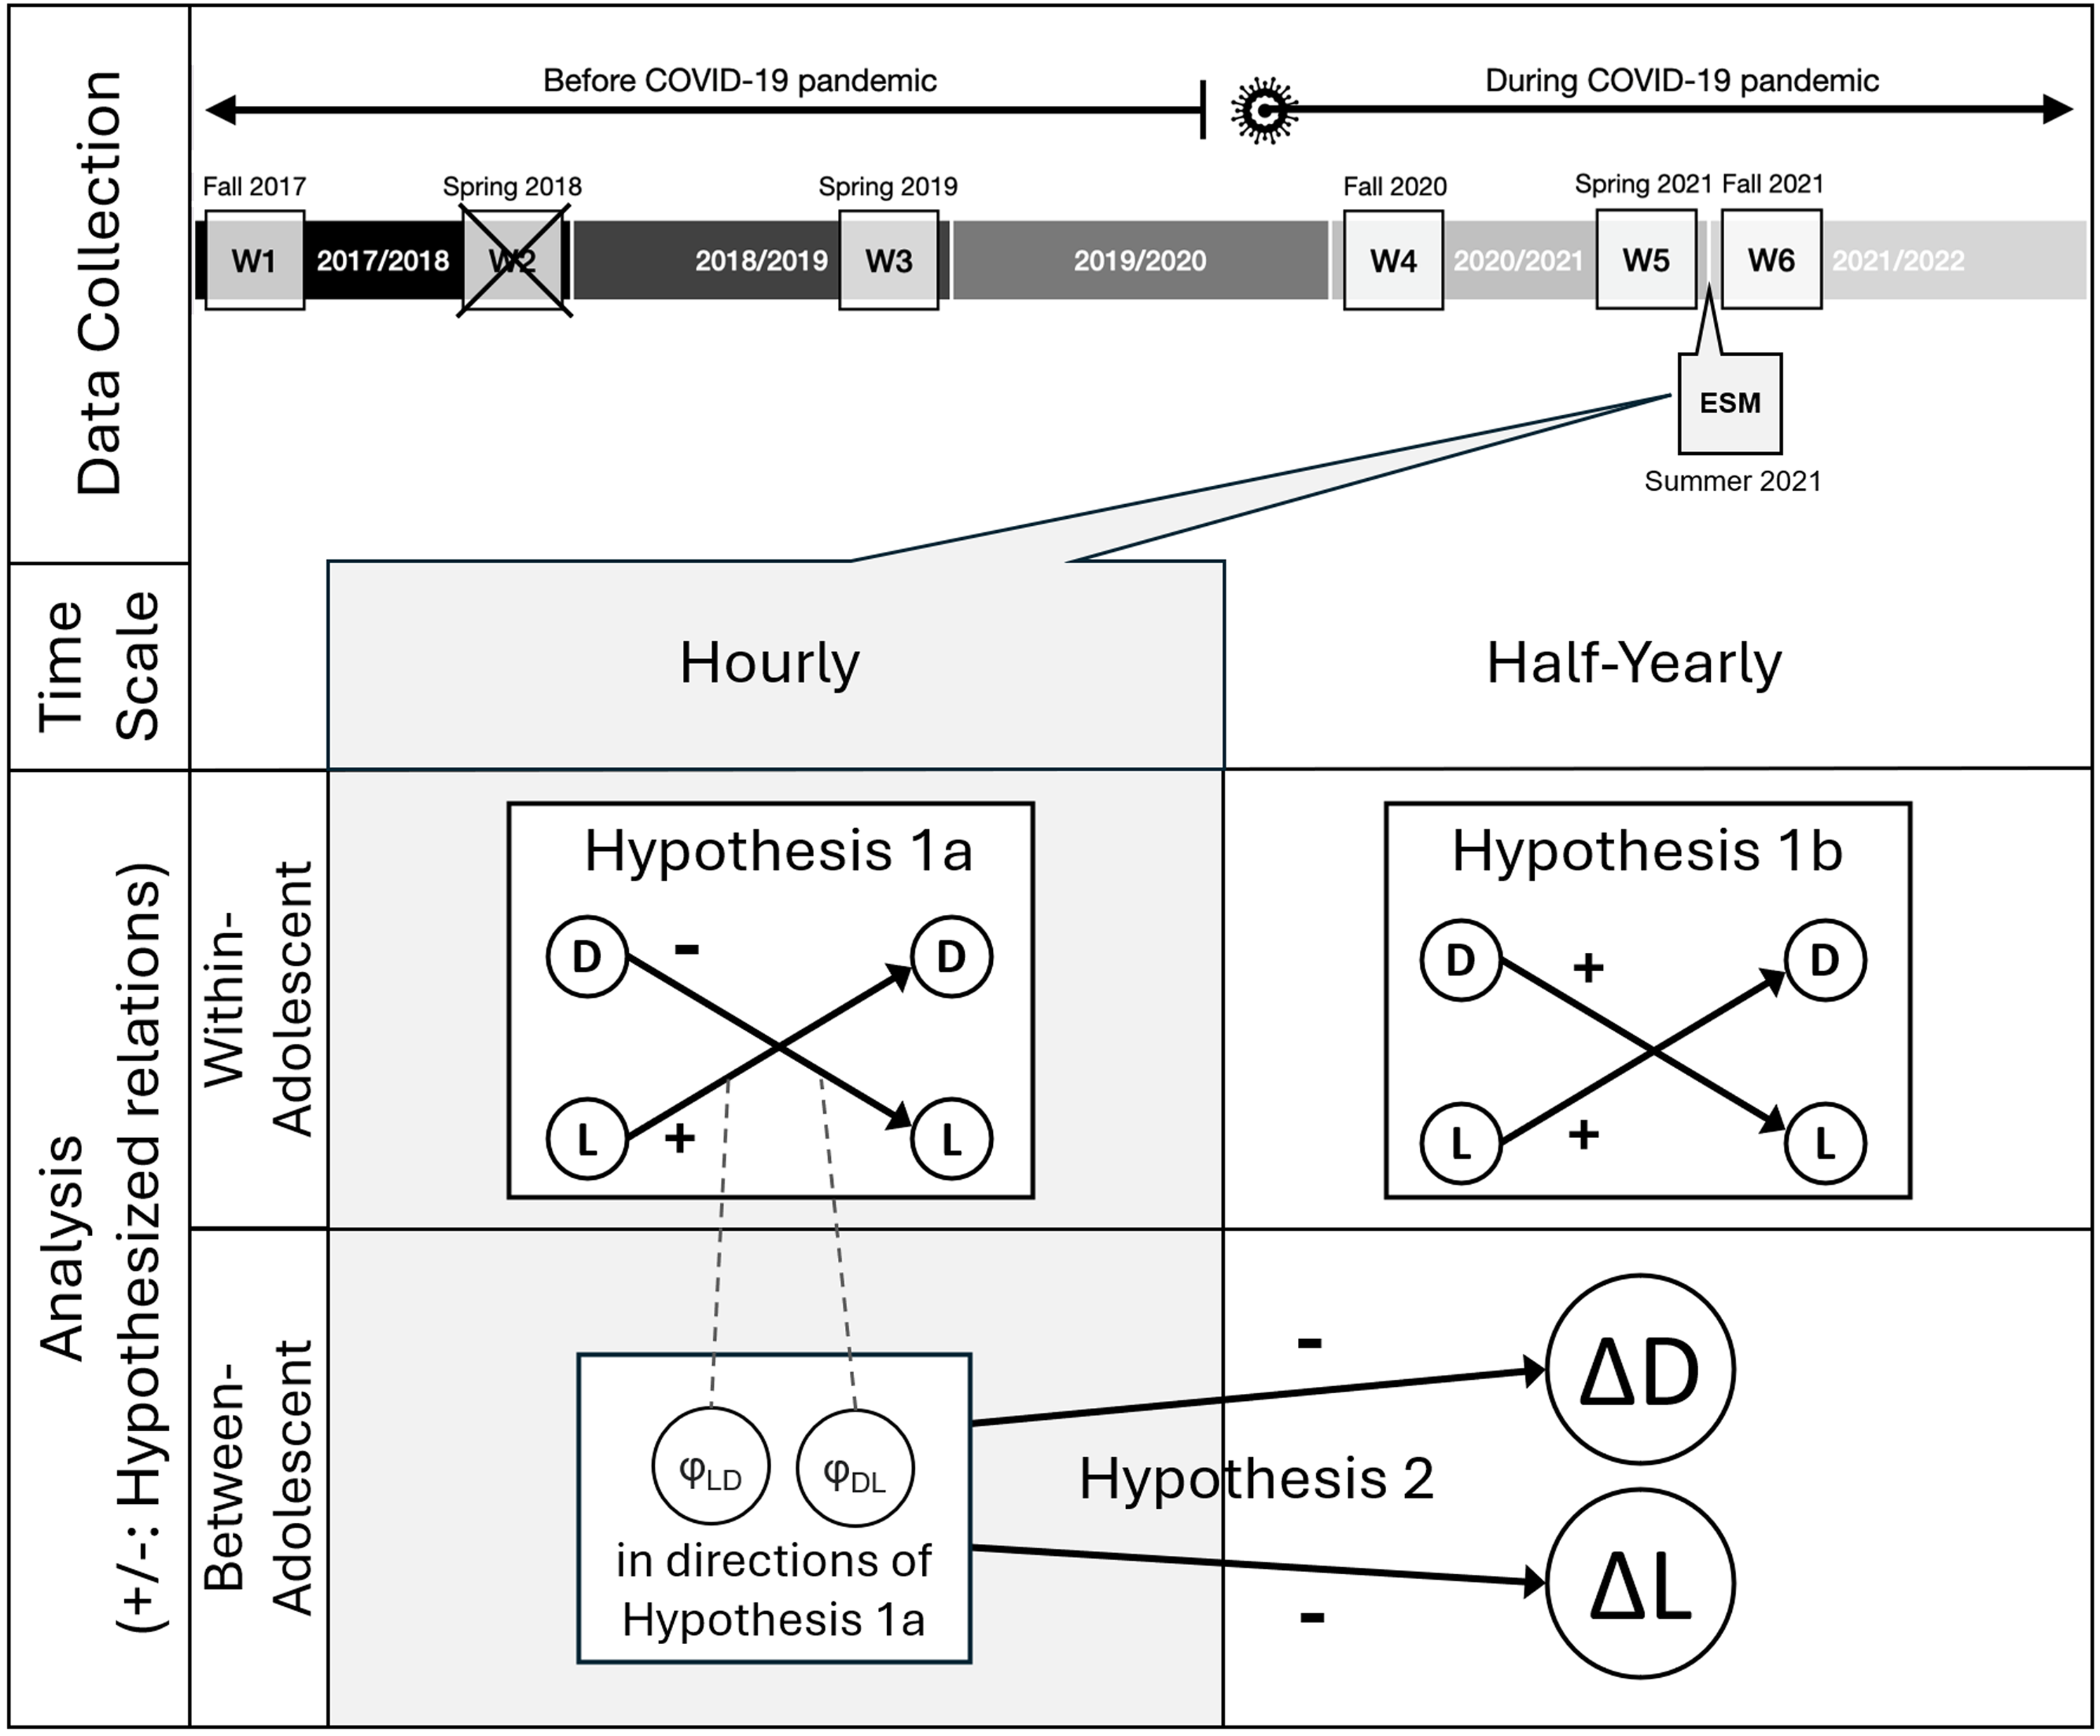
Crucially, the nature and the direction of these influences may shift depending on the timescales of observation, such as hourly and half-yearly. This timescale dependency has been highlighted as a general principle in dynamic systems theories of developmental psychopathology (Granic, Reference Granic2005; Lougheed & Keskin, Reference Lougheed and Keskin2021). For example, avoidance may reduce anxiety in the short term but maintain it in the long term (Hofmann & Hay, Reference Hofmann and Hay2018). This same principle underlies the Evolutionary Theory of Loneliness (ETL, Cacioppo & Cacioppo, Reference Cacioppo and Cacioppo2018; Qualter et al., Reference Qualter, Vanhalst, Harris, Van Roekel, Lodder, Bangee, Maes and Verhagen2015), which specifically theorizes how loneliness and depressive symptoms influence each other differently across short- and long-term timescales. According to the ETL, momentary fluctuations in loneliness can serve an adaptive function. When adolescents experience socially painful events – such as peer rejection – heightened loneliness signals their needs for reaffiliation. Before reaffiliation is taking place, however, loneliness can activate a coordinated set of responses, from neural to behavioral levels, aimed at promoting self-preservation. A transient depressive state is among such responses. In this state, adolescents tend to behave in a withdrawn manner, which helps them avoid further social rejection (Allen & Badcock, Reference Allen and Badcock2003). Importantly, depressed feelings may function as social signals, helping others perceive adolescents’ needs for support and respond with affiliation (Allen & Badcock, Reference Allen and Badcock2003; Balsters et al., Reference Balsters, Krahmer, Swerts and Vingerhoets2013). Through these processes, heightened loneliness initially increases depressed feelings, which in turn help to reduce loneliness, forming a short-term balancing feedback loop (Figure 1, Hypothesis 1a).
Overview of the data collection timeline and hypotheses (H1a, H1b, and H2). Note. L = Loneliness; D = Depressive Symptoms; Δ = Change; φLD and φDL = Person-Specific Estimates of Within-Adolescent Temporal Relations (LD = Lonely→Depressed; DL = Depressed→Lonely) ESM = Experience Sampling Methods Study; W1, … W6: Wave of Panel Data Collection. W2 is crossed out because it did not measure loneliness nor depressive symptoms.
The short-term associations between loneliness and depressed feelings have recently been examined in Experience Sampling Methods (ESM) studies, which assess participants’ feelings multiple times per day across several days or weeks in their daily lives. Studies on young to middle-aged adults have shown that momentary loneliness predicts increases in depressed feelings in subsequent hours or days (Kuczynski et al., Reference Kuczynski, Piccirillo, Dora, Kuehn, Halvorson, King and Kanter2024; Yung et al., Reference Yung, Chen and Zawadzki2023), but have not tested the reverse relation (i.e., depressed→loneliness effects). We are only aware of one study that tested the mutual influences between loneliness and depressed feelings in a four-hour window among university students’ daily lives. This study found that momentary loneliness predicted increases in depressed feelings four hours later, but not in the opposite direction (Speyer et al., Reference Speyer, Murray and Kievit2024). However, the previous study was conducted under strict COVID-19 restrictions, including schools and hospitality closures, making it unclear how these findings generalize to adolescents in daily life under less extreme COVID-19 restrictions. It is therefore warranted to study whether loneliness and depressed feelings influence each other bidirectionally in the short-term, to infer whether self-preservation and reaffiliation take place as the ETL would expect.
In contrast to this short-term balancing feedback loop, ETL posits that loneliness and depressive symptoms form a reinforcing feedback loop over a longer timescale (Figure 1, Hypothesis 1b). Prolonged loneliness may repeatedly activate depressive responses (Cacioppo & Cacioppo, Reference Cacioppo and Cacioppo2018). Such repeated depressive symptoms negatively bias adolescents’ perceptions of their social environments (Burholt & Scharf, Reference Burholt and Scharf2014) and may strain peer relationships, as peers may get tired of the excessive demands from the depressive adolescents (e.g., seeking reassurance, Starr & Davila, Reference Starr and Davila2008). The lower quality peer relationships may, in turn, lead to reduced support and may intensify feelings of social isolation (Steger & Kashdan, Reference Steger and Kashdan2009) – thereby closing the long-term cycle of mutual reinforcement. Longitudinal studies empirically support this long-term reinforcing feedback loop, as loneliness and depressive symptoms predict one another across two months to one year later (Danneel et al., Reference Danneel, Nelemans, Spithoven, Bastin, Bijttebier, Colpin, Van Den Noortgate, Van Leeuwen, Verschueren and Goossens2019; Lapierre et al., Reference Lapierre, Zhao and Custer2019; Lasgaard et al., Reference Lasgaard, Goossens and Elklit2011; Vanhalst et al., Reference Vanhalst, Klimstra, Luyckx, Scholte, Engels and Goossens2012). However, these earlier studies relied on traditional statistical approaches: the cross-lagged panel models. These traditional models treat all measurement values as representing within-person changes without disentangling within-person portions from time-invariant, between-person portions of measurement across time. As a result, these earlier studies likely had biased estimates that did not represent the actual within-person changes over time (Hamaker, Reference Hamaker2023; Kristensen et al., Reference Kristensen, Urke, Larsen and Danielsen2023; Lucas, Reference Lucas2023). It is therefore warranted to re-examine the long-term bidirectional influences between loneliness and depressive symptoms with methods tailored to adequately capture within-adolescent changes.
A. Do short-term dynamics between loneliness and depressive symptoms shape their long-term changes?
Psychological processes can not only vary in direction and strength depending on the timescale, but may also exert influence from one timescale to another. From a dynamic systems perspective, processes linking loneliness and depressive symptoms may unfold on nested and interdependent timescales (Granic, Reference Granic2005), a phenomenon also referred to as multiscale coupling (Jordan, Reference Jordan2013). In such a framework, short-term dynamics may gradually accumulate and shape longer-term outcomes. Two earlier studies were relevant to this across-timescale notion and our focus on social and mental health. Elmer et al. (Reference Elmer, Geschwind, Peeters, Wichers and Bringmann2020) reported that middle-aged adults who behaviorally lingered in solitude (e.g., spending extended periods alone) were more likely to have increased depressive symptoms eight weeks later. Similarly, van Winkel et al. (Reference van Winkel, Wichers, Collip, Jacobs, Derom, Thiery, Myin-Germeys and Peeters2017) found that female adults whose hourly loneliness strongly lingered (e.g., one lonely moment strongly predicted the next) were likely to develop clinical depression over 20 months. These studies have focused on short-term dynamics within single socio-affective variables (i.e., solitude and loneliness), but from the ETL, we could infer that short-term dynamics between loneliness and depressed feelings may similarly exert across-timescale influence on social and mental health.
Specifically, if the lonely-depressed balancing feedback loop is working as theorized, adolescents should show rapid recovery from transient loneliness. As a result, balancing feedback loops may buffer against long-term increases in loneliness or depressive symptoms in adolescents. In other words, effective shorter-term regulation may interrupt the longer-term reinforcing loop. To date, however, no studies have directly tested this across-timescale influence expected by the ETL.
B. The present study
Drawing on dynamic system theories and the ETL, the present study tested two pre-registered hypotheses using data from a Dutch adolescent sample assessed across two timescales: hourly and half-yearly (https://osf.io/ru48z/, Lo et al., Reference Lo, Pouwels, Eltanamly, Maciejewski, Vink and Verhagen2025). To distinguish short-term emotional states from longer-term symptomatology, we use the term depressed feelings to refer to momentary reports of feeling depressed at a specific time point, and depressive symptoms to refer to a broad continuum of symptom severity, ranging from nonclinical to clinical levels, assessed over longer intervals.
In the first Hypothesis (H1), we examined if there were hourly (H1a) and half-yearly (H1b) bidirectional temporal associations between loneliness and depressive symptoms that were consistent with mechanisms described by the ETL. H1aFootnote 2 posits an hourly balancing feedback loop: momentarily heightened loneliness is expected to predict increases in subsequent depressed feelings, while momentarily heightened depressed feelings are expected to predict decreases in subsequent loneliness. H1b posits a half-yearly reinforcing feedback loop, in which heightened trait loneliness predicts increases in trait depressive symptoms over six months, and vice versa. In Hypothesis 2 (H2), we assessed whether short-term processes shape long-term change. H2 states that adolescents with strong hourly balancing feedback loops between loneliness and depressive symptoms are protected from their half-yearly increases. With H2, we expected that the stronger the hourly person-specific estimates align with the directions expected by H1a (i.e., the more positive the lonely-to-depressed temporal relation, and the more negative the depressed-to-lonely temporal relation), the smaller the half-yearly increasesFootnote 3 in trait loneliness and depressive symptoms would be. Building on our pre-registered hypotheses, this study also explored whether the effects tested in the hypotheses differed by sex, as sex differences may emerge during adolescence on how depressive symptoms and interpersonal functioning influence each other (Gadassi & Rafaeli, Reference Gadassi and Rafaeli2015; Rose & Rudolph, Reference Rose and Rudolph2006).
C. Methods
A. Participants and procedures
The study utilized data from Dutch adolescents participating in the “G(F)OOD together!” project (ethics approval protocol numbers: ECSW20170805-516, ECSW-2020-122, ECSW-2020-182, and ECSW-2021-043, van den Broek et al., Reference van den Broek, Verhagen, Vink and Larsen2023). Although the longitudinal study and ESM study recruited parent–adolescent dyads, in the present study only data from adolescents were analyzed. Adolescents could participate only with active consent from both parents and adolescents.
A. Longitudinal data (testing Hypothesis 1b, half-yearly timescale)
A total of 783 adolescents were recruited together with their parents throughout the six-wave longitudinal study. The majority started their participation in Wave 1 or Wave 2 through recruitment in seven secondary schools in the South and the East of the Netherlands, except 17 of them who started only at Wave 4; they were recruited through online social media advertisements.
Six waves of panel data were collected from 2017 to 2021 (Figure 1). We could not include Wave 2 data because, by design, Wave 2 did not assess adolescents’ loneliness and depressive symptoms but other variables in the “G(F)OOD together!” project irrelevant to this study. At each wave, adolescents received a small gift for their participation. Gift vouchers (ranging in value from €5 to €50) and three weekend getaways (of value €250) were raffled among the participating families. In addition, adolescents in Wave 5 and Wave 6 received €5 and €10 vouchers, respectively. The sample sizes per wave of data collection were: 667 (Wave 1), 674 (Wave 3), 306 (Wave 4: partial reopening between the first and second COVID-19 lockdown), 142 (Wave 5: the second COVID-19 lockdown), and 129 (Wave 6: partial reopening between the second and third COVID-19 lockdown). In Wave 1 to 3, participants completed surveys through Qualtrics Survey Software in school classrooms with the researchers’ presence. Due to COVID-19, Wave 4 to 6 were completed online, which resulted in relatively more drop-outs. Drop-outs were predicted by older age, but not by sex nor educational level (van den Broek et al., Reference van den Broek, Maran, Beckers, Burk, Verhagen, Vink and Larsen2024). Furthermore, equivalence tests showed that adolescents who did or did not drop out by Wave 6 had similar levels of Wave 1 loneliness and depressive symptoms (Supplemental Material 1). As pre-registered, we excluded 22 measurement occasions as potentially problematic in that participants answered all 10 items on depressive symptoms with the same rating when there were reverse-coded items. As a result, 9 participants had no data to be analyzed across the six waves. Hence, the final sample used for testing Hypothesis 1b consisted of N = 774 adolescents (M age_Wave1 = 12.88, SD = 0.67, 53% female; adolescents reported on their biological sex at Wave 1) with at least one complete wave of data. Most adolescents (98%) were born in the Netherlands. Among all adolescents, 39% of them had Dutch pre-vocational education, and 61% had Dutch higher general or pre-university education (van den Broek et al., Reference van den Broek, Maran, Beckers, Burk, Verhagen, Vink and Larsen2024).
ESM data (testing Hypothesis 1a, hourly timescale)
Dyads of adolescents and parents who participated in Wave 5 were invited to enroll in the ESM study, resulting in 89 adolescent–parent dyads. The 7-day ESM study took place in June and July 2021, during a transitional period as COVID-19 restrictions were eased. Right before, between April and June 2021, adolescents had partially returned to in-person schooling and outdoor sports, marking a shift from the strict early-2021 lockdown with school closures and curfews (van den Boom et al., Reference van den Boom, Marra, van der Vliet, Elberse, van Dijken, van Dijk, Euser, Derks, Leurs, Albers, Sanderman and de Bruin2023). All participants used the SEMA-app (Version 3, Koval et al., Reference Koval, Hinton, Dozo, Gleeson, Alvarez, Harrison and Sinnott2019) on their mobile phones to receive momentary assessment notifications and complete ESM assessments. The ESM period spanned 7 days, from Monday to Sunday, during which participants completed ESM assessments 10 times a day. A semi-random sampling scheme was used. At 07:30 and every 90 min up to and including 19:30 (i.e., 07:30, 09:00, etc.) a notification was randomly scheduled within 30 min (i.e., 07:30–08:00, 09:00–09:30, etc.). The last notification was sent randomly between 21:00 and 21:30. Each ESM questionnaire expired 30 min after the notification, except the last notification, which was available for 149 min (i.e., until 23:59 at the latest). If participants did not respond to the notifications, they received two reminders 15 and 25 min after the initial notification (and after 75 and 145 min for the last notification).
Participating adolescents could receive €5 to €25, depending on the compliance of both adolescent and parent in the same dyad. Additionally, they entered into a raffle for two holiday vouchers of €250 value. Participants with low compliance received phone calls and WhatsApp messages to resolve technical difficulties that arose. According to our pre-registered exclusion criteria, we excluded 5 adolescents because they consistently gave the same rating in all analyzed ESM items throughout the assessment week. In addition, 4 observations were excluded because the average response time was under 500 ms per item, indicating potential careless responses (McCabe et al., Reference McCabe, Mack and Fleeson2012). As a result, our final sample consisted of N = 84 adolescents (M age = 16.43, SD age = 0.6, 57% female). The weeklong ESM study with 10 notifications per day resulted in 70 possible observations per adolescent. Adolescents completed on average 42 of 70 possible observations (60%, SD = 25%, range = 4% to 97%). This sample was used to test Hypothesis 1a at the hourly level. To test Hypothesis 2, we included adolescents who had completed any of the last two longitudinal assessments and/or the ESM study that happened in between. We included participants with incomplete observations, rather than only those with complete data, so as to retain more information for Bayesian estimation. This resulted in a final sample of 181 adolescents.
Equivalence tests of adolescents’ Wave 1 loneliness and depressive symptoms suggested that the subsamples for testing H1a (N = 84) and H2 (N = 181) were equivalent to the rest of the sample (Supplemental Material 1).
Measures
Trait loneliness and depressive symptoms
Trait loneliness was assessed with the 12-item Louvain Loneliness Scale for Children and Adolescents: Friend scale (LEKA, Marcoen & Goossens, Reference Marcoen and Goossens1990), developed and validated in the Dutch-speaking context. Example items are “I feel isolated from others” and “I feel abandoned by my friends.” Adolescents rated how applicable each item was to them on a 4-point scale from 1 (“Never”) to 4 (“Often”). Higher scores indicate higher perceived discrepancy between one’s desired and actual social connections.
Trait depressive symptoms were assessed with the Dutch translation of the Center for Epidemiological Studies Depression scale, 10-item short form (CES-D, Andresen et al., Reference Andresen, Malmgren, Carter and Patrick1994). Example items are “I felt depressed” and “I was happy” (reverse scoring). Adolescents rated how well items described them in the past week on a 4-point scale from 1 (“Seldom or never [Fewer than 1 day]”) to 4 (“Usually or always [5–7 days]”). Three positively-framed items were reverse-coded. Higher scores indicate higher depressive symptomatology.
Revelle’s omega total of loneliness (0.92, 0.95, 0.92, 0.91, and 0.94) and depressive symptoms (0.81, 0.88, 0.89, 0.88, and 0.91) in the five measurements indicated the two scales had good reliability. To determine if the factor structures of the two scales were supported between and within adolescents, we ran multilevel confirmatory factor analysis on all LEKA and CES-D items across all measurements. Satisfactory fit indices showed that the factor structures held between adolescents and within adolescents across waves of measurement. Furthermore, longitudinal invariance tests suggested that the same factor loadings and intercepts could be assumed across waves (Supplemental Material 2). This indicated that it was appropriate to compare the traits across time. Given these results, we proceeded, as pre-registered, with the mean scores obtained from each scale. We transformed the range from “1 to 4” to “0 to 3” before further analysis for both trait scales.
State loneliness and depressed feelings
State loneliness and depressed feelings were assessed with two ESM items that were “Right now I feel [lonely/depressed]” (used in Erbas et al., Reference Erbas, Ceulemans, Kalokerinos, Houben, Koval, Pe and Kuppens2018) alongside seven other positive and negative affect items (content, relaxed, joyful, energetic, irritated, worried, and insecure; in each ESM prompt, adolescents alternated between reporting on positive and negative affect). Adolescents responded on an 11-point scale ranging from 0 to 10 (“not at all” to “a lot”). We assessed split-half reliability for each ESM item. To do so, we divided the time series by odd- and even-numbered calendar days, computing correlations between the two halves, and applying the Spearman-Brown prophecy formula to estimate time series reliability (Wendt et al., Reference Wendt, Wright, Pilkonis, Woods, Denissen, Kühnel and Zimmermann2020). Reliability was high for both mean scores (lonely: 0.93, depressed: 0.90) and standard deviations (lonely: 0.76, depressed: 0.79).
Analysis
We followed our preregistered analysis plan (https://osf.io/ru48z/, Lo et al., Reference Lo, Pouwels, Eltanamly, Maciejewski, Vink and Verhagen2025) to examine the bidirectional influences between loneliness and depressive symptoms in hourly and half-yearly timescales (Hypothesis 1) and the across-timescale influences from the hourly feedback loops between loneliness and depressed feelings on the half-yearly change in trait loneliness and depressive symptoms (Hypothesis 2). We prepared our data with R version 4.3.2 (R Core Team, 2023) and conducted our analyses (Model 1a, 1b, and 2) in Mplus version 8.11 (Muthén & Muthén, Reference Muthén and Muthén2017). Convergence of all models was assessed using the potential scale reduction (PSR) criterion, with values below 1.1 indicating acceptable convergence after a minimum of 5,000 iterations (e.g., Speyer et al., Reference Speyer, Murray and Kievit2024). To check for stability of model convergence, we re-estimated the models by doubling the number of iterations needed for first-time convergence, inspected the smoothness of density plots of estimates, and examined the Bayesian posterior parameter trace plots of estimates.
We conducted a priori power analyses (https://osf.io/ru48z/, Lo et al., Reference Lo, Pouwels, Eltanamly, Maciejewski, Vink and Verhagen2025). For H1a and H1b, which tested within-person processes, we estimated power using a random-intercept cross-lagged panel model (RI-CLPM) built from a reference dataset of Dutch middle adolescents. We chose RI-CLPM for three practical reasons. First, although RI-CLPM has a simpler structure than the dynamic structural equation models (DSEM) used in our primary analyses, in particular by excluding random slopes, it captures comparable within-person cross-lagged dynamics and has similarly been used in prior work for a priori power analysis when actual analyses involve more complex models (Bülow et al., Reference Bülow, Boele, Lougheed, Denissen, van Roekel and Keijsers2025; McNeish & Hamaker, Reference McNeish and Hamaker2020). Second, using RI-CLPM allowed us to place our expected effects in the context of prior longitudinal studies on loneliness-depressive symptoms mutual influences that have largely relied on (RI-)CLPM. Third, recent work provides benchmarks for interpreting within-person RI-CLPM effects as small, medium or typical, and large (Orth et al., Reference Orth, Meier, Bühler, Dapp, Krauss, Messerli and Robins2022), but similar benchmarks are not yet available for DSEM. Based on these power analyses, we had over 80% power to detect small-to-medium standardized effect sizes (0.05) for H1a (hourly), and over 80% power to detect medium-to-large effect sizes (0.08) for H1b (half-yearly). For H2, which tested between-person hypotheses, we conducted a power analysis with G*power with reference to the effect sizes in an across-timescale study (Elmer et al., Reference Elmer, Geschwind, Peeters, Wichers and Bringmann2020) and a guideline in interpreting individual difference effect sizes (Gignac & Szodorai, Reference Gignac and Szodorai2016). This analysis indicated over 80% power to detect a typical individual differences standardized effect size (0.20).
A. Hypothesis 1: Hourly balancing feedback loop (H1a) and half-yearly reinforcing feedback loop (H1b)
To test Hypothesis 1a and 1b, we employed dynamic structural equation modeling (DSEM). DSEM was selected because it (a) accommodates multilevel time series data analysis with bivariate outcomes, (b) handles unequal measurement intervals, (c) uses all available observations without relying on listwise deletion, (d) uses latent centering of variables so that within-person changes can be more accurately modeled accounting for the individual differences in the stable components of the variables, and (e) provides standardized person-specific estimates for analyzing H2 (McNeish & Hamaker, Reference McNeish and Hamaker2020). Before we tested our main models, we checked whether there were any time trends in the data we should control for, by estimating a linear growth model for loneliness and depression. We had pre-registered that we would use residual DSEM (RDSEM) if time trends explained over 5% of within-adolescent variances in loneliness and depressive symptoms. RDSEM allows for modeling time trends in bivariate outcomes and models temporal effects between loneliness and depressive symptoms on their within-level residuals instead of the variables themselves, which leads to a more accurate estimation of variance terms.
Two main models were estimated. Model 1a tested the hourly balancing feedback loop (H1a) using the ESM data. Model 1b tested the half-yearly reinforcing feedback loop (H1b) using the panel data. Model 1a and 1b shared the same model structure, allowing for better comparison of parameter estimates between models in different timescales (Bülow et al., Reference Bülow, Boele, Lougheed, Denissen, van Roekel and Keijsers2025). They differed only in the temporal resolution of the input data and in the inclusion of an additional time variable in Model 1b that marked the time passed since the onset of the COVID-19 pandemic. Supplemental Material 3 contains full model specifications.
Loneliness and depressive symptoms were latent person-centered, so that adolescents had person-specific estimates of their time-invariant latent person means. At the within-person level, the latent person-centered loneliness and depressive symptoms were regressed on time variables to account for the time trends (βs; see Supplemental Material 3). The resultant within-person residuals of loneliness and depressive symptoms followed a bivariate autoregressive cross-lagged specification so that the residuals of loneliness and depressive symptoms from a previous time point (t-1) influence themselves (autoregressive effects; φLL and φDD) and each other (cross-lagged effects; φLD and φDL, Figure 1) at the current time point (t). We set the time interval to 1.5 hr (ESM) and six months (panel data) using the TINTERVAL statement in Mplus to rescale time into 1.5-hr/half-yearly increments, so that we could consistently interpret the autoregressive and cross-lagged effect estimates as the carryover and spillover from 1.5 hr/half year prior to the assessment.
At the between-person level, we specified between-person variance around adolescents’ average levels of loneliness and depressive symptoms across assessments (i.e., random intercepts), the average within-person effects of autoregressive and cross-lagged effects of residuals of loneliness and depressive symptoms (i.e., random slopes that allowed for heterogeneity in hourly and half-yearly cross-lagged effects), the average within-person effects of time trends, and the within-person residual variances. These random effects were loaded on a higher-order factor. This pre-registered approach was needed to achieve model convergence, as it could account for links between random effects akin to an unrestricted covariance structure between all random effects but with an advantage of simpler model specifications (McNeish & Bauer, Reference McNeish and Bauer2022). Full model specifications are provided in Supplemental Material 3.
In testing H1a (hourly) and H1b (half-yearly), we were primarily interested in the within-person fixed cross-lagged effects: from the lag-1 residual of loneliness to that of depressive symptoms (φLD, Figure 1) and from the lag-1 residual of depressive symptoms to that of loneliness (φDL, Figure 1). These estimates tested the direction and strength of the bidirectional associations within individuals at both hourly and half-yearly scales above and beyond the time trends. This way, stronger estimates reflected greater subsequent deviations from adolescents’ personal trends. We considered H1a supported if the 95% credibility interval of the hourly φLD estimate was positive, and that of the hourly φDL estimate was negative. We considered H1b supported if the 95% credibility interval of the half-yearly φLD and φDL estimates were positive.
From the output of Model 1a, we extracted standardized person-specific estimates of the cross-lagged effects between each adolescent’s loneliness and depressed feelings (e.g., previous loneliness contributing to subsequent depressed feelings). These estimates were used to test H2.
B. Hypothesis 2: Adolescents with stronger hourly balancing feedback loop between loneliness and depressive symptoms are protected from their half-yearly increases
To test Hypothesis 2, we specified Model 2, a Bayesian structural equation model (BSEM) using a latent change score (LCS) framework (Kievit et al., Reference Kievit, Brandmaier, Ziegler, van Harmelen, de Mooij, Moutoussis, Goodyer, Bullmore, Jones, Fonagy, Lindenberger and Dolan2018). Specifically, Model 2 examined whether hourly person-specific cross-lagged estimates from Model 1a predicted half-yearly changes in trait loneliness and depressive symptoms from Wave 5 to Wave 6, because the ESM study occurred between these waves (Figure 1). Using BSEMFootnote 4 has advantages in not assuming specific distributions of parameters and residuals, making it particularly appropriate given the small sample sizes at the between-person level. Using the LCS modeling framework has advantages in accounting for individual differences in half-yearly changes and is less susceptible to measurement errors in observed variables (Kievit et al., Reference Kievit, Brandmaier, Ziegler, van Harmelen, de Mooij, Moutoussis, Goodyer, Bullmore, Jones, Fonagy, Lindenberger and Dolan2018).
The outcome variables of Model 2 were the LCS in loneliness and depressive symptoms, ΔL and ΔD. The key predictor variables central to testing Hypothesis 2 were the person-specific estimates of hourly cross-lagged effects between loneliness and depressed feelings (φLD and φDL; Figure 1). Following the typical LCS framework, we included Wave 5 levels of loneliness and depressive symptoms, respectively, to predict their half-yearly latent changes. Residual variances in the change scores were estimated freely and were allowed to covary. The covariance between loneliness and depressive symptoms at Wave 5 was also estimated. Full model specifications are provided in Supplemental Material 3.
To test Hypothesis 2, we were primarily interested in the estimates of the paths from the person-specific hourly cross-lagged effects, φLD and φDL (Figure 1) to the half-yearly LCSs in loneliness and depressive symptoms.Footnote 5 H2 stated that adolescents with strong hourly balancing feedback loops are likely to have half-yearly decreases in trait loneliness and depressive symptoms (i.e., protected from half-yearly increases). A balancing feedback loop consisted of positive φLD and negative φDL. Therefore, we considered H2 supported if the 95% credibility intervals of the across-timescale regression estimates from φLD to the LCSs were negative (positive φLD multiplied with negative across-timescale effect gave decreases in trait loneliness or depressive symptoms), and the intervals of the estimates from φDL to the LCSs were positive (negative φDL multiplied with positive across-timescale effect gave decreases in trait loneliness or depressive symptoms).
C. Exploratory analyses
To explore sex differences, we pre-registered conducting multi-group analyses based on the pre-registered models (Model1a, 1b, and 2). Because the multi-group analysis did not converge, we instead included sex (boys coded as 0 and girls as 1) as a time-invariant predictor in the models. In Model 1a and 1b, we regressed the person-specific temporal relations between loneliness and depressive symptoms on sex. In Model 2, we specified sex as a moderator in the paths of how hourly relations between loneliness and depressive symptoms predict their half-yearly changes. This was done by regressing the LCSs on (a) sex and (b) two interaction terms between sex and person-specific hourly temporal relations (φLD and φDL). Sex differences were considered significant when the credibility intervals of these effects did not include zero.
Results
Descriptive statistics
Table 1 includes descriptive statistics for state and trait loneliness and depressive symptoms. At both hourly and half-yearly timescales, adolescents reported relatively low average levels of loneliness and depressive symptoms, yet their variations across time (within-adolescent SD) and between adolescents (between-adolescent SD) were substantial relative to these means. Within the hourly timescale, positive skewness and kurtosis indicated that most observations clustered near the person mean, but when values exceeded the mean, they were likely to reach high levels. In contrast, half-yearly reports of loneliness and depressive symptoms were approximately symmetrical (near-zero skewness) with few extreme values (negative kurtosis). Both within and between adolescents, loneliness and depressed feelings were positively correlated at the hourly (r within = .36, 95% CI [0.33, .39]; r between = .75 [ .64, .83]) and half-yearly (r within = .36, [.33, .39]; r between = .56 [ .51, .60]) timescales. Across-timescale correlations were estimated between traits (averaged across waves from 2017 to 2021) with states (averaged across one week of hourly assessments in mid 2021). These correlations were tested in the smaller ESM subsample (n = 84). There were positive between-adolescent correlations between trait depressive symptoms and state depressed feelings (r between = .45 [ .26, .61]) or state loneliness (r between = .44 [ .25, .60]). However, there were no significant correlations between trait loneliness and state loneliness (r between = .13 [−.09, .33]) or depressed feelings (r between = .21 [−.01, .40]). The intraclass correlation coefficients for trait and state loneliness and depressive symptoms ranged from .40 to .47 (Table 1), indicating that 53%–60% of variance was explained by differences within adolescents across half-year or momentary intervals or measurement error. These within-adolescent variances justified further within-person analysis.
Descriptive statistics of key variables

Note. T: number of observations; First M: mean across all adolescents at Wave 1 or the first ESM observation; W3, W4, and W5: Wave 3 to 5; Last M: mean across all adolescents at Wave 6 or the last ESM observation; Time Trend EV%: percentage of within-person variance explained by time trends; wSD: within-adolescent SD; bSD: between-adolescent SD; ICC: intraclass correlation coefficient. The COVID-pandemic was in place between Wave 4 to Wave 6.
Model adjustments due to time trends
Loneliness and depressive symptoms significantly changed across time: they increased half-yearly across the longitudinal data collection period and decreased across the one-week ESM data collection period (Table 1; figures in Supplemental Material 3). Additionally, in the half-yearly data, the increase in loneliness accelerated after the onset of COVID-19 (i.e., Wave 4),Footnote 6 with no comparable change in depressive symptoms (Supplemental Material 4). The stationarity assumption did not hold, because time trends explained over 5% of within-adolescent variances in loneliness and depressive symptoms (5%–14%; Supplemental Material 3). Therefore, as pre-registered, we used RDSEM so that cross-lagged relations between loneliness and depressive symptoms (φLD and φDL) can be estimated without being biased by the time trends.
Pre-registered analyses
A. Hypothesis 1: Feedback loops between loneliness and depressive symptoms are balancing at the hourly timescale (H1a) and reinforcing at the half-yearly timescale (H1b)
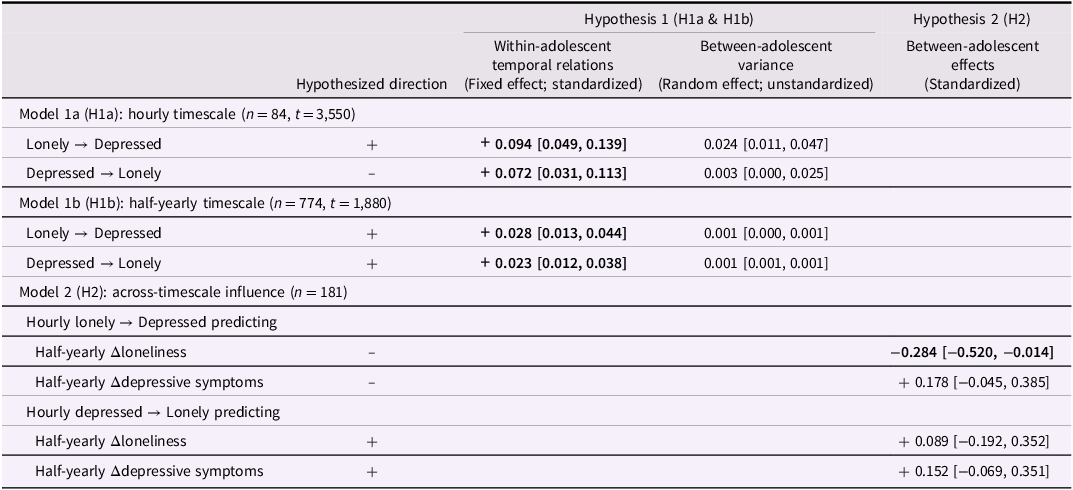
Using RDSEM, we first examined the bidirectional temporal effects between the residuals of loneliness and depressive symptoms in the hourly and half-yearly timescales (Table 2; see Supplemental Material 4 for full model outcomes). Loneliness was positively associated with subsequent increases in depressive symptoms (Hourly φLD = 0.094, 95% CI [0.049, 0.139], Half-yearly φLD = 0.028, [0.013, 0.044]; standardized estimates), and vice versa (Hourly φDL = 0.072 [0.031, 0.113], Half-yearly φDL = 0.023 [0.012, 0.038]), indicating reinforcing feedback loops within both timescales. The results are in contrast with H1a (which expected a balancing feedback loop) but supported H1b. The magnitude of these cross-lagged effects differed across timescales. At the hourly level, the standardized cross-lagged estimates were comparable to the size of the estimated time trends in loneliness (β = –0.15 [–0.24, –0.10]) and depressed feelings (β = –0.14 [–0.30, –0.09]) but were small relative to their autoregressive estimates (φLL = 0.20 [0.14, 0.24], φDD = 0.23 [0.18, 0.28]), i.e., how deviations from time trends of loneliness and depressed feelings predicted themselves at the following measurement. At the half-yearly level, the cross-lagged estimates were small relative to the developmental and COVID-19-specific time trends (βs = –0.45 to 0.67). The cross-lagged estimates were also small relative to the autoregressive estimates of loneliness (φLL = 0.93 [0.91, 0.94]) and depressive symptoms (φDD = 0.92 [0.91, 0.94]). In summary, if adolescents had levels of one variable deviating from their own time trends (e.g., heightened loneliness), there were subsequent same-direction deviations in the other variable (e.g., subsequently heightened depressive symptoms), both at the hourly and half-yearly timescales.
Estimates and credibility intervals in testing the hypothesized feedback loops and across-time-scale influences
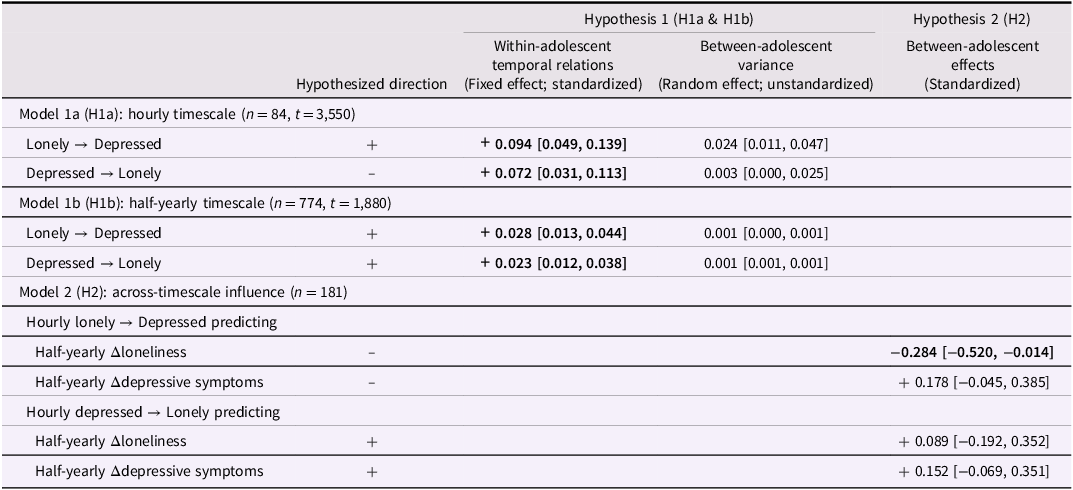
Note. Δ = Change. Standardized estimates where credibility interval did not encompass zero are denoted in bold. See Supplemental Material 4 for full results.
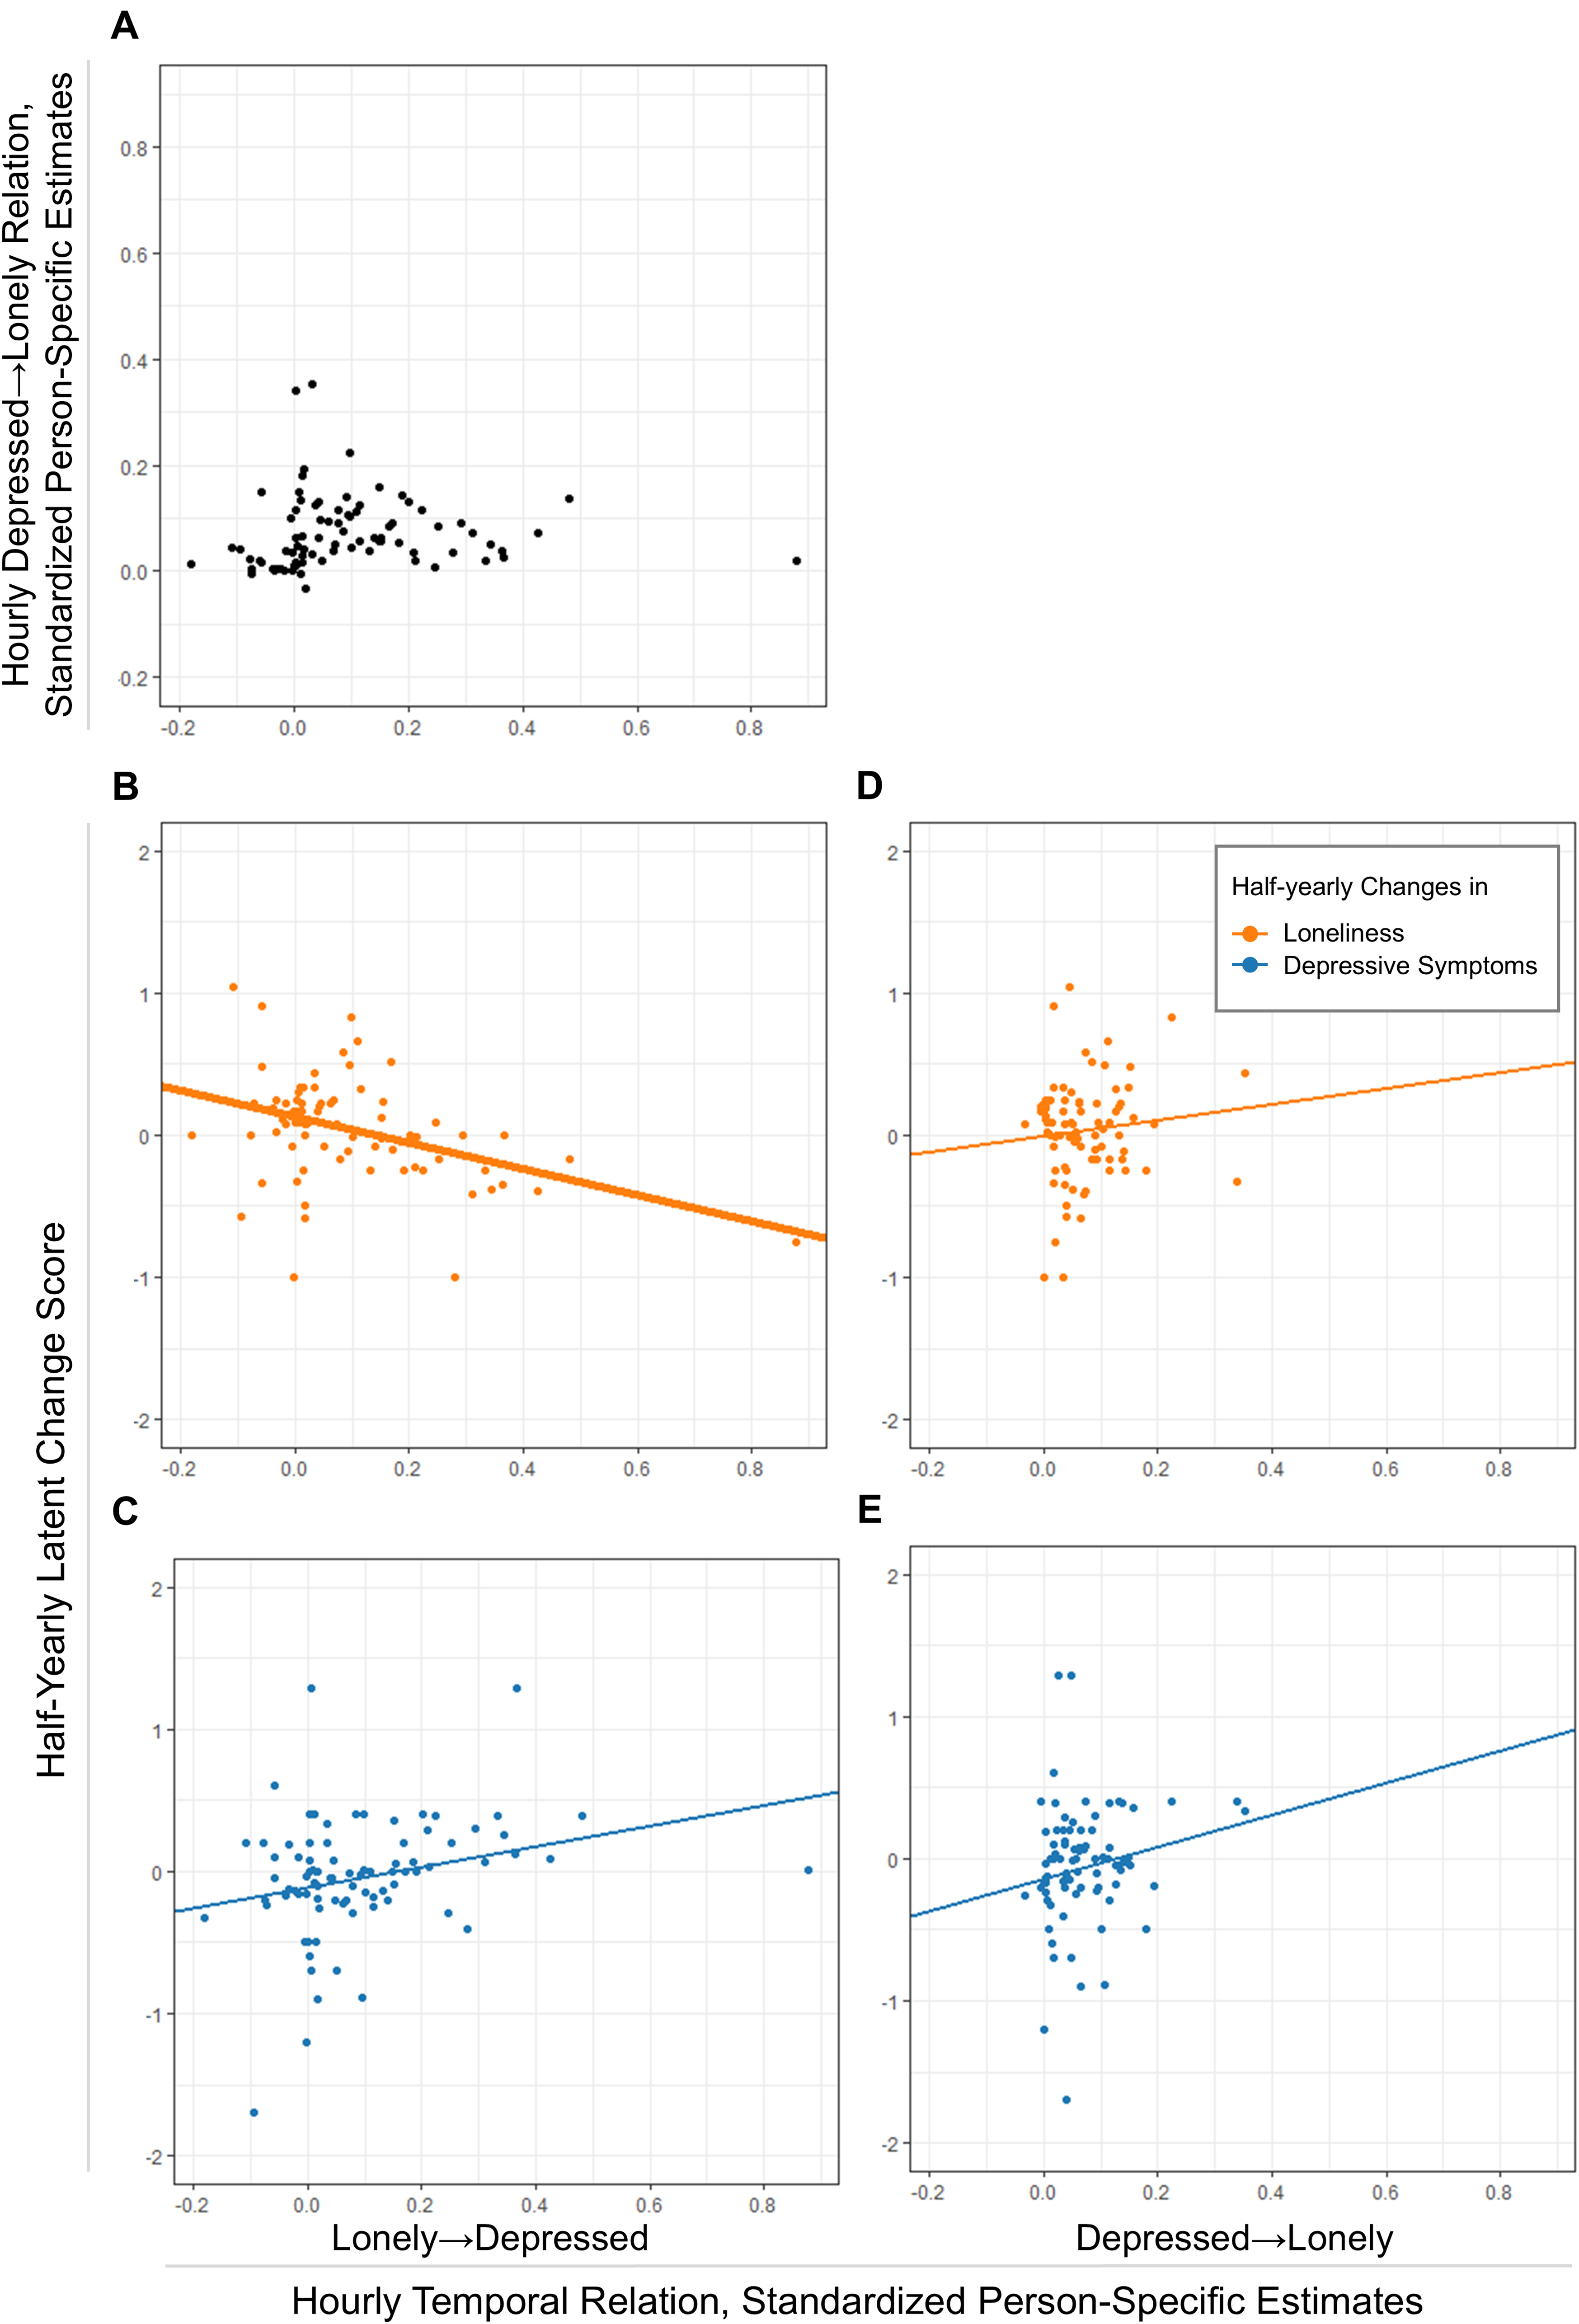
In preparation for estimating Model 2, we extracted person-specific estimates of adolescents’ hourly lonely→depressed and depressed→ lonely temporal relations. These hourly estimates were not significantly correlated (r = .14, [–.10, .54], Figure 2a). This indicated that an adolescent’s hourly lonely→depressed relation was not predictive of their depressed→lonely relation. Consistent with this, very few adolescents showed a combination of positive lonely→depressed effects and negative depressed→lonely effects, as reflected by the near absence of points in the lower-left quadrant relative to the origin in Figure 2a.
Person-specific estimates of hourly bidirectional influences between loneliness and depressed feelings: distribution and relations to half-yearly changes in loneliness and depressive symptoms. Note. Thick regression lines indicate statistically non-zero slopes.
B. Hypothesis 2: Hourly balancing feedback loop between lonely and depressed feelings buffers half-yearly increases in trait loneliness and depressive symptoms
Next, using BSEM with LCS, we examined whether the person-specific estimates of the hourly bidirectional temporal effects between lonely and depressed feelings predicted half-yearly changes in loneliness and depressive symptoms. Hypothesis 2 was partially supported (Table 2): the more positive adolescents’ hourly lonely→depressed temporal relation was, the smaller half-yearly increases they had in loneliness (b* = –0.28, 95% CI [-0.52, -0.01]). This indicates the stronger hourly coupling from loneliness to depressed feelings adolescents had, the more likely they had half-yearly decreases in loneliness (downward slope, Figure 2b). However, this temporal relation was not related to changes in trait depressive symptoms (b* = 0.19 [–0.04, 0.39], Figure 2c). Further, the reversed temporal relation (depressed→lonely) was unrelated to half-yearly changes in either trait loneliness (b* = 0.10 [–0.19, 0.36], Figure 2d) or depressive symptoms (b* = 0.16 [–0.06, 0.36], Figure 2e).Footnote 7
Exploratory analyses: Sex differences
Density plots of the person-specific estimates for H1a and H1b (Supplemental Material 4) were smooth and unimodal. This indicates that, while there was heterogeneity in the person-specific estimates that could have been shaped by adolescents’ characteristics, there was no clear evidence of subgroup mixtures such as separate distributions for boys and girls. Even so, we examined potential sex differences by adding sex as a time-invariant predictor to Model 1a and 1b and as a moderator to Model 2. Estimates and credibility intervals of all exploratory results are available in Supplemental Material 4. Within hourly and half-yearly timescales, regression estimates from sex to within-adolescent temporal relations between loneliness and depressive symptoms were non-significant. This indicated that these within-adolescent temporal relations appeared similar across boys and girls. Across timescales, sex did not significantly moderate how hourly dynamics predicted half-yearly changes in loneliness and depressive symptoms. This indicated that all across-timescale effects appeared similar across boys and girls. Overall, there appeared to be no sex differences in all the effects we investigated.
Discussion
Drawing on data from the same pool of Dutch adolescents assessed both hourly and half-yearly, we examined whether the temporal relations between loneliness and depressive symptoms at these two timescales aligned with the mechanisms proposed by the ETL. Within both timescales, we found reinforcing feedback loops: once loneliness or depressive symptoms were heightened, the other tended to increase in turn. Across timescales, we found that the more positive hourly lonely-to-depressed relations adolescents had, the lower their risk of half-yearly increases in loneliness. Although short-term increases in depressed feelings after loneliness may protect adolescents from long-term increases in loneliness, this buffering effect was not observed for the reverse hourly relation (increases in loneliness after feeling depressed), nor did either hourly process predict half-yearly changes in depressive symptoms.
Our findings offer partial support for the ETL in three ways. First, using RDSEM, a more robust statistical approach that separates within-person and between-person findings, we replicated earlier longitudinal studies that identified a reinforcing feedback loop between loneliness and depressive symptoms within adolescents over longer time frames (e.g., Vanhalst et al., Reference Vanhalst, Klimstra, Luyckx, Scholte, Engels and Goossens2012). These effects emerged even after accounting for adolescents’ developmental trends, their adjustment during COVID-19, and how adolescents’ loneliness and depressive symptoms temporally predicted themselves (i.e., autoregressive effects), although the reciprocal effects between loneliness and depressive symptoms were small relative to their developmental trends, COVID-19 specific trends, and autoregressive effects. This provides further support for the view that adolescents’ social and mental health may co-deteriorate in a mutually reinforcing manner (Lau et al., Reference Lau, Priebe and Morgan2025). Second, extending previous work on momentary temporal relations (Kuczynski et al., Reference Kuczynski, Piccirillo, Dora, Kuehn, Halvorson, King and Kanter2024; Speyer et al., Reference Speyer, Murray and Kievit2024), our hourly results showed that heightened loneliness predicts subsequent increases in depressed feelings, which is consistent with the ETL. However, we also observed the reverse, that higher depressed feelings predict subsequent increases in loneliness, which contrasts with the ETL’s expectation that depressed feelings facilitate decreases in loneliness. Third, we found that adolescents with a stronger positive hourly lonely→depressed relation showed smaller half-yearly increases in loneliness. Other across-timescale links we tested, including whether these hourly dynamics predicted half-yearly changes in depressive symptoms, were not supported. In examining interdependent timescales in developmental psychopathology (Granic, Reference Granic2005; Jordan, Reference Jordan2013), our findings suggest that some short-term processes may play a more influential role than others in shaping long-term changes. In this case, the short-term coupling from lonely to depressed feelings, which even though it may be emotionally burdensome to adolescents, can protect adolescents from long-term loneliness. Given that the across-timescale effect sizes were relatively small and some effects were in opposite directions than expected, future research is warranted to replicate our findings across various timescales.
Clarifying the evolutionary theory of loneliness
The ETL suggests that transient loneliness can be adaptive via a short-term balancing feedback loop: transient loneliness temporarily increases depressed feelings for self-preservation (Cacioppo & Cacioppo, Reference Cacioppo and Cacioppo2018), and they collectively facilitate reaffiliation (Qualter et al., Reference Qualter, Vanhalst, Harris, Van Roekel, Lodder, Bangee, Maes and Verhagen2015), which brings loneliness back to baseline. In this loop, the lonely→depressed segment reflects adolescents’ withdrawal from challenging social contexts (self-preservation). Our findings supported this segment of the ETL. At the hourly level, heightened loneliness predicted subsequent increases in depressed feelings. As a result, across timescales, this hourly lonely→depressed relation buffered half-yearly increases in trait loneliness. According to the ETL, the depressed feelings communicate a need for support, increasing the likelihood that supportive peers or caregivers offer their care. Through this process, adolescents may reaffiliate and meet their social needs, returning their loneliness to baseline and reducing the risk of having long-term loneliness.
In contrast, our findings did not support the ETL-expected loneliness-reducing effect in the hourly depressed→lonely relation. Instead, heightened depressed feelings predicted increases in loneliness an hour later. Moreover, this hourly dynamic did not predict half-yearly changes in loneliness or depressive symptoms. These unexpected results may be better understood in light of the specific timescales examined, competing emotional processes, and the broader social context in which the study was conducted. The first explanation for the absence of a negative hourly depressed→lonely effect might lie in the choice of measurement timescale. In the ETL, different paces in the two segments of the lonely→depressed→lonely balancing feedback loop could be inferred. The effect from loneliness to depressive symptoms was theorized to be part of the neural-to-behavioral coordinated set of responses that are quick in nature (Cacioppo & Cacioppo, Reference Cacioppo and Cacioppo2018). In contrast, the proposed loneliness-reducing effect of depressed feelings is thought to operate socially via reaffiliation, which may unfold more slowly. Supporting this, recent multi-timescale studies suggest that it can take weeks before emotions shape interactions in relationships. For example, adolescents’ negative emotions predicted increases in parent–adolescent conflict at a weekly timescale, but not at daily or biweekly intervals (Bülow et al., Reference Bülow, Boele, Lougheed, Denissen, van Roekel and Keijsers2025). Similarly, depressive symptoms predicted increases in parent–adolescent conflict in biweekly intervals (but not at monthly, bimonthly, or three-monthly timescales; Bülow et al., Reference Bülow, Boele, Lougheed, Denissen, van Roekel and Keijsers2025) and declines in parental support at biweekly and three-month intervals (but not at daily, annual, or biannual timescales; Boele et al., Reference Boele, Nelemans, Denissen, Prinzie, Bülow and Keijsers2023). While little is known about whether peer support decreases in similar ways or increases as the ETL expects, changes in social relationships after feeling lonely and depressed might need more time. Instead of the hourly intervals in the current study, the loneliness-decreasing effect might be better studied in a daily or weekly interval.
This theory-measurement mismatch may also explain our null findings across timescales regarding the depressed→lonely effects: although the lonely→depressed hourly relation predicted long-term changes in loneliness, the depressed→lonely hourly relation did not. If the latter reaffiliation process unfolds over days or weeks, but not over the hourly intervals measured in the current study, such hourly dynamics would not hold predictive value on the expected long-term protective effect against loneliness and depressive symptoms. To refine the empirical testing of the ETL, future research should examine the short-term depressed→lonely relations across multiple timescales (e.g., hourly, daily, weekly) to identify the window in which loneliness-reducing effect most clearly manifests. Determining this time window not only addresses broader calls to refine developmental psychopathology theories by specifying their timescales (Hamaker, Reference Hamaker2023), but is also crucial for effectively testing whether the short-term depressed→lonely relation contributes to long-term changes in adolescents’ social and mental health.
A second explanation for the increase in loneliness after adolescents feel depressed is that this association may have captured competing processes not accounted for by the ETL. An example is spillover between negative emotions, which refers to a phenomenon where one negative emotion (e.g., depressed or angry) activates another (e.g., lonely or fear) over hours (Nencheva et al., Reference Nencheva, Nook, Thornton, Lew-Williams and Tamir2024; Thornton & Tamir, Reference Thornton and Tamir2017). Future tests of the ETL should aim to disentangle the theorized reaffiliation process from other competing processes. One promising avenue is to measure reaffiliation behaviors, such as active, engaging social interactions, alongside cognitive precursors such as adaptive attribution styles (Qualter et al., Reference Qualter, Vanhalst, Harris, Van Roekel, Lodder, Bangee, Maes and Verhagen2015) and features of social environments that facilitate reconnection (Cacioppo & Cacioppo, Reference Cacioppo and Cacioppo2018). With these measures, researchers can examine the depressed→lonely association specifically on occasions when reaffiliation is enabled by cognitive or environmental conditions, and separately when reaffiliation has occurred through observable social behavior.
A third explanation for the absence of negative depressed→lonely relations relates to the COVID-19 context in which the study took place. Because the ETL highlights reaffiliation as a key mechanism in reducing loneliness, it is important to consider the broader social context in which loneliness unfolds. Our findings extend the work by Speyer et al. (Reference Speyer, Murray and Kievit2024) about university students’ loneliness and depressed feelings during a period of strict COVID-19 restrictions (e.g., closure of schools and hospitality). Although our ESM study was conducted in a COVID-19 period where in-person interactions were possible, some social restrictions remained (e.g., partial school resumption). During the COVID-19 pandemic, adolescents partly compensated for their lack of social interaction by increased social media use, but they found in-person interactions more satisfying and meaningful than online interactions (Parent et al., Reference Parent, Dadgar, Xiao, Hesse and Shapka2021; Van de Casteele et al., Reference Van de Casteele, Flamant, Ponnet, Soenens, Van Hees and Vansteenkiste2024). Therefore, this broader COVID-19 context might explain why the observed depressed→lonely relation was not negative as hypothesized in H1a: compared to non-pandemic times, adolescents may have had fewer offline opportunities to reaffiliate with supportive peers, limiting the ETL-expected loneliness-reducing effect of depressed feelings. This may also explain why there was an increasing trend in loneliness (but not depressive symptoms) across the final three half-yearly measurements of our study, a pattern also observed in other research on middle to late adolescents (Bamps et al., Reference Bamps, Achterhof, Lafit, Teixeira, Akcaoglu, Hagemann, Hermans, Hiekkaranta, Janssens, Lecei, Myin-Germeys and Kirtley2024; van den Boom et al., Reference van den Boom, Marra, van der Vliet, Elberse, van Dijken, van Dijk, Euser, Derks, Leurs, Albers, Sanderman and de Bruin2023). Now that the acute phase of COVID-19 pandemic is over, new studies can replicate our findings in how loneliness and depressive symptoms influence each other in typical, non-pandemic times.
The potential role of sex
Exploring sex differences in how loneliness and depressive symptoms influence each other can inform us whether adolescents may benefit from sex-specific support in dealing with loneliness and depressive symptoms (Dunn & Sicouri, Reference Dunn and Sicouri2022). We found no evidence for sex differences in our within- and across-timescales findings. This aligns closely with recent work by Kuczynski et al. (Reference Kuczynski, Piccirillo, Dora, Kuehn, Halvorson, King and Kanter2024) on short-term relations and meta-analytic evidence on long-term relations (from traditional cross-lagged panel model studies, Chen et al., Reference Chen, Song, Lee and Zhang2023; Dunn & Sicouri, Reference Dunn and Sicouri2022), both of which reported no support for sex differences in mutual influences between loneliness and depressive symptoms. Together, these results extend the ETL perspective by suggesting that not only the reaffiliative motive triggered by transient loneliness, but also the self-preservation responses, may operate similarly across the two sexes (Qualter et al., Reference Qualter, Vanhalst, Harris, Van Roekel, Lodder, Bangee, Maes and Verhagen2015).
Limitations
Our study has several limitations. First, our dataset did not have optimal reaffiliation-related variables for us to include in the model. Even if there were, our sample size was insufficient to support more complex modeling. As a result, we were unable to directly test the reaffiliation-related mechanisms of the ETL in the short-term lonely–depressed–lonely balancing feedback loop. Second, our current RDSEM model specifications only included two time points in each unit of analysis (Figure 1). Therefore, our results could not inform whether the two segments of the balancing feedback loop were sequentially chained (i.e., lonely→depressed→lonely) as the ETL theorized. Ideally, testing the balancing feedback loop would require a within-person mediation model that traces effects over multiple lags (e.g., lag-2 loneliness to lag-0 loneliness via lag-1 depressed feelings). This design likely demands larger samples and more intensive data due to the multiplicative nature of mediation estimates (see Fritz & MacKinnon, Reference Fritz and MacKinnon2007 for a discussion on between-person mediation analysis, which in principle also applies with within-person mediation). Third, due to drop-outs during the COVID-19 pandemic, different subsamples were used to test our hypotheses. This has led to potentially underpowered tests, particularly for the testing of across-timescale effects and sex differences. To address these three limitations, future studies with larger samples, more observations, and richer data that measured reaffiliation should attempt to replicate and expand upon our findings.
Finally, measurement approaches across the two timescales were different. While the longitudinal study employed validated multi-item scales that were retrospective in nature, the ESM study relied on single-item measures of feelings at the assessed moments. This introduces some ambiguity as to whether differences in temporal relations across timescales are due to time resolution or measurement method. To tackle this, future studies may consider a combination of multiple approaches to assess loneliness and depressive symptoms (e.g., taking the mean values of these variables within an ESM period, van Winkel et al., Reference van Winkel, Wichers, Collip, Jacobs, Derom, Thiery, Myin-Germeys and Peeters2017) and multiverse analyses (i.e., comparing results of the same research questions across alternative data processing procedures, Steegen et al., Reference Steegen, Tuerlinckx, Gelman and Vanpaemel2016). These strategies would help disentangle the impact of measurement features on concurrent validity, supporting more meaningful comparison of estimates derived from different timescales.
Conclusion
This study examined bidirectional influences between adolescents’ loneliness and depressive symptoms within and across hourly and half-yearly timescales. Within both timescales, loneliness and depressive symptoms mutually reinforced each other over time. The half-yearly results align with the longer-term reinforcing feedback loop outlined in the ETL. The hourly findings, however, were only partially aligned with the ETL and the hypothesized short-term balancing feedback loop. Instead of the hourly intervals we examined, the loneliness-decreasing process of reaffiliation described by the ETL may unfold over longer intervals, such as days or weeks. Across timescales, hourly dynamics between loneliness and depressed feelings were not related to half-yearly changes in depressive symptoms. In contrast, adolescents were protected from half-yearly increases in loneliness if they showed stronger hourly increases in depressed feelings following heightened loneliness, although the reverse (hourly changes in loneliness following heightened depressed feelings) did not shape half-yearly changes in loneliness. Taken together, findings show that feeling depressed after transient loneliness, even though unpleasant, could be part of a normal process that supports adolescents in achieving long-term social health.
Supplementary material
The supplementary material for this article can be found at https://doi.org/10.1017/S0954579426101552.
Data availability statement
The materials and code necessary to reproduce the analyses presented here are publicly accessible. The data necessary to reproduce the analyses are available for request from a university data repository that operates under the FAIR principles. Data, code, materials, and the preregistration for this research are available at the following URL: https://osf.io/rjaq4/. Please look under “Files Preview – Github” in this page to access the code.
Funding statement
This work was supported by ZonMW (NB, JV, and MV; grant numbers 10430032010009 and 10430372310013).
Open access funding provided by Radboud University Nijmegen.
Competing interests
The authors declare no conflicts of interest.
Pre-registration statement
Analyses were pre-registered at https://osf.io/ru48z/, date-stamped on Feb 14, 2025. Supplemental Materials 3.3 (Specifications of Model 2) documented one small deviation from the pre-registration.
GenAI use disclosure statement
ChatGPT (version 5), an artificial intelligence tool, has been used for grammatical checks of the manuscript.




 Open access

