

Introduction
Jökulhlaup mechanisms
A jökulhlaup is an outburst flood caused by the sudden drainage of a glacier-dammed lake. During such an event, the discharge from a glacier can increase by more than one order of magnitude within a short time (e.g. Reference BjörnssonBjörnsson, 2002). Because of their far-reaching impact and their erratic nature, jökulhlaups can pose a significant hazard and cause substantial loss of human life and damage to agricultural land and infrastructure. Reviews of the geographic distribution and drainage characteristics of ice-dammed lakes are provided, for example, by Reference LiestølLiestøl (1955), Reference Rothlisberger and KasserRothlisberger (1981), Reference Walder and CostaWalder and Costa (1996), Reference Tweed and RussellTweed and Russell (1999) and Reference BjörnssonBjörnsson (2002).
Drainage from ice-dammed lakes occurs when the lake level is high enough to overcome a potential barrier at the glacier bed, thus enabling discharge underneath the glacier (e.g. Reference BjörnssonBjörnsson, 1974; Reference NyeNye, 1976; Reference FowlerFowler, 1999). There are different mechanisms of flood initiation: some lakes start to drain when the water level reaches the flotation pressure of the ice dam, whereas others release their water at a lower level (e.g. Reference BjörnssonBjörnsson, 1992; Reference Walder and CostaWalder and Costa, 1996; Reference JóhannessonJόhannesson, 2002). A characteristic of the latter is the progressive melt enlargement of the ice-walled drainage channel due to dissipation of energy from turbulent floodwater (e.g. Reference RothlisbergerRothlisberger, 1972; Reference NyeNye, 1976). Usually, the flood terminates abruptly as the lake is emptied or the drainage channel collapses. Overtopping of the ice dam (Reference Walder and CostaWalder and Costa, 1996; Reference Raymond and NolanRaymond and Nolan, 2000; Reference Mayer and SchulerMayer and Schuler, 2005) or excavation of a breach between the ice and the adjacent rock wall (Reference Walder and CostaWalder and Costa, 1996) has also been reported.
Former jökulhlaups in Norway
There are at least 19 glacier-dammed lakes in Norway. The most dangerous jökulhlaups in Norway were from lake Demmevatn at Hardangerjøkulen in southern Norway. Written sources describe late-summer jökulhlaups from this lake since the 18th century. After a catastrophic jökulhlaup in 1893, a rock tunnel was constructed to drain the lake artificially. However, a further decrease in glacier volume inflicted another two serious floods in 1937 and 1938 (Reference Elvehøy, Engeset, Andreassen, Kohler, Gjessing and BjörnssonElvehøy and others, 2002). Studies of jökulhlaups in relation to hydropower plants have been undertaken (e.g. Reference Huggel, Haeberli, Kääb, Hoelzle, Ayros and PortocarreroHuggel and others, 2003), but tend to be focused on the hazards, rather than benefits. However, some knowledge of the possibility of reoccurrence in this case is useful not only in planning how to make the most efficient use of this additional water for hydropower, but also for risk mitigation.
The jökulhlaup at Blåmannsisen 2001
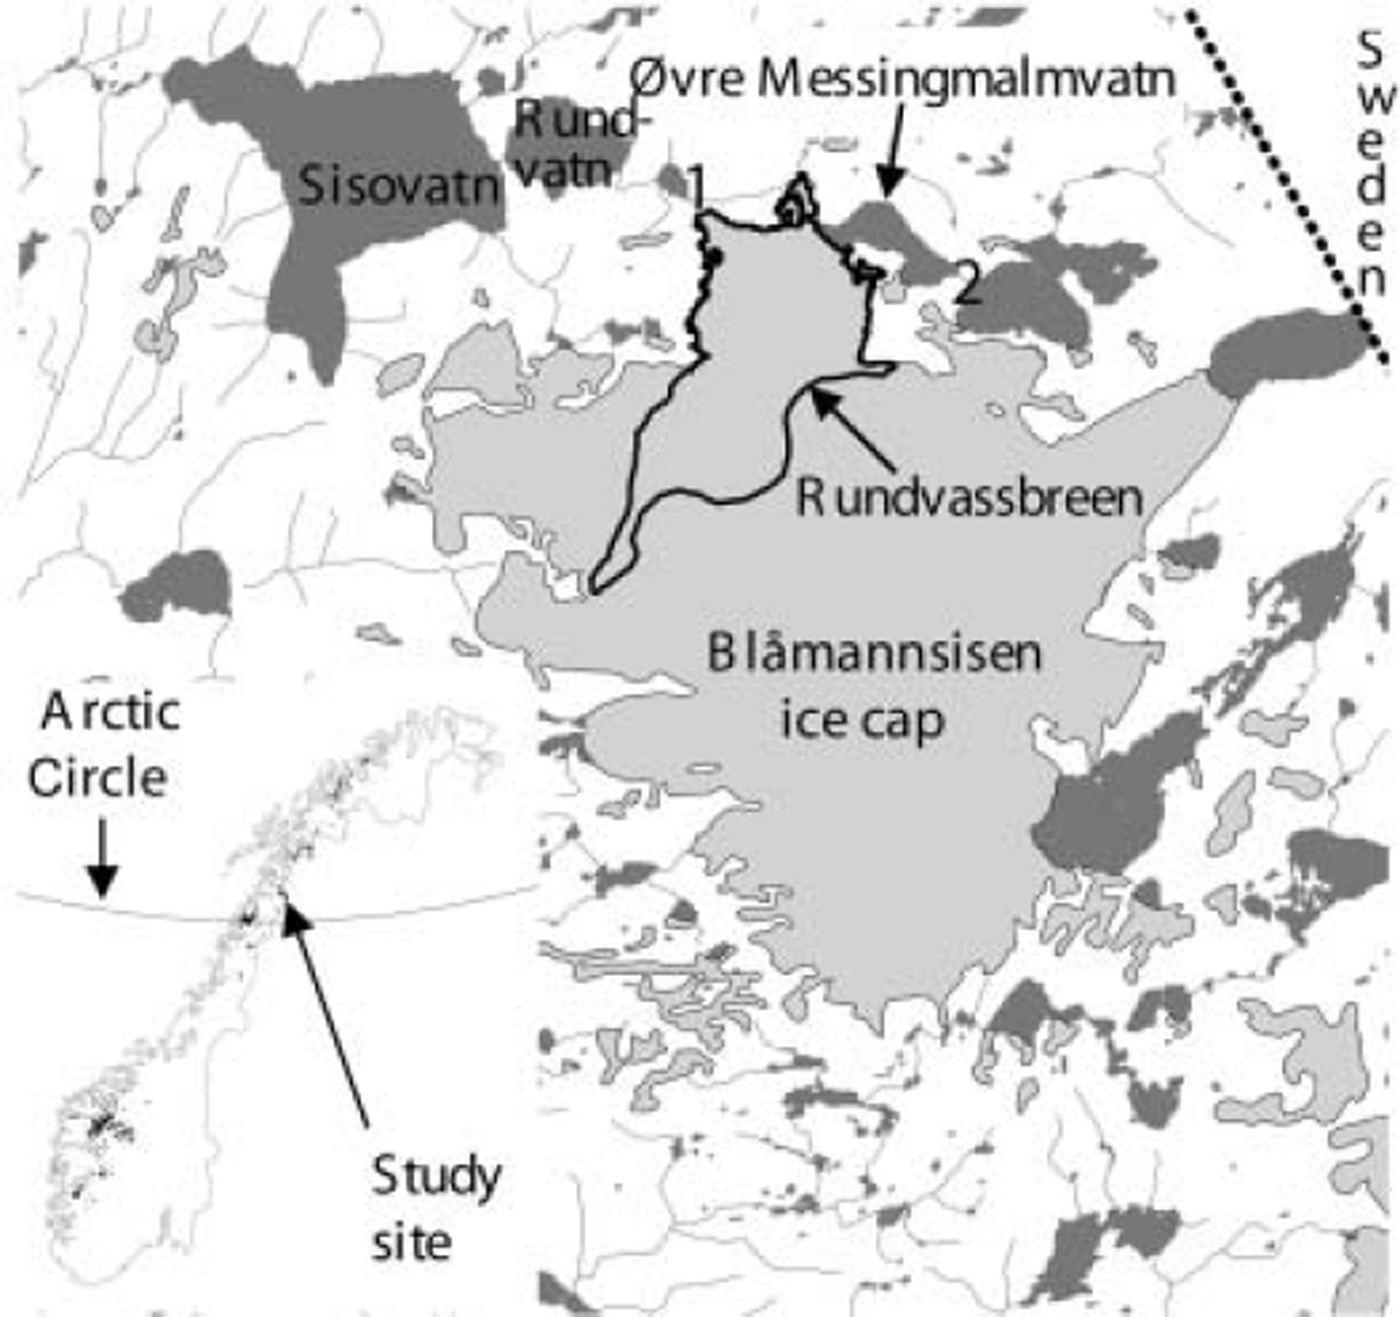
The first known jökulhlaup from the ice cap Blåmannsisen in northern Norway occurred from 6 to 7 September 2001 (Fig. 1). Blåmannsisen is the fifth largest glacier in Norway, covering 87 km2. The water drained from the lake Øvre Messingmalmvatn (67˚20’N, 16˚05’E), which is located adjacent to and dammed by the 12 km long outlet glacier Rundvassbreen (Fig. 1). The water drained under Rundvassbreen and then to the Sisovatn reservoir, where the water level rose 2.4 m. Previously, the lake had drained steadily in the opposite direction, over the border into Sweden. Fortunately, there were no casualties or material damage from the jökulhlaup; on the contrary, it increased the volume of water in the reservoir that is used to supply a hydropower plant operated by Elkem Energi Siso AS, so the flood was financially beneficial. A preliminary description of the jökulhlaup is given by Reference EngesetEngeset (2002, Reference Engeset2003).
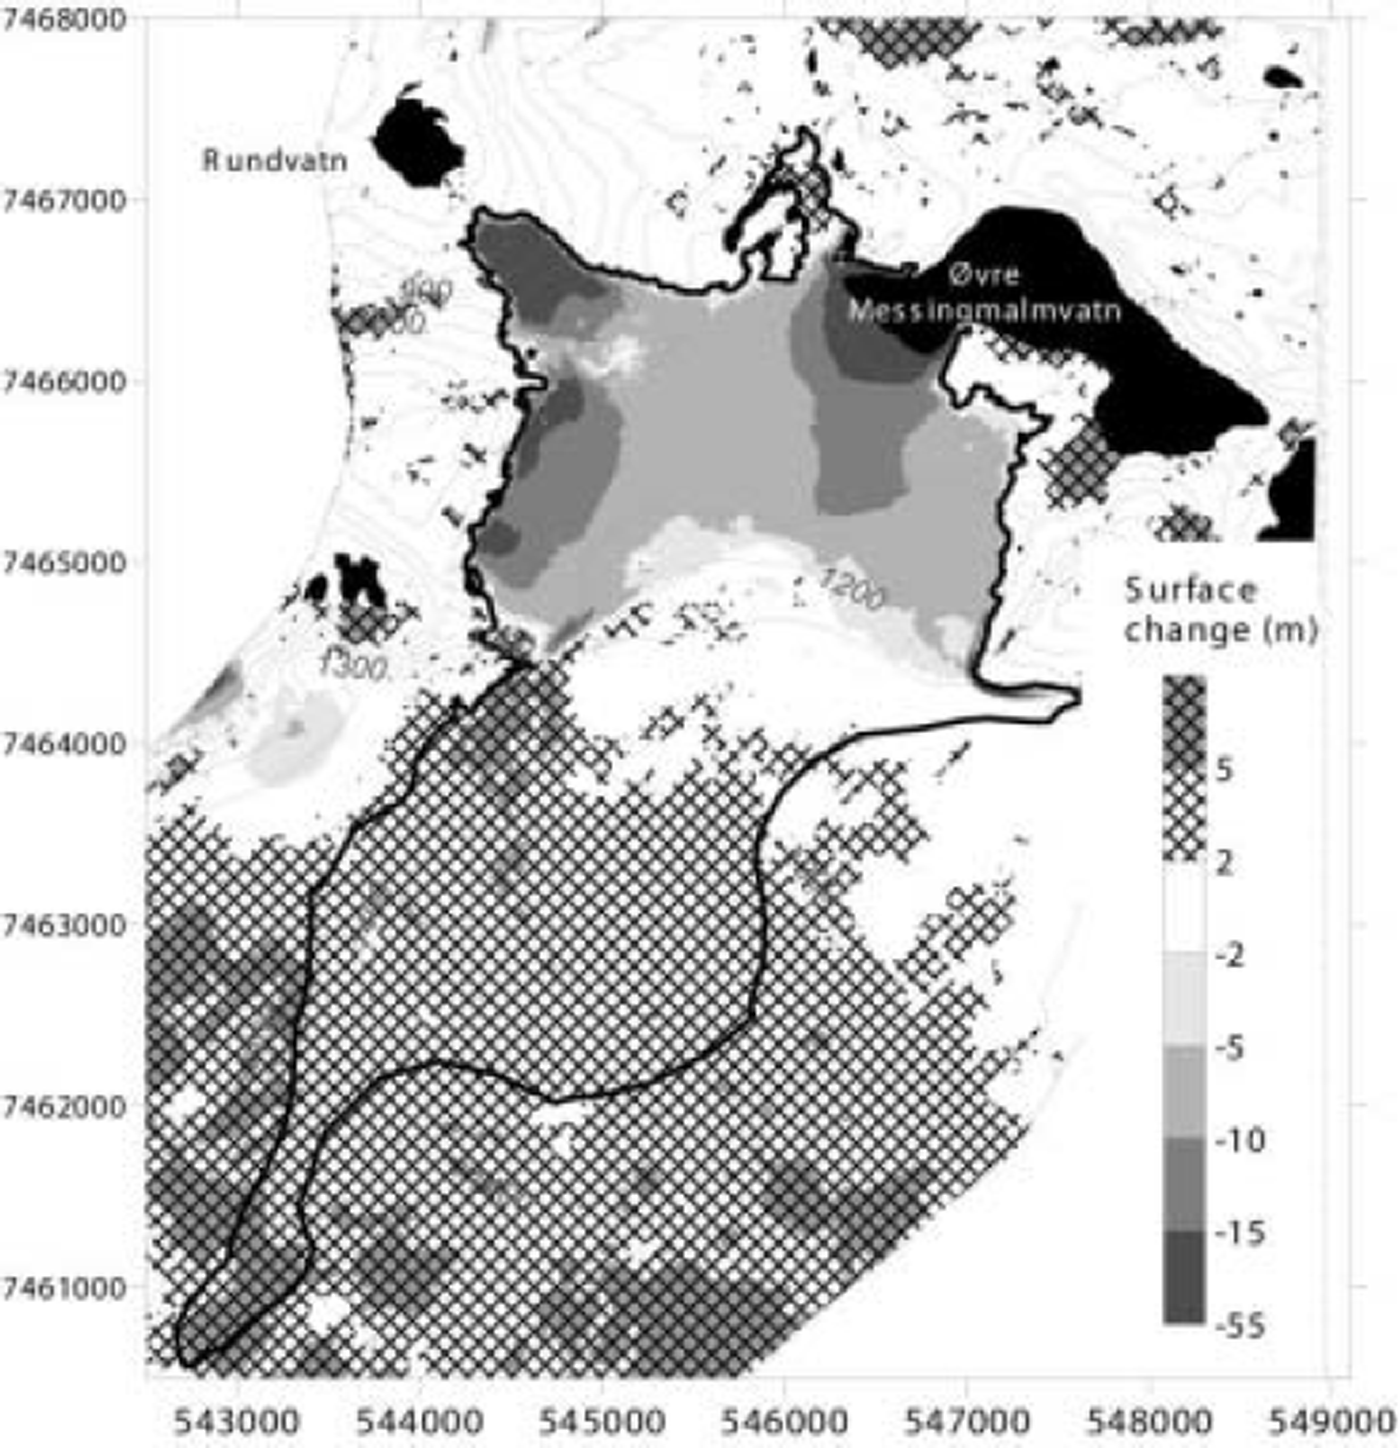
Map of study area. Numbers 1 and 2 show the drainage outlet at the glacier snout during the jökulhlaup and the drainage path before the jökulhlaup respectively.
Study outline
The unprecedented drainage of Øvre Messingmalmvatn poses a number of questions. Why did the ice dam fail although it had been stable before? What changes of the glacier or the lake might explain the sudden instability? Which drainage mechanism governed the flood? What is the likelihood of future jökulhlaups, how often might they be expected to occur and what are the expected water volumes? In this paper, we apply map comparison to reconstruct the glacier changes prior to the 2001 event and we use field measurements to assess the current evolution of the ice dam. Furthermore, we reconstruct the jökulhlaup hydrograph to obtain insight into the possible flood mechanism. Using a model we predict the evolution of glacier mass balance for different climate scenarios. Based on this analysis, we discuss the possibility of future jökulhlaups and their expected return frequency.
Data Collection
Glacier geometry and mass balance
Map comparison
Glacier geometry was observed several times. Topographic maps, aerial photographs and a study of glacier change in northern Norway (Reference Andreassen, Kjøllmoen, Knudsen, Whalley and FjellangerAndreassen and others, 2000) provide records of glacier front positions in 1910, 1961, 1985 and 1998. New maps of Rundvassbreen were constructed from aerial photographs from 27 August 1961 and 1 September 1998. The maps provide lake and glacier outlines, rivers and digital terrain models (DTMs) at 10 m by 10 m resolution for 1961 and 1998. Field observations of the position of the glacier front were made in 2001 and 2002 to map glacier and lake changes that occurred during the 3 years between the most recent map and the jökulhlaup.
Subglacial topography and drainage
The Norwegian Water Resources and Energy Directorate (NVE) used ice-penetrating radar (6–9 June 1990) and topographic maps (August 1985) to survey glacier depth and subglacial drainage boundaries (Reference KennettKennett, 1990). The radar measurements show that part of the glacier dams Øvre Messingmalmvatn. At the critical point between the lake and the glacier outlet, the surface elevation was 1108 ma.s.l., ice depth was 118 m and water potential was 10.78 MPa relative to sea level (Reference KennettKennett, 1990). This is 0.47 MPa higher than Øvre Messingmalmvatn. Reference KennettKennett (1990) suggested that a jökulhlaup could be expected at 0.2 MPa difference, which would require 30 m lowering of the glacier surface.
Changes in ice-dam thickness
The ice surface elevation in the ice-barrier area was observed using a geodimeter on 24 October 2001 (nine targets), and using the differential global positioning system (DGPS) on 18 September 2002 (7.8 km of surface profiles), 19 May 2003 (seven targets), 16 July 2003 (four targets) and 29 September 2003 (seven targets). Surface elevation, surface melt and stake elevation were measured at the network of six stakes established on 19 May 2003.
Mass balance
To help assess the possibility of new jökulhlaups, a mass-balance programme on Rundvassbreen began in 2001/02. Snow accumulation measurements were carried out on 22 May 2002, when a network of seven stakes was established. Calculation of winter balance is based on seven core samples (where the depth to the previous summer surface is measured), 125 snow-depth soundings along a 22 km profile. The snow density was measured at 1333 ma.s.l. The vertical density profile showed no significant correlation with depth, and thus a density of 510 kg m–3 was used to convert snow depth to water equivalent.
A network of seven ablation stakes was established on 16 July at 966, 1112, 1174, 1275, 1333, 1395 and 1525 ma.s.l. Ablation measurements were carried out on 18 and 19 September 2002 at all seven stakes. At this time, no winter snow was observed below 1275 m a.s.l. To convert stake readings into water equivalent, we used a value of 600 kg m–3 for the density of remaining snow and 900 kg m–3 for that of ice.
The calculated specific winter balance 2001/02 was 2.1 m w.e. (equal to a water volume of 2.5 × 10⁷m3), and the summer balance 2002 was -3.2 mw.e. ( 3 7 × 1 0 6m3 of water). The net balance 2001/02 was -1.1 mw.e., which equals a deficit of 12 × 106m3 of water. The equilibrium-line altitude was 1323 m a.s.l., and the accumulation-area ratio was 23%.
Outburst flood and the lakes
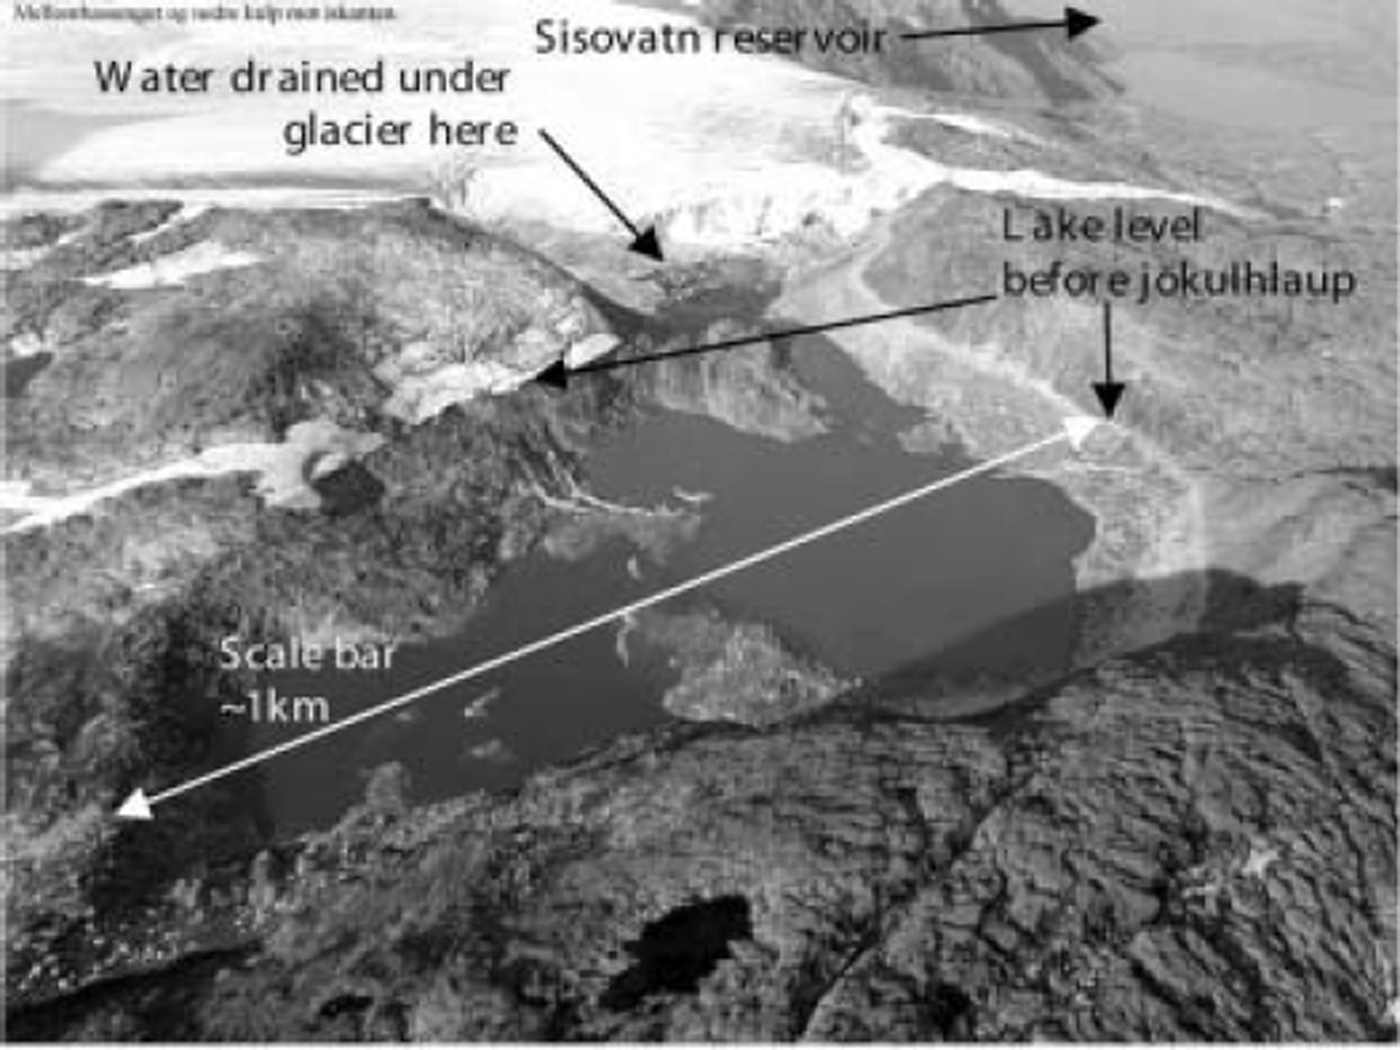
During the outburst, the water from the dammed lake Øvre Messingmalmvatn flowed underneath Rundvassbreen, into the small lake Rundvatn, and further down the valley to the hydropower reservoir Sisovatn (Fig. 1). The total distance from Øvre Messingmalmvatn to Sisovatn was 4.5 km, with a vertical difference of about 380 m. The water escaped presumably through a subglacial tunnel in the southern part of the calving front (Fig. 2), where the front was at its highest. The tunnel was probably about 2.3 km long and had a vertical fall of 180 m, from the bottom of the lake at about 1000ma.s.l. to its exit at the snout at about 820ma.s.l. Before the jökulhlaup, the water drained steadily over a rock threshold at 1053.4ma.s.l. eastwards into Sweden.
Photograph of Øvre Messingmalvatn and Rundvassbreen showing the emptied lake photographed 1week after the event. Photo by H.M. Hjemaas of Elkem Energi Siso AS.
The Sisovatn reservoir has an average water volume of 5.0 × 10⁸m3 and its water level is regulated between 615 and 671 m a.s.l. for electricity production. The water level in Sisovatn is observed automatically every 10 min. No precipitation was recorded at the meteorological station at Sisovatn over the 3 day period prior to and during the jökulhlaup, and the water discharge to the reservoir was fairly constant at about 1.5 × 10⁶ m3 d–1. Records of water level were converted into water volume using the water-level volume table for the reservoir. The water-level gauge is located near the intake tunnel to the generator tunnel, and some disturbances are produced when the generator is turned on and off. Taking hourly averages of the data eliminated most of the high-frequency noise component. A correction for the water used for energy production was applied in order to calculate the inflow to the Sisovatn reservoir.
The topography of the Øvre Messingmalmvatn basin was observed after the lake had drained. Water level was repeatedly surveyed using DGPS, a geodimeter and by observations from a helicopter. The extent and level of the water surface of the emptied lake were surveyed seven times as the lake refilled during the first 2years after the event. These data were used to calculate the lake bathymetry estimate the filling rate and to create a relationship between lake level and water volume. The bathymetry is derived by interpolating DGPS and geodimeter surveys of lake surface locations guided by photographs of the lake surface extent at different water levels.
Analysis and Results
The jökulhlaup reconstruction
Global positioning system (GPS) measurements show that the shoreline of the lake prior to the event was at 1053.4 m a.s.l., so the water level dropped 50 m during the jökulhlaup. Figure 3a shows the evolution of water storage in the Sisovatn reservoir from 5 to 10 September 2001. There is a remarkable increase in volume of approximately 4.0 × 10⁷ m3 from about noon on 6 September to the evening of 7 September 2001, all attributed to the jökulhlaup from Rundvassbreen. The weather was dry, and the steady background inflow to the dam of 1.5 × 10⁶ m3 d–1 is excluded.
(a) Inflow to the reservoir Sisovatn prior to and during the jökulhlaup; and (b) the reconstructed hydrograph.
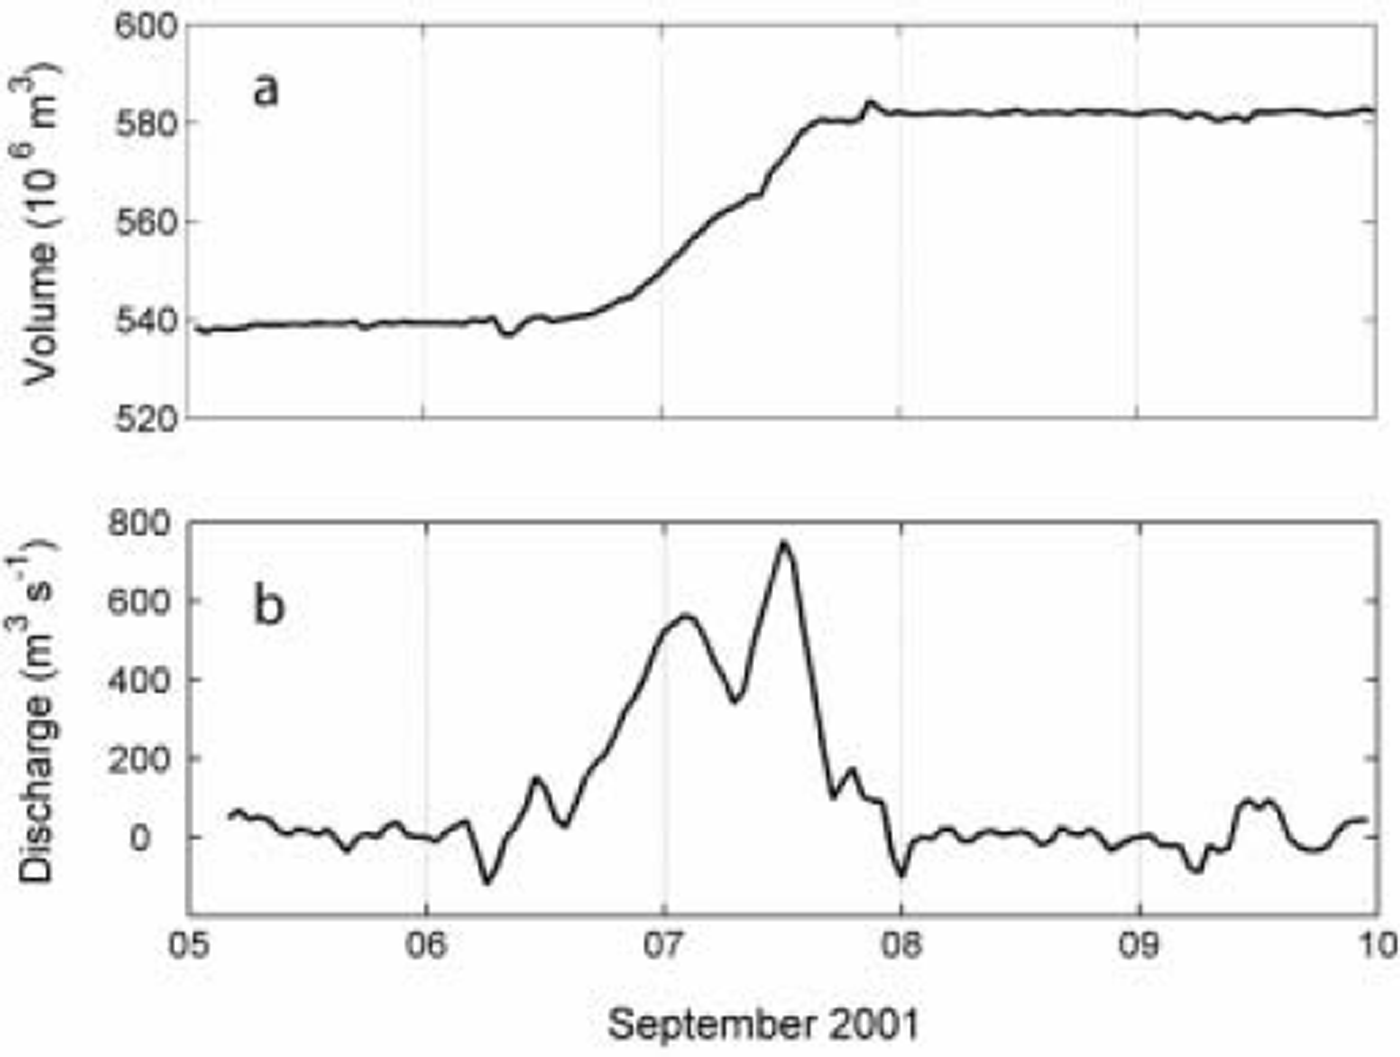
The volume data were differentiated with respect to time to derive a hydrograph of the jökulhlaup. Major characteristics of the hydrograph (Fig. 3b) show that the flood lasted ∼35 hours and reached a peak discharge of ∼800m3s–1. The hydrograph exhibits a moderate rise over the first ∼24 hours until peak discharge was reached, followed by a rapid decline. This suggests a channel-drainage mechanism for the flood. In this case, the lake would have drained through an ice-walled, subglacial channel, which was progressively enlarged by melting due to dissipation of energy with the water flow (e.g. Reference RothlisbergerRothlisberger, 1972; Reference NyeNye, 1976). As the lake drainage proceeded, water pressure in the channel would have dropped and creep closure of the viscous ice would have then dominated over melt enlargement. If the lake had not emptied at this stage, the rapid closure or even collapse of the channel could have terminated the flood.
Channel-drainage jökulhlaups are often associated with sub-flotation triggering (Reference NyeNye, 1976; Reference ClarkeClarke, 1982; Reference BjörnssonBjörnsson, 1992), whereas flotation triggering usually involves the flood propagating as a pressure wave through a distributed subglacial drainage system (Reference BjörnssonBjörnsson, 2002; Reference JóhannessonJόhannesson, 2002; Reference Flowers, Björnsson, Pálsson and ClarkeFlowers and others, 2004). In general, non-channel floods tend to have a significantly higher peak discharge (Reference Walder and CostaWalder and Costa, 1996) and are characterized by an abrupt onset and rapid decline (Reference HaeberliHaeberli, 1983).
For a channel-drainage jökulhlaup, peak discharge, Qmax, can be estimated from water volume V(in 106m3) (Reference Clague and MathewsClague and Mathews, 1973):
Using k=75 and b = 0.67 (Ng and Björnsson, Reference Ng and Björnsson2003), a value of 880 m3 s–1 is obtained, which corresponds well with the observations.
Bathymetry and filling of the lake
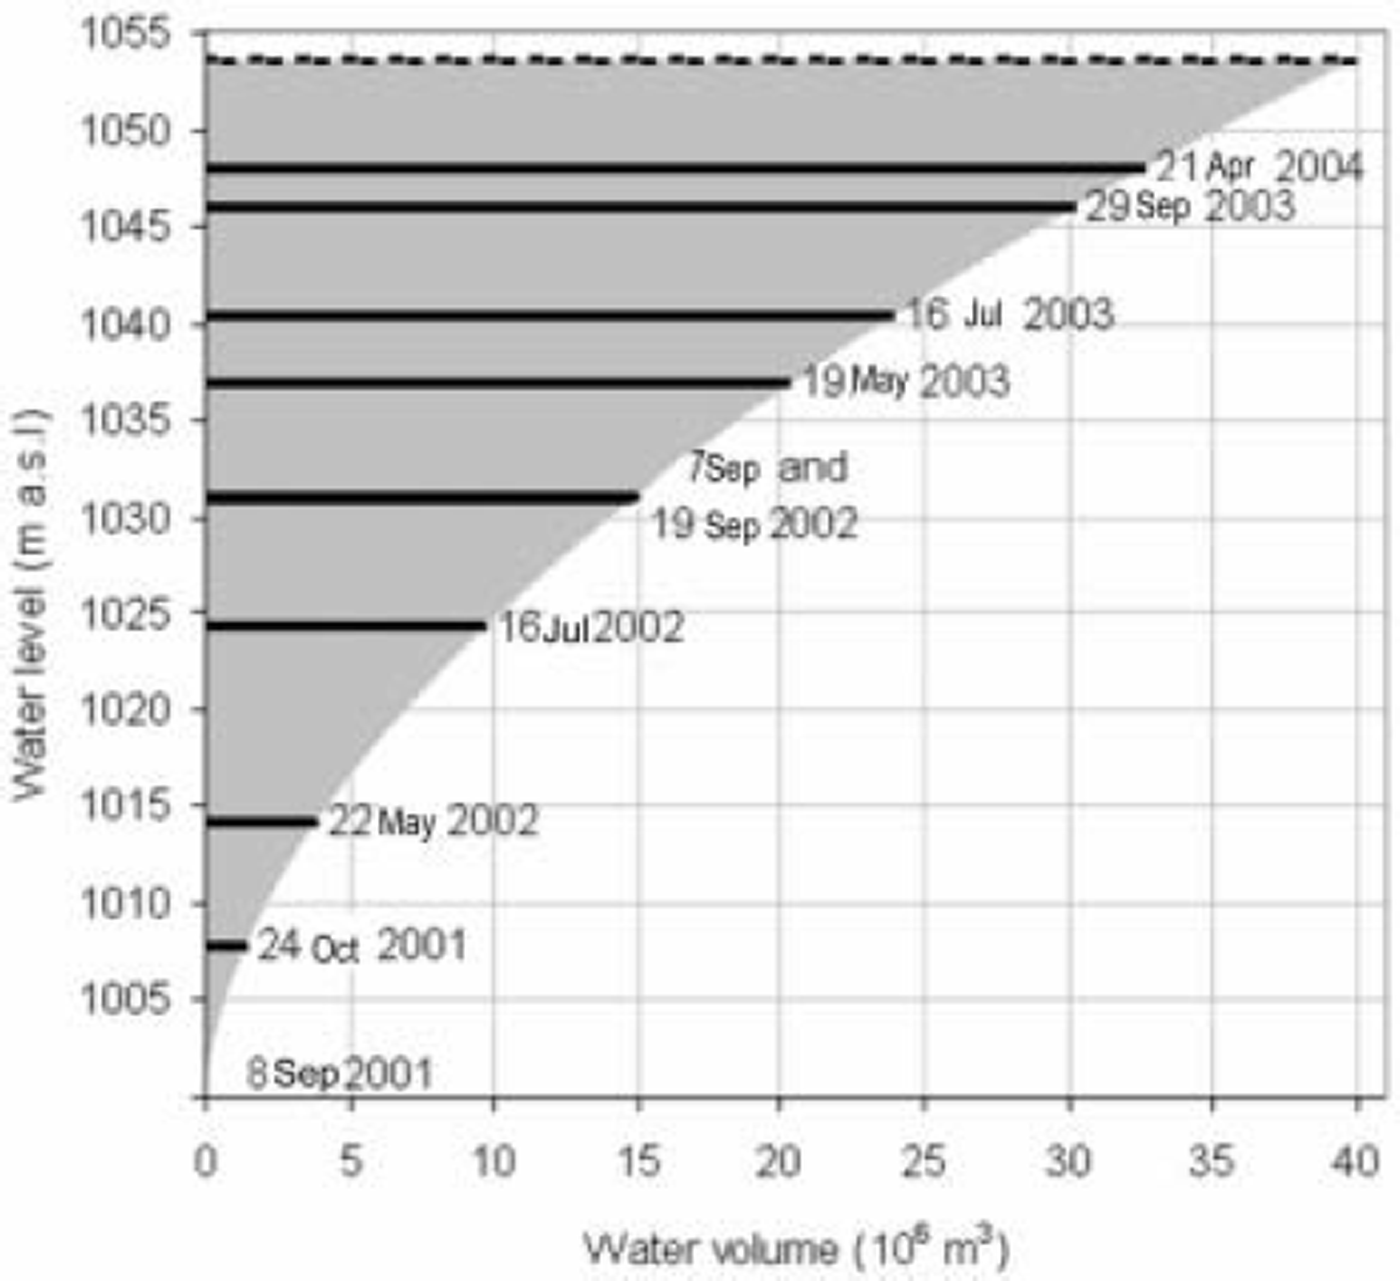
The filling of Øvre Messingmalmvatn after the jökulhlaup is shown in Figure 4. Engeset (Reference Engeset2002) suggested the filling of the lake may take about 3 years, based on the normal discharge values for the area and the size of the lake catchment. Observations show that the lake was filled to 38% of its former volume (1.50 × 10⁷m3 ) on 19 September 2002, 1 year after the event, and 75% full (3.01 × 1 0 7m3 ) on 29 September 2003, 2 years later. The last observation was made on 21 April 2004, when the lake was 82% full and the lake level was 5.5 m below the level prior to the jökulhlaup.
The relationship between the water level and water volume in the emptied lake Øvre Messingmalmvatn. Observations of the water level at nine different dates are shown on the graph. Dashed line shows the water level at 1053.4 m a.s.l. before the jökulhlaup.
Glacier area, elevation and volume change prior to the jökulhlaup
Area change
An analysis of maps and DGPS observations shows that Rundvassbreen decreased over the last century. The glacier flow divides in two directions, towards the northwest (where the snout terminates on land) and into Øvre Messingmalmvatn to the north (where the front calves into the lake). The land-based glacier snout had retreated about 1.0 km from the Little Ice Age maximum moraines by 1961, and another 200 m from 1961 to 1985. No significant snout retreat was observed from 1985 to the time of the jökulhlaup. During this period, the calving front into the lake retreated 130–300 m, which effectively increased the lake surface area by 0.1–1.26 km2. It retreated another 40 m from 1998 to 2001.
The drainage boundary of Rundvassbreen was identified from aerial photographs and the glacier drainage divides mapped by Kennett (Reference Kennett1990) using ice-thickness data. The analysis shows that the area of Rundvassbreen was reduced by >3%, from 12.0 km2 to 11.6 km2, between 1961 and 1998. The change in area occurred mainly below 1250 m a.s.l., which corresponds to the ablation area of the glacier.
Elevation change
DTMs of the glacier were constructed in 10m resolution from the 1961 and 1998 photographs, and used to calculate the thickness change (Fig. 5). An elevation increase is seen in the accumulation area above 1250m a.s.l. (an area of 5.6 km2), and a decrease in the ablation area (6.4 km2). The change varied from +38m at the top to –52m at the snout. The elevation of lake surfaces in the 1998 DTM is 0–1.5 m higher than in the 1961 DTM. This is within the expected accuracy of DTMs from aerial photographs, but may be caused by natural fluctuations in lake levels. Small areas outside the glacier show an elevation increase from 1961 to 1998. This is due to larger and thus thicker snowpatches at the time of the latter acquisition.
Map of surface elevation change, 1961–98. Glacier outline from the 1961 map and 50m contours from the 1998 map are superimposed.
Volume change
Based on the 1961 boundary, Rundvassbreen lost an ice volume of 3.16 × 10⁷m3 between 1961 and 1998. This is equivalent to a loss of 2.85 × 10⁷m3 of water, assuming an ice density of 900 kgm–3, and the same snow and firn density in 1961 and 1998. This gives a specific net balance of -2.4mw.e. during the 37years, and an annual average balance of -0.07 m w.e.
Change in ice-barrier and ice-dam stability prior to the jökulhlaup
Considering the glacier changes discussed above, we focus on the evolution of the part of Blåmannsisen that dammed Øvre Messingmalmvatn. From measurements of ice thickness and glacier surface elevation data, Kennett (Reference Kennett1990) deduced the existence of a hydraulic barrier that dams the lake. The hydraulic potential H (expressed in terms of hydraulic head) at the glacier bed of Blåmannsisen relative to mean sea level was calculated using
where ρ i and ρ w denote the densities of ice and water respectively, h is the local ice thickness and z is the elevation of the glacier bed (Reference ShreveShreve, 1972). In the topography of subglacial hydraulic potential, a water divide was detected which separates the two regions draining to the land-based glacier snout and to Øvre Messingmalmvatn, respectively (Reference KennettKennett, 1990). The minimum hydraulic potential on this water divide determines the stability of the ice dam. According to Reference KennettKennett (1990), the ice thickness at this point was 118 m and the surface elevation, based on the 1985 map, was 1108ma.s.l.
To investigate whether thinning of the ice dam after the 1990 survey has enabled the drainage of the lake, a stake network across the ice dam was established in 2001 and surveyed repeatedly using DGPS. The observations were compared with previous data and show that between 1961 and 2001 the glacier surface in the ice-dam region had lowered by 15-26m. The apparent rise of the ice dam between 1985 and 1998 might be an artefact since the 1985 map was constructed from data at coarser spatial resolution than the other maps and is therefore less accurate. This inaccuracy may affect the Reference KennettKennett (1990) estimate of surface elevation and the hydraulic potential at the seal.
This implies the following conditions at the seal at the onset of the jökulhlaup: glacier surface at 1108.5 m a.s.l., ice thickness of 110.5 m and hydraulic potential of 1097.5 m. In comparison, the hydraulic potential of the lake was 1053.4 m, which is about 44 m below the level required to float the ice dam. However, from other locations, it has been reported that jökulhlaups were initiated at lake levels up to 60 m below the flotation level (Reference BjörnssonBjörnsson, 1992, Reference Björnsson2002).
The observed 3.5 m thinning of the ice dam between 2001 and 2003 suggests that another jökulhlaup may now be triggered at a water level ∼3 m lower than that in 2001, thereby releasing a water volume of about 3.5 × 10⁷ m3.
Scenarios of glacier change and future jökulhlaups
The 2001 event was the first jökulhlaup recorded from Øvre Messingmalmvatn. We have shown that the thickness and thus static bottom pressure of the ice dam continued to decrease after September 2001. In order to assess if it is reasonable to project this trend into the future, glacier scenarios for Rundvassbreen are calculated based on climate scenarios for the area.
Glacier mass balance is simulated using the MBT model (Reference Jóhannesson, Laumann and KennettJόhannesson and others, 1993), which is a precipitation/ degree-day model. The model has been used for mass-balance modelling and climate sensitivity studies in the past (Reference BraithwaiteBraithwaite, 1984; Reference ReehReeh, 1991; Reference Laumann and ReehLaumann and Reeh, 1993).
Precipitation data from Glomfjord and Bodø, and temperature data from Kråkmo are used as model inputs. These stations are located in the region, and have long time series and downscaled climate scenarios (Reference Hanssen-Bauer, Tveito and FørlandHanssen-Bauer and others, 2000, Reference Hanssen-Bauer, Tveito and Førland2001). The climate scenarios are empirically downscaled from the GSDIO scenario from the Max Planck Institute’s coupled ocean-atmosphere climate model EC-HAM4/OPYC3. The scenarios for the study area suggest an average increase in temperature of about 0.4˚C per decade and an in precipitation of 2.7% per decade between the control (1961-90) and scenario (2021-50) periods. Model calibration is described in Reference EngesetEngeset (2002). Calibration is carried out using observed mass balance for two periods in 2002 (22 May−16 July; 22 May−18 September), observed winter balance 2001/02 and snow water equivalent measurements carried out by Elkem Energi Siso AS at 980 m a.s.l. and 3.5 km north of the glacier.
The model is used to simulate the mass balance from 1957. The modelled specific balance for the period 1961-98 accumulates to -2.9mw.e., whereas the volume-change calculation based on maps from 1961 to 1998 yields -2.4mw.e. The difference between the results from modelled and map-derived volume change is as low as 0.01 mw.e. a-1 . This is one magnitude smaller than the uncertainty of the mass-balance observations and two magnitudes smaller than the map analysis.
The climate scenarios are used to establish corresponding scenarios for glacier mass balance. Model simulation and map analysis suggest that the glacier was nearly in balance between 1961 and 1998 (average annual balance of - 0 . 1m w.e.). The glacier response to climate change is simulated using four scenarios selected in order to show the average departures from the control period (scenarios 1 and 2) and worst/best-case scenarios. Scenario 3 uses scenarios for summer temperature (one standard deviation below the seasonal mean) and winter precipitation (one standard deviation above the seasonal mean), which reduces the probability of another jökulhlaup. Scenario 4 represents the opposite situation. The scenarios are described in Table 1.
Scenarios for temperature and precipitation (precipitation change per degree temperature change in brackets). Mass balance is simulated using four climate scenarios based on Reference Hanssen-Bauer, Tveito and FørlandHanssen-Bauer and others (2000, Reference Hanssen-Bauer, Tveito and Førland2001)
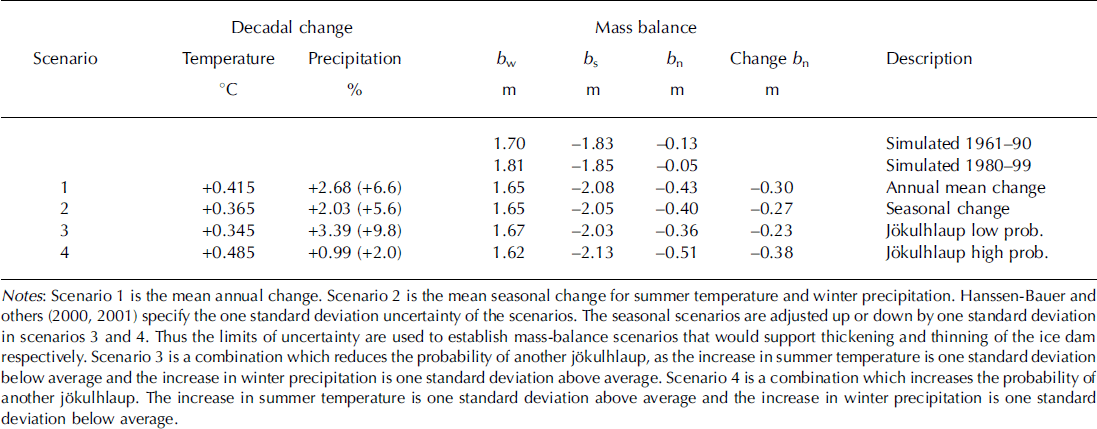
The results suggest the sensitivity of the Rundvassbreen mass balance to climate change is about -0.7 m w.e. K–1. Scenario 1 lowers a weak negative net balance from -0.1 to -0.4 m w.e., which suggests the glacier may lose 1.4 m w.e. (∼1.6 ×10⁷m3 ) during the next decade. Summer ablation increases (by 11-16%) and winter accumulation decreases (by 2-5%) in all four scenarios. Thus, all scenarios suggest negative net balances (−0.2 to - 0 .4 m w.e.; Table 1). Unless dynamic effects counteract the effects of increased ablation, the results indicate that the ice barrier will continue to thin. Consequently, another jökulhlaup is probable. Future events may be triggered at lower water levels and produce lower volumes of water than the 2001 event.
Conclusions
The first known jökulhlaup from the ice-dammed lake Øvre Messingmalmvatn occurred in September 2001, releasing ∼4.0 × 10⁷ m3 of water. The lake emptied in about 35 hours, starting at noon on 6 September 2001. Rundvassbreen, an outlet glacier from Blamannsisen, dammed the lake that used to drain via a superficial spillway towards the east, on its western shore. The retreat of Rundvassbreen since 1961, revealed by map comparison, and results from mass-balance modelling indicate that the glacier decreased in volume. This is supported by the observed decrease of ice thickness in the ablation zone. The rate of thinning has increased since 1998 and presumably affected the stability of the ice dam so that the water impounded in the lake can now break the seal at the glacier bed and drain underneath the glacier. In September 2001, the lake water level was about 40 m below that required to float the ice dam. In line with the subflotation triggering, the asymmetrical shape of the flood hydrograph suggests that drainage occurred through a subglacial channel, the size of which was progressively enlarged by melting due to the dissipation of energy with the flowing water.
A glacier mass-balance model is calibrated for Rundvassbreen. Downscaled climate scenarios for the area are applied to the model in order to assess glacier changes in the future and their consequences for jökulhlaups. The model suggests an annual glacier mass balance of -0.1 m w.e. on average between 1961 and 1998. However, the glacier grew steeper by thickening in the upper parts and thinning in the lower parts. The modelled scenarios suggest that the glacier will experience an annual mass deficit of about 0.5 m w.e. on average during the next 50years. The ice barrier has thinned 3.5 m since the 2001 jökulhlaup. The mass-balance scenarios suggest ice thinning will continue. The lake was 82% full 2.5 years after the jökulhlaup and will probably be filled about 3years after the event. This suggests a likely jökulhlaup repeat frequency of about 3 years. The continued thinning of the ice dam is likely to enable jökulhlaup initiation at lower lake levels, thereby releasing smaller water volumes.
Acknowledgements
The measurements were kindly supported financially and logistically by Elkem Energi Siso AS. H.M. Hjemaas provided the photographs used in this study, and also valuable assistance with the fieldwork. The analysis is supported by the European Union project Glaciorisk EGV1-2000-00512 and NVE. T.V. Schuler gratefully acknowledges a research grant provided by the Deutsche Forschungsgemeinschaft. I. Hanssen-Bauer kindly provided the climate-change scenarios. The authors thank M. Nolan and M. Roberts for thorough reviews, and the scientific editor I. Willis for the efficient handling of and constructive comments on the manuscript.


