

Introduction
Glaciological investigations were carried out in the field seasons 1984 and 1985 at eight sites in an area of central Greenland. The sites are named Site A through H and their locations are shown in Figure 1, and listed in Table I together with other Greenland locations, which are shown for comparison. The field work was done in co-operation with Swiss and American colleagues as a post-Greenland Ice Sheet Program (GISP) operation. The main objective was to help to select a suitable location in this region for future deep drilling to bedrock. Three men with three skidoos and Nansen sledges moved the ice-core drill from one location to another. Ice cores were drilled to various shallow depths at the sites, with a maximum depth of 128 m at Site A. To erect a camp, drill an ice core to some 100 m (as at Sites A, B, D, E and G) and strike camp, took less than 2 d. At Sites C, F and H, ice cores were drilled to some 25 m depth. The lengths of the ice cores are listed in Table I. Navigation during the traverses was by satellite positioning, and dead reckoning on flagged positions. In all, 11 d were needed in each season to complete the work. All ice cores were packed in insulated boxes and eventually brought frozen to Copenhagen for further investigation.
Site location map (A through H) of central Greenland in the vicinity of Crête (CR). Units of vertical and horizontal axes are degrees North and degrees East respectively. The crosses in the west-east direction around 71°N show the EGIG sites in this region. The numbers on the surface-contour lines show the elevation in m a.s.l.

Greenland Site Characteristics.

Geographical Position and Elevation
Each site was marked with a 6 m glass-fiber pole. The geographic positions of the poles were determined by satellite positioning (see Table I). Remeasurements of their positions will allow us to determine the surface velocity in this region. The sparse surface-velocity data from this area (Reference HofmannHofmann 1986) suggest a northward velocity, which is in doubt, however, because the surface slopes towards south. The contour lines in Figure 1 were compiled from satellite data (Reference Zwally, Bindschadler, Brenner, Martin and ThomasZwally and others 1983) and EGIG data (Reference MälzerMälzer 1964, Reference SeckelSeckel 1977). These data have been adjusted to the elevations measured by the “geoceiver”. The resulting contour map is believed to be correct within a few meters (Reference Gundestrup, Bindschadler and ZwallyGundestrup and others 1986). The “geoceiver heights”, relative to the WGS-72 ellipsoid, were reduced by the geoid height in this region to give the height in meters above sea-level (Reference RappRapp 1978).
Density and Temperature Profiles
Density of the ice cores was measured in the field immediately after core recovery, and temperature in the bore holes was measured after drilling. Figure 2 shows the measured density profiles for two Greenland sites, Site B in central Greenland and Site 4B (close to Dye 3) in south Greenland (solid and dotted curves respectively). The 4B profile exhibits a faster densification process with depth, due to the higher mean annual temperature (-20 °C) (Reference JohnsenJohnsen 1977[a]), and thus a higher degree of summer melting at this site, compared to that at Site 4B (-29.5 °C). The local peak at a depth of 17 m at Site B is associated with a layer of refrozen melt water. The two curves to the left (air) show the amount of air in the firn in terms of meters of air equivalent versus depth. At a depth of 100 m, 21 and 24 m of air are present in the firn at Site 4B and Site B respectively. The profiles from the other sites in the central Greenland region are similar to that from Site B, and those from the Dye 3 region are similar to that from Site 4B.
The solid curve to the right shows the measured density (in kg/m3, scale at the bottom) profile of the ice from Site B in central Greenland. The dotted curve to the right shows, for comparison, the measured density profile from Site 4B in the vicinity of Dye 3, south-east Greenland. The solid curve to the left shows the amount of air in the firn (in meters of air equivalent, scale at the top) versus depth. The dotted curve to the left shows, for comparison, the amount of air in the firn at Site 4B.

Figure 3 shows two detailed temperature profiles, measured in the bore holes at two locations. Site A and North Central (see Table I). The profiles are plotted by connecting the measured points with straight lines. The strong temperature gradient at the top of the profiles, around 10 m depth, reflects the previous autumn. Furthermore, both profiles exhibit the previous summer and the preceding winter as a local maximum and minimum in the upper part of the profiles. The absolute maxima in both records, at around depths of about 35 m, reflect the relatively high temperatures at the surface in the 1930s. The trend in the lower part of both curves is towards a minimum caused by the low surface temperatures during the “Little Ice Age”, which culminated around A.D. 1650 (Reference JohnsenJohnsen 1977[b], Reference Dahl-Jensen and JohnsenDahl-Jensen and Johnsen 1986). The measured 10 and 20 m temperatures are listed in Table I.
Measured temperature profiles from Site A and North Central (see Table I).

The 20 m temperature is a better representative of the annual mean temperature than is the 10 m temperature, which is affected by the surface annual temperature cycle.
δ18O and Rates of Accumulation
Continuous δ18O measurements were performed on all ice cores, with about eight samples per calculated year. All records display clearly the seasonal variations in δ18O except for Site E, where many of the seasonal oscillations are obliterated due to the low accumulation rate. Continuous acidity measurements by the electrical conductivity method (ECM) (Reference Hammer, Clausen and DansgaardHammer 1980) were made on all the cores. These acidity profiles exhibit seasonal variations too. Ice strata which contain strong acids, e.g. H2SO4, from known major volcanic eruptions in the Northern Hemisphere, show distinct peaks in the acidity profile. Comparison of the δ18O and acidity profiles from the individual sites, and comparison between the sites, provide an absolute chronology.
Distinct stratigraphic volcanic markers represent Hekla (A.D. 1947), Katmai (A.D. 1912), Tambora (A.D. 1815) and Laki (A.D. 1783). Furthermore, a distinct melt feature in the A.D. 1889 annual layer is seen clearly in all the ice cores. This melt layer is the most pronounced one in the last 700 years represented in ice cores from the North Central location. The reference horizons are shown as horizontal bars both on the vertical time-scale and on the curves in Figure 5.
The absolute dating of the ice cores allows us to calculate the accumulation rate and mean δ18O year by year. Table I lists the age of the oldest layer in each of the ice cores, and the mean annual accumulation in meters of ice equivalent per year. The mean accumulation rates are calculated for the period 1943-73 (except for North Site), because this period is represented in all the other Greenland cores included in Table I. δ18O and accumulation records (λ.) shown in Figures 4 and 5 were smoothed by a 30 year Gaussian filter, which reduces the amplitude of 30 year cycles by 50%. This filter was preferred to low-pass or running-mean filters, because the low-pass filter tends to create oscillations near the cut-off frequency, and the running-mean filter has difficulty attenuating higher frequencies. The half-width of the Gaussian filter was 150 points long, and the data were extended at both ends with a maximum entropy method prediction filter 100 points long (Reference AndersenAndersen 1974). The salient feature of the δ18O records in Figure 4 is the maximum in the 1930s, when temperatures at Greenland coastal stations reached a maximum.
δ18O profiles (in per mille), smoothed by a 30 year Gaussian filter on an absolute time-scale (in years A.D.).

The λ records in Figure 5 exhibit an accumulation maximum around 1940. There is no straightforward explanation of the large variations in the λ record for the time interval 1820-80 at Site E. This can hardly be due to incorrect dating, because the time-scale is fixed at three depths by the strong acid signals originating from the volcanic eruptions of Laki and Tambora and by the distinct melt feature in 1889. In any case, future deep drilling should not be considered in the area north-east of Crête because of the anomalies found in the Site E record (see below).
Annual accumulation rates (in millimeters of ice equivalent per year), smoothed by a 30 year Gaussian filter, on an absolute time-scale (in years A.D). The horizontal bars on the vertical time-scale are fixed points, determined by high-acidity layers, originating from major volcanic eruptions, such as Hekla 1947, Katmai 1912, Tambora 1815, Laki 1783, Unknown 1601 (Hammer and others 1980), and a melt layer 1889.

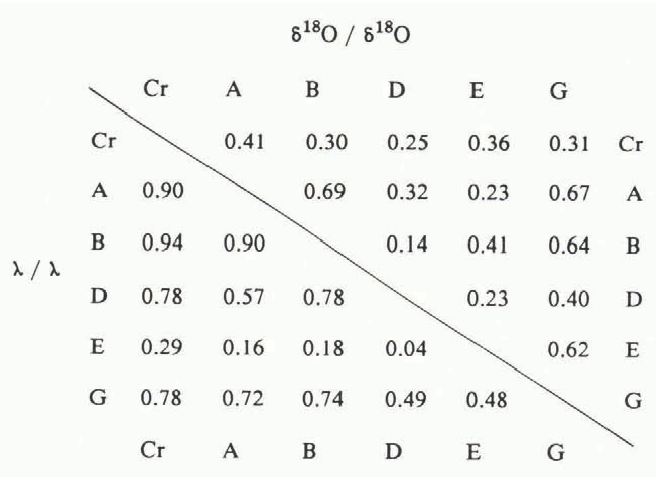
Correlation Coefficients of δ18O and λ Records.
Correlation Coefficients Between λ and δ18O Records.
General Slope of δ18O and λ Records.
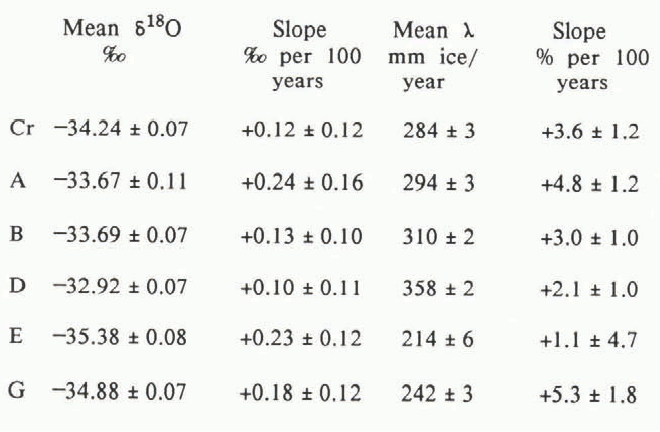
Table II gives the correlation coefficients between the filtered δ18O records (upper right) and between the filtered λ records (lower left). The correlation coefficients between the λ series are in the range 0.49 to 0.94 and are highly significant (at the 0.05% level), except for those including Site E, which only correlates significantly with the neighbouring Site G. We conclude from the λ correlations that, for periods longer than 30 years, climatic variations are only slightly affected by depositional noise.
The correlation coefficients between the δ18O series are not as high as those between the λ series. The values vary between 0.69 and 0.14, and only values higher than 0.32 are significantly different from zero (at the 5% level). It is evident that for central Greenland δ18O series, the climatic signal even when filtered with a 30 year filter is partly obscured by depositional noise (Reference Fisher, Reeh and ClausenFisher and others 1985). Also, this is in accordance with the conclusion reached by Reference Dansgaard, Johnsen, Reeh, Gundestrup, Clausen and HammerDansgaard and others (1975) that the 1420 year long Crête δ18O record only correlates well with climatic variations for wavelengths of 60 years and longer. Unfortunately most of our series are too short for investigating 60 year average series.
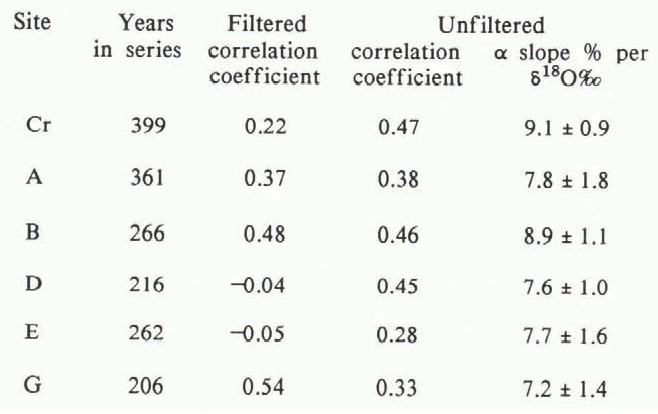
Table III shows the correlation coefficients between the λ and δ18O records, based on the 30 year Gaussian filtered and the unfiltered data. The relative slope α of the λ versus δ18O regression line is based on the unfiltered data.
The λ / δ18O correlation coefficients of the filtered data are significantly different from zero (at the 5% level or better) for Site A, Site B and Site G. The linear regression performed on the unfiltered pairs of λ and δ18O series gives most interesting results in spite of the great amount of noise present in the series. The correlation coefficients are highly significant for all sites, even for Site D and Site E, which gave negative correlation coefficients for the filtered series.
The relative slopes α of the regression lines are all in the range 7-9% accumulation change per ‰ δ18O change. First, we expect to find a dependency of the annual accumulation on the mean annual δ18O value, because higher δ18O values should originate from clouds with a higher mixing ratio of water vapour, which results in a higher rate of accumulation and vice versa. Secondly, the relative slope in Table III is close to the slope predicted by the precipitation model of Johnsen and others (in press). If we assume this relative slope of 8% per ‰ δ18O to be valid during glacial conditions, the accumulation rate in the coldest part of the last glaciation in Greenland must have been only 50% of present-day values.
Based on the 30 year Gaussian filtered data, Table IV shows the general slope of the δ18O and λ records for the period 1973-1778.
All λ records show a generally increasing trend over the last 200 years. For the last 40 years the decreasing trend of the λ records is the opposite of that found by Reference Bradley, Diaz, Eischeid, Jones, Kelly and GoodessBradley and others (1987) for Northern Hemisphere, mid-latitude land stations.
Accumulation rates and δ18O values decrease towards the east on the western slope of the central Greenland ice cap. Judging from the δ18O and λ values given in Table IV, this trend continues as we pass the ice divide at Crête. Using the general trend of δ18O versus latitude and altitude of snow deposits in Greenland (Reeh and others, in preparation), Site A is 0.3‰ too low in δ18O and Site E is 1.4‰ too low, relative to the δ18O values at Crête and sites D and B. This strongly suggests that the stations east of the ice divide in central Greenland are located in an accumulation shadow area, which becomes even more pronounced at higher latitudes.
The distribution of the 10 m temperatures in this area, however, seems to be in accordance with the expected trends of ≈1 °C per 100 m elevation and ≈1 °C per degree latitude (Reference BensonBenson 1962, Reference Mock and WeeksMock and Weeks 1966).
Figure 6 shows a map of the investigated area provided with isohyets. The basis for these curves is the accumulation data of this study and those reported by Reference BensonBenson (1962).
The broken lines give the areal distribution of accumulation rates (in millimeters of ice equivalent per year) in central Greenland, around Crête, and the solid lines are elevation contours from Figure 1. The isohyets show a clear decreasing trend in the SW-NE direction, from 365 mm of ice per year at Site D to 225 mm of ice per year at Site E.

Conclusion
The purpose of deep drilling in polar ice sheets has been described and documented in the science plans submitted to funding agencies of the nation involved (e.g. GISP Science Plan 1976). To obtain the best temporal information from polar ice cores (in the range 0.1–105 years) the drill site must fulfil several requirements:
-
(i) Sufficient rate of annual accumulation to ensure:
-
I. a uniform distribution of precipitation during the year,
-
II. survival of seasonal variations in stable isotopes (δ18O and δD) during the densification process in the firn,
-
III. bottom temperature below pressure melting.
-
-
(ii) Low surface temperature to ensure:
-
I. a low bedrock temperature with no melting,
-
II. no melting at the surface, to prevent redistribution of soluble matter and gases and absorption of CO2 from the air.
-
-
(iii) Location close to an ice divide to ensure:
-
I. a longer undisturbed record,
-
II. less up-stream correction for the ice-core data.
-
-
(iv) A relatively flat sub-surface to ensure:
-
I. a more easily understood flow pattern,
-
II. less disturbance of the deepest and oldest layers.
-
In Greenland all these requirements seem to be met best in the central Greenland area between Site B and Summit (see Table I), with preference given to the region north of Crête, due to the lower rate of accumulation and lower surface velocity. The existing bedrock topography close to Crête (Reference GudmandsenGudmandsen 1973 and Reference Gudmandsen1975) indicates a relatively flat sub-surface. We strongly recommend the area between Crête and Summit, on the western slope up to some ice thicknesses from the ice divide, for the next Greenland deep drilling, which hopefully will be initiated soon.
Acknowledgements
Special thanks to Heinrich Rufli and Willi Bernhard, who participated in the traverses. Thanks are also due to the Commission for Scientific Research in Greenland, the European Economic Community (contract CLI-067 DK(G)) and the U.S. National Science Foundation, Division of Polar Programs, for logistic support.


